1 fundamental optical properties of materials...
TRANSCRIPT
1 Fundamental Optical Propertiesof Materials I
W.C. Tan1, K. Koughia1, J. Singh2, and S.O. Kasap1
1Department of Electrical Engineering, University of Saskatchewan, Saskatoon, Canada2Faculty of Technology, Charles Darwin University, Darwin, NT 0909, Australia
1.1 Introduction 11.2 Optical Constants 2
1.2.1 Refractive index and extinction coefficient 21.2.2 n and K, and Kramers–Kronig relations 5
1.3 Refractive Index and Dispersion 61.3.1 Cauchy dispersion relation 71.3.2 Sellmeier dispersion equation 71.3.3 Refractive index of semiconductors 101.3.4 Gladstone–Dale formula and oxide glasses 121.3.5 Wemple–DiDomenico dispersion relation 121.3.6 Group index 14
1.4 The Swanepel Technique: Measurement of n and a 141.4.1 Uniform-thickness films 141.4.2 Thin films with nonuniform thickness 19
1.5 Conclusions 23References 23
1.1 INTRODUCTION
Optical properties of a material change or affect the characteristics of light passing throughit by modifying its propagation vector or intensity. Two of the most important optical prop-erties are the refractive index n and the extinction coefficient K, which are generically calledoptical constants; though some authors include other optical coefficients within this termi-nology. The latter is related to the attenuation or absorption coefficient a. In this chapterwe present the complex refractive index, the frequency or wavelength dependence of n andK, so-called dispersion relations, how n and K are interrelated, and how n and K can bedetermined by studying the transmission as a function of wavelength through a thin film ofthe material. Physical insights into n and K are provided in Chapter 2.
Optical Properties of Condensed Matter and Applications Edited by J. Singh© 2006 John Wiley & Sons, Ltd
COPYRIG
HTED M
ATERIAL
The optical properties of various materials, with n and K being the most important, areavailable in the literature in one form or another, either published in journals, books andhandbooks or posted on websites of various researchers, organizations (e.g., NIST) or com-panies (e.g., Schott Glass). Nonetheless, the reader is referred to the works of Wolfe [1.1],Klocek [1.2], Palik [1.3, 1.4], Ward [1.5], Efimov [1.6], Palik and Ghosh [1.7], Nikogosyan[1.8], and Weaver and Frederikse [1.9] for the optical properties of a wide range of mate-rials. Adachi’s books on the optical constants of semiconductors are highly recommended[1.10–1.12] along with Madelung’s third edition of ‘Semiconductors: Data Handbook’[1.13]. There are, of course, other books and handbooks that also contain optical constantsin various chapters; see, for example, references [1.14–1.17].
There are available a number of experimental techniques for measuring n and K, someof which have been summarized by Simmons and Potter [1.18]. For example, ellipsome-tery measures changes in the polarization of light incident on a sample to sensitively char-acterize surfaces and thin films. The interaction of incident polarized light with the samplecauses a polarization change in the light, which may then be measured by analysing thelight reflected from the sample. Recently, Collins has provided an extensive in-depth reviewof ellipsometery for optical measurements [1.19]. One of the most popular and convenientoptical measurements involves passing a monochromatic light through a thin sample, andmeasuring the transmitted intensity as a function of wavelength, T(l), using a simple spec-trophotometer. For thin samples on a thick transparent substrate, the transmission spectrumshows oscillations in T(l) with the wavelength due to interferences within the thin film.Swanepoel’s technique uses the T(l) measurement to determine n and K, as described inSection 1.4.
1.2 OPTICAL CONSTANTS
One of the most important optical constants of a material is its refractive index, which ingeneral depends on the wavelength of the electromagnetic wave, through a relationshipcalled dispersion. In materials where an electromagnetic wave can lose its energy duringits propagation, the refractive index becomes complex. The real part is usually the refrac-tive index, n, and the imaginary part is called the extinction coefficient, K. In this section,the refractive index and extinction coefficient will be presented in detail along with somecommon dispersion relations. A more practical and a semiquantitative approach is takenalong the lines in [1.18, 1.20, 1.21] rather than a full dedication to rigour and mathematicalderivations. More analytical approaches can be found in other texts, e.g. [1.22].
1.2.1 Refractive index and extinction coefficient
The refractive index of an optical or dielectric medium, n, is the ratio of the velocity of lightc in vacuum to its velocity v in the medium; n = c/v. Using this and Maxwell’s equations,one obtains the well known Maxwell’s formula for the refractive index of a substance as
, where er is the static dielectric constant or relative permittivity and mr the
relative permeability. As mr = 1 for nonmagnetic substances, one gets , which isvery useful in relating the dielectric properties to optical properties of materials at any par-ticular frequency of interest. As er depends on the wavelength of light, the refractive index
n r= en r r= e m
2 OPTICAL PROPERTIES OF CONDENSED MATTER AND APPLICATIONS
also depends on the wavelength of light, and this dependence is called dispersion. In addi-tion to dispersion, an electromagnetic wave propagating through a lossy medium expe-riences attenuation, which means it loses its energy, due to various loss mechanisms suchas the generation of phonons (lattice waves), photogeneration, free carrier absorption, scat-tering, etc. In such materials, the refractive index becomes a complex function of the fre-quency of the light wave. The complex refractive index, denoted by n*, with real part n,and imaginary part K, called the extinction coefficient, is related to the complex relativepermittivity, er = e ′r − jer″, by:
(1.1a)
where e′r and er″ are, respectively, the real and imaginary parts of er. Equation (1.1b) gives:
(1.1b)
In explicit terms, n and K can be obtained as:
(1.2a)
(1.2b)
The optical constants n and K can be determined by measuring the reflectance from thesurface of a material as a function of polarization and the angle of incidence. For normalincidence, the reflection coefficient, r, is obtained as
(1.3)
The reflectance R is then defined by:
(1.4)
Notice that whenever K is large, for example over a range of wavelengths, the absorp-tion is strong, and the reflectance is almost unity. The light is then reflected, and any lightin the medium is highly attenuated. (Typical sample calculations and applications may befound in ref. [1.20].)
Optical properties of materials are typically presented by showing the frequency depen-dences (dispersion relations) of either n and K or e′r and er″. An intuitive guide to explain-ing dispersion in insulators is based on a single-oscillator model in which the electric fieldin the light induces forced dipole oscillations in the material (displaces the electron shellsto oscillate about the positive nucleus) with a single resonant frequency wo. The frequencydependences of e′r and er″ are then obtained as:
(1.5)′ = + ′ ′′= + ′′εε
α εε
αro
e ro
eN N
1 1at atand
R rn jK
n jK
n K
n K= = − +
+ −= −( ) +
+( ) +2
2 2 2
2 2
1
1
1
1
rn
n
n jK
n jK= −
+= − +
+ −1
1
1
1
*
*
K r r r= ( ) ′ + ′′( ) − ′ 1 21 2 2 2 1 2 1 2ε ε ε
n r r r= ( ) ′ + ′′( ) + ′ 1 21 2 2 2 1 2 1 2ε ε ε
n K nKr r2 2 2− = ′ = ′′ε εand
n n jK jr r r*= − = = ′ − ′′ε ε ε
FUNDAMENTAL OPTICAL PROPERTIES OF MATERIALS I 3
where Nat is the number of atoms per unit volume, eo is the vacuum permittivity, and a′e andae″ are the real and imaginary parts of the electronic polarizability, given respectively by:
(1.6a)
and
(1.6b)
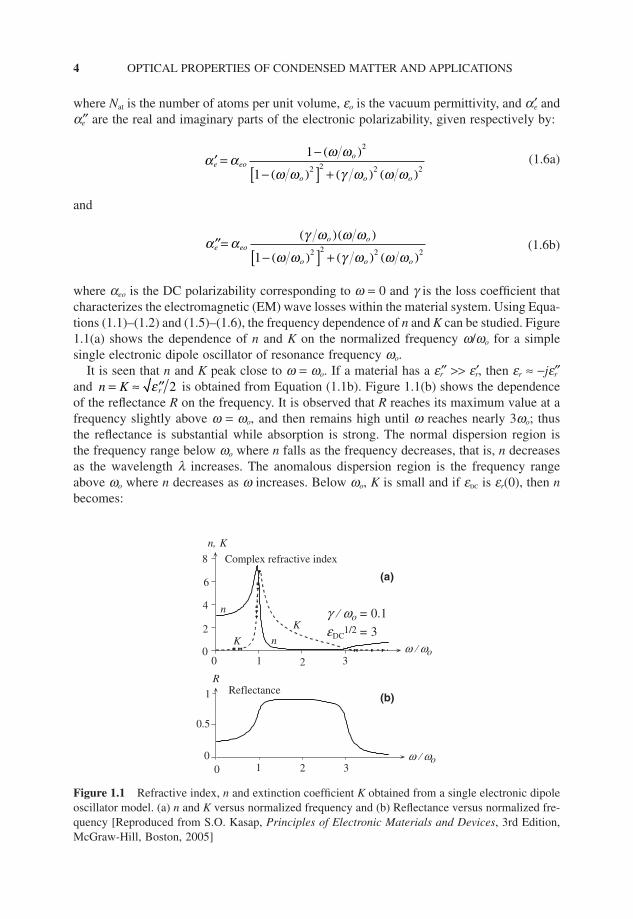
where aeo is the DC polarizability corresponding to w = 0 and g is the loss coefficient thatcharacterizes the electromagnetic (EM) wave losses within the material system. Using Equa-tions (1.1)–(1.2) and (1.5)–(1.6), the frequency dependence of n and K can be studied. Figure1.1(a) shows the dependence of n and K on the normalized frequency w/wo for a simplesingle electronic dipole oscillator of resonance frequency wo.
It is seen that n and K peak close to w = wo. If a material has a er″ >> e′r, then er ≈ −jer″and is obtained from Equation (1.1b). Figure 1.1(b) shows the dependenceof the reflectance R on the frequency. It is observed that R reaches its maximum value at afrequency slightly above w = wo, and then remains high until w reaches nearly 3wo; thusthe reflectance is substantial while absorption is strong. The normal dispersion region is the frequency range below wo where n falls as the frequency decreases, that is, n decreasesas the wavelength l increases. The anomalous dispersion region is the frequency rangeabove wo where n decreases as w increases. Below wo, K is small and if edc is er(0), then nbecomes:
n K r= ≈ ′′e 2
′′=( )( )
− ( )[ ] + ( ) ( )α α γ ω ω ω
ω ω γ ω ω ωe eo
o o
o o o1 2 2 2 2
′ = − ( )
− ( )[ ] + ( ) ( )α α ω ω
ω ω γ ω ω ωe eo
o
o o o
1
1
2
2 2 2 2
4 OPTICAL PROPERTIES OF CONDENSED MATTER AND APPLICATIONS
Complex refractive index
0 1 2 3ω / ωo
K
n
0
2
4
6
8
n, K
γ / ωo = 0.1
εDC1/2 = 3
(a)
0 1 2 3ω / ωo0
0.5
1R
Reflectance(b)
K n
Figure 1.1 Refractive index, n and extinction coefficient K obtained from a single electronic dipoleoscillator model. (a) n and K versus normalized frequency and (b) Reflectance versus normalized fre-quency [Reproduced from S.O. Kasap, Principles of Electronic Materials and Devices, 3rd Edition,McGraw-Hill, Boston, 2005]
(1.7)
Since, l = 2pc/w, defining lo = 2pc/wo as the resonance wavelength, one gets:
(1.8)
While intuitively useful, the dispersion relation in Equation (1.8) is far too simple. Morerigorously, we have to consider the dipole oscillator quantum mechanically which means aphoton excites the oscillator to a higher energy level, see, for example, Fox [1.21] orSimmons and Potter [1.18]. The result is that we would have a series of l2/(l2 − li
2) termswith various weighting factors Ai that add to unity, where li represents different resonancewavelengths. The weighting factors Ai involve quantum mechanical matrix elements.
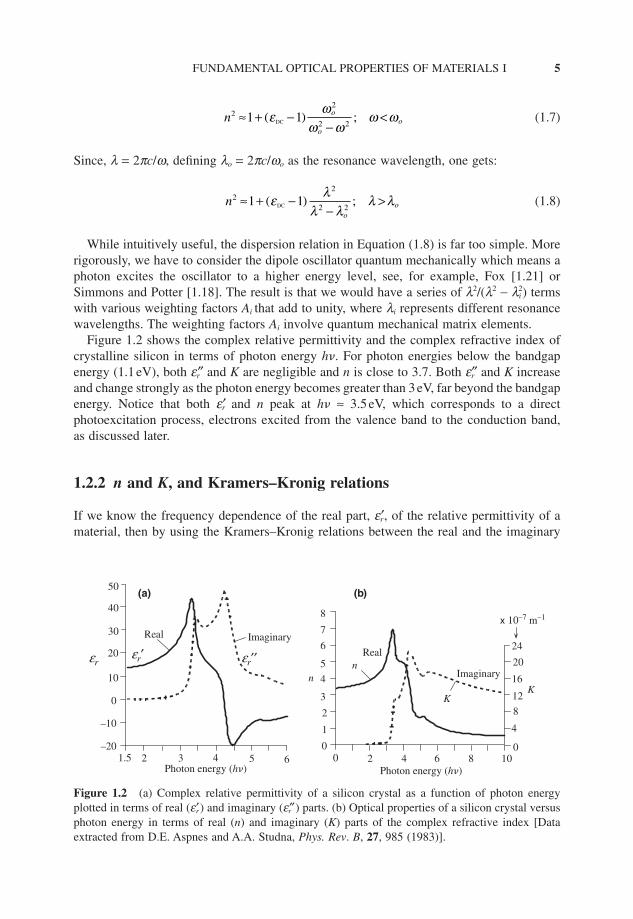
Figure 1.2 shows the complex relative permittivity and the complex refractive index ofcrystalline silicon in terms of photon energy h�. For photon energies below the bandgapenergy (1.1eV), both er″ and K are negligible and n is close to 3.7. Both er″ and K increaseand change strongly as the photon energy becomes greater than 3eV, far beyond the bandgapenergy. Notice that both e′r and n peak at h� ≈ 3.5eV, which corresponds to a direct photoexcitation process, electrons excited from the valence band to the conduction band,as discussed later.
1.2.2 n and K, and Kramers–Kronig relations
If we know the frequency dependence of the real part, e′r, of the relative permittivity of amaterial, then by using the Kramers–Kronig relations between the real and the imaginary
no
o2
21 1≈ + −( )
−>
2
2ε λλ λ
λ λDC ;
n o
oo
22
2 21 1≈ + −( )
−<ε ω
ω ωω ωDC ;
FUNDAMENTAL OPTICAL PROPERTIES OF MATERIALS I 5
Photon energy (h�)
Real
20 4 6 8 100
2
4
6
8
0
8
16
24
4
12
20
x 10–7 m–1
1
3
5
7
Imaginary
KK
nn
1.5 2–20
Photon energy (h�)
Real Imaginary
3 4 5 6
–10
0
50
40
30
20
10
εrεr′ εr′′
)b()a(
Figure 1.2 (a) Complex relative permittivity of a silicon crystal as a function of photon energyplotted in terms of real (e′r ) and imaginary (er″) parts. (b) Optical properties of a silicon crystal versusphoton energy in terms of real (n) and imaginary (K) parts of the complex refractive index [Dataextracted from D.E. Aspnes and A.A. Studna, Phys. Rev. B, 27, 985 (1983)].
parts we can determine the frequency dependence of the imaginary part er″, and vice versa.The transform requires that we know the frequency dependence of either the real or imag-inary part over as wide a range of frequencies as possible, ideally from zero (DC) to infin-ity, and that the material has linear behaviour, i.e., it has a relative permittivity that isindependent of the applied field. The Kramers–Kronig relations for the real and imaginaryparts of the relative permittivity are given by [1.23, 1.24] (see also Appendix 1C in [1.18])
(1.9a)
and
(1.9b)
where w′ is the integration variable, P represents the Cauchy principal value of the integral,and the singularity at w = w′ is avoided.
Similarly one can relate the real and imaginary parts of the polarizability, a′(w) anda″(w), and those of the complex refractive index, n(w) and K(w) as well. For n* = n(w) −jK(w),
(1.10)
It should be emphasized that the optical constants n and K have to obey what are calledf-sum rules [1.25]. For example, the integration of [n(w) − 1] over all frequencies must bezero, and the integration of wK(w) over all frequencies gives (p/2)wp
2, where wp =h̄(4pNZe2/me)1/2 is the free-electron plasma frequency in which N is the atomic concentra-tion, Z is the total number of electrons per atom, and e and me are the charge and mass ofthe electron. The f-sum rules provide a consistency check and enable various constants tobe interrelated.
1.3 REFRACTIVE INDEX AND DISPERSION
There are several popular models describing the spectral dependence of refractive index nin a material. Most of these are described below though some, such as the infrared refrac-tive index, are covered under Reststrahlen absorption in Chapter 2 since it is closely relatedto the coupling of the EM wave to lattice vibrations. The most popular dispersion relationin optical materials is probably the Sellmeier relationship since one can sum any numberof resonance-type terms to get as wide a range of wavelength dependence as possible.However, its main drawback is that it does not accurately represent the refractive indexwhen there is a contribution arising from free carriers in narrow-bandgap or doped semiconductors.
n PK
K PKω
πω
ω ωω ω
πω
ω ωω( ) = + ′( )
′ −′ ( ) = − ′( )
′ −′
∞ ∞
∫ ∫12 2
0 0d and d
′′( ) = − ′ ′( )
′ −′
∞
∫ε ω ωπ
ε ωω ω
ωrrP
22 20
d
′ ( ) = + ′ ′′ ′( )′ −
′∞
∫ε ωπ
ω ε ωω ω
ωrrP1
22 20
d
6 OPTICAL PROPERTIES OF CONDENSED MATTER AND APPLICATIONS

1.3.1 Cauchy dispersion relation
In the Cauchy relationship, the dispersion relationship between the refractive index (n) andwavelength of light (l) is commonly stated in the following form:
(1.11)
where A, B, and C are material-dependent specific constants. Equation (1.11) is known asCauchy’s formula and it is typically used in the visible spectrum region for various opticalglasses and is applies to normal dispersion, when n decreases with increasing l [1.26, 1.27].The third term is sometimes dropped for a simpler representation of n versus l behaviour.The original expression was a series in terms of the wavelength, l, or frequency, w, orphoton energy h̄w of light as:
(1.12a)
or
(1.12b)
where h̄w is the photon energy, h̄wth = hc/lth is the optical excitation threshold (e.g., bandgapenergy), a0, a2, . . . and n0, n2, . . . are constants. It has been found that a Cauchy relation inthe following form [1.28]:
(1.13)
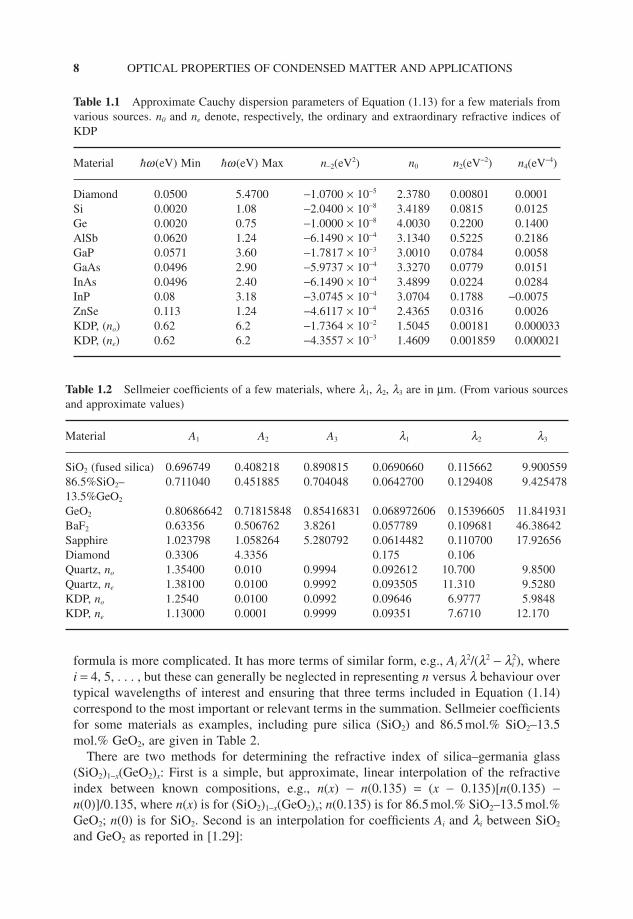
can be used satisfactorily over a wide range of photon energies. The dispersion parametersof Equation (1.13) are listed in Table 1 for a few selected materials over specific photonenergy ranges.
Cauchy’s dispersion relations given in Equations (1.11–1.13) were originally called theelastic-ether theory of the refractive index. It has been widely used for many materialsalthough, in recent years, many researchers have preferred to use the Sellmeier equationdescribed below.
1.3.2 Sellmeier dispersion equation
The Sellmeier equation is an empirical relation between the refractive index n of a sub-stance and wavelength l of light in the form of a series of single-dipole oscillator termseach of which has the usual l2/(l2 − li
2) dependence as in
(1.14)
where li is a constant, and A1, A2, A3, l1, l2 and l3 are called Sellmeier coefficients, whichare determined by fitting this expression to the experimental data. The actual Sellmeier
nA A A2 1
2
2 2
22
2 2
32
2 21
1 2 3
= +−
+−
+−
+λλ λ
λλ λ
λλ λ
L
n n n n n= ( ) + + ( ) + ( )−−
22
0 22
44
h h hω ω ω
n n n n n= + ( ) + ( ) + ( ) + <0 22
44
66
h h h h hω ω ω ω ω. . . th
n a a a a= + + + + >− − −0 2
24
46
6λ λ λ λ λ. . . th
n AB C= + +λ λ2 4
FUNDAMENTAL OPTICAL PROPERTIES OF MATERIALS I 7
formula is more complicated. It has more terms of similar form, e.g., Ai l2/(l2 − li2), where
i = 4, 5, . . . , but these can generally be neglected in representing n versus l behaviour overtypical wavelengths of interest and ensuring that three terms included in Equation (1.14)correspond to the most important or relevant terms in the summation. Sellmeier coefficientsfor some materials as examples, including pure silica (SiO2) and 86.5mol.% SiO2–13.5mol.% GeO2, are given in Table 2.
There are two methods for determining the refractive index of silica–germania glass(SiO2)1−x(GeO2)x: First is a simple, but approximate, linear interpolation of the refractiveindex between known compositions, e.g., n(x) − n(0.135) = (x − 0.135)[n(0.135) −n(0)]/0.135, where n(x) is for (SiO2)1−x(GeO2)x; n(0.135) is for 86.5mol.% SiO2–13.5mol.%GeO2; n(0) is for SiO2. Second is an interpolation for coefficients Ai and li between SiO2
and GeO2 as reported in [1.29]:
8 OPTICAL PROPERTIES OF CONDENSED MATTER AND APPLICATIONS
Table 1.1 Approximate Cauchy dispersion parameters of Equation (1.13) for a few materials fromvarious sources. n0 and ne denote, respectively, the ordinary and extraordinary refractive indices ofKDP
Material h-w(eV) Min h-w(eV) Max n−2(eV2) n0 n2(eV−2) n4(eV−4)
Diamond 0.0500 5.4700 −1.0700 × 10⁻⁵ 2.3780 0.00801 0.0001Si 0.0020 1.08 −2.0400 × 10⁻⁸ 3.4189 0.0815 0.0125Ge 0.0020 0.75 −1.0000 × 10⁻⁸ 4.0030 0.2200 0.1400AlSb 0.0620 1.24 −6.1490 × 10⁻⁴ 3.1340 0.5225 0.2186GaP 0.0571 3.60 −1.7817 × 10⁻³ 3.0010 0.0784 0.0058GaAs 0.0496 2.90 −5.9737 × 10⁻⁴ 3.3270 0.0779 0.0151InAs 0.0496 2.40 −6.1490 × 10⁻⁴ 3.4899 0.0224 0.0284InP 0.08 3.18 −3.0745 × 10⁻⁴ 3.0704 0.1788 −0.0075ZnSe 0.113 1.24 −4.6117 × 10⁻⁴ 2.4365 0.0316 0.0026KDP, (no) 0.62 6.2 −1.7364 × 10⁻² 1.5045 0.00181 0.000033KDP, (ne) 0.62 6.2 −4.3557 × 10⁻³ 1.4609 0.001859 0.000021
Table 1.2 Sellmeier coefficients of a few materials, where l1, l2, l3 are in µm. (From various sourcesand approximate values)
Material A1 A2 A3 l1 l2 l3
SiO2 (fused silica) 0.696749 0.408218 0.890815 0.0690660 0.115662 9.90055986.5%SiO2– 0.711040 0.451885 0.704048 0.0642700 0.129408 9.42547813.5%GeO2
GeO2 0.80686642 0.71815848 0.85416831 0.068972606 0.15396605 11.841931BaF2 0.63356 0.506762 3.8261 0.057789 0.109681 46.38642Sapphire 1.023798 1.058264 5.280792 0.0614482 0.110700 17.92656Diamond 0.3306 4.3356 0.175 0.106Quartz, no 1.35400 0.010 0.9994 0.092612 10.700 9.8500Quartz, ne 1.38100 0.0100 0.9992 0.093505 11.310 9.5280KDP, no 1.2540 0.0100 0.0992 0.09646 6.9777 5.9848KDP, ne 1.13000 0.0001 0.9999 0.09351 7.6710 12.170
(1.15)
where X is the mole fraction of germania, S and G in parentheses refer to silica and ger-mania, respectively. The theoretical basis of the Sellmeier equation lies in representing thesolid as a sum of N lossless (frictionless) Lorentz oscillators such that each has the usualform of l2/(l2 − li
2) with different li and each has different strengths, or weighting factors;Ai, i = 1 to N [1.30, 1.31]. Such dispersion relationships are essential in designing photonicdevices such as waveguides. (Note that although Ai weight different Lorentz contributions,they do not sum to 1 since they include other parameters besides the oscillator strength fi.)The refractive indices of most optical glasses have been extensively modelled by the Sell-meier equation. Various optical glass manufacturers such as Schott Glass normally providethe Sellmeier coefficients for their glasses [1.32]. Optical dispersion relations for glasseshave been discussed by a number of authors [1.6, 1.18, 1.33]. The Sellmeier coefficientsnormally depend on the temperature and pressure; their dependences for optical glasses havebeen described by Ghosh [1.34–1.36].
There are other Sellmeier–Cauchy-like dispersion relationships that inherently takeaccount of various contributions to the optical properties, such as the electronic and ionicpolarization and interaction of photons with free electrons. For example, for many semi-conductors and ionic crystals, two useful dispersion relations are:
(1.16)
and
(1.17)
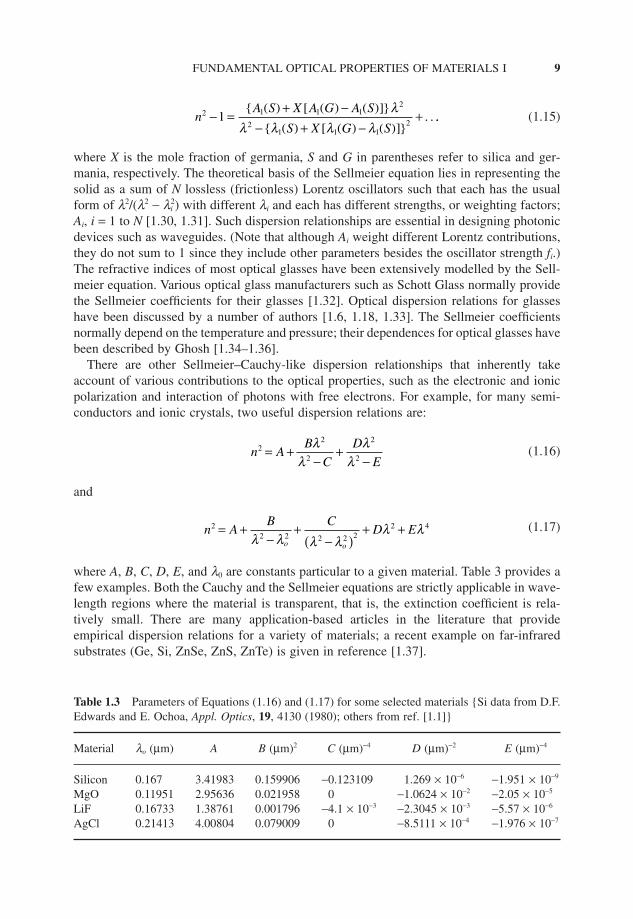
where A, B, C, D, E, and l0 are constants particular to a given material. Table 3 provides afew examples. Both the Cauchy and the Sellmeier equations are strictly applicable in wave-length regions where the material is transparent, that is, the extinction coefficient is rela-tively small. There are many application-based articles in the literature that provideempirical dispersion relations for a variety of materials; a recent example on far-infraredsubstrates (Ge, Si, ZnSe, ZnS, ZnTe) is given in reference [1.37].
n AB C
D Eo o
22 2 2 2 2
2 4= +−
+−( )
+ +λ λ λ λ
λ λ
n AB
C
D
E2
2
2
2
2= +
−+
−λ
λλ
λ
nA S X A G A S
S X G S2 1 1 1
2
21 1 1
21− =
( ) + ( ) − ( )[ ]{ }
− ( ) + ( ) − ( )[ ]{ }+
λλ λ λ λ
. . ..
FUNDAMENTAL OPTICAL PROPERTIES OF MATERIALS I 9
Table 1.3 Parameters of Equations (1.16) and (1.17) for some selected materials {Si data from D.F.Edwards and E. Ochoa, Appl. Optics, 19, 4130 (1980); others from ref. [1.1]}
Material lo (µm) A B (µm)2 C (µm)−4 D (µm)−2 E (µm)−4
Silicon 0.167 3.41983 0.159906 −0.123109 1.269 × 10⁻⁶ −1.951 × 10⁻⁹
MgO 0.11951 2.95636 0.021958 0 −1.0624 × 10⁻² −2.05 × 10⁻⁵
LiF 0.16733 1.38761 0.001796 −4.1 × 10⁻³ −2.3045 × 10⁻³ −5.57 × 10⁻⁶
AgCl 0.21413 4.00804 0.079009 0 −8.5111 × 10⁻⁴ −1.976 × 10⁻⁷

1.3.3 Refractive index of semiconductors
A. Refractive index of crystalline semiconductors
A particular interest in the case of semiconductors is in n and K for photons energies greaterthan the bandgap Eg for optoelectronics applications. Owing to various features and singu-larities in the E–k diagrams of crystalline semiconductors (where k is the electron’s wavevector), the optical constants n and K for h̄w > Eg are not readily expressible in simple terms.Various authors, for example, Forouhi and Bloomer [1.38, 1.39], Chen et al. [1.40] havenonetheless provided useful and tractable expressions for modelling n and K in this regime.In particular, Forouhi–Bloomer (FB) equations express n and K in terms of the photonenergy h̄w in a consistent way that obey the Kramers–Kronig relations [1.39], i.e.
(1.18)
where q is an integer that represents the number of terms needed to suitably model exper-imental values of n and K, Eg is the bandgap, and Ai, Bi, Ci, Boi, Coi are constants, Boi andCoi depending on Ai, Bi, Ci, and Eg; only the latter four are independent parameters, Boi =(Ai/Qi)[−(1/2)Bi
2 + EgBi − Eg2 + Ci]; Coi = (Ai/Qi)[(1/2)(Eg
2 + Ci)Bi2 − 2EgCi]; Qi = (1/2)(4Ci −
Bi2)1/2. Forouhi and Bloomer provide a table of FB coefficients, Ai, Bi, Ci, and Eg, for four
terms in the summation in Equation (1.18) [1.39] for a number of semiconductors; anexample that shows an excellent agreement between the FB dispersion relation and theexperimental data is shown in Figure 1.3. Table 4 provides the FB coefficients for a fewselected semiconductors. The reader is referred to Adachi’s recent book and his papers forfurther discussions and other models on the refractive index of crystalline and amorphoussemiconductors [1.10, 1.11, 1.41–1.44]; the optical properties of amorphous semiconduc-tors are treated in a later chapter of this book.
KA E
B Cn n
B Ci g
i ii
qoi oi=
−( )( ) − ( ) +
= ∞( ) +( ) +
( )=∑ h
h h
h
h
ωω ω
ωω
2
21
2and
−− ( ) +=∑
B Ci ii
q
hω1
10 OPTICAL PROPERTIES OF CONDENSED MATTER AND APPLICATIONS
Photon energy (eV)
n, K
n
K
SiC
Figure 1.3 n and K versus photon energy for crystalline SiC. The solid line is obtained from the FBequation with four terms with appropriate parameters, and points represent the experimental data. Seeoriginal reference [1.39] for details [Reprinted with permission Fig. 2c, A.R. Forouhi and I. Bloomer,Phys. Rev. B, 38, 1865. Copyright (1988) by the American Physical Society]
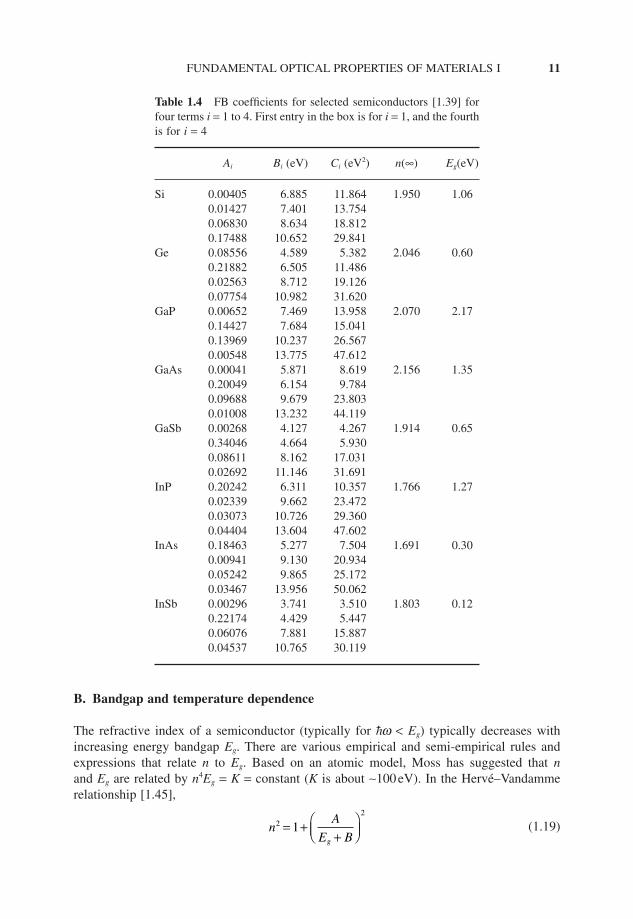
B. Bandgap and temperature dependence
The refractive index of a semiconductor (typically for h̄w < Eg) typically decreases withincreasing energy bandgap Eg. There are various empirical and semi-empirical rules andexpressions that relate n to Eg. Based on an atomic model, Moss has suggested that nand Eg are related by n4Eg = K = constant (K is about ∼100eV). In the Hervé–Vandammerelationship [1.45],
(1.19)nA
E Bg
22
1= ++
FUNDAMENTAL OPTICAL PROPERTIES OF MATERIALS I 11
Table 1.4 FB coefficients for selected semiconductors [1.39] forfour terms i = 1 to 4. First entry in the box is for i = 1, and the fourthis for i = 4
Ai Bi (eV) Ci (eV2) n(∞) Eg(eV)
Si 0.00405 6.885 11.864 1.950 1.060.01427 7.401 13.7540.06830 8.634 18.8120.17488 10.652 29.841
Ge 0.08556 4.589 5.382 2.046 0.600.21882 6.505 11.4860.02563 8.712 19.1260.07754 10.982 31.620
GaP 0.00652 7.469 13.958 2.070 2.170.14427 7.684 15.0410.13969 10.237 26.5670.00548 13.775 47.612
GaAs 0.00041 5.871 8.619 2.156 1.350.20049 6.154 9.7840.09688 9.679 23.8030.01008 13.232 44.119
GaSb 0.00268 4.127 4.267 1.914 0.650.34046 4.664 5.9300.08611 8.162 17.0310.02692 11.146 31.691
InP 0.20242 6.311 10.357 1.766 1.270.02339 9.662 23.4720.03073 10.726 29.3600.04404 13.604 47.602
InAs 0.18463 5.277 7.504 1.691 0.300.00941 9.130 20.9340.05242 9.865 25.1720.03467 13.956 50.062
InSb 0.00296 3.741 3.510 1.803 0.120.22174 4.429 5.4470.06076 7.881 15.8870.04537 10.765 30.119
where A and B are constants as A ≈ 13.6eV and B ≈ 3.4eV. The temperature dependenceof n arises from the variation of Eg with the temperature T and typically it increases withincreasing temperature. The temperature coefficient of refractive index (TCRI) of semi-conductors can be found from the Hervé–Vandamme relationship as:
(1.20)
where dB/dT ≈ 2.5 × 10⁻⁵ eVK−1. TCRI is typically found to be in the range of 10−6 to 10−4 K−1.
1.3.4 Gladstone–Dale formula and oxide glasses
The Gladstone–Dale formula is an empirical equation that allows the average refractiveindex n of an oxide glass to be calculated from its density r and its constituents as:
(1.21)
where the summation is for various oxide components (each a simple oxide), pi is the weightfraction of the i-th oxide in the compound, and ki is the refraction coefficient that representsthe polarizability of the i-th oxide. The right-hand side of Equation (1.21) is called the Gladstone–Dale coefficient CGD. In more general terms, as a mixture rule for the overallrefractive index, the Gladstone–Dale formula is frequently written as:
(1.22)
where n and r are the effective refractive index and effective density, respectively, of thewhole mixture, n1, n2, . . . are the refractive indices of the constituents, and r1, r2, . . .represent the densities of each constituent. Gladstone–Dale equations for the polymorphsof SiO2 and TiO2 give the average n, respectively, as [1.46, 1.47]:
(1.23)
1.3.5 Wemple–DiDomenico dispersion relation
Based on the single-oscillator model, the Wemple–DiDomenico is a semi-empirical disper-sion relation for determining the refractive index at photon energies below the interbandabsorption edge in a variety of materials. It is given by:
(1.24)nE E
E ho d
o
2
2 21= +− ( )�
n nSiO and TiO2 21 0 21 1 0 40( ) = + ( ) = +. .ρ ρ
n nw
nw
− = − + − +1 1 11
11
2
22ρ ρ ρ
L
np k p k p k Ci i
i
N−= + + = =
=∑1
1 1 1 11ρ
. . . GD
TCRI=1 d
d
d
d
d
dn
n
T
n
n
E
T
B
Tg⋅ = −( ) +
2 3 2
2
1
13 6.
12 OPTICAL PROPERTIES OF CONDENSED MATTER AND APPLICATIONS
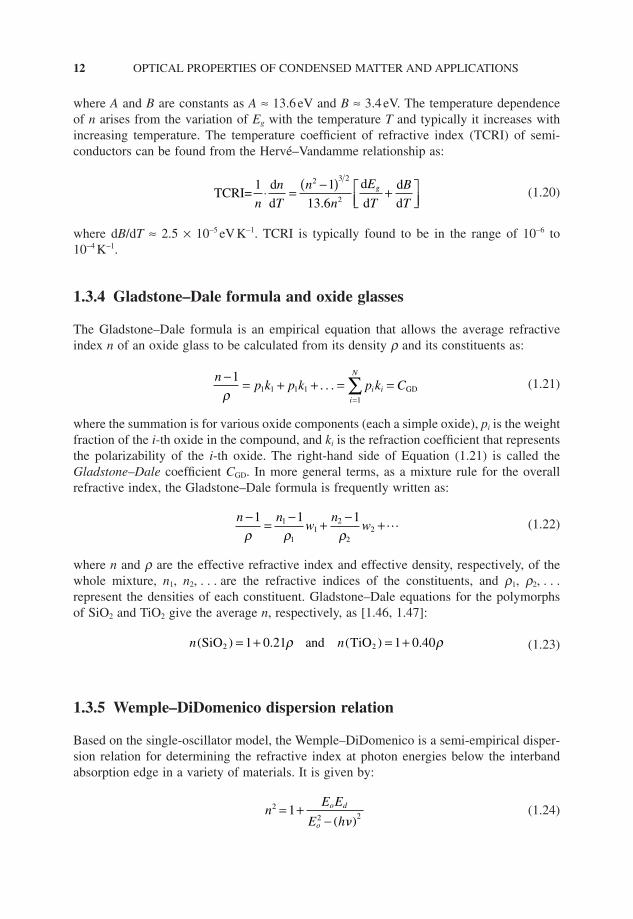
where n is the frequency, h is the Planck constant, Eo is the single-oscillator energy, Ed isthe dispersion energy which is a measure of the average strength of interband optical tran-sitions; Ed = bNcZaNe (eV), where Nc is the effective coordination number of the cationnearest-neighbour to the anion (e.g., Nc = 6 in NaCl, Nc = 4 in Ge), Za is the formal chem-ical valency of the anion (Za = 1 in NaCl; 2 in Te; and 3 in GaP), Ne is the effective numberof valence electrons per anion excluding the cores (Ne = 8 in NaCl, Ge; 10 in TlCl; 12 inTe; 91/3 in As2Se3), and b is a constant that depends on whether the interatomic bond is ionic(bi) or covalent (bc): bi = 0.26 ± 0.04eV for (e.g., halides NaCl, ThBr, etc. and most oxides,Al2O3, etc.), bc = 0.37 ± 0.05eV for (e.g., tetrahedrally bonded ANB8−N zinc blende-anddiamond-type structures, GaP, ZnS, etc., and wurtzite crystals have a b-value that is inter-mediate between bi and bc). Further, empirically, Eo = CEg(D), where Eg(D) is the lowestdirect bandgap and C is a constant; typically C ≈ 1.5. Eo has been associated with the mainpeak in the er″(hn) versus hn spectrum. The parameters required for calculating n from Equa-tion (1.24) are listed in Table 5 [1.48]. While it is apparent that the Wemple–DiDomenicorelation can only be approximate, it has nonetheless found wide acceptance among exper-imentalists due to its straightforward simplicity.
FUNDAMENTAL OPTICAL PROPERTIES OF MATERIALS I 13
Table 1.5 Examples of parameters for Wemple–DiDomenico dispersion relationship [Equation(1.24)] in various materials [1.48]
Material Nc Za Ne Eo Ed b b Comment(eV) (eV) (eV)
NaCl 6 1 8 10.3 13.6 0.28 βi Halides, LiF, NaF, etcCsCl 8 1 8 10.6 17.1 0.27 βi CsBr, CsI, etcTlCl 8 1 10 5.8 20.6 0.26 βi TlBrCaF2 8 1 8 15.7 15.9 0.25 βi BaF2, etcCaO 6 2 8 9.9 22.6 0.24 βi Oxides, MgO, TeO2, etcAl2O3 6 2 8 13.4 27.5 0.29 βi
LiNbO3 6 2 8 6.65 25.9 0.27 βi
TiO2 6 2 8 5.24 25.7 0.27 βi
ZnO 4 2 8 6.4 17.1 0.27 βi
ZnSe 4 2 8 5.54 27.0 0.42 βc II–VI, Zinc blende, ZnS,ZnTe,CdTe
GaAs 4 3 8 3.55 33.5 0.35 βc III–V, Zinc blende, GaP,etc
Si (Crystal) 4 4 8 4.0 44.4 0.35 βc Diamond, covalentbonding; C (diamond),Ge, β-SiC etc
SiO2 (Crystal) 4 2 8 13.33 18.10 0.28 βi Average crystalline formSiO2 4 2 8 13.38 14.71 0.23 βi Fused silica(Amorphous)CdSe 4 2 8 4.0 20.6 0.32 βi–βc Wurtzite
1.3.6 Group index
Group index is a factor by which the group velocity of a group of waves in a dielectricmedium is reduced with respect to propagation in free space. It is denoted by Ng and definedby Ng = vg/c, where vg is the group velocity, defined by vg = dw/dk where k is the wavevector or the propagation constant. The group index can be determined from the ordinaryrefractive index n through:
(1.25)
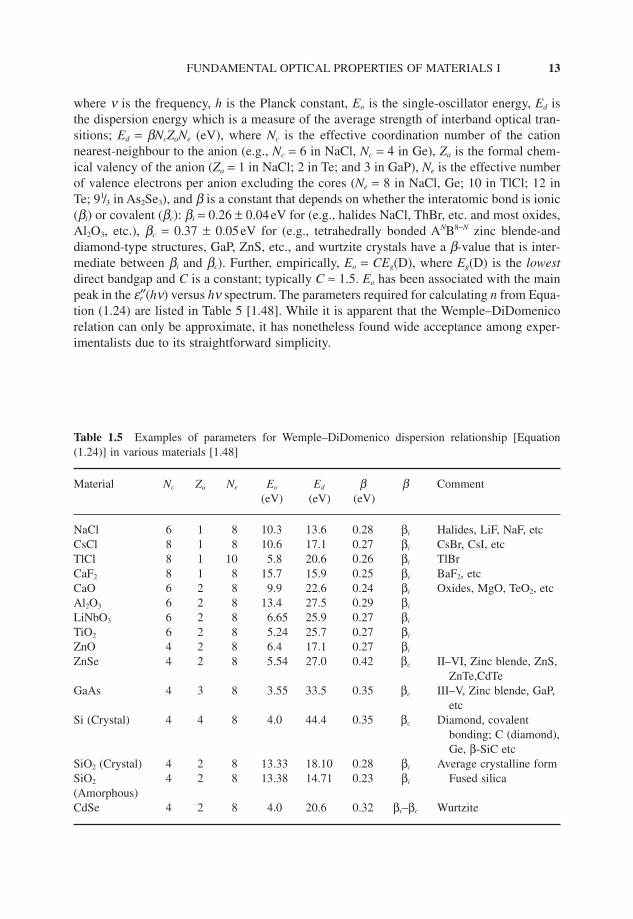
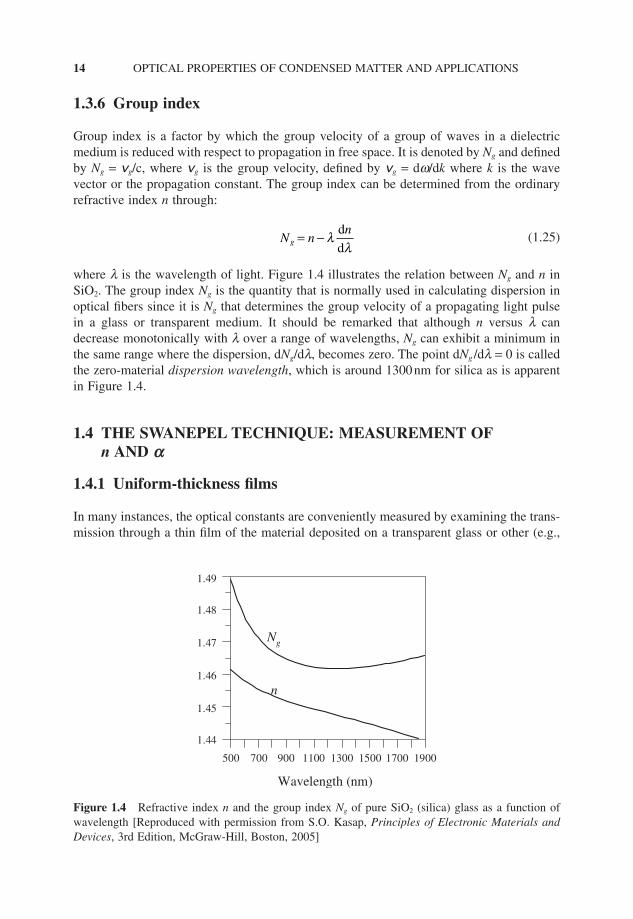
where l is the wavelength of light. Figure 1.4 illustrates the relation between Ng and n inSiO2. The group index Ng is the quantity that is normally used in calculating dispersion inoptical fibers since it is Ng that determines the group velocity of a propagating light pulsein a glass or transparent medium. It should be remarked that although n versus l candecrease monotonically with l over a range of wavelengths, Ng can exhibit a minimum inthe same range where the dispersion, dNg/dl, becomes zero. The point dNg /dl = 0 is calledthe zero-material dispersion wavelength, which is around 1300nm for silica as is apparentin Figure 1.4.
1.4 THE SWANEPEL TECHNIQUE: MEASUREMENT OFn AND a
1.4.1 Uniform-thickness films
In many instances, the optical constants are conveniently measured by examining the trans-mission through a thin film of the material deposited on a transparent glass or other (e.g.,
N nn
g = − λλ
d
d
14 OPTICAL PROPERTIES OF CONDENSED MATTER AND APPLICATIONS
Ng
n
500 700 900 1100 1300 1500 1700 1900
1.44
1.45
1.46
1.47
1.48
1.49
Wavelength (nm)
Figure 1.4 Refractive index n and the group index Ng of pure SiO2 (silica) glass as a function ofwavelength [Reproduced with permission from S.O. Kasap, Principles of Electronic Materials andDevices, 3rd Edition, McGraw-Hill, Boston, 2005]
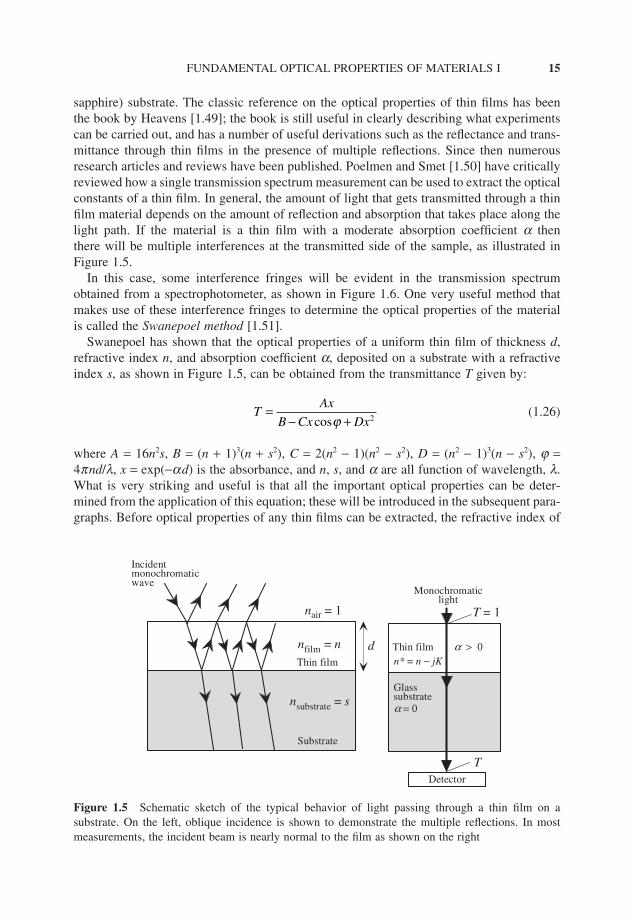
sapphire) substrate. The classic reference on the optical properties of thin films has beenthe book by Heavens [1.49]; the book is still useful in clearly describing what experimentscan be carried out, and has a number of useful derivations such as the reflectance and trans-mittance through thin films in the presence of multiple reflections. Since then numerousresearch articles and reviews have been published. Poelmen and Smet [1.50] have criticallyreviewed how a single transmission spectrum measurement can be used to extract the opticalconstants of a thin film. In general, the amount of light that gets transmitted through a thinfilm material depends on the amount of reflection and absorption that takes place along thelight path. If the material is a thin film with a moderate absorption coefficient a then there will be multiple interferences at the transmitted side of the sample, as illustrated inFigure 1.5.
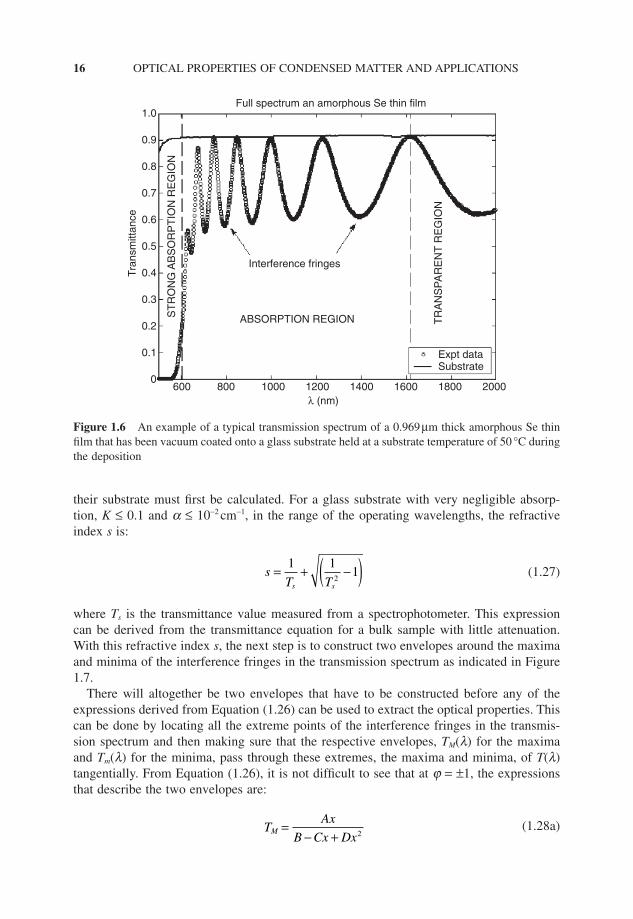
In this case, some interference fringes will be evident in the transmission spectrumobtained from a spectrophotometer, as shown in Figure 1.6. One very useful method thatmakes use of these interference fringes to determine the optical properties of the materialis called the Swanepoel method [1.51].
Swanepoel has shown that the optical properties of a uniform thin film of thickness d,refractive index n, and absorption coefficient a, deposited on a substrate with a refractiveindex s, as shown in Figure 1.5, can be obtained from the transmittance T given by:
(1.26)
where A = 16n2s, B = (n + 1)3(n + s2), C = 2(n2 − 1)(n2 − s2), D = (n2 − 1)3(n − s2), j =4pnd/l, x = exp(−ad) is the absorbance, and n, s, and a are all function of wavelength, l.What is very striking and useful is that all the important optical properties can be deter-mined from the application of this equation; these will be introduced in the subsequent para-graphs. Before optical properties of any thin films can be extracted, the refractive index of
TAx
B Cx Dx=
− +cosϕ 2
FUNDAMENTAL OPTICAL PROPERTIES OF MATERIALS I 15
nsubstrate = s
Incidentmonochromaticwave
nfilm = n
nair = 1
d
Substrate
Thin film
Monochromaticlight
Glasssubstrate
Thin film
Detector
α = 0
n* = n − jKα > 0
T
T = 1
Figure 1.5 Schematic sketch of the typical behavior of light passing through a thin film on a substrate. On the left, oblique incidence is shown to demonstrate the multiple reflections. In most measurements, the incident beam is nearly normal to the film as shown on the right
their substrate must first be calculated. For a glass substrate with very negligible absorp-tion, K ≤ 0.1 and a ≤ 10−2 cm−1, in the range of the operating wavelengths, the refractiveindex s is:
(1.27)
where Ts is the transmittance value measured from a spectrophotometer. This expressioncan be derived from the transmittance equation for a bulk sample with little attenuation.With this refractive index s, the next step is to construct two envelopes around the maximaand minima of the interference fringes in the transmission spectrum as indicated in Figure1.7.
There will altogether be two envelopes that have to be constructed before any of theexpressions derived from Equation (1.26) can be used to extract the optical properties. Thiscan be done by locating all the extreme points of the interference fringes in the transmis-sion spectrum and then making sure that the respective envelopes, TM(l) for the maximaand Tm(l) for the minima, pass through these extremes, the maxima and minima, of T(l)tangentially. From Equation (1.26), it is not difficult to see that at j = ±1, the expressionsthat describe the two envelopes are:
(1.28a)TAx
B Cx DxM =
− + 2
sT Ts s
= + −( )1 11
2
16 OPTICAL PROPERTIES OF CONDENSED MATTER AND APPLICATIONS
Full spectrum an amorphous Se thin film
Interference fringes
ABSORPTION REGIONST
RO
NG
AB
SO
RP
TIO
N R
EG
ION
TR
AN
SP
AR
EN
T R
EG
ION
Expt dataSubstrate
600 800 1000 1200 1400 1600 1800 2000λ (nm)
1.0
0.9
0.8
0.7
0.6
0.5
0.4
0.3
0.2
0.1
0
Tran
smitt
ance
Figure 1.6 An example of a typical transmission spectrum of a 0.969 µm thick amorphous Se thinfilm that has been vacuum coated onto a glass substrate held at a substrate temperature of 50 °C duringthe deposition
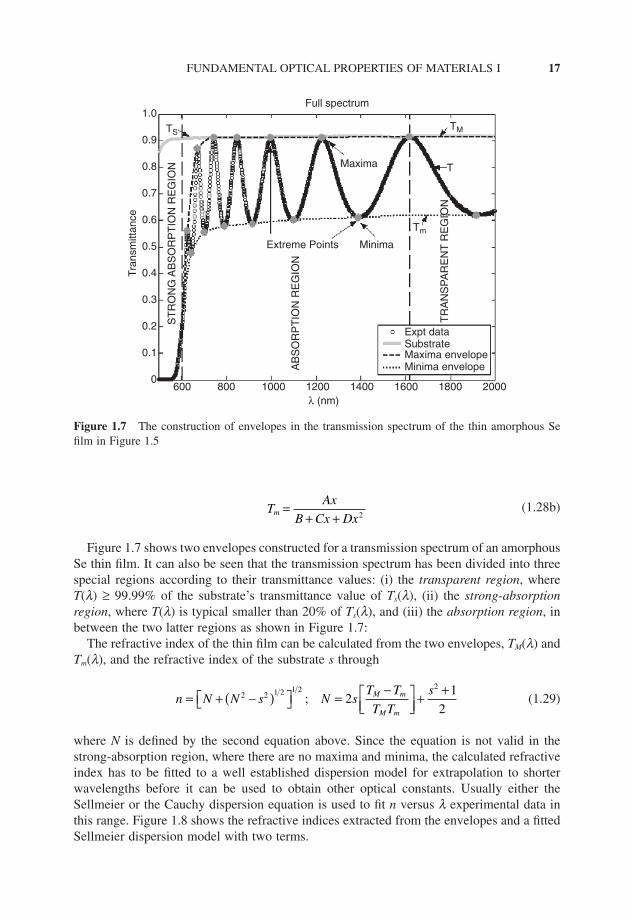
(1.28b)
Figure 1.7 shows two envelopes constructed for a transmission spectrum of an amorphousSe thin film. It can also be seen that the transmission spectrum has been divided into threespecial regions according to their transmittance values: (i) the transparent region, whereT(l) ≥ 99.99% of the substrate’s transmittance value of Ts(l), (ii) the strong-absorptionregion, where T(l) is typical smaller than 20% of Ts(l), and (iii) the absorption region, inbetween the two latter regions as shown in Figure 1.7:
The refractive index of the thin film can be calculated from the two envelopes, TM(l) andTm(l), and the refractive index of the substrate s through
(1.29)
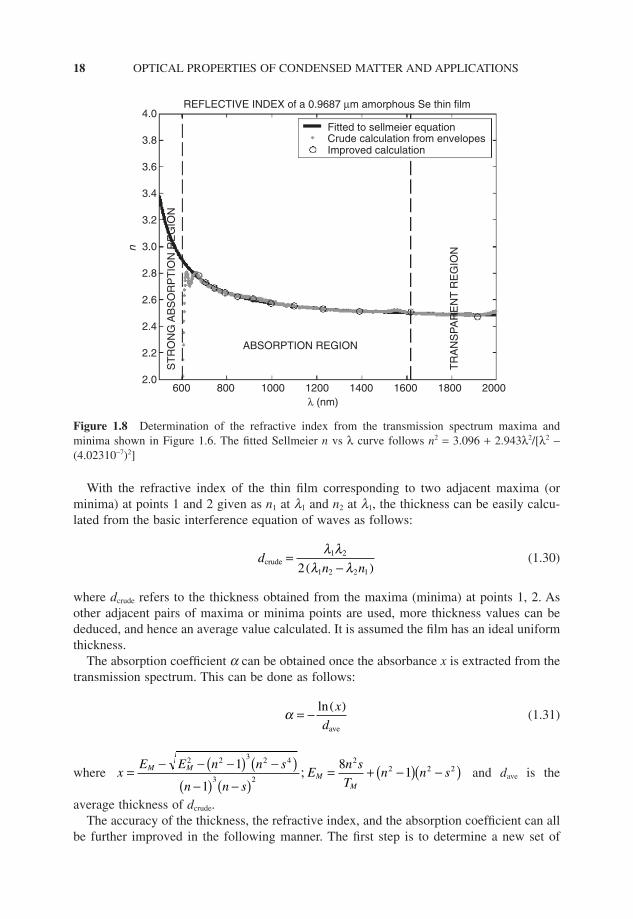
where N is defined by the second equation above. Since the equation is not valid in thestrong-absorption region, where there are no maxima and minima, the calculated refractiveindex has to be fitted to a well established dispersion model for extrapolation to shorterwavelengths before it can be used to obtain other optical constants. Usually either the Sellmeier or the Cauchy dispersion equation is used to fit n versus l experimental data inthis range. Figure 1.8 shows the refractive indices extracted from the envelopes and a fittedSellmeier dispersion model with two terms.
n N N s N sT T
T T
sM m
M m
= + −( ) =−
++2 2 1 2 1 2 2
21
2;
TAx
B Cx Dxm =
+ + 2
FUNDAMENTAL OPTICAL PROPERTIES OF MATERIALS I 17
Full spectrum
Tm
TMTS
T
Minima
Maxima
Extreme Points
AB
SO
RP
TIO
N R
EG
ION
ST
RO
NG
AB
SO
RP
TIO
N R
EG
ION
TR
AN
SP
AR
EN
T R
EG
ION
Expt dataSubstrateMaxima envelopeMinima envelope
600 800 1000 1200 1400 1600 1800 2000λ (nm)
1.0
0.9
0.8
0.7
0.6
0.5
0.4
0.3
0.2
0.1
0
Tran
smitt
ance
Figure 1.7 The construction of envelopes in the transmission spectrum of the thin amorphous Sefilm in Figure 1.5
With the refractive index of the thin film corresponding to two adjacent maxima (orminima) at points 1 and 2 given as n1 at l1 and n2 at l1, the thickness can be easily calcu-lated from the basic interference equation of waves as follows:
(1.30)
where dcrude refers to the thickness obtained from the maxima (minima) at points 1, 2. Asother adjacent pairs of maxima or minima points are used, more thickness values can bededuced, and hence an average value calculated. It is assumed the film has an ideal uniformthickness.
The absorption coefficient a can be obtained once the absorbance x is extracted from thetransmission spectrum. This can be done as follows:
(1.31)
where and dave is the
average thickness of dcrude.The accuracy of the thickness, the refractive index, and the absorption coefficient can all
be further improved in the following manner. The first step is to determine a new set of
xE E n n s
n n sE
n s
Tn n sM M
MM
= − − −( ) −( )−( ) −( )
= + −( ) −( )2 2 3 2 4
3 2
22 2 21
1
81;
α = −( )ln x
dave
dn n
crude =−( )
λ λλ λ
1 2
1 2 2 12
18 OPTICAL PROPERTIES OF CONDENSED MATTER AND APPLICATIONS
4.0
3.8
3.6
3.4
3.2
3.0
2.8
2.6
2.4
2.2
2.0600 800 1000 1200 1400 1600 1800 2000
λ (nm)
ABSORPTION REGION
TR
AN
SP
AR
EN
T R
EG
ION
REFLECTIVE INDEX of a 0.9687 µm amorphous Se thin film
Fitted to sellmeier equationCrude calculation from envelopesImproved calculation
ST
RO
NG
AB
SO
RP
TIO
N R
EG
ION
n
Figure 1.8 Determination of the refractive index from the transmission spectrum maxima andminima shown in Figure 1.6. The fitted Sellmeier n vs λ curve follows n2 = 3.096 + 2.943λ2/[λ2 −(4.02310−7)2]
interference orders number, m′, for the interference fringes from the basic interference equa-tion of waves, that is:
(1.32a)
where ne and le are values taken at any extreme points, and m′ is an integer if the extremestaken are maxima, or a half-integer if the extremes taken are minima.
The second step is to get a new corresponding set of thickness, d′, from this new set oforder numbers m′, by rearranging Equation (1.32a) as:
(1.32b)
From this new set of thicknesses, d′, a new average thickness, dnew, must be calculatedbefore it can applied to improve the refractive index. With this new average thickness, amore accurate refractive index can be obtained from the same equation:
(1.32c)
This new refractive index can then be fitted to the previous dispersion model again sothat an improved absorption coefficient a can be calculated from Equation (1.31). All theseparameters can then be used in Equation (1.26) to regenerate a transmission spectrum Tcal(l)so that the root mean square error (RMSE) can be determined from the experimental spec-trum Texp. The RMSE is calculated as follows:
(1.33)
where Texp is the transmittance of the experimental or measured spectrum, Tcal is the trans-mittance of the regenerated spectrum using the Swanepoel calculation method, and q is therange of the measurement. Figure 1.9 shows the regenerated transmission spectrum of theamorphous Se thin film that appeared in Figure 1.6 using the optical constants calculatedfrom the envelopes.
1.4.2 Thin films with nonuniform thickness
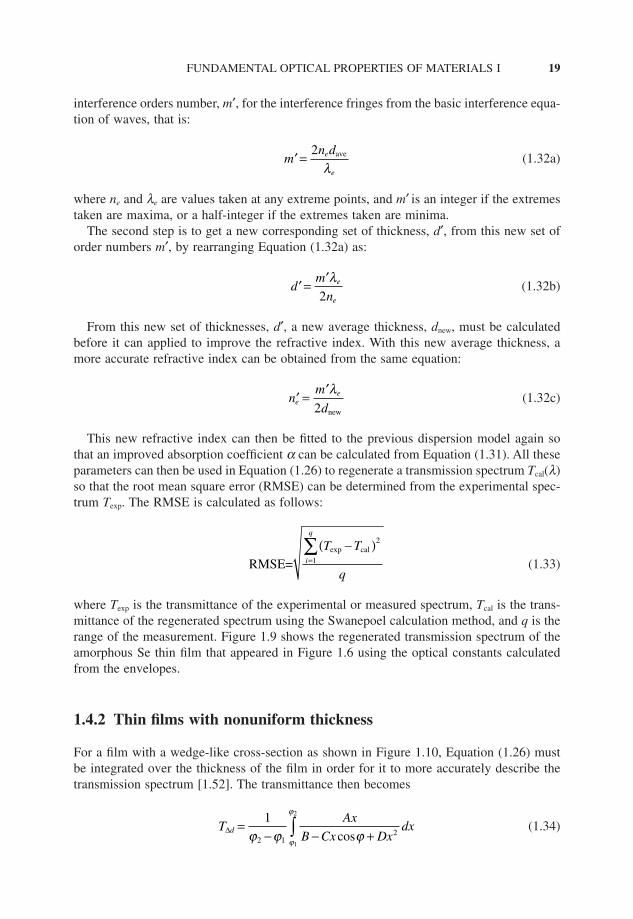
For a film with a wedge-like cross-section as shown in Figure 1.10, Equation (1.26) mustbe integrated over the thickness of the film in order for it to more accurately describe thetransmission spectrum [1.52]. The transmittance then becomes
(1.34)TAx
B Cx Dxdxd∆ =
− − +∫1
2 12
1
2
ϕ ϕ ϕϕ
ϕ
cos
RMSE=calT T
qi
q
exp −( )=∑ 2
1
′ = ′n
m
de
eλ2 new
′ = ′d
m
ne
e
λ2
′ =mn de
e
2 ave
λ
FUNDAMENTAL OPTICAL PROPERTIES OF MATERIALS I 19
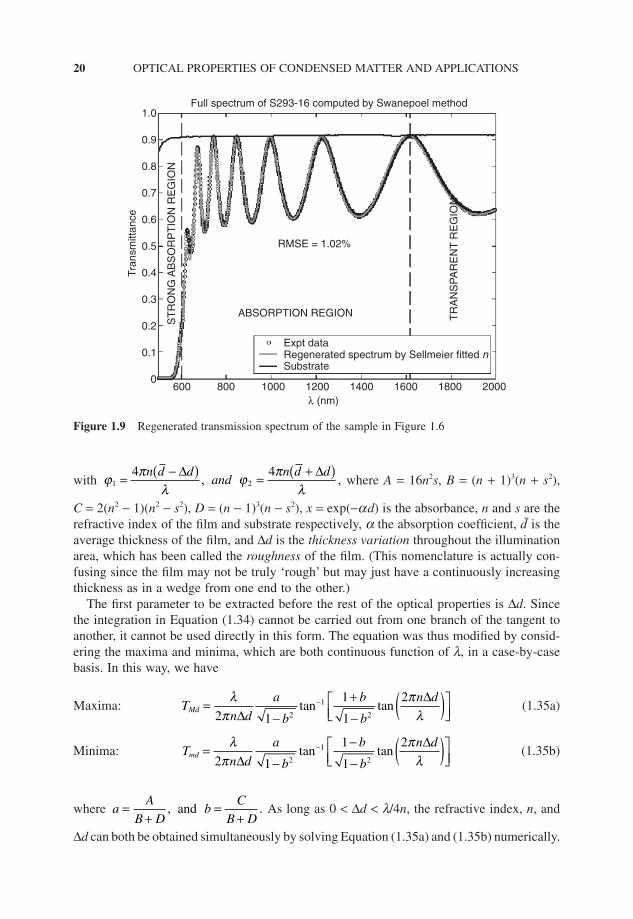
with where A = 16n2s, B = (n + 1)3(n + s2),
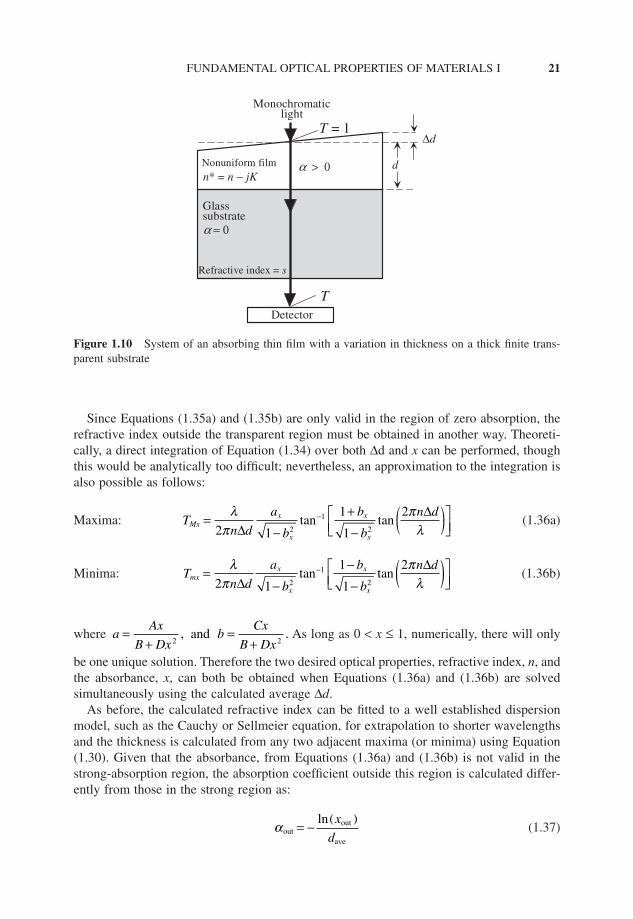
C = 2(n2 − 1)(n2 − s2), D = (n − 1)3(n − s2), x = exp(−ad) is the absorbance, n and s are therefractive index of the film and substrate respectively, a the absorption coefficient, d̄ is theaverage thickness of the film, and ∆d is the thickness variation throughout the illuminationarea, which has been called the roughness of the film. (This nomenclature is actually con-fusing since the film may not be truly ‘rough’ but may just have a continuously increasingthickness as in a wedge from one end to the other.)
The first parameter to be extracted before the rest of the optical properties is ∆d. Sincethe integration in Equation (1.34) cannot be carried out from one branch of the tangent toanother, it cannot be used directly in this form. The equation was thus modified by consid-ering the maxima and minima, which are both continuous function of l, in a case-by-casebasis. In this way, we have
Maxima: (1.35a)
Minima: (1.35b)
where As long as 0 < ∆d < l/4n, the refractive index, n, and
∆d can both be obtained simultaneously by solving Equation (1.35a) and (1.35b) numerically.
aA
B Db
C
B D=
+=
+, .and
Tn d
a
b
b
b
n dmd =
−−−
( )
−λπ
πλ2 1
1
1
22
1
2∆∆
tan tan
Tn d
a
b
b
b
n dMd =
−+−
( )
−λπ
πλ2 1
1
1
22
1
2∆∆
tan tan
j pl
j pl1 2
4 4= −( ) = +( )n d dand
n d d∆ ∆, ,
20 OPTICAL PROPERTIES OF CONDENSED MATTER AND APPLICATIONS
Full spectrum of S293-16 computed by Swanepoel method
RMSE = 1.02%
ABSORPTION REGION
ST
RO
NG
AB
SO
RP
TIO
N R
EG
ION
TR
AN
SP
AR
EN
T R
EG
ION
Expt data
SubstrateRegenerated spectrum by Sellmeier fitted n
600 800 1000 1200 1400 1600 1800 2000λ (nm)
1.0
0.9
0.8
0.7
0.6
0.5
0.4
0.3
0.2
0.1
0
Tran
smitt
ance
Figure 1.9 Regenerated transmission spectrum of the sample in Figure 1.6
Since Equations (1.35a) and (1.35b) are only valid in the region of zero absorption, therefractive index outside the transparent region must be obtained in another way. Theoreti-cally, a direct integration of Equation (1.34) over both ∆d and x can be performed, thoughthis would be analytically too difficult; nevertheless, an approximation to the integration isalso possible as follows:
Maxima: (1.36a)
Minima: (1.36b)
where As long as 0 < x ≤ 1, numerically, there will only
be one unique solution. Therefore the two desired optical properties, refractive index, n, andthe absorbance, x, can both be obtained when Equations (1.36a) and (1.36b) are solvedsimultaneously using the calculated average ∆d.
As before, the calculated refractive index can be fitted to a well established dispersionmodel, such as the Cauchy or Sellmeier equation, for extrapolation to shorter wavelengthsand the thickness is calculated from any two adjacent maxima (or minima) using Equation(1.30). Given that the absorbance, from Equations (1.36a) and (1.36b) is not valid in thestrong-absorption region, the absorption coefficient outside this region is calculated differ-ently from those in the strong region as:
(1.37)αoutout
ave
= −( )ln x
d
aAx
B Dxb
Cx
B Dx=
+=
+2 2, .and
Tn d
a
b
b
b
n dmx
x
x
x
x
=−
−−
( )
−λπ
πλ2 1
1
1
22
1
2∆∆
tan tan
Tn d
a
b
b
b
n dMx
x
x
x
x
=−
+−
( )
−λπ
πλ2 1
1
1
22
1
2∆∆
tan tan
FUNDAMENTAL OPTICAL PROPERTIES OF MATERIALS I 21
Monochromaticlight
Glasssubstrate
Nonuniform film
Detector
α = 0
n* = n − jKα > 0
T
T = 1
Refractive index = s
∆d
d
Figure 1.10 System of an absorbing thin film with a variation in thickness on a thick finite trans-parent substrate
where xout is the absorbance obtained from Equations (1.36a) and (1.36b) and dave is theaverage thickness.
According to Swanepoel, in the region of strong absorption, the interference fringes aresmaller and the spectrum approaches the interference-free transmission sooner. Since thetransmission spectra in this region are the same for any film with the same average thick-ness, regardless of its uniformity, the absorption coefficient in the strong region will thus be
(1.38)
where and TM and Tm are the envelopes
constructed from the measured spectrum.The accuracy of the thickness and refractive index can be further improved in exactly the
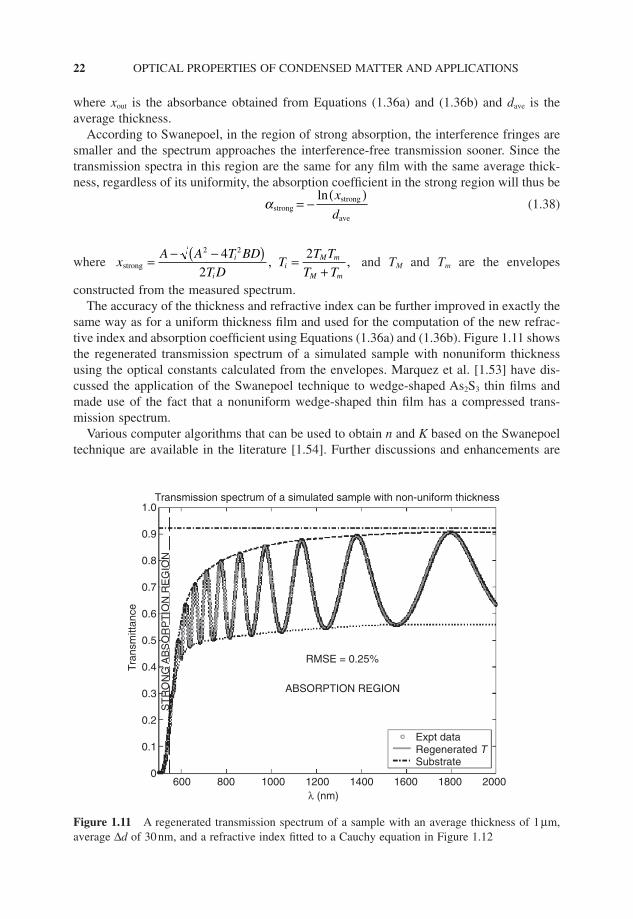
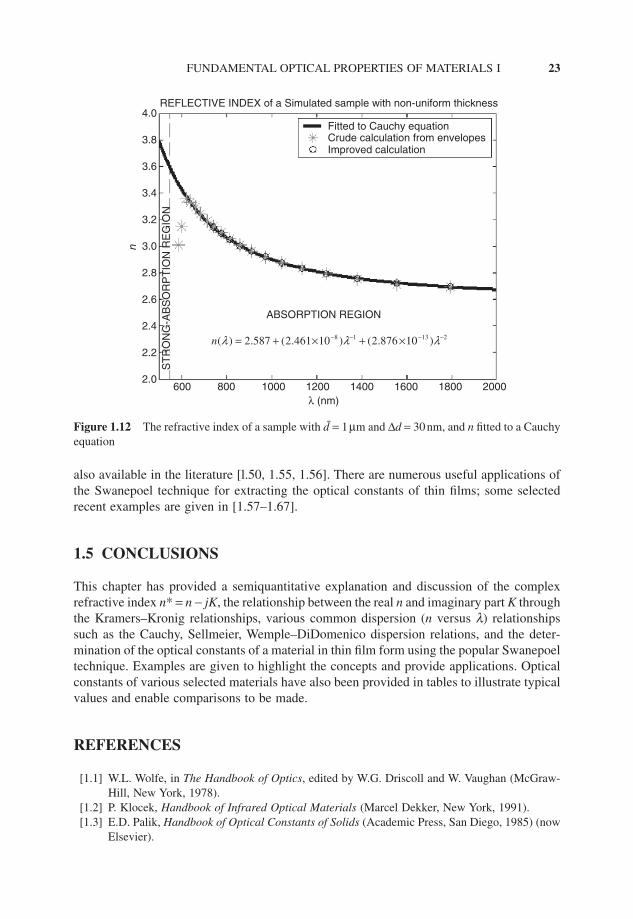
same way as for a uniform thickness film and used for the computation of the new refrac-tive index and absorption coefficient using Equations (1.36a) and (1.36b). Figure 1.11 showsthe regenerated transmission spectrum of a simulated sample with nonuniform thicknessusing the optical constants calculated from the envelopes. Marquez et al. [1.53] have dis-cussed the application of the Swanepoel technique to wedge-shaped As2S3 thin films andmade use of the fact that a nonuniform wedge-shaped thin film has a compressed trans-mission spectrum.
Various computer algorithms that can be used to obtain n and K based on the Swanepoeltechnique are available in the literature [1.54]. Further discussions and enhancements are
xA A T BD
T DT
T T
T Ti
ii
M m
M mstrong = − −( ) =
+
2 24
2
2, ,
αstrongstrong
ave
= −( )ln x
d
22 OPTICAL PROPERTIES OF CONDENSED MATTER AND APPLICATIONS
Transmission spectrum of a simulated sample with non-uniform thickness
ABSORPTION REGION
RMSE = 0.25%
ST
RO
NG
AB
SO
RP
TIO
N R
EG
ION
Expt data
SubstrateRegenerated T
600 800 1000 1200 1400 1600 1800 2000λ (nm)
1.0
0.9
0.8
0.7
0.6
0.5
0.4
0.3
0.2
0.1
0
Tran
smitt
ance
Figure 1.11 A regenerated transmission spectrum of a sample with an average thickness of 1 µm,average ∆d of 30nm, and a refractive index fitted to a Cauchy equation in Figure 1.12
also available in the literature [l.50, 1.55, 1.56]. There are numerous useful applications ofthe Swanepoel technique for extracting the optical constants of thin films; some selectedrecent examples are given in [1.57–1.67].
1.5 CONCLUSIONS
This chapter has provided a semiquantitative explanation and discussion of the complexrefractive index n* = n − jK, the relationship between the real n and imaginary part K throughthe Kramers–Kronig relationships, various common dispersion (n versus l) relationshipssuch as the Cauchy, Sellmeier, Wemple–DiDomenico dispersion relations, and the deter-mination of the optical constants of a material in thin film form using the popular Swanepoeltechnique. Examples are given to highlight the concepts and provide applications. Opticalconstants of various selected materials have also been provided in tables to illustrate typicalvalues and enable comparisons to be made.
REFERENCES
[1.1] W.L. Wolfe, in The Handbook of Optics, edited by W.G. Driscoll and W. Vaughan (McGraw-Hill, New York, 1978).
[1.2] P. Klocek, Handbook of Infrared Optical Materials (Marcel Dekker, New York, 1991).[1.3] E.D. Palik, Handbook of Optical Constants of Solids (Academic Press, San Diego, 1985) (now
Elsevier).
FUNDAMENTAL OPTICAL PROPERTIES OF MATERIALS I 23
21318 )10876.2()10461.2(587.2)( −−−− ×+×+= λλλn
REFLECTIVE INDEX of a Simulated sample with non-uniform thickness
Fitted to Cauchy equationCrude calculation from envelopesImproved calculation
ABSORPTION REGION
ST
RO
NG
-AB
SO
RP
TIO
N R
EG
ION
600 800 1000 1200 1400 1600 1800 2000λ (nm)
4.0
3.8
3.6
3.4
3.2
3.0
2.8
2.6
2.4
2.2
2.0
n
Figure 1.12 The refractive index of a sample with d̄ = 1µm and ∆d = 30nm, and n fitted to a Cauchyequation
[1.4] E.D. Palik, Handbook of Optical Constants of Solids II (Academic Press, San Diego, 1991)(now Elsevier).
[1.5] L. Ward, The Optical Constants of Bulk Materials and Films (Institute of Physics Publishing,Bristol, 1994) (reprint 1998).
[1.6] A.M. Efimov, Optical Constants of Inorganic Glasses (CRC Press, Boca Raton, 1995).[1.7] E.D. Palik and G.K. Ghosh, Handbook of Optical Constants of Solids, Vols 1–5 (Academic
Press, San Diego, 1997) (now Elsevier).[1.8] D. Nikogosyan, Properties of Optical and Laser-Related Materials: A Handbook (John Wiley
& Sons, Inc., New York, 1997).[1.9] J.H. Weaver and H.P.R. Frederikse, in CRC Handbook of Chemistry and Physics, Editor in
Chief D.R. Lide (CRC Press, Boca Raton, 1999), Ch. 12.[1.10] S. Adachi, Physical Properties of III-V Semiconductor Compounds (John Wiley & Sons, Inc.,
New York, 1992).[1.11] S. Adachi, Optical Constants in Crystalline and Amorphous Semiconductors: Numerical Data
and Graphical Information (Kluwer Academic Publishers, Boston, 1999).[1.12] S. Adachi, Properties of Group-IV, III-V and II-VI Semiconductors (John Wiley & Sons, Ltd,
Chichester, 2005).[1.13] O. Madelung, Semiconductors: Data Handbook, 3rd Edition (Springer-Verlag, New York,
2004).[1.14] H.S. Nalwa, Handbook of Advanced Electronic and Photonic Materials and Devices, Vols 1–10
(Academic Press, San Diego, 2001) (now Elsevier).[1.15] M.J. Weber, Handbook of Optical Materials (CRC Press, Boca Raton, 2003).[1.16] W. Martienssen and H. Walimont, Springer Handbook of Condensed Matter and Materials
Data (Springer, Heidelberg, 2005), Ch. 3.4, 4.1, 4.4.[1.17] S.O. Kasap and P. Capper, Springer Handbook of Electronic and Photonic Materials (Springer,
Heidelberg, 2006), Ch. 3.[1.18] J.H. Simmons and K.S. Potter, Optical Materials (Academic Press, San Diego, 2000) (now
Elsevier).[1.19] R.W. Collins, ‘Ellipsometery’ in The Optics Encyclopedia, Vol. 1, edited by T.G. Brown, K.
Creath, H. Kogelnik, M.A. Kriss, J. Schmit, and M.J. Weber (Wiley-VCH, Weinheim, 2004),p. 609.
[1.20] S.O. Kasap, Principles of Electronic Materials and Devices, 3rd Edition (McGraw-Hill,Boston, 2005), Ch. 7 and Ch. 9.
[1.21] M. Fox, Optical Properties of Solids (Oxford University Press, Oxford, 2001).[1.22] Y. Toyozawa, Optical Processes in Solids (Cambridge University Press, Cambridge, 2003).[1.23] R. Kronig, J. Opt. Soc. Am., 12, 547 (1926).[1.24] H.A. Kramers, Estratto Dagli Atti del Congresso Internazionale de Fisici, 2, 545 (1927).[1.25] D.Y. Smith and E. Shiles, Phys. Rev. B, 17, 4689 (1978).[1.26] A.L. Cauchy, Bull. Sci. Math., 14, 6 (1830).[1.27] A.L. Cauchy, M’emoire sur la Dispersion de la Lumiere (Calve, Prague, 1836).[1.28] D.Y. Smith, M. Inokuti, and W. Karstens, J. Phys.: Cond. Matt., 13, 3883 (2001).[1.29] J.W. Fleming, Appl. Optics, 23, 4486 (1984).[1.30] K.L. Wolf and K.F. Herzfeld, Handbooch der Physik, edited by H. Geiger and K. Scheel
(Springer Verlag, Berlin, 1928), Vol. 20, Ch. 10.[1.31] M. Herzberger, Opt. Acta, 6, 197 (1959).[1.32] H. Bachs and N. Neuroth, Schott Series on Glass and Glass Ceramics (Springer, Heidelberg,
1995).[1.33] N.J. Kreidl and D.R. Uhlmann, Optical Properties of Glass (The American Ceramic Society,
1991).[1.34] G. Ghosh, M. Endo, and T. Iwasaki, J. Light Wave Technol., 12, 1338 (1994).[1.35] G. Ghosh, Appl. Optics, 36, 1540 (1997).
24 OPTICAL PROPERTIES OF CONDENSED MATTER AND APPLICATIONS
[1.36] G. Ghosh, Phys. Rev. B, 14, 8178 (1998).[1.37] G. Hawkins and R. Hunneman, Infrared Phys. Technol., 45, 69 (2004).[1.38] A.R. Forouhi and I. Bloomer, Phys. Rev. B, 34, 7018 (1986).[1.39] A.R. Forouhi and I. Bloomer, Phys. Rev. B, 38, 1865 (1988).[1.40] Y.F. Chen, C.M. Kwei, and C.J. Tung, Phys. Rev. B, 48, 4373 (1993).[1.41] S. Adachi, Phys. Rev. B, 35, 123161 (1987).[1.42] S. Adachi, Phys. Rev. B, 38, 12966 (1988).[1.43] S. Adachi, H. Mori, and S. Ozaki, Phys. Rev. B, 66, 153201 (2002).[1.44] S. Adachi, Phys. Rev. B, 43, 123161 (1991).[1.45] P.J.L. Hervé and L.K.J. Vandamme, J. Appl. Phys., 77, 5476 (1996).[1.46] D. Dale and F. Gladstone, Phil. Trans., 148, 887 (1858).[1.47] D. Dale and F. Gladstone, Phils. Trans., 153, 317 (1863).[1.48] S.H. Wemple and M. DiDomenico, Phys. Rev. B, 3, 1338 (1971).[1.49] O.S. Heavens, Optical Properties of Thin Solid Films (Dover Publications, New York, 1965
and 1991).[1.50] D. Poelmen and P.F. Smet, J. Phys. D: Appl. Phys., 36 1850 (2003).[1.51] R. Swanepoel, J. Phys. E: Sci. Instrum., 16, 1214 (1983).[1.52] R. Swanepoel, J. Phys. E: Sci. Instrum., 17, 896 (1984).[1.53] E. Marquez, J.B. Ramirez-Malo, P. Villares, R. Jimenez-Garay, and R. Swanepoel, Thin Solid
Films, 254, 83 (1995).[1.54] A.P. Caricato, A. Fazzi, and G. Leggieri, Appl. Surf. Sci., 248, 440 (2005) and references
therein.[1.55] I. Chambouleyron, S.D. Ventura, E.G. Birgin, and J.M. Martínez, J. Appl. Phys., 92, 3093
(2002) and references therein.[1.56] K. Ayadi and N. Haddaoui, J. Mater Sci.: Mater. Electron., 11, 163 (2000).[1.57] E. Marquez, J. Ramirez-Malo, P. Villares, R. Jimenez-Garay, P.J.S. Ewen, and A.E. Owen, J.
Phys. D, 25, 535 (1992).[1.58] E. Márquez, J.M. González-Leal, R. Prieto-Alcón, M. Vlcek, A. Stronski, T. Wagner, and D.
Minkov, Appl. Phys. A: Mater. Sci. Process., 67, 371 (1998).[1.59] J.M. Gonzalez-Leal, A. Ledesma, A.M. Bernal-Oliva, R. Prieto-Alcon, E. Marquez, J.A. Angel,
and J. Carabe, Mater. Lett., 39, 232 (1999).[1.60] E. Marquez, A.M. Bernal-Oliva, J.M. González-Leal, R. Prieto-Alcon, A. Ledesma, R.
Jimenez-Garay, and I. Martil, Mater. Chem. Phys., 60, 231 (1999).[1.61] A.H. Moharram, A.A. Othman, and M.A. Osman, Appl. Surf. Sci., 200, 143 (2002).[1.62] N.A. Bakr, H. El-Hadidy, M. Hammam, and M.D. Migahed, Thin Solid Films, 424, 296 (2003).[1.63] J.M. González-Leal, R. Prieto-Alcon, J.A. Angel, and E. Marquez, J. Non-Crystalline Solids,
315, 134 (2003).[1.64] S.M. El-Sayed and G.A.M. Amin, ND&E International, 38, 113 (2005).[1.65] N. Tigau, V. Ciupina, and G. Prodan, J. Cryst. Growth, 277, 529 (2005).[1.66] S.A. Fayek and S.M. El-Sayed, ND&E International, 39, 39 (2006).[1.67] J. Sanchez-Gonzalez, A. Diaz-Parralejo, A.L. Ortiz, and F. Guiberteau, Appl. Surf. Sci., in press
(2006).
FUNDAMENTAL OPTICAL PROPERTIES OF MATERIALS I 25
