1 julian dyke independent consultant oracle diagnostics web version juliandyke.com © 2005 julian...
TRANSCRIPT

1
Julian Dyke
Independent Consultant
OracleDiagnostics
Web Version
juliandyke.com
© 2005 Julian Dyke
2
juliandyke.com
© 2005 Julian Dyke
Warning Much of the content of this presentation is undocumented
and unsupported by Oracle
Check with Oracle support before using any of these features in a production environment

3
juliandyke.com
© 2005 Julian Dyke
Trace Parameters To include timed statistics in trace files
timed_statistics = TRUE
To specify the log file destination
_trace_files_public = TRUE
max_dump_file_size = <size>
user_dump_dest = '<directory_name>'background_dump_dest = '<directory_name'>
To specify maximum trace file size
To allow other users to read trace files

4
juliandyke.com
© 2005 Julian Dyke
Trace File Identifier In Oracle 8.1.7 and above, a trace file identifier can be
specified
tracefile_identifier = '<identifier>'
e.g. in Oracle 9.2 if a trace file is called
ss92001_ora_1760.trc
ss92001_ora_1760_test.trc
then the statement
will change the file name to
ALTER SESSION SET tracefile_identifier = 'test';

5
juliandyke.com
© 2005 Julian Dyke
Trace File Names In Oracle 9.2 foreground process trace file names are in the
following formats
Process Type Name
ss92001_ora_1234.trc Foreground Process
ss92001_p000_1234.trc Parallel execution slave
ss92001_j000_1234.trc Job queue process
ss92001_d000_1234.trc Dispatcher process
ss92001_s000_1234.trc Shared Server process
These trace files are written to the USER_DUMP_DEST directory In Oracle 9.2 background process trace file names are in the format
ss92001_<process_name>_1234.trc
These trace files are written to the BACKGROUND_DUMP_DEST directory
6
juliandyke.com
© 2005 Julian Dyke
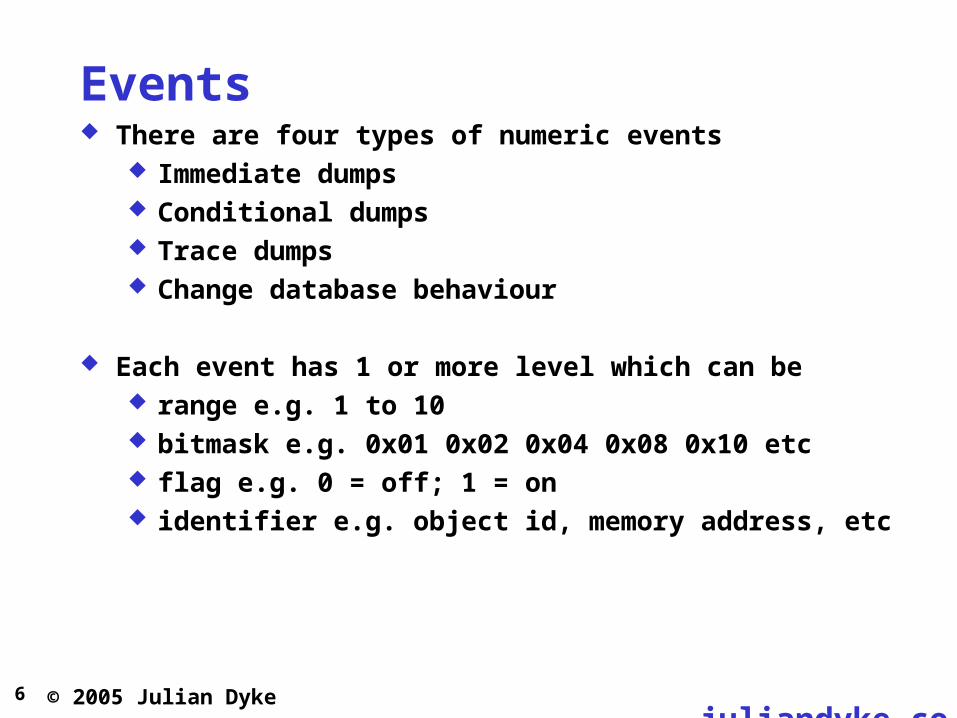
Events There are four types of numeric events
Immediate dumps Conditional dumps Trace dumps Change database behaviour
Each event has 1 or more level which can be range e.g. 1 to 10 bitmask e.g. 0x01 0x02 0x04 0x08 0x10 etc flag e.g. 0 = off; 1 = on identifier e.g. object id, memory address, etc
7
juliandyke.com
© 2005 Julian Dyke
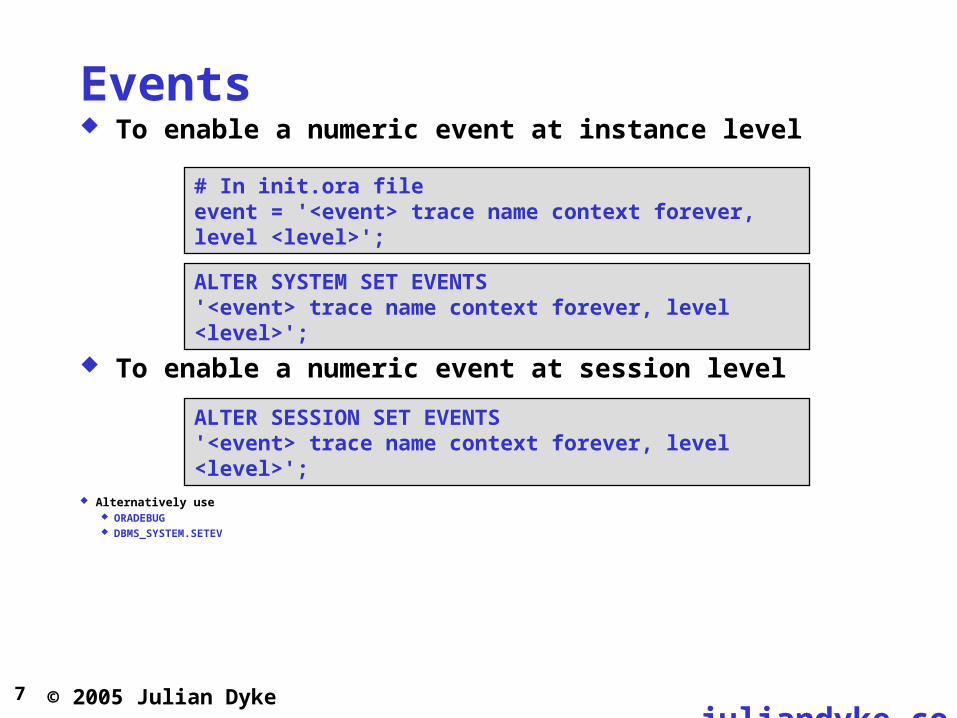
Events To enable a numeric event at instance level
# In init.ora fileevent = '<event> trace name context forever, level <level>';
ALTER SYSTEM SET EVENTS'<event> trace name context forever, level <level>';
To enable a numeric event at session level
ALTER SESSION SET EVENTS'<event> trace name context forever, level <level>';
Alternatively use ORADEBUG DBMS_SYSTEM.SETEV
8
juliandyke.com
© 2005 Julian Dyke
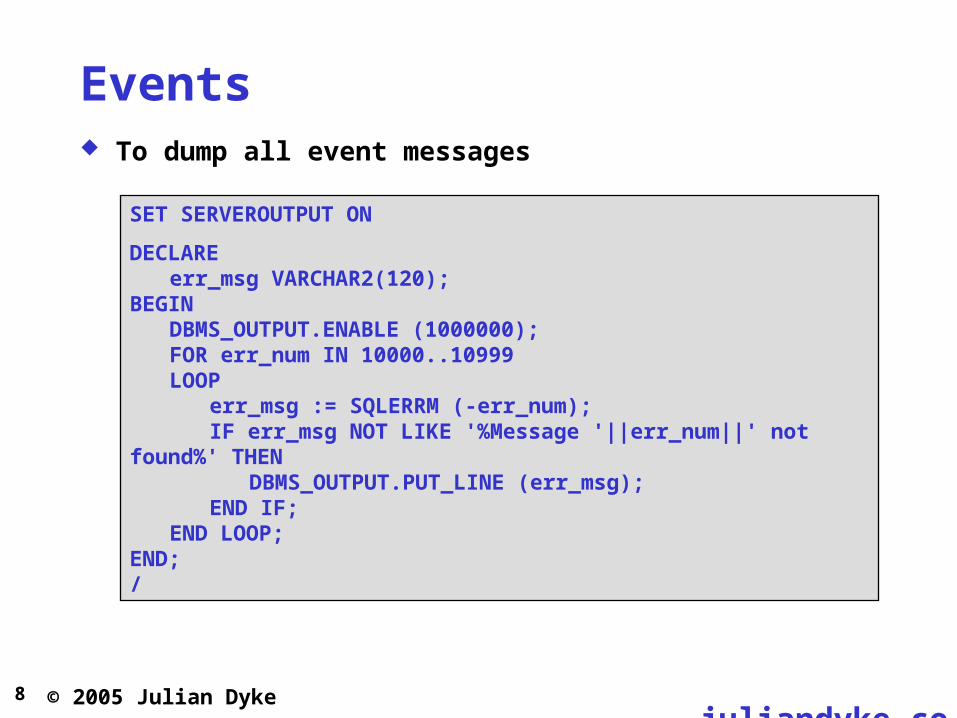
Events To dump all event messages
SET SERVEROUTPUT ON
DECLAREerr_msg VARCHAR2(120);
BEGINDBMS_OUTPUT.ENABLE (1000000);FOR err_num IN 10000..10999 LOOP
err_msg := SQLERRM (-err_num);IF err_msg NOT LIKE '%Message '||err_num||' not found%' THEN
DBMS_OUTPUT.PUT_LINE (err_msg);END IF;
END LOOP;END;/

9
juliandyke.com
© 2005 Julian Dyke
Events On Unix systems event messages are in the formatted text file
event=10000while [ $event -ne 10999 ]do
event=`expr $event + 1`oerr ora $event
done
To print detailed event messages (Unix only)
$ORACLE_HOME/rdbms/mesg/oraus.msg
10 juliandyke.co
m
© 2005 Julian Dyke
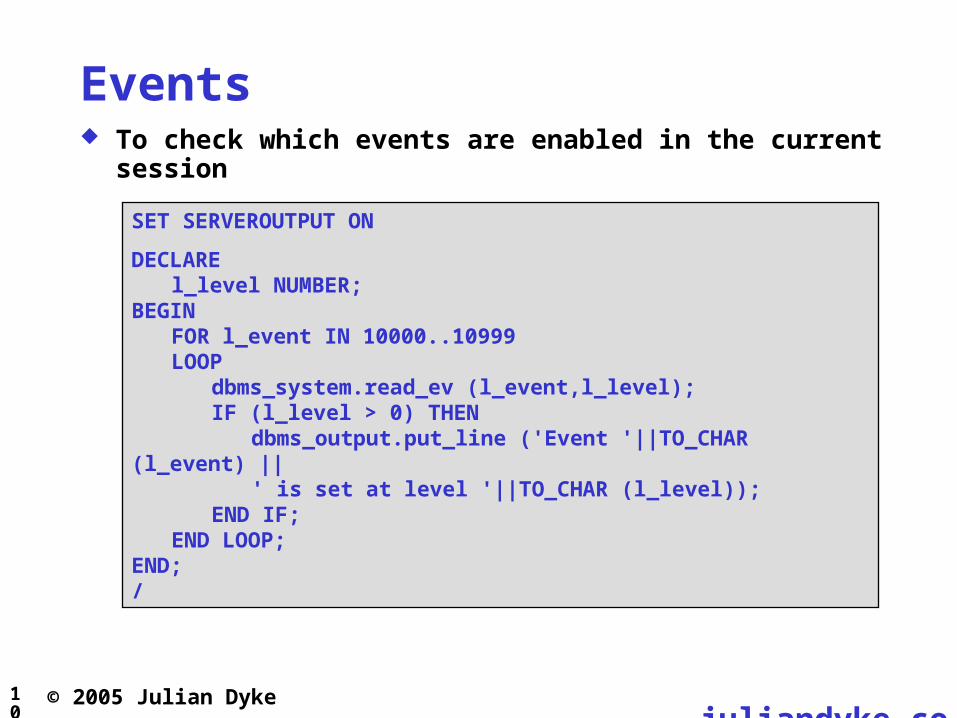
Events To check which events are enabled in the current session
SET SERVEROUTPUT ON
DECLAREl_level NUMBER;
BEGINFOR l_event IN 10000..10999 LOOP
dbms_system.read_ev (l_event,l_level);IF (l_level > 0) THEN
dbms_output.put_line ('Event '||TO_CHAR (l_event) ||' is set at level '||TO_CHAR (l_level));
END IF;END LOOP;
END;/
11
juliandyke.com
© 2005 Julian Dyke
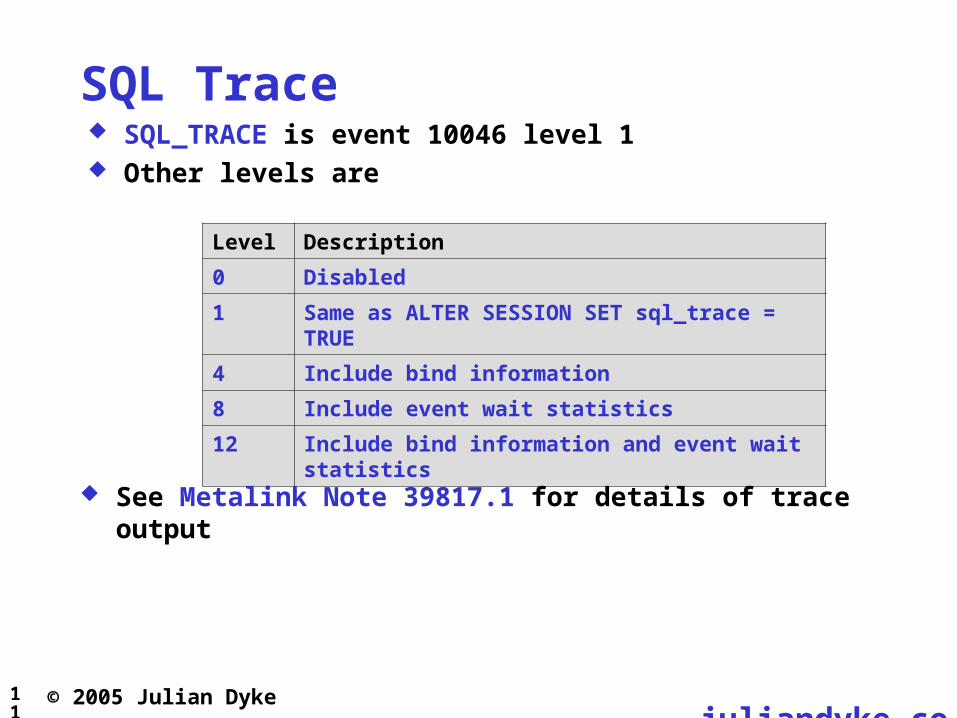
SQL Trace SQL_TRACE is event 10046 level 1 Other levels are
Level Description
0 Disabled
1 Same as ALTER SESSION SET sql_trace = TRUE
4 Include bind information
8 Include event wait statistics
12 Include bind information and event wait statistics
See Metalink Note 39817.1 for details of trace output

12 juliandyke.co
m
© 2005 Julian Dyke
Optimiser Decisions To trace the computations performed by the CBO when
optimising SQL statements use
ALTER SESSION SET EVENTS '10053 TRACE NAME CONTEXT FOREVER, LEVEL <level>';
Level Description
1 Print statistics and computations
2 Print computations only
See "A Look under the Hood of CBO : The 10053 Event"Wolfgang Breitling - www.centrexcc.com

13 juliandyke.co
m
© 2005 Julian Dyke
Events Tracing SQL Execution
10032 Sorts 10
10033 Intermediate Sort Runs 10
10104 Hash Joins 10
10128 Partition Pruning
10224 Index Blocks Splits / Deletes 1
10270 Shared Cursors 1
10299 Prefetching 1
10357 Direct Path Load 1
10730 VPD/FGAC/RLS predicates 1
10731 CURSOR expressions 1
Tracing Parallel Execution
10390 Parallel Query Slave Execution
10391 Parallel Query Granule Assignment
10393 Parallel Query Statistics

14 juliandyke.co
m
© 2005 Julian Dyke
Events Tracing Bitmap Indexes
10608 Bitmap Index Creation 10
10710 Bitmap Index Access 1
10711 Bitmap Index Merge 1
10712 Bitmap Index Or 1
10713 Bitmap Index And 1
10714 Bitmap Index Minus 1
10715 Bitmap Index Conversion to ROWIDs 1
10716 Bitmap Index Compress/Decompress 1
10717 Bitmap Index Compaction 1
10719 Bitmap Index DML 1
10608 Bitmap Index Creation 1
10710 Bitmap Index Access 1
Tracing Remote Processing
10079 Data sent/received via SQL*Net 1
10241 Remote SQL Execution 10
15 juliandyke.co
m
© 2005 Julian Dyke
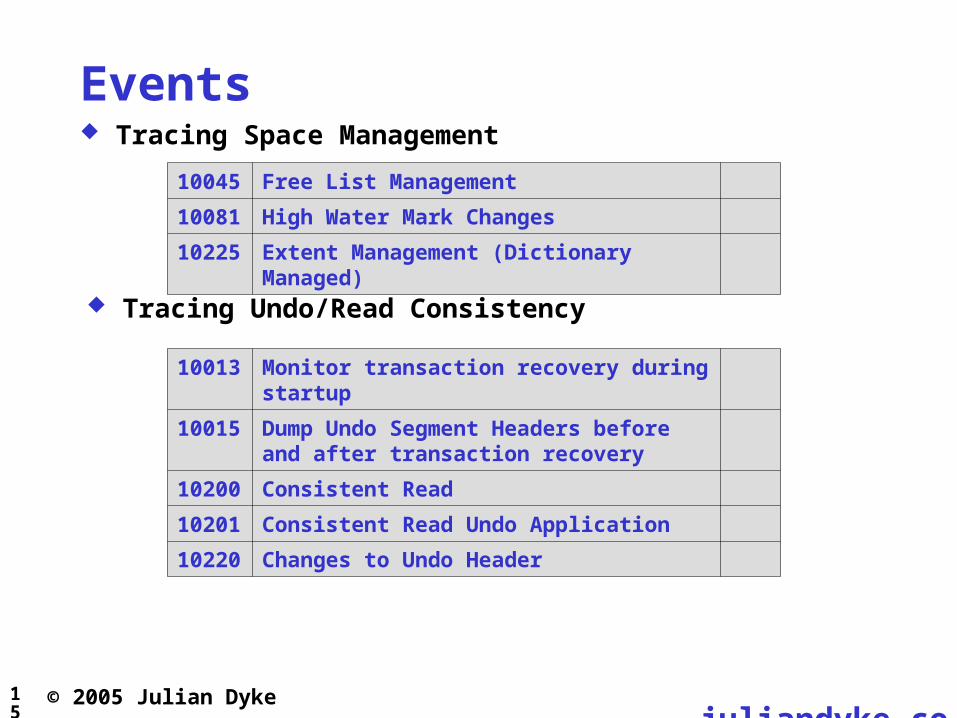
Events Tracing Space Management
10045 Free List Management
10081 High Water Mark Changes
10225 Extent Management (Dictionary Managed)
Tracing Undo/Read Consistency
10013 Monitor transaction recovery during startup
10015 Dump Undo Segment Headers before and after transaction recovery
10200 Consistent Read
10201 Consistent Read Undo Application
10220 Changes to Undo Header
16 juliandyke.co
m
© 2005 Julian Dyke
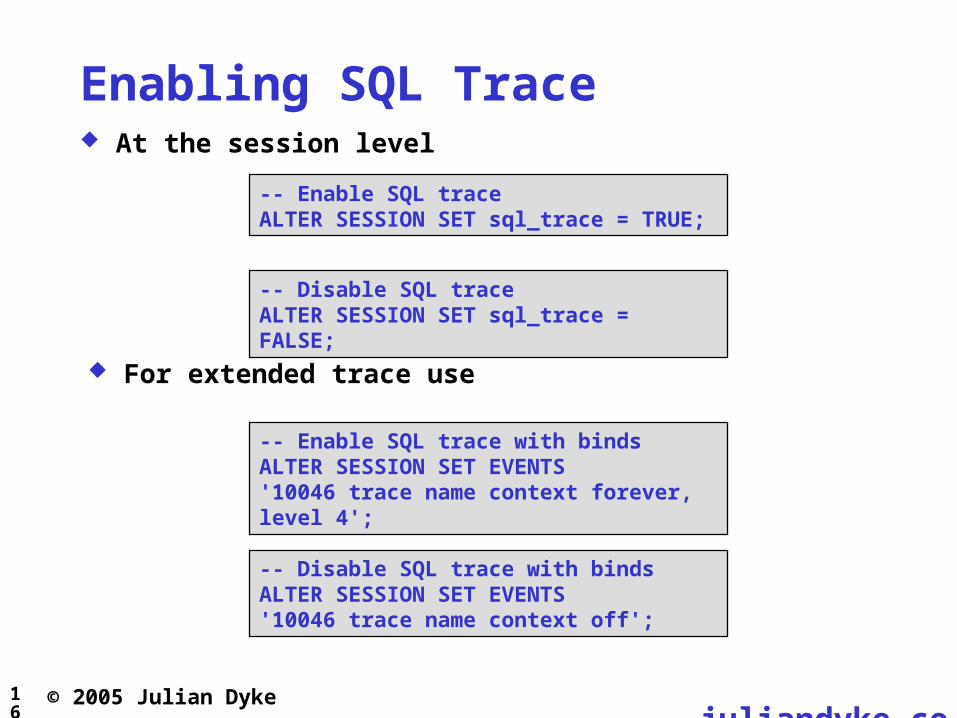
Enabling SQL Trace At the session level
For extended trace use
-- Enable SQL traceALTER SESSION SET sql_trace = TRUE;
-- Enable SQL trace with bindsALTER SESSION SET EVENTS'10046 trace name context forever, level 4';
-- Disable SQL traceALTER SESSION SET sql_trace = FALSE;
-- Disable SQL trace with bindsALTER SESSION SET EVENTS'10046 trace name context off';

17 juliandyke.co
m
© 2005 Julian Dyke
Enabling SQL Trace To enable at instance level
# Enable SQL tracesql_trace = TRUE
# Enable SQL*trace with bindsevent = '10046 trace name context forever, level 4';
The SQL_TRACE parameter cannot be modified directly using ALTER SYSTEM. Instead use
-- Enable SQL trace for instance ALTER SYSTEM SET EVENTS'10046 trace name context forever, level 1;
-- Disable SQL trace for instanceALTER SYSTEM SET EVENTS'10046 trace name context off';
18 juliandyke.co
m
© 2005 Julian Dyke
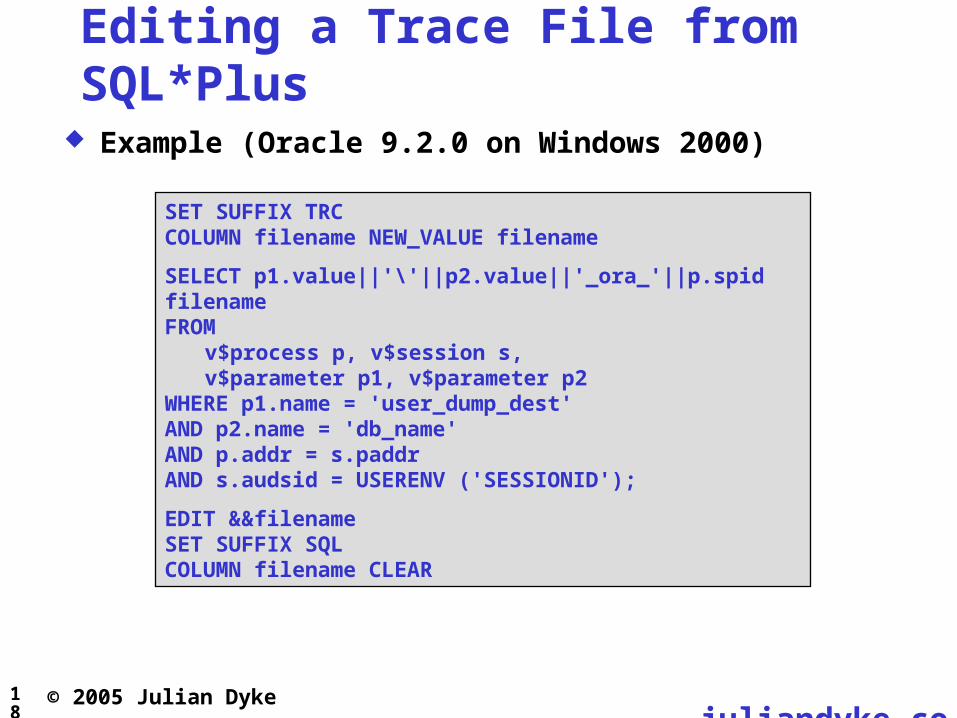
Editing a Trace File from SQL*Plus Example (Oracle 9.2.0 on Windows 2000)
SET SUFFIX TRCCOLUMN filename NEW_VALUE filename
SELECT p1.value||'\'||p2.value||'_ora_'||p.spid filenameFROM
v$process p, v$session s, v$parameter p1, v$parameter p2
WHERE p1.name = 'user_dump_dest'AND p2.name = 'db_name'AND p.addr = s.paddrAND s.audsid = USERENV ('SESSIONID');
EDIT &&filenameSET SUFFIX SQLCOLUMN filename CLEAR
19 juliandyke.co
m
© 2005 Julian Dyke
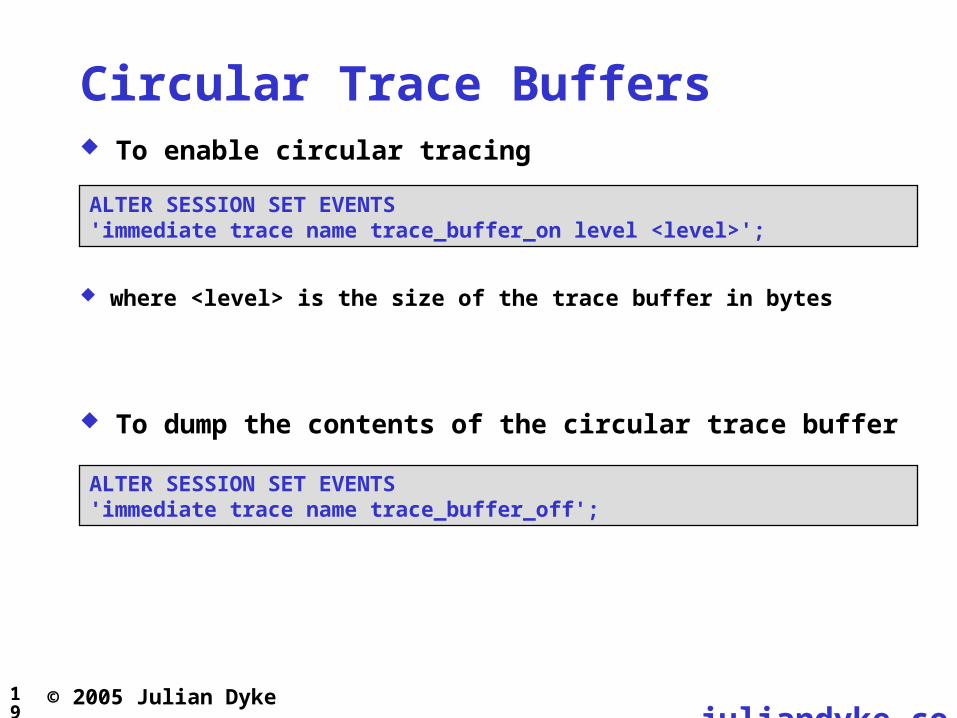
Circular Trace Buffers To enable circular tracing
ALTER SESSION SET EVENTS 'immediate trace name trace_buffer_on level <level>';
where <level> is the size of the trace buffer in bytes
To dump the contents of the circular trace buffer
ALTER SESSION SET EVENTS 'immediate trace name trace_buffer_off';

20 juliandyke.co
m
© 2005 Julian Dyke
DBMS_SESSION Event 10046 level 1 trace can be enabled using
DBMS_SESSION.SET_SQL_TRACE( FLAG BOOLEAN -- TRUE to enable;
-- FALSE to disable );
Useful within PL/SQL blocks ALTER SESSION privilege not required
21 juliandyke.co
m
© 2005 Julian Dyke
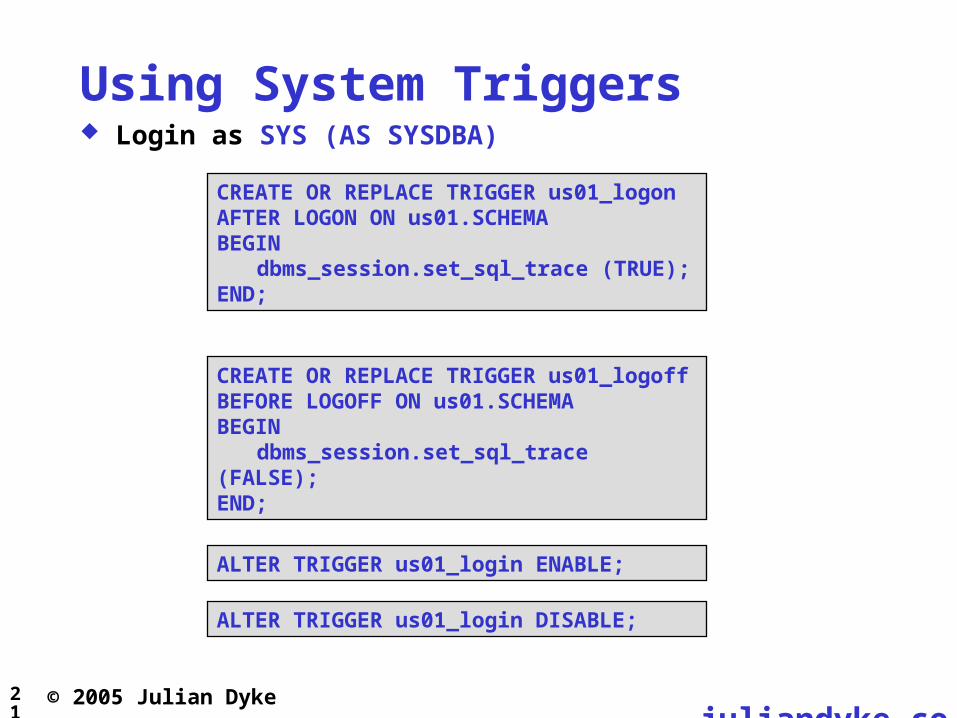
Using System Triggers Login as SYS (AS SYSDBA)
ALTER TRIGGER us01_login ENABLE;
CREATE OR REPLACE TRIGGER us01_logoffBEFORE LOGOFF ON us01.SCHEMABEGIN
dbms_session.set_sql_trace (FALSE);END;
CREATE OR REPLACE TRIGGER us01_logonAFTER LOGON ON us01.SCHEMABEGIN
dbms_session.set_sql_trace (TRUE);END;
ALTER TRIGGER us01_login DISABLE;
22 juliandyke.co
m
© 2005 Julian Dyke
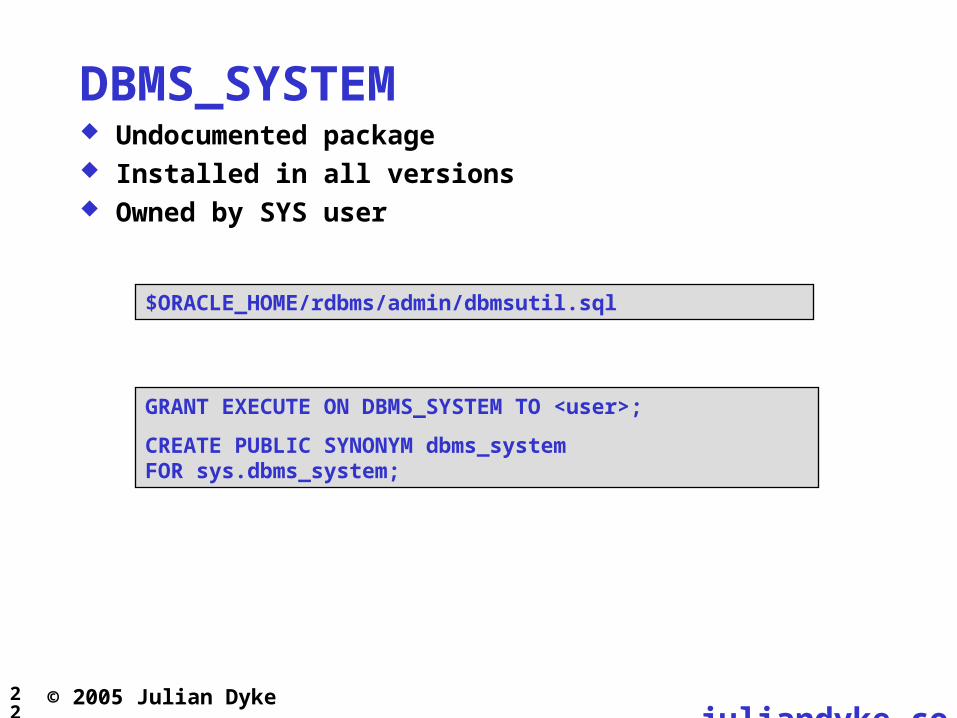
DBMS_SYSTEM Undocumented package Installed in all versions Owned by SYS user
GRANT EXECUTE ON DBMS_SYSTEM TO <user>;
CREATE PUBLIC SYNONYM dbms_system FOR sys.dbms_system;
$ORACLE_HOME/rdbms/admin/dbmsutil.sql
23 juliandyke.co
m
© 2005 Julian Dyke
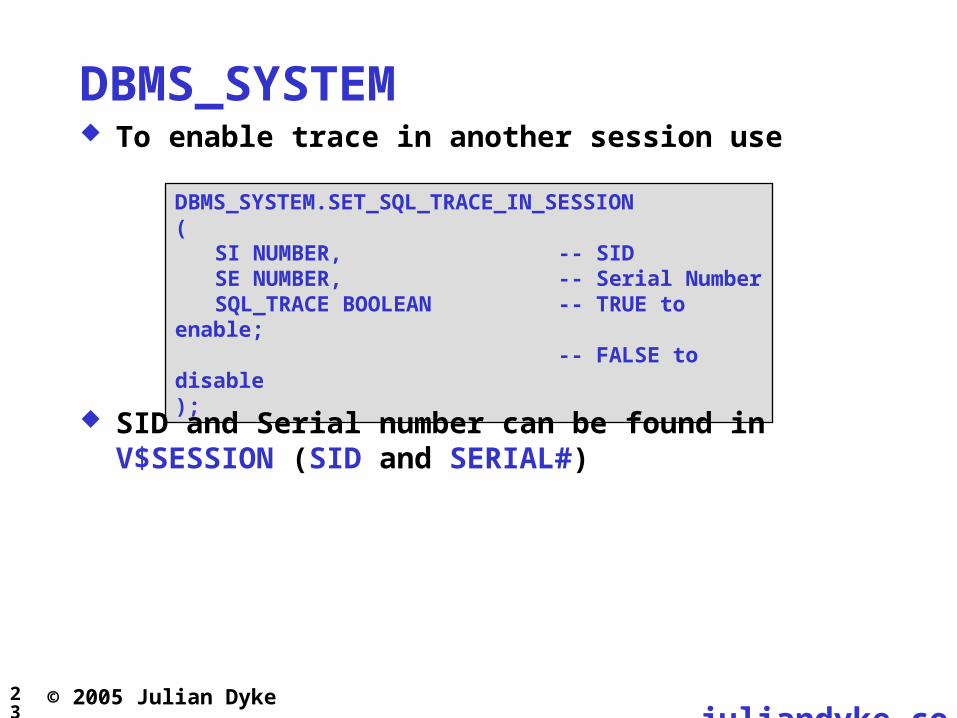
DBMS_SYSTEM To enable trace in another session use
DBMS_SYSTEM.SET_SQL_TRACE_IN_SESSION( SI NUMBER, -- SID
SE NUMBER, -- Serial Number SQL_TRACE BOOLEAN -- TRUE to enable;
-- FALSE to disable );
SID and Serial number can be found in V$SESSION (SID and SERIAL#)
24 juliandyke.co
m
© 2005 Julian Dyke
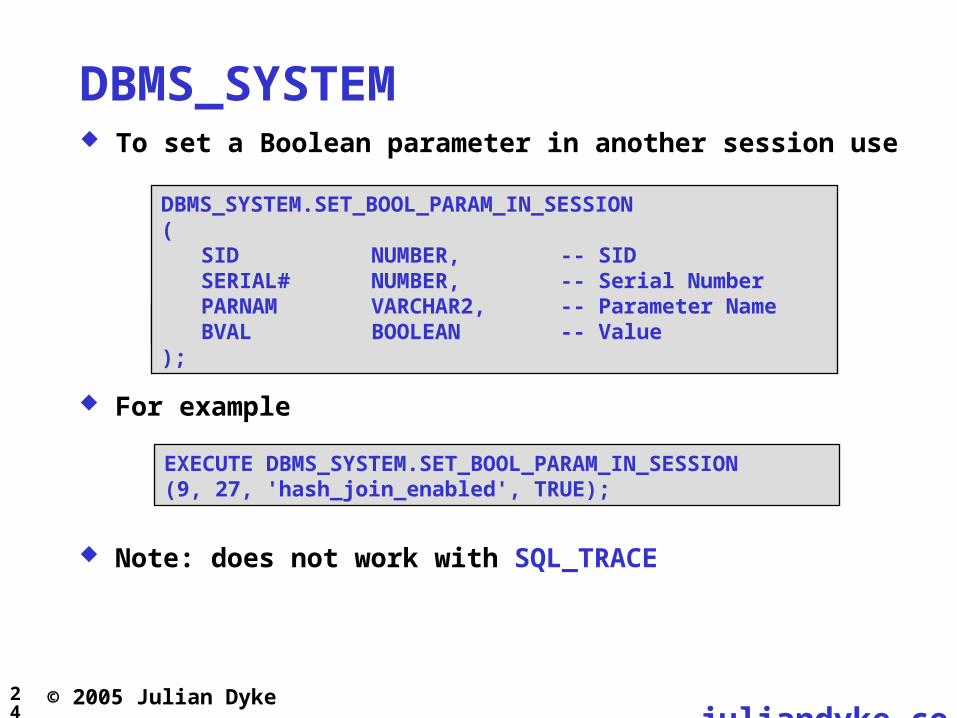
To set a Boolean parameter in another session use
ORADEBUG SUSPEND
For example
SET_BOOL_PARAM_IN_SESSION
DBMS_SYSTEM.SET_BOOL_PARAM_IN_SESSION( SID NUMBER, -- SID
SERIAL# NUMBER, -- Serial NumberPARNAM VARCHAR2, -- Parameter NameBVAL BOOLEAN -- Value
);
EXECUTE DBMS_SYSTEM.SET_BOOL_PARAM_IN_SESSION(9, 27, 'hash_join_enabled', TRUE);
Note: does not work with SQL_TRACE
DBMS_SYSTEM
25 juliandyke.co
m
© 2005 Julian Dyke
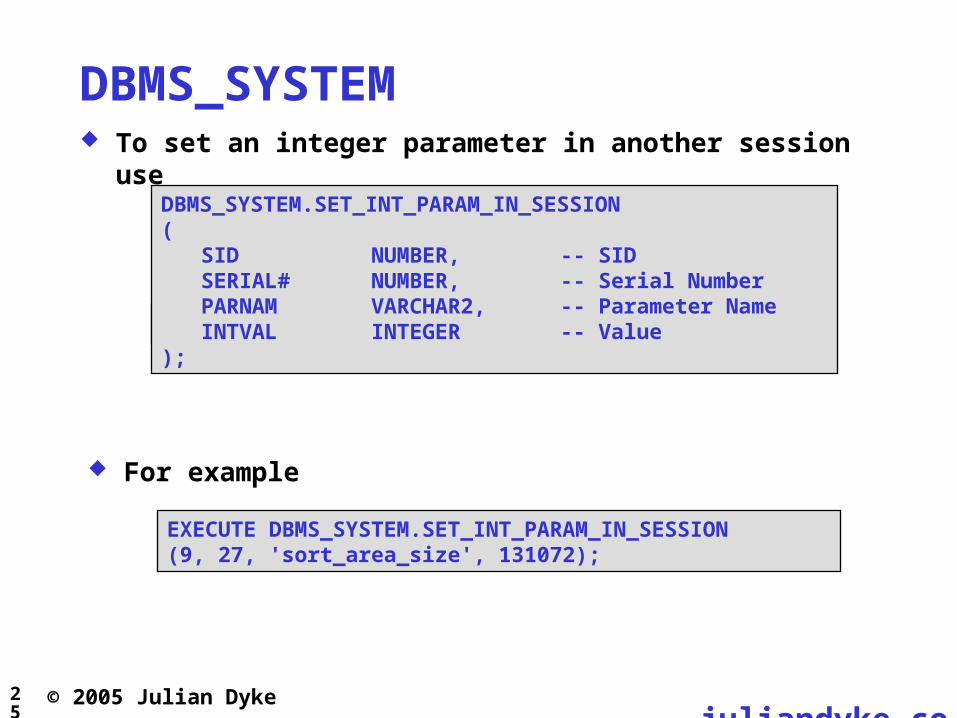
To set an integer parameter in another session use
ORADEBUG SUSPEND
For example
SET_BOOL_PARAM_IN_SESSION
DBMS_SYSTEM.SET_INT_PARAM_IN_SESSION( SID NUMBER, -- SID
SERIAL# NUMBER, -- Serial NumberPARNAM VARCHAR2, -- Parameter NameINTVAL INTEGER -- Value
);
EXECUTE DBMS_SYSTEM.SET_INT_PARAM_IN_SESSION(9, 27, 'sort_area_size', 131072);
DBMS_SYSTEM

26 juliandyke.co
m
© 2005 Julian Dyke
DBMS_SYSTEM To set an event in another session use
DBMS_SYSTEM.SET_EV( SI NUMBER, -- SID
SE NUMBER, -- Serial NumberEV NUMBER, -- Event Number e.g. 10046 LE NUMBER, -- Level e.g. 1NM VARCHAR2 -- Action Name – can be ''
);
Disable using same SID, serial number and event with level 0
27 juliandyke.co
m
© 2005 Julian Dyke
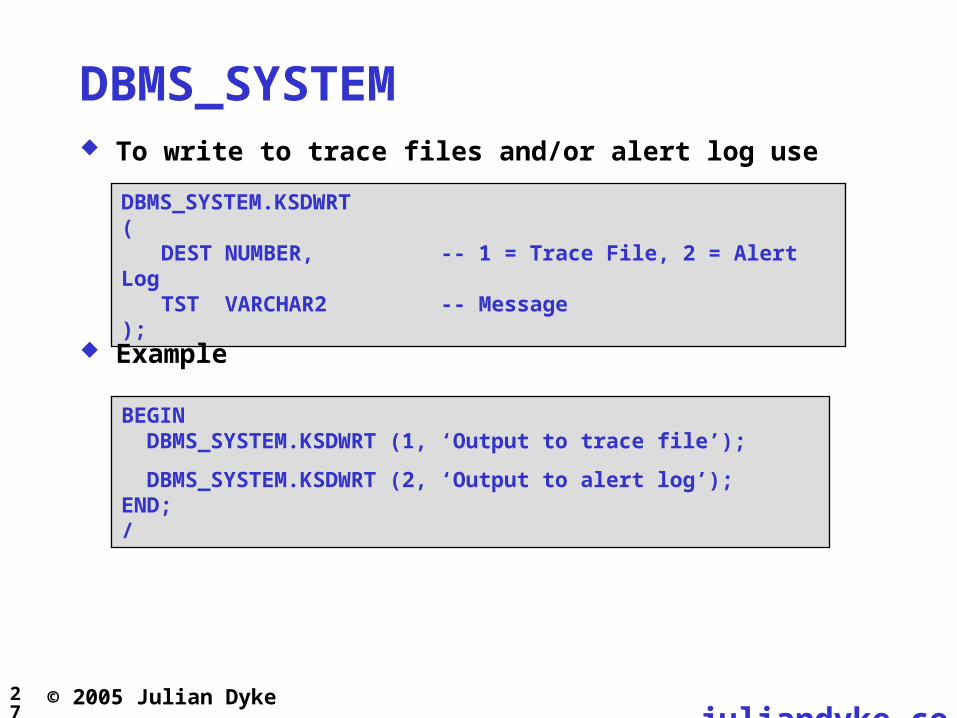
DBMS_SYSTEM To write to trace files and/or alert log use
DBMS_SYSTEM.KSDWRT(
DEST NUMBER, -- 1 = Trace File, 2 = Alert LogTST VARCHAR2 -- Message
);
Example
BEGIN DBMS_SYSTEM.KSDWRT (1, ‘Output to trace file’);
DBMS_SYSTEM.KSDWRT (2, ‘Output to alert log’);END;/
28 juliandyke.co
m
© 2005 Julian Dyke
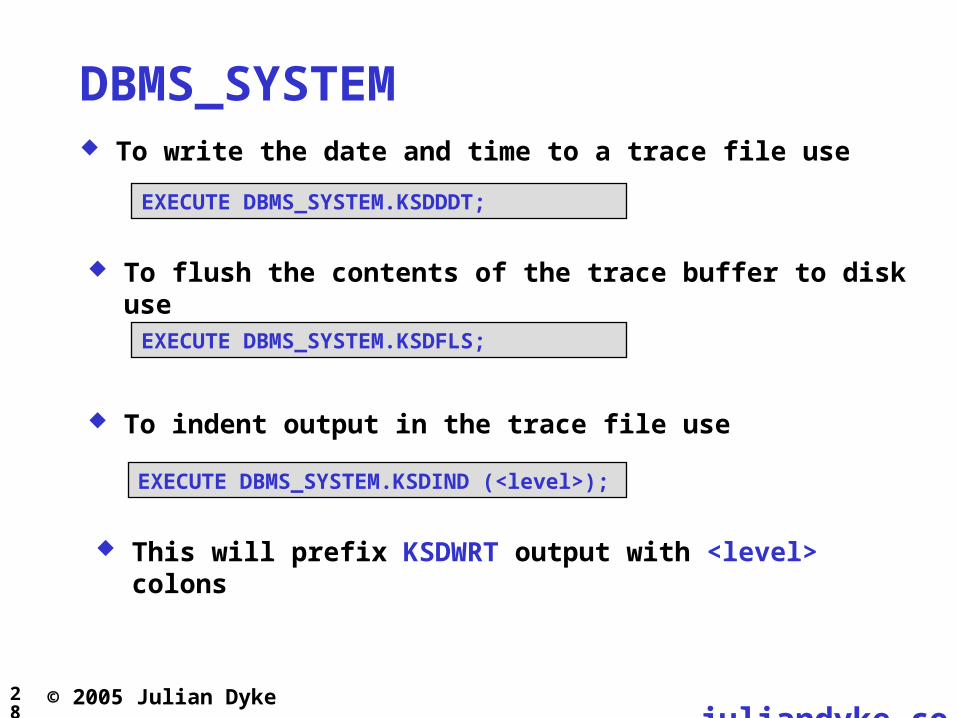
DBMS_SYSTEM To write the date and time to a trace file use
EXECUTE DBMS_SYSTEM.KSDDDT;
To indent output in the trace file use
EXECUTE DBMS_SYSTEM.KSDIND (<level>);
To flush the contents of the trace buffer to disk use
EXECUTE DBMS_SYSTEM.KSDFLS;
This will prefix KSDWRT output with <level> colons

29 juliandyke.co
m
© 2005 Julian Dyke
DBMS_SUPPORT Available in Oracle 7.2 and above Requires dbmssupp.sql and prvtsupp.plb See Metalink Note 62294.1 Install using SYS AS SYSDBA
$ORACLE_HOME/rdbms/admin/dbmssupp.sql
GRANT EXECUTE ON DBMS_SUPPORT TO <user>;
CREATE PUBLIC SYNONYM dbms_support FOR sys.dbms_support;
FUNCTION DBMS_SUPPORT.MYSIDRETURN BOOLEAN;
SELECT sid FROM v$mystatWHERE ROWNUM = 1;
This function executes the query
To get SID of current session use

30 juliandyke.co
m
© 2005 Julian Dyke
DBMS_SUPPORT To enable SQL trace in the current session use
DBMS_SUPPORT.START_TRACE( WAITS BOOLEAN, -- Include waits (default FALSE)
BINDS BOOLEAN -- Include binds (default FALSE));
DBMS_SUPPORT.STOP_TRACE;
To disable use

31 juliandyke.co
m
© 2005 Julian Dyke
DBMS_SUPPORT To enable SQL trace in another session use
DBMS_SUPPORT.START_TRACE_IN_SESSION( SI NUMBER, -- SID
SE NUMBER, -- Serial Number (can be 0)WAITS BOOLEAN, -- Include waits (default FALSE) BINDS BOOLEAN -- Include binds (default FALSE)
);
DBMS_SUPPORT.STOP_TRACE_IN_SESSION( SI NUMBER, -- SID
SE NUMBER -- Serial Number (can be 0));
To disable use
32 juliandyke.co
m
© 2005 Julian Dyke
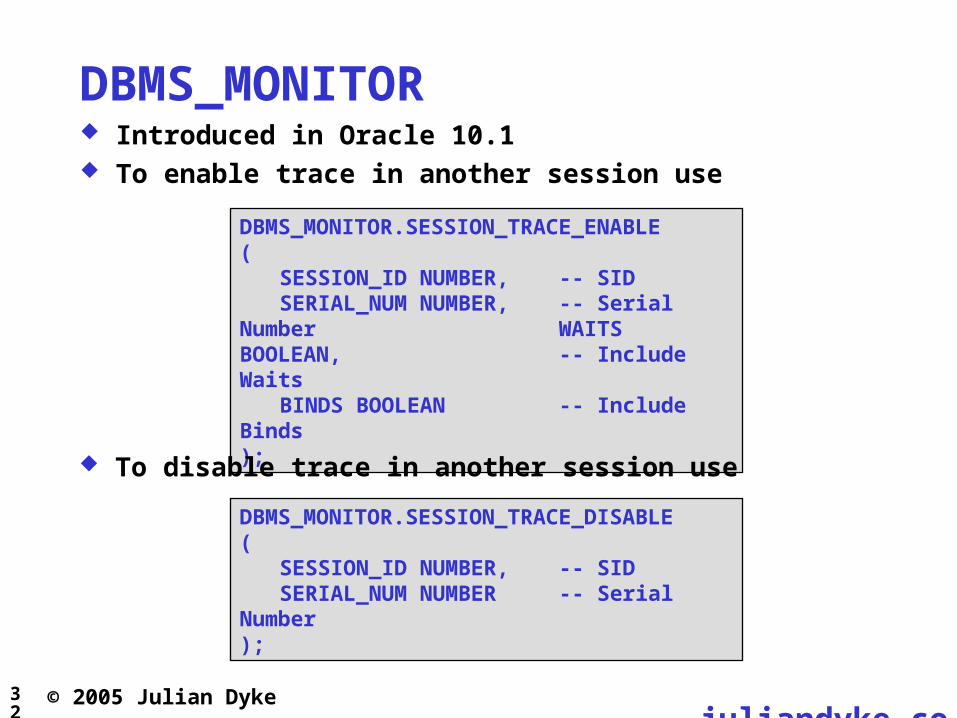
DBMS_MONITOR Introduced in Oracle 10.1 To enable trace in another session use
DBMS_MONITOR.SESSION_TRACE_ENABLE( SESSION_ID NUMBER, -- SID
SERIAL_NUM NUMBER, -- Serial Number WAITS BOOLEAN, -- Include Waits BINDS BOOLEAN -- Include Binds
);
To disable trace in another session use
DBMS_MONITOR.SESSION_TRACE_DISABLE( SESSION_ID NUMBER, -- SID
SERIAL_NUM NUMBER -- Serial Number );
33 juliandyke.co
m
© 2005 Julian Dyke
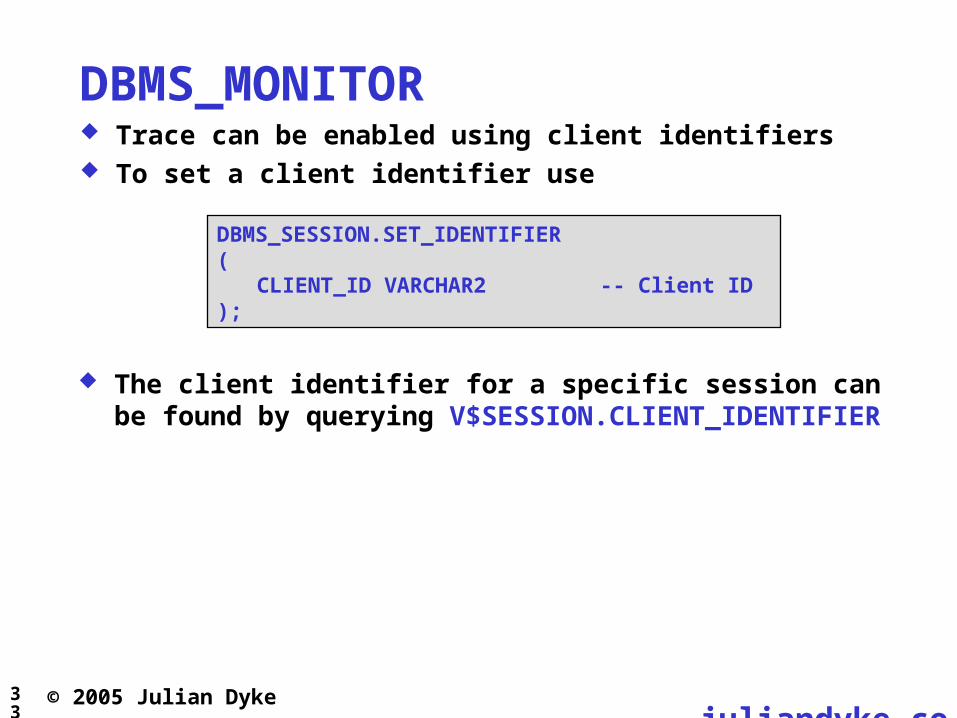
DBMS_MONITOR Trace can be enabled using client identifiers To set a client identifier use
The client identifier for a specific session can be found by querying V$SESSION.CLIENT_IDENTIFIER
DBMS_SESSION.SET_IDENTIFIER( CLIENT_ID VARCHAR2 -- Client ID );

34 juliandyke.co
m
© 2005 Julian Dyke
DBMS_MONITOR Trace can be enabled using client identifiers
To enable trace for a specific client use
DBMS_MONITOR.CLIENT_ID_TRACE_ENABLE( CLIENT_ID NUMBER, -- Client ID
WAITS BOOLEAN, -- Include Waits BINDS BOOLEAN -- Include Binds
);
Trace can be disabled using DBMS_MONITOR.CLIENT_ID_TRACE_DISABLE

35 juliandyke.co
m
© 2005 Julian Dyke
DBMS_MONITOR Trace can be enabled for a specific
service service and module service, module and action
To add a service in a RAC database use DBCA Enterprise Manager (Oracle 10.2 and above)
36 juliandyke.co
m
© 2005 Julian Dyke
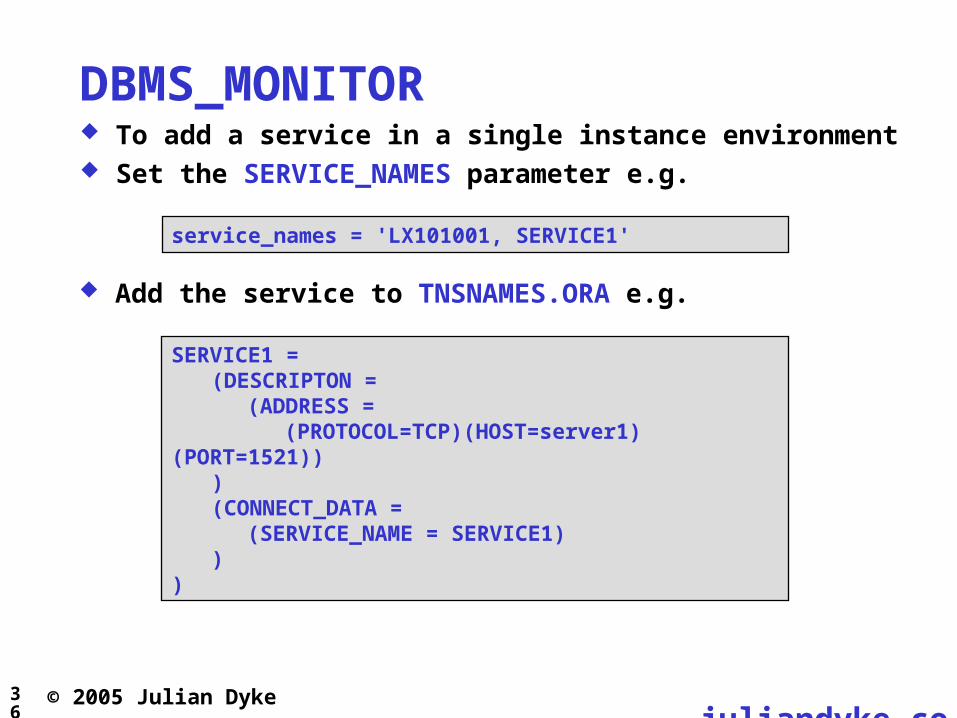
DBMS_MONITOR To add a service in a single instance environment Set the SERVICE_NAMES parameter e.g.
service_names = 'LX101001, SERVICE1'
Add the service to TNSNAMES.ORA e.g.
SERVICE1 = (DESCRIPTON =
(ADDRESS = (PROTOCOL=TCP)(HOST=server1)(PORT=1521))
)(CONNECT_DATA =
(SERVICE_NAME = SERVICE1))
)
37 juliandyke.co
m
© 2005 Julian Dyke
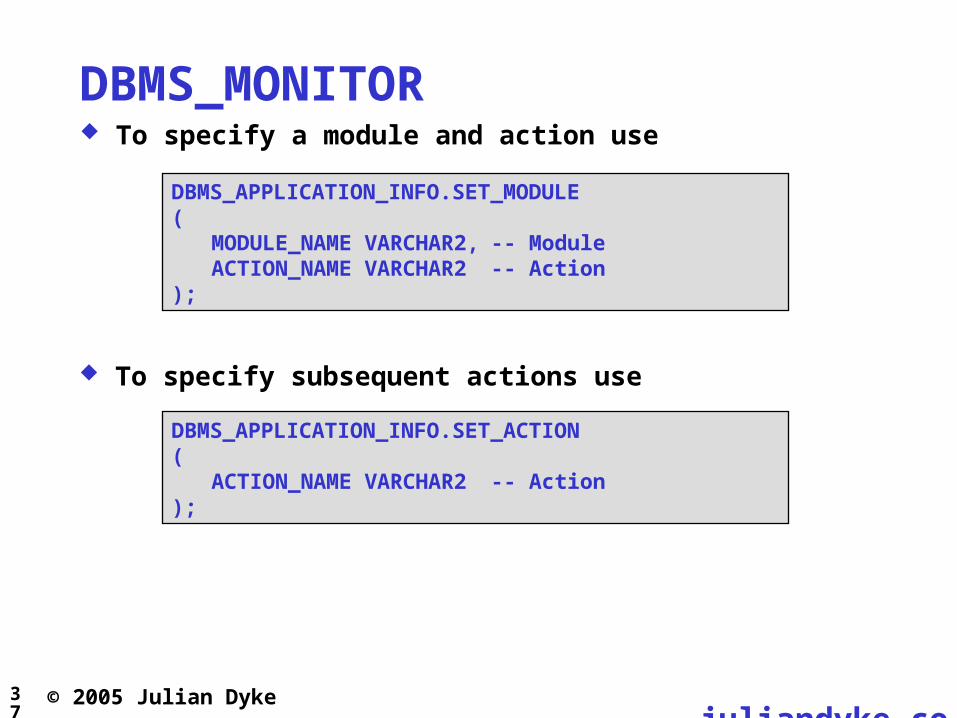
DBMS_MONITOR
DBMS_APPLICATION_INFO.SET_MODULE( MODULE_NAME VARCHAR2, -- Module
ACTION_NAME VARCHAR2 -- Action );
To specify subsequent actions use
DBMS_APPLICATION_INFO.SET_ACTION( ACTION_NAME VARCHAR2 -- Action );
To specify a module and action use
38 juliandyke.co
m
© 2005 Julian Dyke
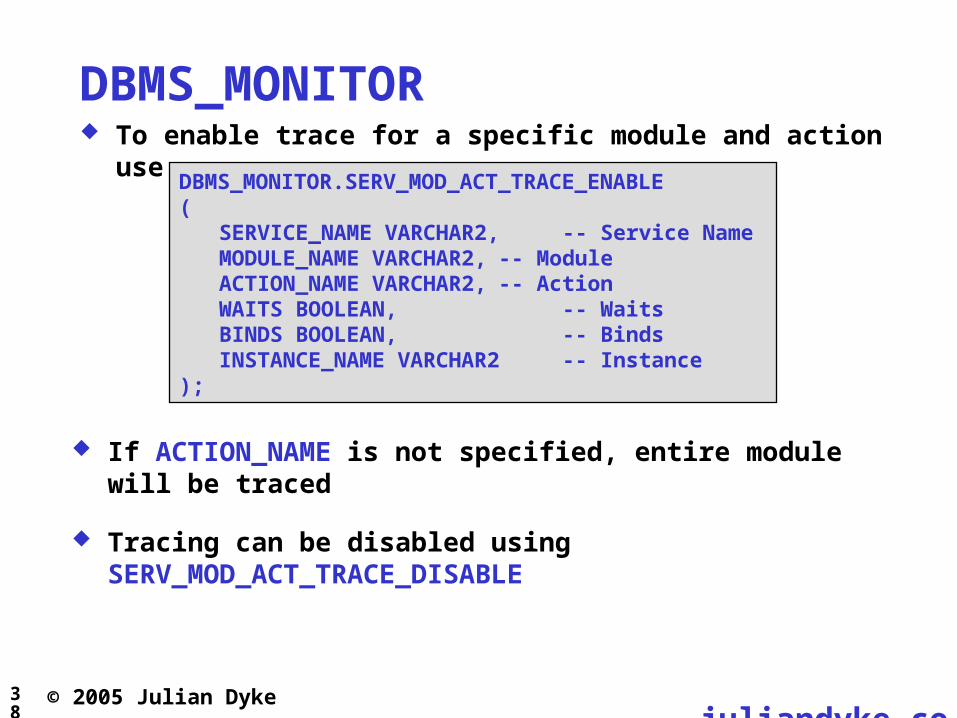
DBMS_MONITOR To enable trace for a specific module and action use
DBMS_MONITOR.SERV_MOD_ACT_TRACE_ENABLE( SERVICE_NAME VARCHAR2, -- Service Name
MODULE_NAME VARCHAR2, -- ModuleACTION_NAME VARCHAR2, -- ActionWAITS BOOLEAN, -- WaitsBINDS BOOLEAN, -- BindsINSTANCE_NAME VARCHAR2 -- Instance
);
If ACTION_NAME is not specified, entire module will be traced
Tracing can be disabled using SERV_MOD_ACT_TRACE_DISABLE
39 juliandyke.co
m
© 2005 Julian Dyke
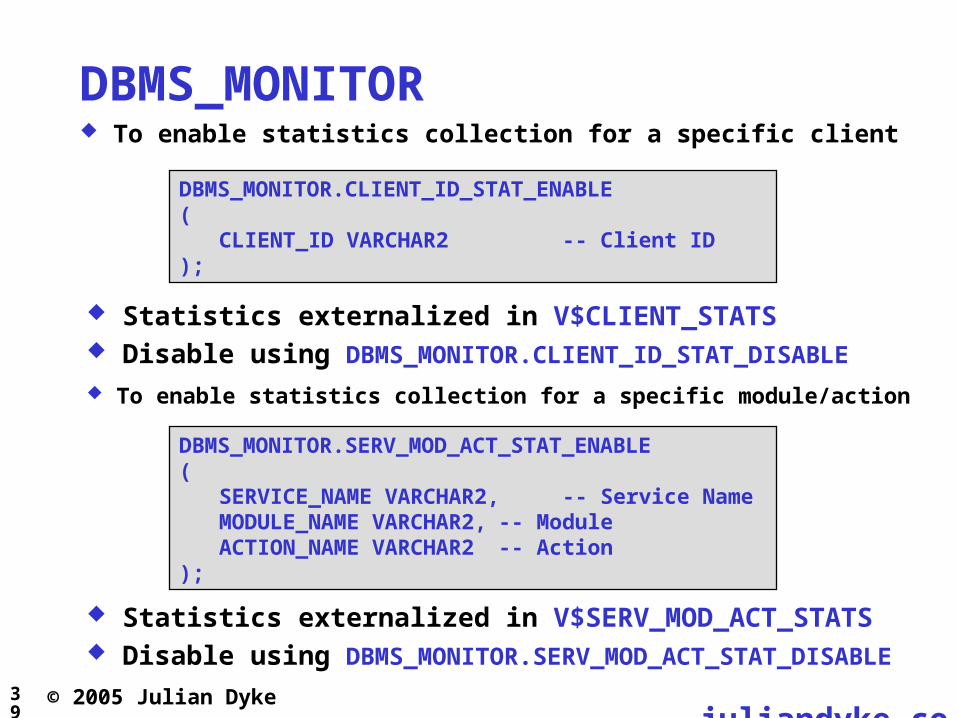
DBMS_MONITOR To enable statistics collection for a specific client
DBMS_MONITOR.CLIENT_ID_STAT_ENABLE( CLIENT_ID VARCHAR2 -- Client ID);
Statistics externalized in V$CLIENT_STATS Disable using DBMS_MONITOR.CLIENT_ID_STAT_DISABLE
To enable statistics collection for a specific module/action
DBMS_MONITOR.SERV_MOD_ACT_STAT_ENABLE( SERVICE_NAME VARCHAR2, -- Service Name
MODULE_NAME VARCHAR2, -- ModuleACTION_NAME VARCHAR2 -- Action
);
Statistics externalized in V$SERV_MOD_ACT_STATS Disable using DBMS_MONITOR.SERV_MOD_ACT_STAT_DISABLE
40 juliandyke.co
m
© 2005 Julian Dyke
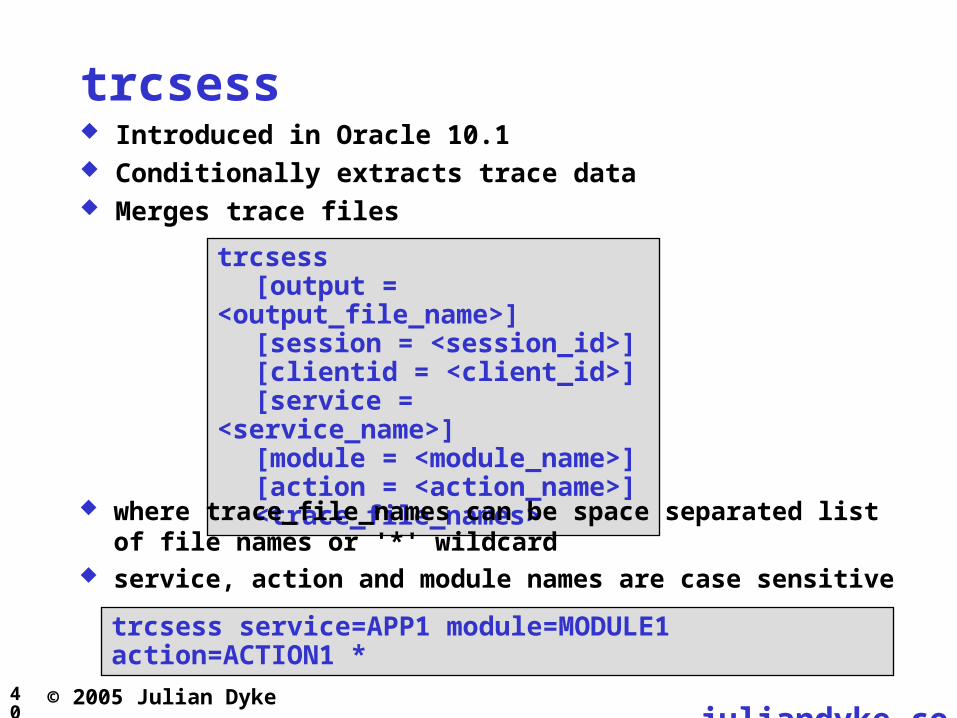
trcsess Introduced in Oracle 10.1 Conditionally extracts trace data Merges trace files
trcsess[output = <output_file_name>][session = <session_id>][clientid = <client_id>][service = <service_name>][module = <module_name>][action = <action_name>]<trace_file_names>
where trace_file_names can be space separated list of file names or '*' wildcard
service, action and module names are case sensitive
trcsess service=APP1 module=MODULE1 action=ACTION1 *

41 juliandyke.co
m
© 2005 Julian Dyke
DBA_ENABLED_TRACES Introduced in Oracle 10.1
Name Type
TRACE_TYPE VARCHAR2(21)
PRIMARY_ID VARCHAR2(64)
QUALIFIER_ID1 VARCHAR2(48)
QUALIFIER_ID2 VARCHAR2(32)
WAITS VARCHAR2(5)
BINDS VARCHAR2(5)
INSTANCE_NAME VARCHAR2(16) Trace type can be
CLIENT_ID SERVICE SERVICE_MODULE SERVICE_MODULE_ACTION
Based on WRI$_TRACING_ENABLED
42 juliandyke.co
m
© 2005 Julian Dyke
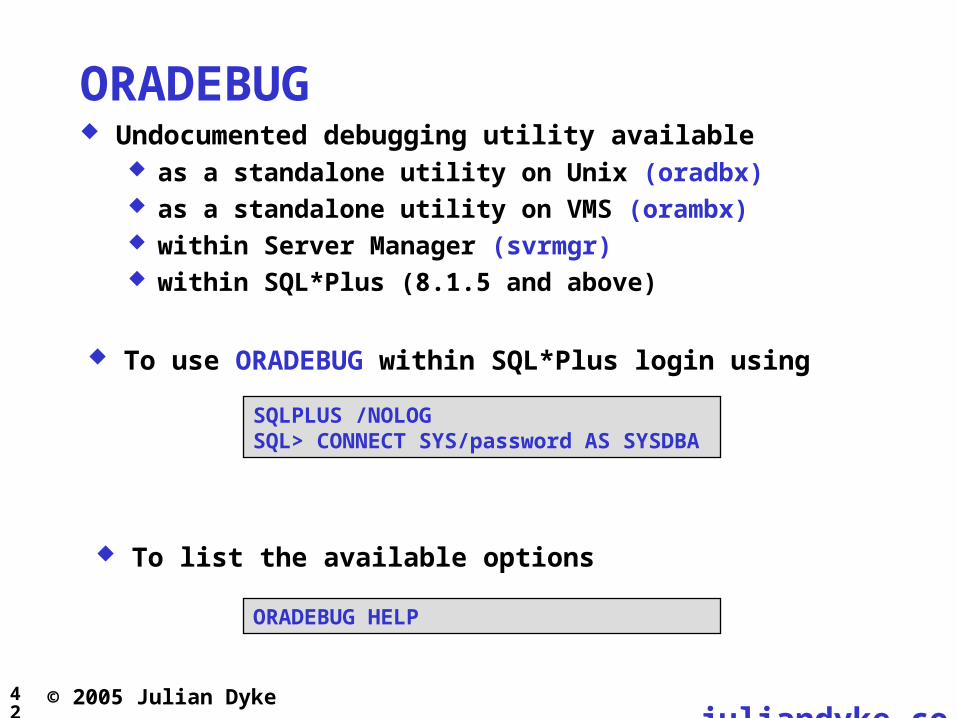
ORADEBUG Undocumented debugging utility available
as a standalone utility on Unix (oradbx) as a standalone utility on VMS (orambx) within Server Manager (svrmgr) within SQL*Plus (8.1.5 and above)
ORADEBUG HELP
To use ORADEBUG within SQL*Plus login using
To list the available options
SQLPLUS /NOLOGSQL> CONNECT SYS/password AS SYSDBA
43 juliandyke.co
m
© 2005 Julian Dyke
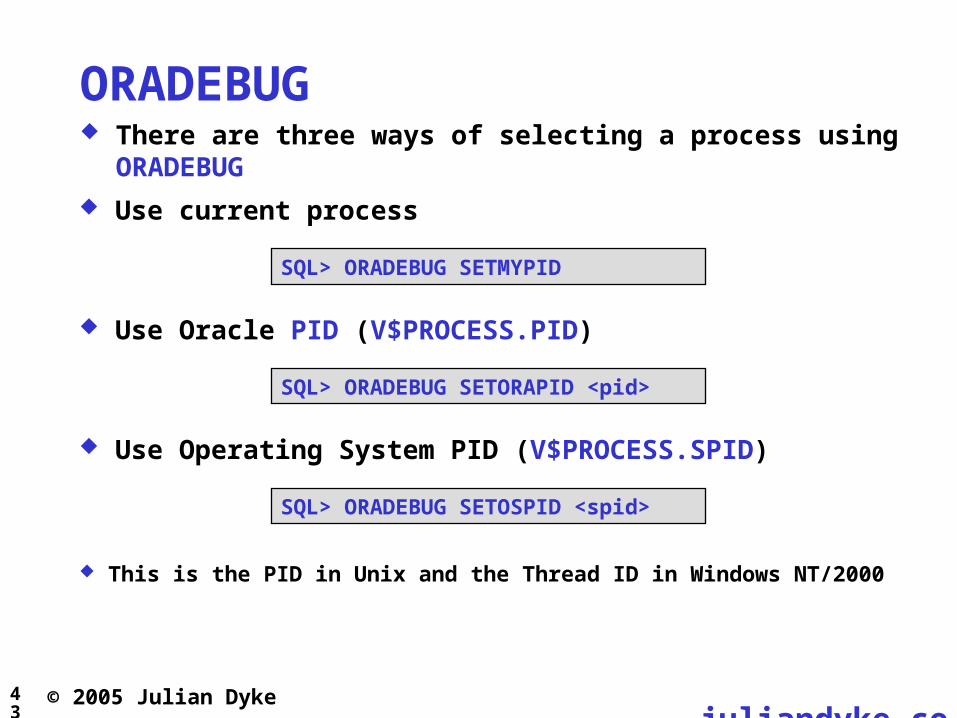
ORADEBUG There are three ways of selecting a process using
ORADEBUG
Use current process
SQL> ORADEBUG SETMYPID
Use Oracle PID (V$PROCESS.PID)
SQL> ORADEBUG SETORAPID <pid>
Use Operating System PID (V$PROCESS.SPID)
SQL> ORADEBUG SETOSPID <spid>
This is the PID in Unix and the Thread ID in Windows NT/2000
44 juliandyke.co
m
© 2005 Julian Dyke
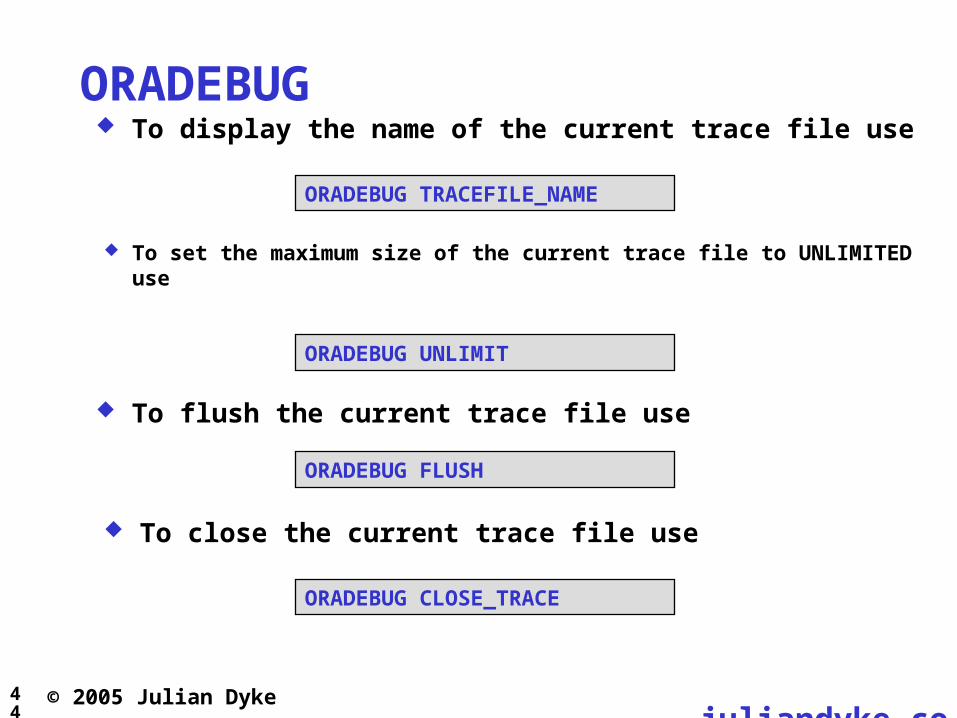
ORADEBUG To display the name of the current trace file use
To flush the current trace file use
ORADEBUG TRACEFILE_NAME
ORADEBUG FLUSH
To close the current trace file use
ORADEBUG CLOSE_TRACE
To set the maximum size of the current trace file to UNLIMITED use
ORADEBUG UNLIMIT
45 juliandyke.co
m
© 2005 Julian Dyke
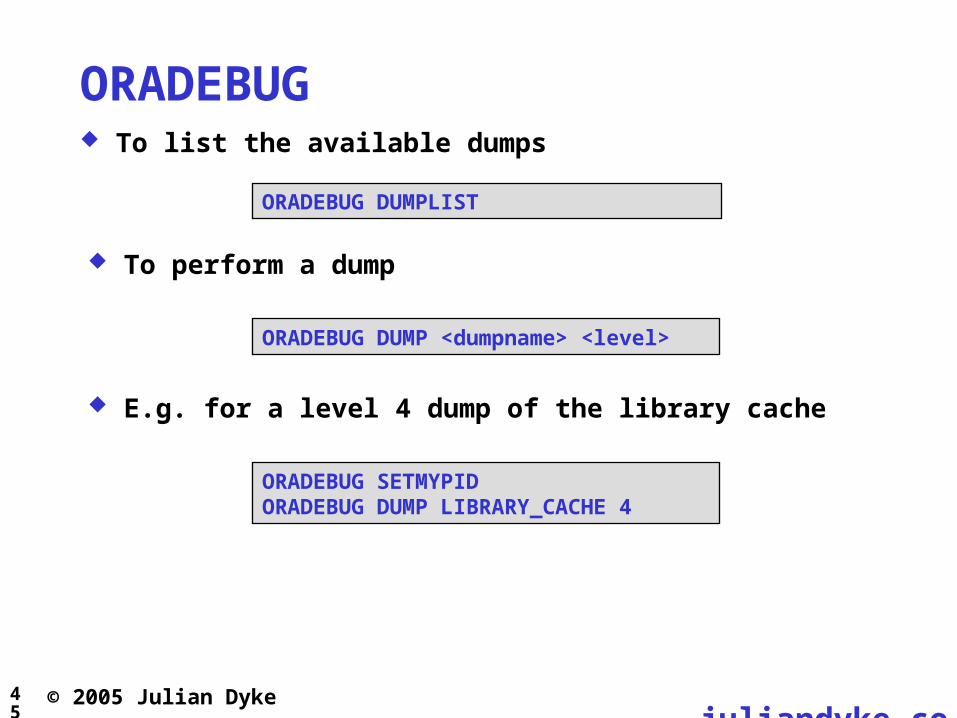
ORADEBUG To list the available dumps
ORADEBUG DUMPLIST
E.g. for a level 4 dump of the library cache
ORADEBUG SETMYPIDORADEBUG DUMP LIBRARY_CACHE 4
ORADEBUG DUMP <dumpname> <level>
To perform a dump
46 juliandyke.co
m
© 2005 Julian Dyke
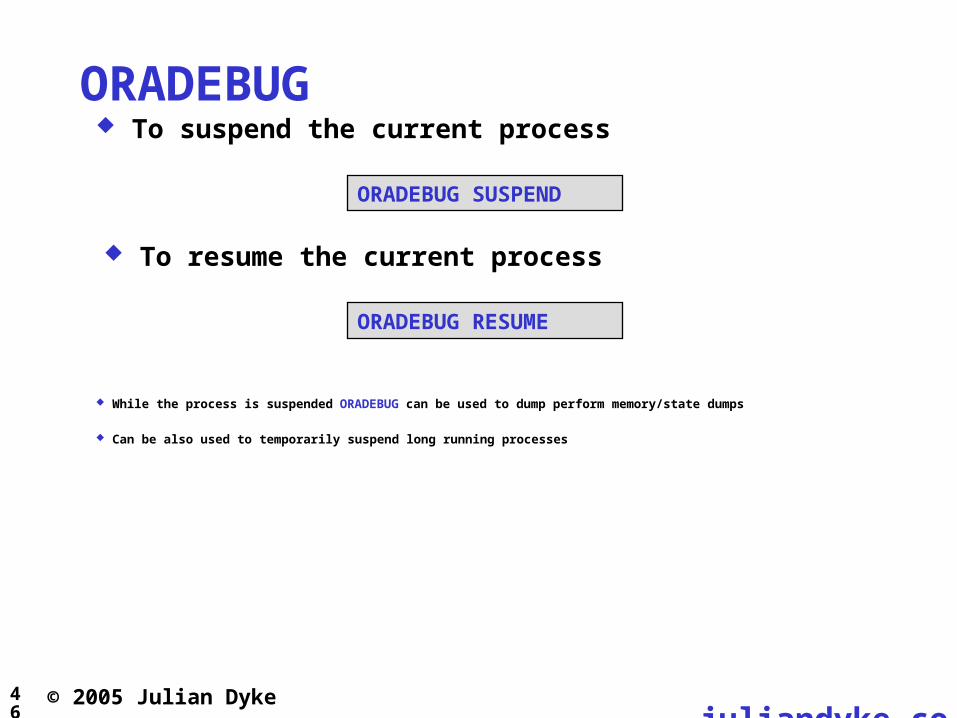
ORADEBUG To suspend the current process
While the process is suspended ORADEBUG can be used to dump perform memory/state dumps
Can be also used to temporarily suspend long running processes
ORADEBUG SUSPEND
To resume the current process
ORADEBUG RESUME

47 juliandyke.co
m
© 2005 Julian Dyke
ORADEBUG To dump the events currently set use
where level is
ORADEBUG DUMP EVENTS <level>
Level Description
1 Session
2 Process
3 System
Output is written to the current trace file
48 juliandyke.co
m
© 2005 Julian Dyke
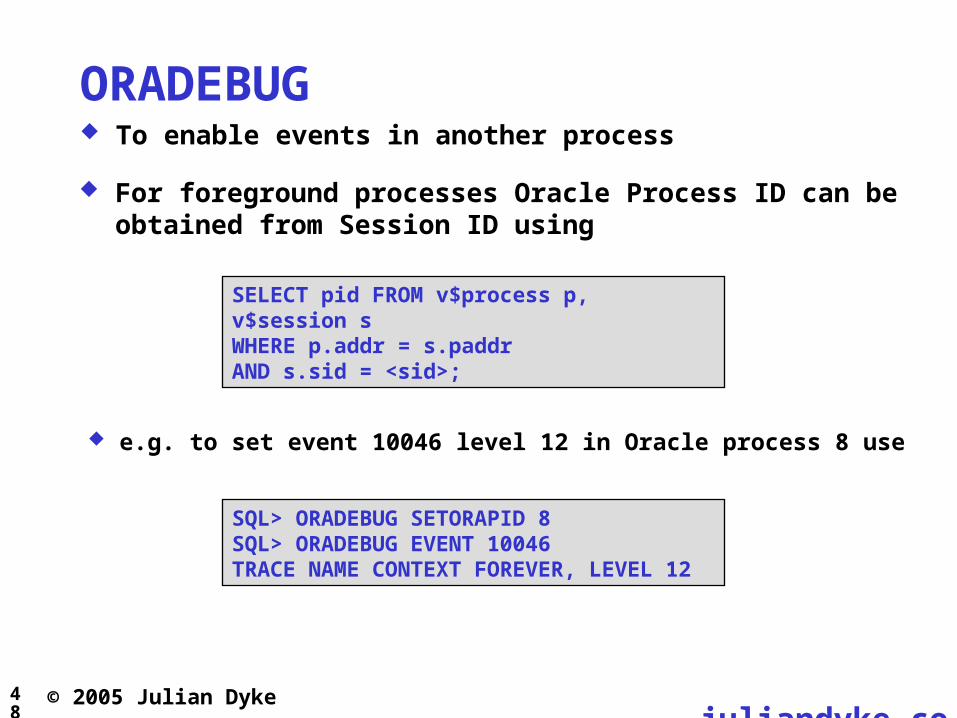
ORADEBUG To enable events in another process
SELECT pid FROM v$process p, v$session s WHERE p.addr = s.paddr AND s.sid = <sid>;
SQL> ORADEBUG SETORAPID 8SQL> ORADEBUG EVENT 10046 TRACE NAME CONTEXT FOREVER, LEVEL 12
e.g. to set event 10046 level 12 in Oracle process 8 use
For foreground processes Oracle Process ID can be obtained from Session ID using
49 juliandyke.co
m
© 2005 Julian Dyke
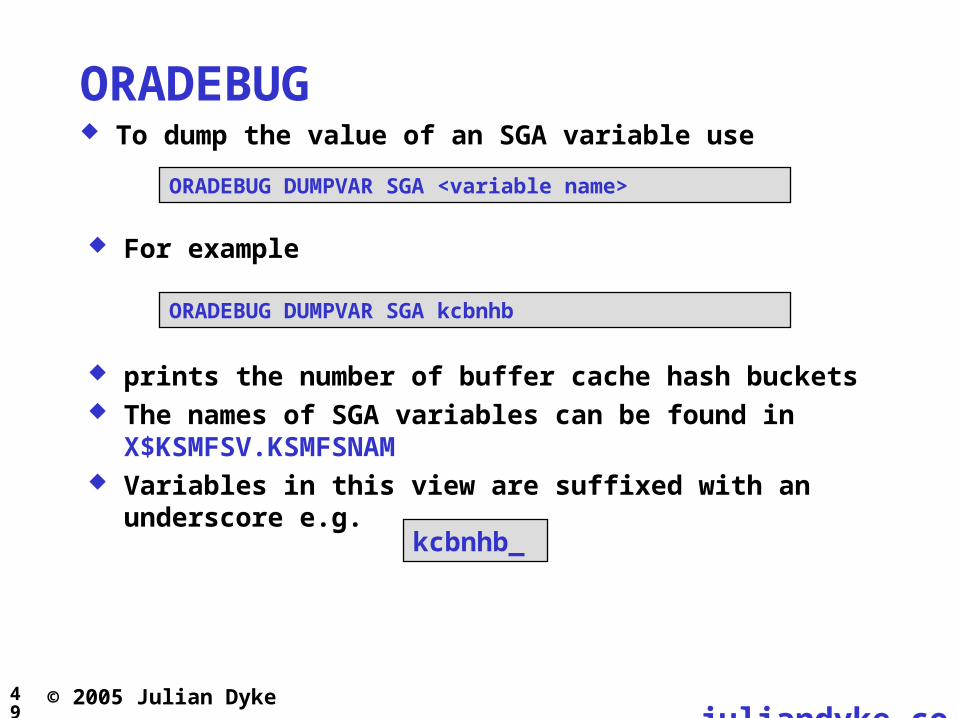
ORADEBUG To dump the value of an SGA variable use
ORADEBUG DUMPVAR SGA <variable name>
For example
kcbnhb_
prints the number of buffer cache hash buckets The names of SGA variables can be found in
X$KSMFSV.KSMFSNAM Variables in this view are suffixed with an underscore e.g.
ORADEBUG DUMPVAR SGA kcbnhb
50 juliandyke.co
m
© 2005 Julian Dyke
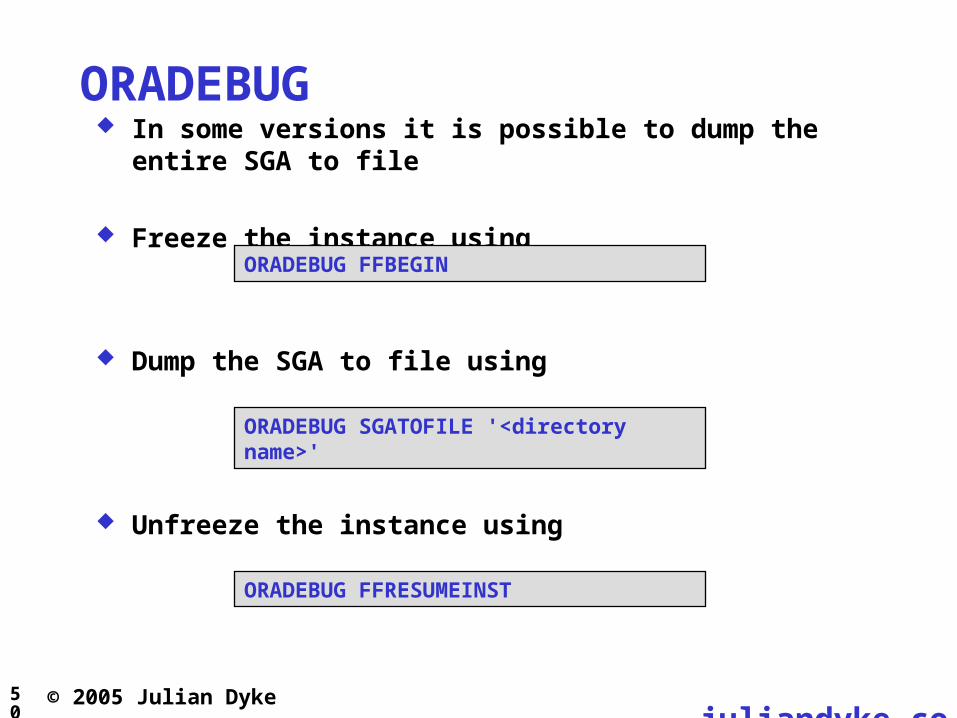
ORADEBUG In some versions it is possible to dump the entire SGA to file
Freeze the instance using
ORADEBUG FFBEGIN
Dump the SGA to file using
ORADEBUG SGATOFILE '<directory name>'
Unfreeze the instance using
ORADEBUG FFRESUMEINST
51 juliandyke.co
m
© 2005 Julian Dyke
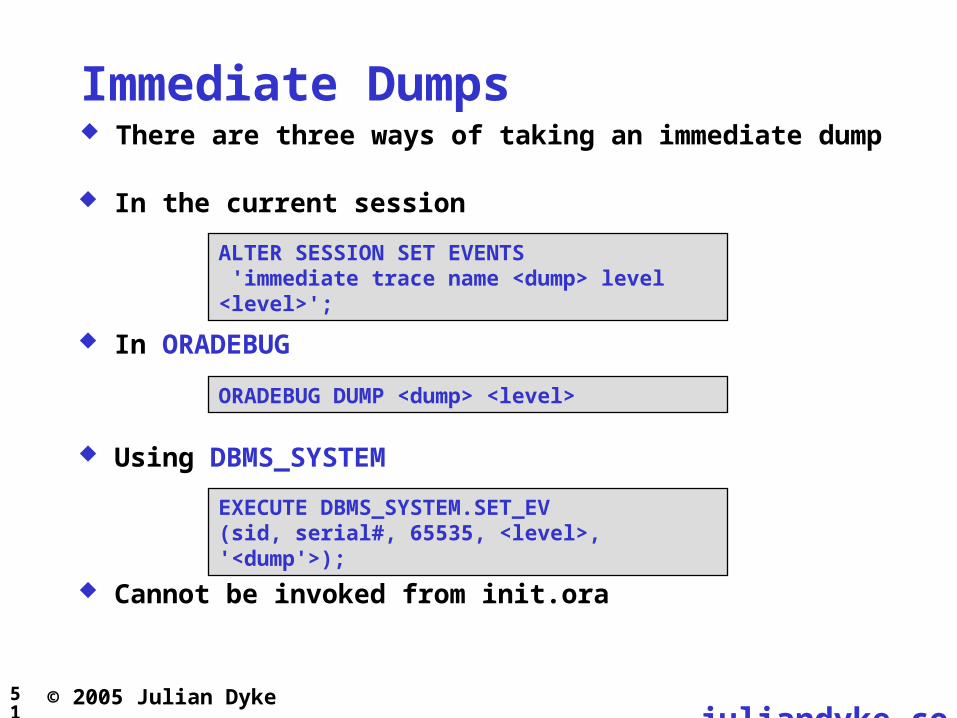
Immediate Dumps There are three ways of taking an immediate dump
In the current session
ALTER SESSION SET EVENTS 'immediate trace name <dump> level <level>';
Using DBMS_SYSTEM
EXECUTE DBMS_SYSTEM.SET_EV(sid, serial#, 65535, <level>, '<dump'>);
ORADEBUG DUMP <dump> <level>
In ORADEBUG
Cannot be invoked from init.ora
52 juliandyke.co
m
© 2005 Julian Dyke
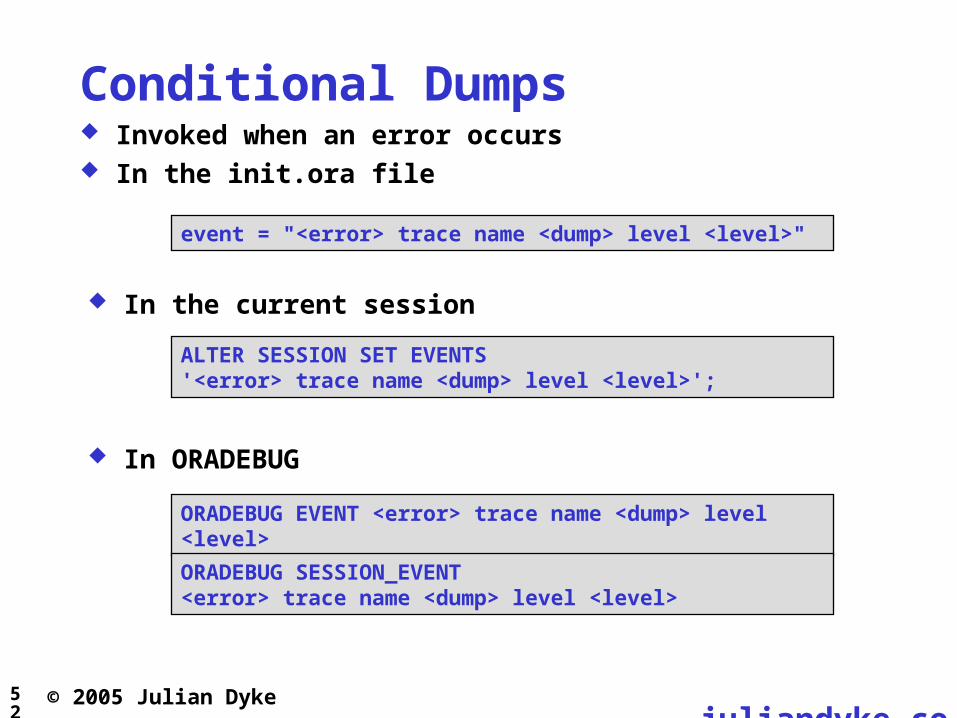
Conditional Dumps Invoked when an error occurs In the init.ora file
event = "<error> trace name <dump> level <level>"
ALTER SESSION SET EVENTS'<error> trace name <dump> level <level>';
In the current session
In ORADEBUG
ORADEBUG EVENT <error> trace name <dump> level <level>
ORADEBUG SESSION_EVENT <error> trace name <dump> level <level>

53 juliandyke.co
m
© 2005 Julian Dyke
Dumping Columns To dump the internal representation of columns use the DUMP
built-in function
DUMP (COLUMN_VALUE, FORMAT)
where FORMAT is
Format Description
8 Octal
10 Decimal
16 Hexadecimal
17 Single Character
54 juliandyke.co
m
© 2005 Julian Dyke
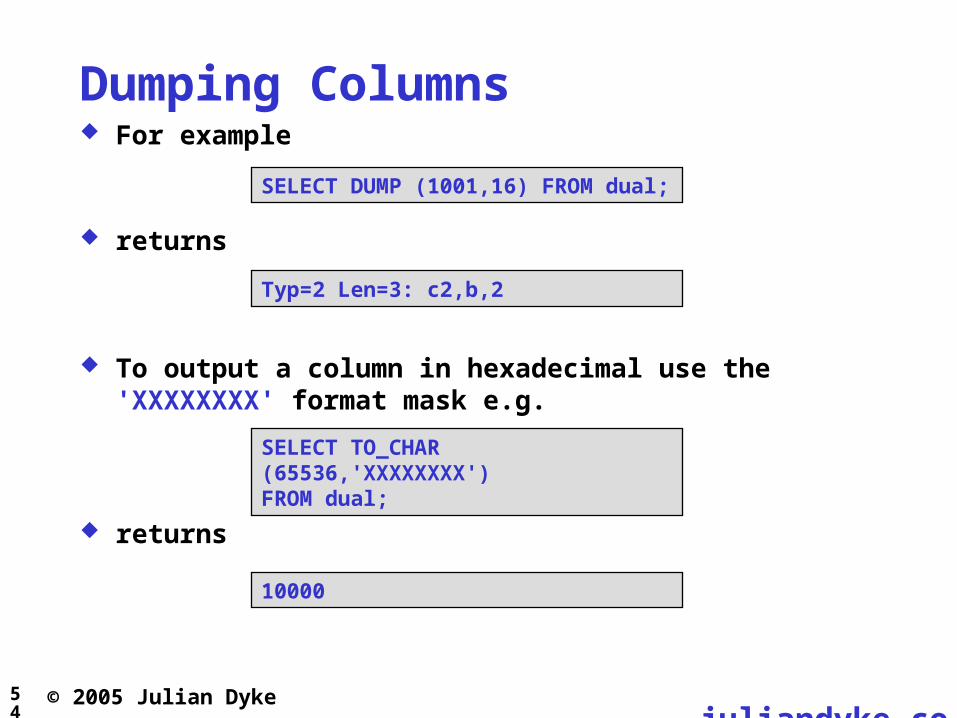
Dumping Columns For example
SELECT DUMP (1001,16) FROM dual;
Typ=2 Len=3: c2,b,2
returns
To output a column in hexadecimal use the 'XXXXXXXX' format mask e.g.
SELECT TO_CHAR (65536,'XXXXXXXX') FROM dual;
returns
10000
55 juliandyke.co
m
© 2005 Julian Dyke
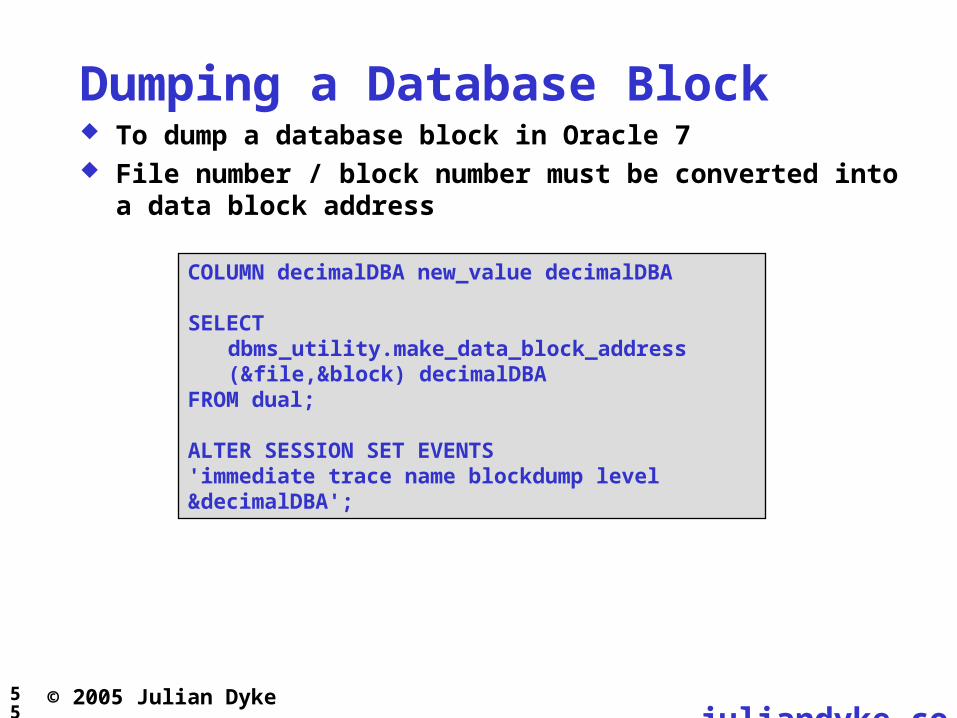
Dumping a Database Block To dump a database block in Oracle 7 File number / block number must be converted into a data
block address
COLUMN decimalDBA new_value decimalDBA
SELECTdbms_utility.make_data_block_address (&file,&block) decimalDBA
FROM dual;
ALTER SESSION SET EVENTS 'immediate trace name blockdump level &decimalDBA';
56 juliandyke.co
m
© 2005 Julian Dyke
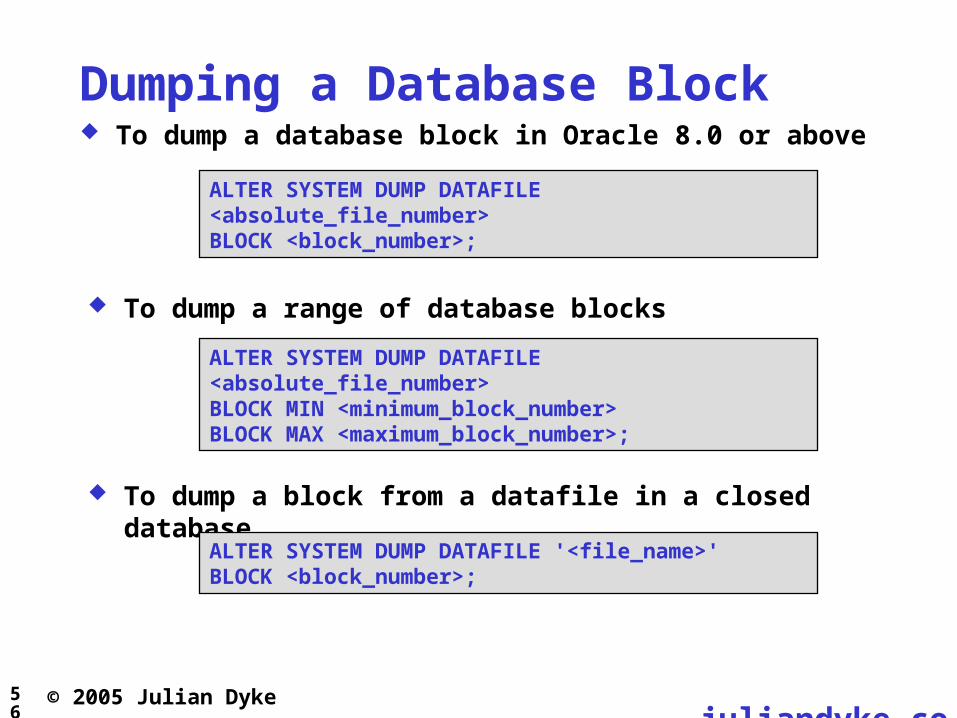
Dumping a Database Block To dump a database block in Oracle 8.0 or above
ALTER SYSTEM DUMP DATAFILE <absolute_file_number>BLOCK <block_number>;
ALTER SYSTEM DUMP DATAFILE <absolute_file_number>BLOCK MIN <minimum_block_number>BLOCK MAX <maximum_block_number>;
To dump a range of database blocks
To dump a block from a datafile in a closed database
ALTER SYSTEM DUMP DATAFILE '<file_name>'BLOCK <block_number>;

57 juliandyke.co
m
© 2005 Julian Dyke
Dumping a Database Block (Hex) To dump a database block in hexadecimal enable event 10289
ALTER SESSION SET EVENTS'10289 trace name context forever, level 1';
Then dump the block using
ALTER SYSTEM DUMP DATAFILE <absolute_file_number>BLOCK <block_number>;
On Unix/Linux systems blocks can also be dumped using od
ALTER SYSTEM CHECKPOINT;
dd bs=8k if=<filename> skip=200 count=4 | od -x
Force DBWR to flush recently written blocks to disk using
ALTER SYSTEM SWITCH LOGFILE;
or
58 juliandyke.co
m
© 2005 Julian Dyke
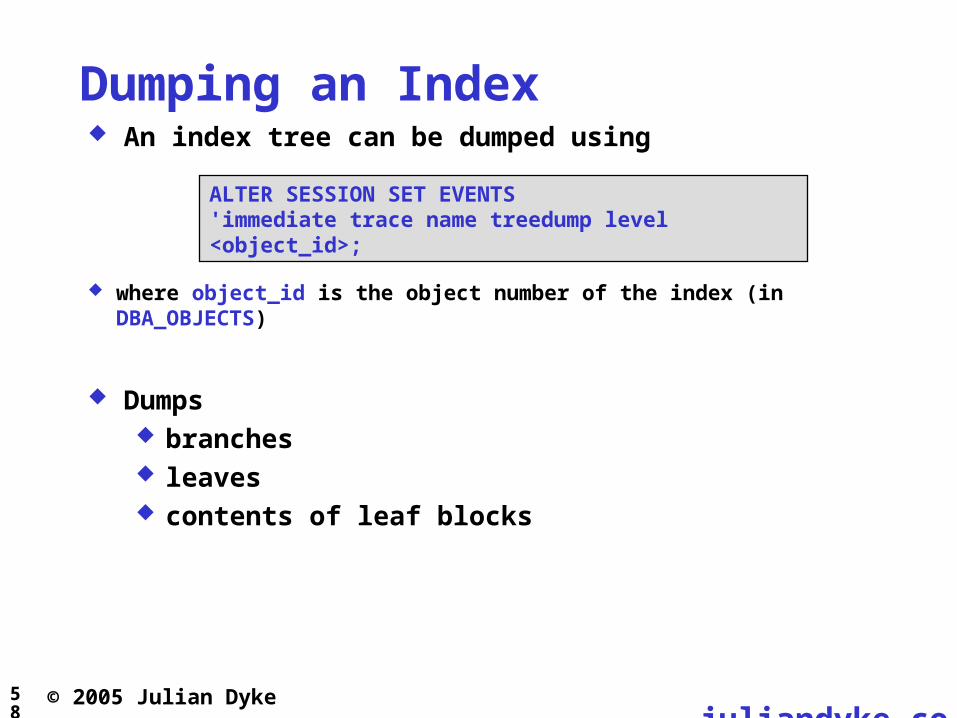
Dumping an Index An index tree can be dumped using
ALTER SESSION SET EVENTS'immediate trace name treedump level <object_id>;
where object_id is the object number of the index (in DBA_OBJECTS)
Dumps branches leaves contents of leaf blocks

59 juliandyke.co
m
© 2005 Julian Dyke
Dumping an Index In Oracle 9.2 treedump may crash if index has been created by
a primary/unique constraint e.g.
Occurs when IND$.PROPERTY > 256 Can be prevented by creating the index before creating the
constraint
CREATE TABLE t1 (c01 NUMBER);ALTER TABLE t1 ADD CONSTRAINT t1pk PRIMARY KEY (c01);
CREATE TABLE t1 (c01 NUMBER PRIMARY KEY);

60 juliandyke.co
m
© 2005 Julian Dyke
Dumping Undo/Rollback To dump an undo segment header use
ALTER SYSTEM DUMP UNDO_HEADER '<segment_name>';
To dump an undo transaction first obtain the XID using
ALTER SYSTEM DUMP UNDO BLOCK '<segment_name>'XID <xidusn> <xidslot> <xidsqn>;
SELECT xidusn, xidslot, xidsqn FROM v$transaction;
Dump the undo transaction using
61 juliandyke.co
m
© 2005 Julian Dyke
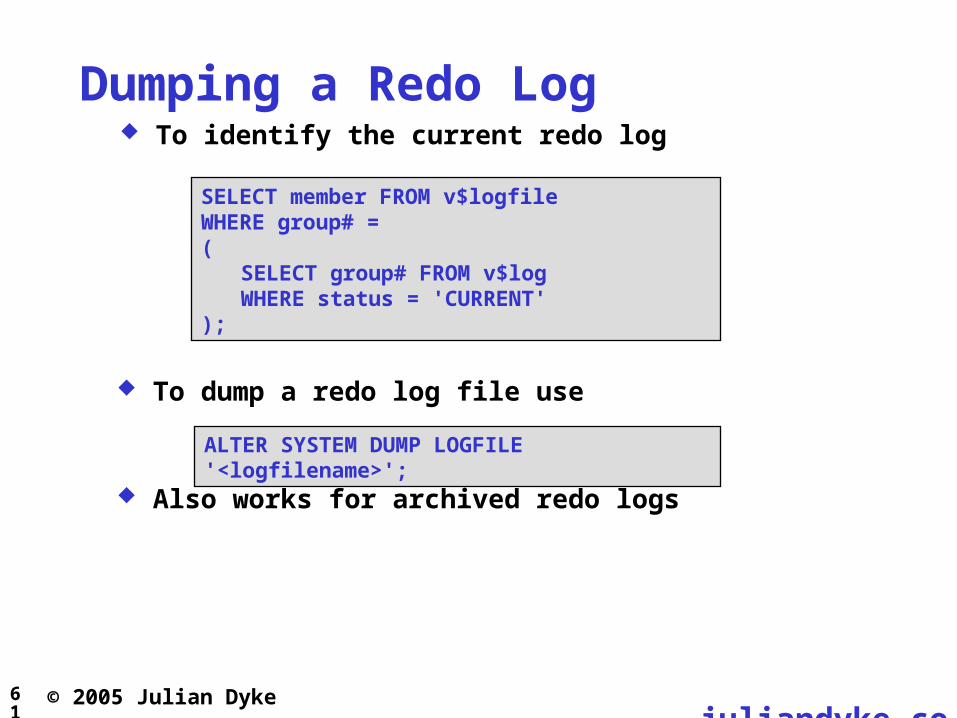
Dumping a Redo Log To identify the current redo log
ALTER SYSTEM DUMP LOGFILE '<logfilename>';
To dump a redo log file use
SELECT member FROM v$logfileWHERE group# = (
SELECT group# FROM v$logWHERE status = 'CURRENT'
);
Also works for archived redo logs
62 juliandyke.co
m
© 2005 Julian Dyke
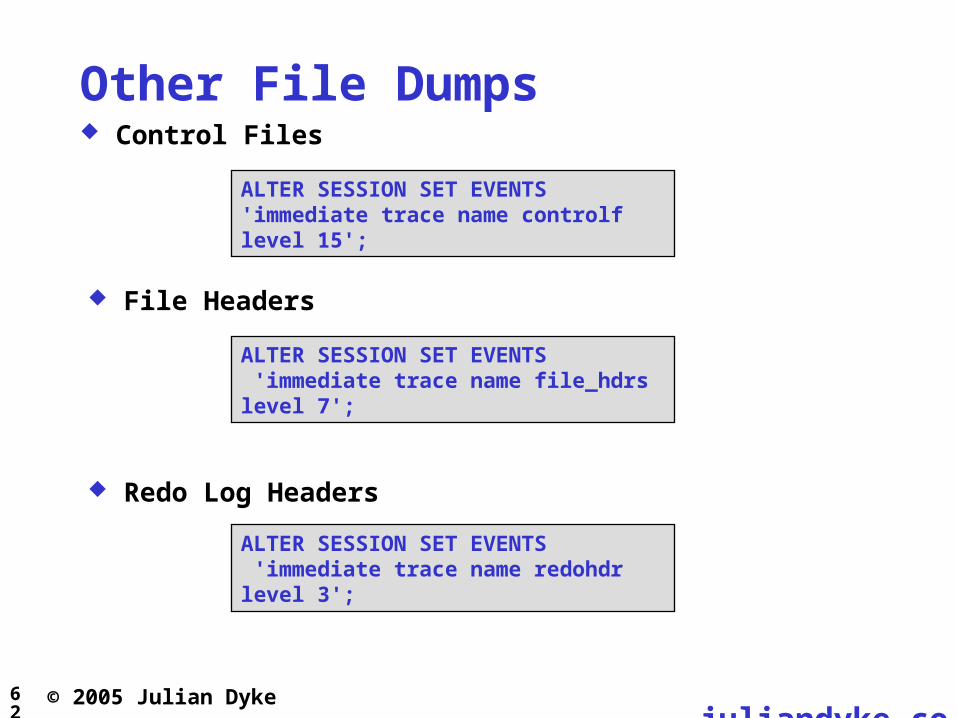
Other File Dumps
File Headers
ALTER SESSION SET EVENTS 'immediate trace name file_hdrs level 7';
Redo Log Headers
ALTER SESSION SET EVENTS 'immediate trace name redohdr level 3';
ALTER SESSION SET EVENTS'immediate trace name controlf level 15';
Control Files
63 juliandyke.co
m
© 2005 Julian Dyke
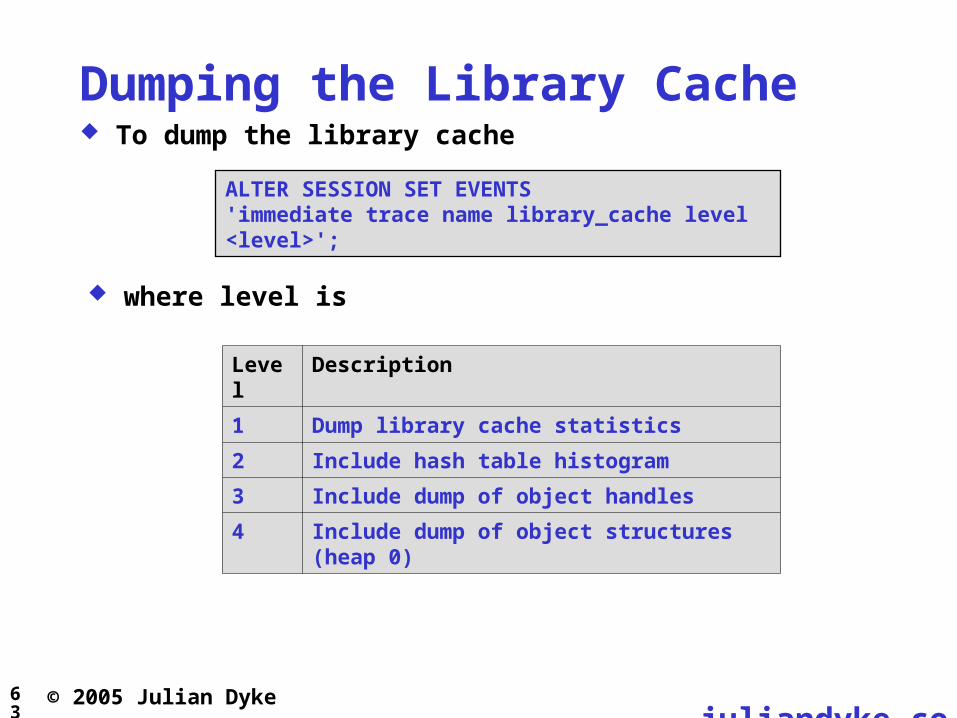
Dumping the Library Cache To dump the library cache
Level Description
1 Dump library cache statistics
2 Include hash table histogram
3 Include dump of object handles
4 Include dump of object structures (heap 0)
ALTER SESSION SET EVENTS 'immediate trace name library_cache level <level>';
where level is
64 juliandyke.co
m
© 2005 Julian Dyke
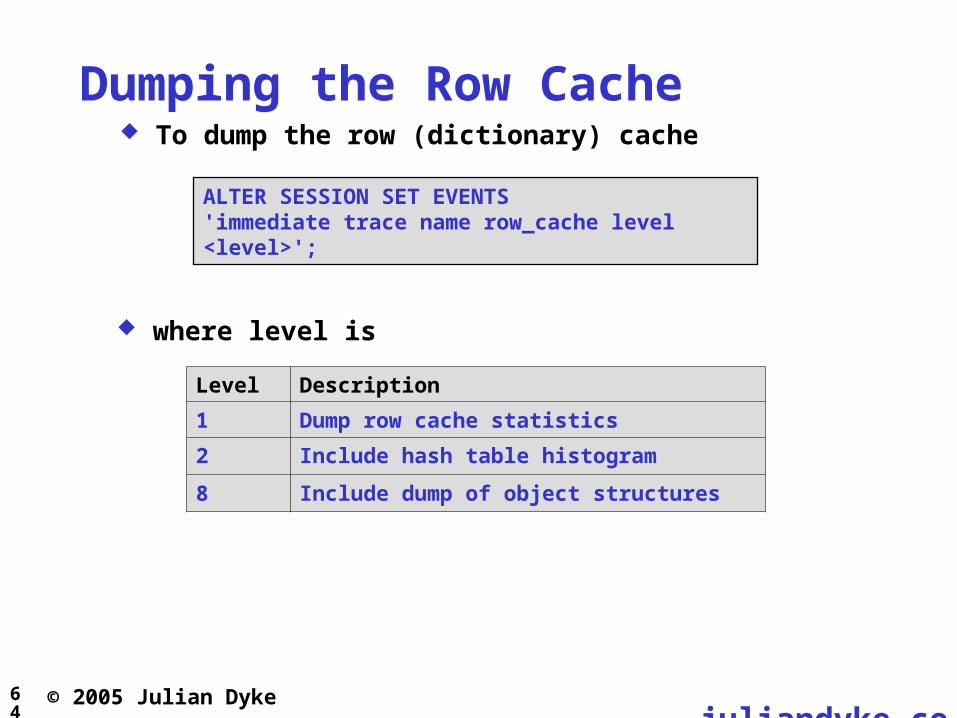
Dumping the Row Cache To dump the row (dictionary) cache
Level Description
1 Dump row cache statistics
2 Include hash table histogram
8 Include dump of object structures
ALTER SESSION SET EVENTS 'immediate trace name row_cache level <level>';
where level is
65 juliandyke.co
m
© 2005 Julian Dyke
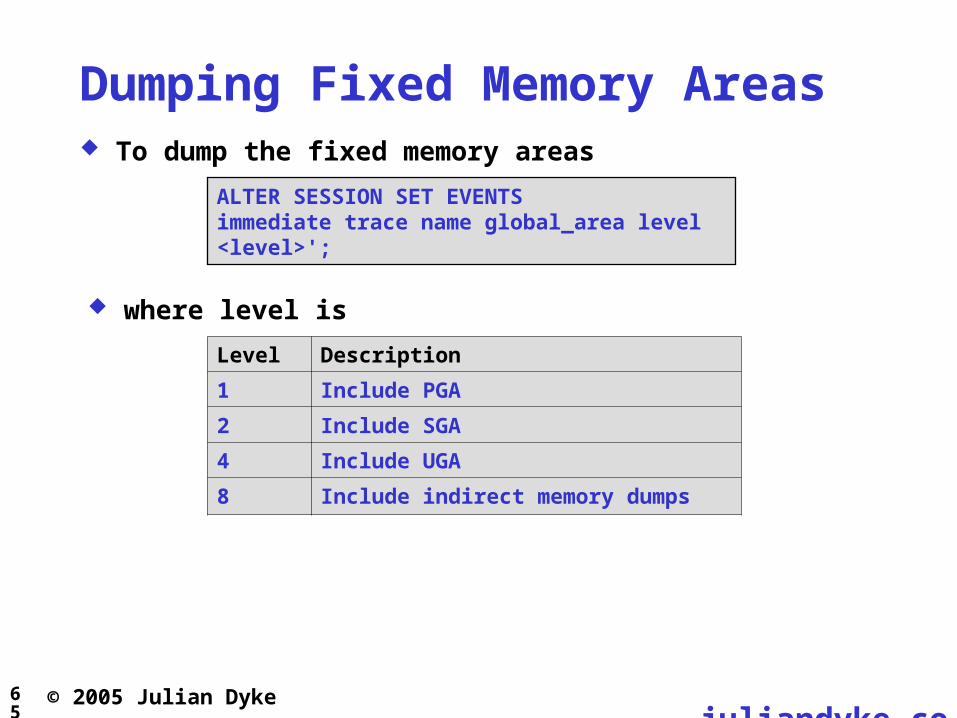
Dumping Fixed Memory Areas To dump the fixed memory areas
ALTER SESSION SET EVENTS immediate trace name global_area level <level>';
where level is
Level Description
1 Include PGA
2 Include SGA
4 Include UGA
8 Include indirect memory dumps

66 juliandyke.co
m
© 2005 Julian Dyke
Dumping the Fixed SGA The fixed SGA is externalised in X$KSMFSV
SELECT SUBSTR (ksmfsnam,1,20) AS "Name",SUBSTR (ksmfstyp,1,20) AS "Type",ksmfsadr AS "Address",ksmfssiz AS "Size"
FROM x$ksmfsv;
The fixed SGA can also be dumped using
ORADEBUG DUMPSGA
67 juliandyke.co
m
© 2005 Julian Dyke
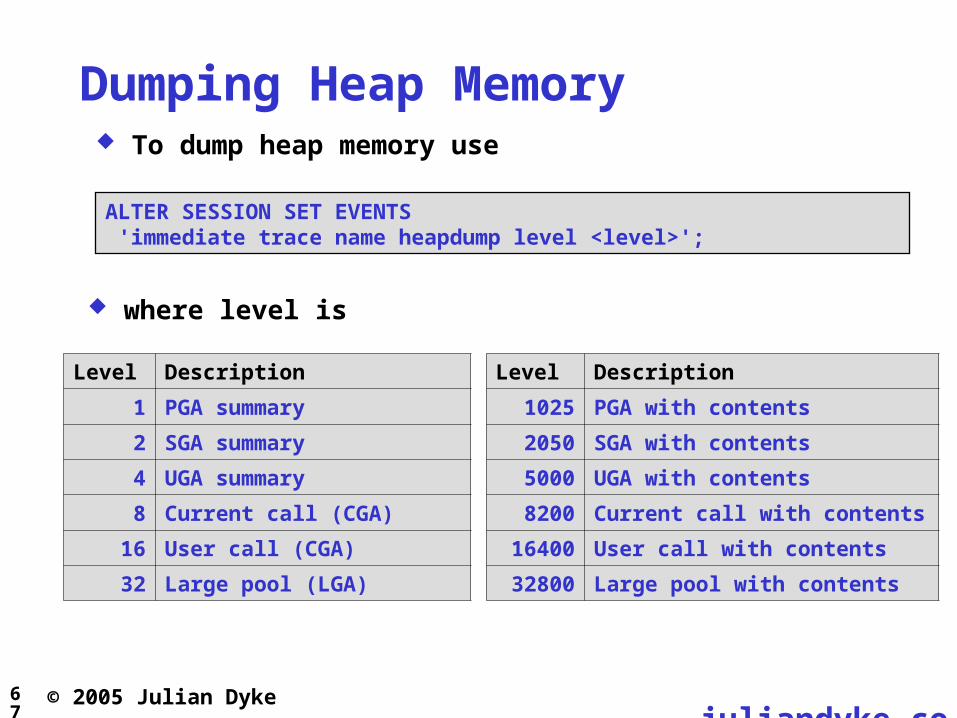
Dumping Heap Memory
ALTER SESSION SET EVENTS 'immediate trace name heapdump level <level>';
To dump heap memory use
Level Description
1 PGA summary
2 SGA summary
4 UGA summary
8 Current call (CGA)
16 User call (CGA)
32 Large pool (LGA)
Level Description
1025 PGA with contents
2050 SGA with contents
5000 UGA with contents
8200 Current call with contents
16400 User call with contents
32800 Large pool with contents
where level is
68 juliandyke.co
m
© 2005 Julian Dyke
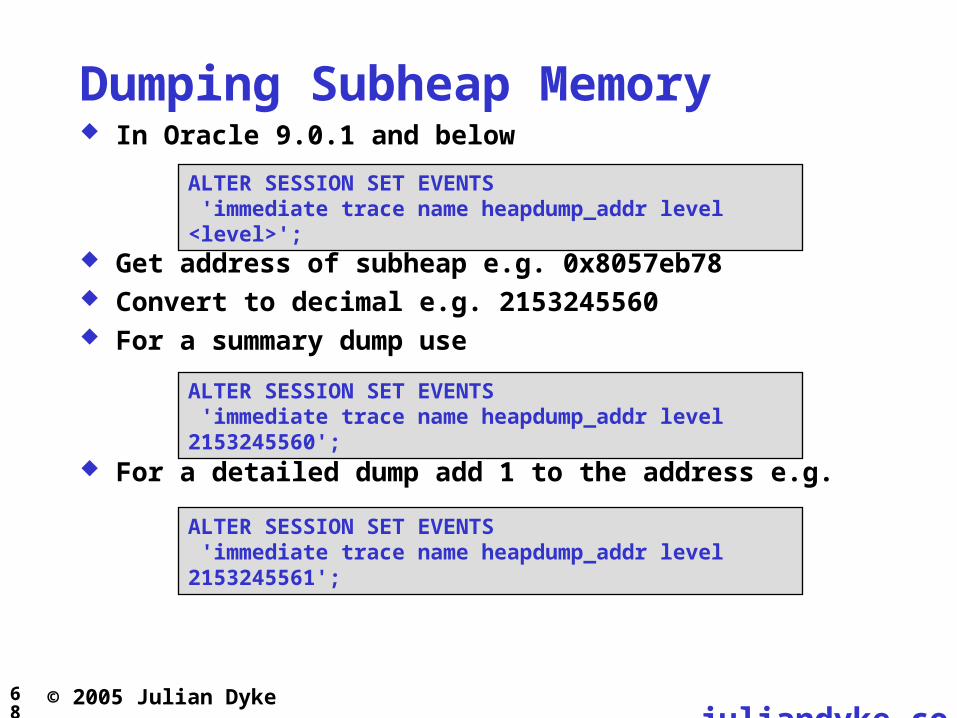
Dumping Subheap Memory In Oracle 9.0.1 and below
ALTER SESSION SET EVENTS 'immediate trace name heapdump_addr level <level>';
Get address of subheap e.g. 0x8057eb78 Convert to decimal e.g. 2153245560 For a summary dump use
ALTER SESSION SET EVENTS 'immediate trace name heapdump_addr level 2153245560';
For a detailed dump add 1 to the address e.g.
ALTER SESSION SET EVENTS 'immediate trace name heapdump_addr level 2153245561';
69 juliandyke.co
m
© 2005 Julian Dyke
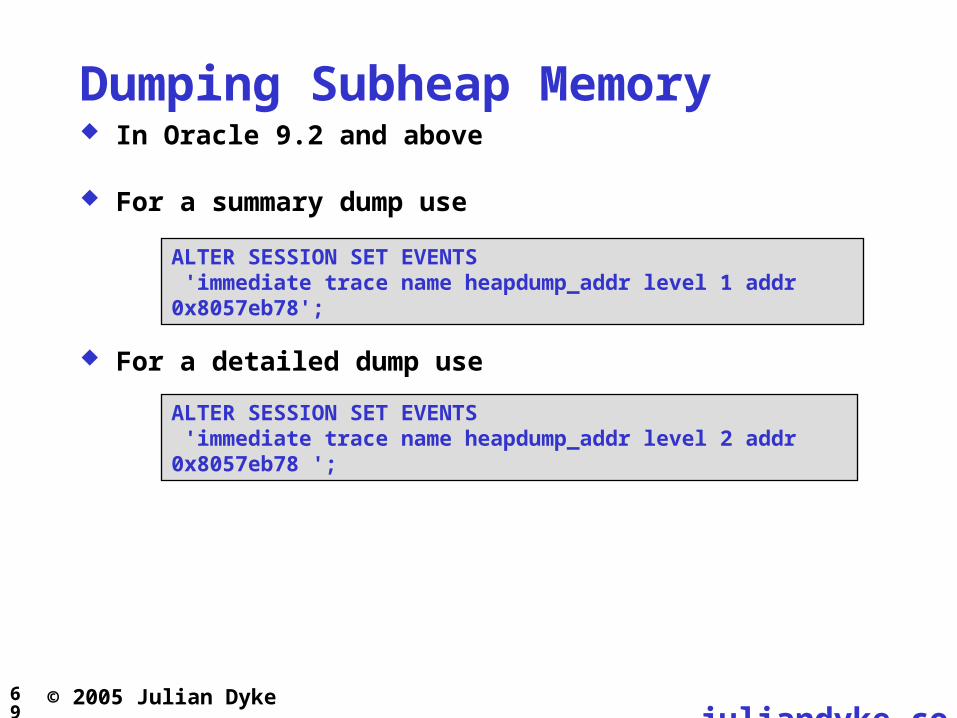
Dumping Subheap Memory In Oracle 9.2 and above
For a summary dump use
ALTER SESSION SET EVENTS 'immediate trace name heapdump_addr level 1 addr 0x8057eb78';
ALTER SESSION SET EVENTS 'immediate trace name heapdump_addr level 2 addr 0x8057eb78 ';
For a detailed dump use
70 juliandyke.co
m
© 2005 Julian Dyke
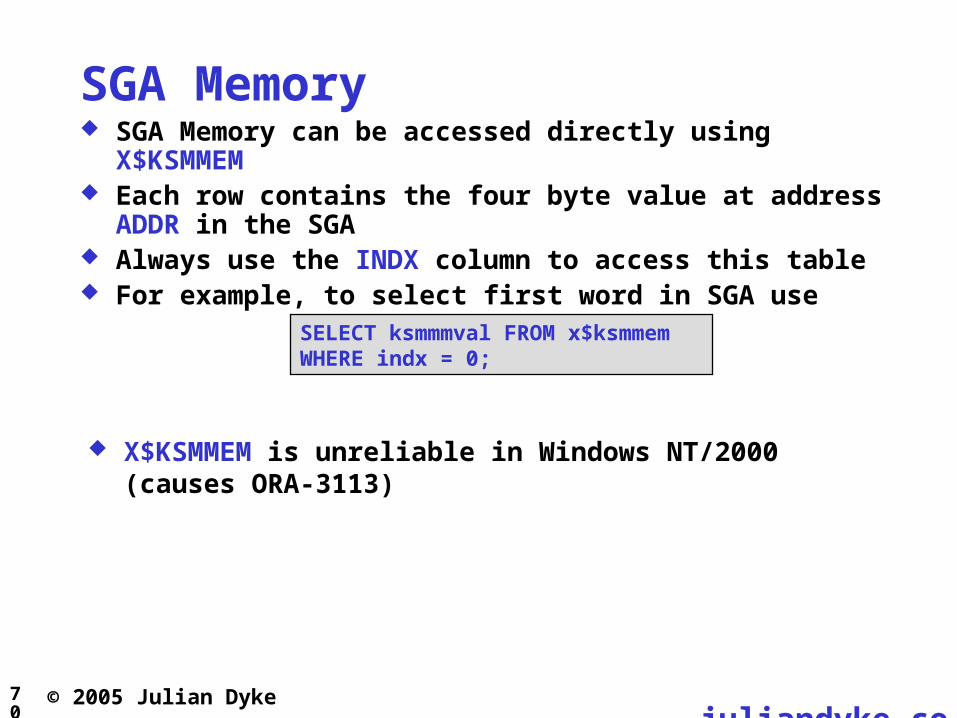
SGA Memory SGA Memory can be accessed directly using X$KSMMEM Each row contains the four byte value at address ADDR in the
SGA Always use the INDX column to access this table For example, to select first word in SGA use
SELECT ksmmmval FROM x$ksmmemWHERE indx = 0;
X$KSMMEM is unreliable in Windows NT/2000 (causes ORA-3113)
71 juliandyke.co
m
© 2005 Julian Dyke
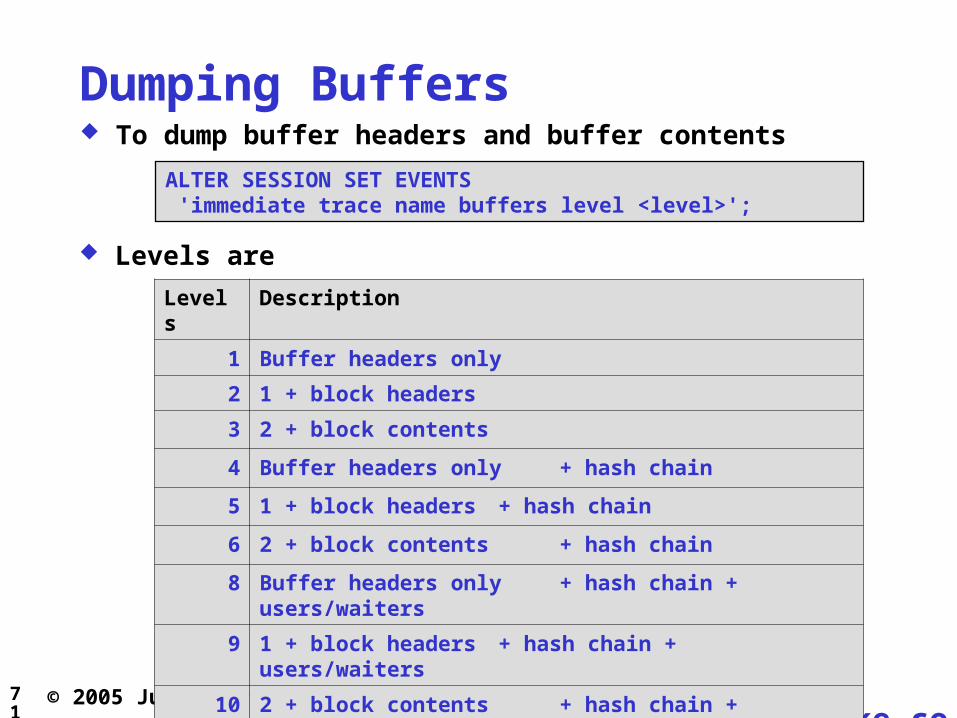
Dumping Buffers
ALTER SESSION SET EVENTS 'immediate trace name buffers level <level>';
To dump buffer headers and buffer contents
Levels Description
1 Buffer headers only
2 1 + block headers
3 2 + block contents
4 Buffer headers only + hash chain
5 1 + block headers + hash chain
6 2 + block contents + hash chain
8 Buffer headers only + hash chain + users/waiters
9 1 + block headers + hash chain + users/waiters
10 2 + block contents + hash chain + users/waiters
Levels are

72 juliandyke.co
m
© 2005 Julian Dyke
Dumping Specific Buffers To dump all buffers currently in the cache for a specific block First identify the tablespace number for the block e.g for TS01
ALTER SESSION SET EVENTS 'immediate trace name set_tsn_p1 level <level>';
SELECT ts# FROM sys.ts$WHERE name = 'TS01';
Set the tablespace number using
where level is the tablespace number + 1

73 juliandyke.co
m
© 2005 Julian Dyke
Dumping Specific Buffers
ALTER SESSION SET EVENTS 'immediate trace name buffer level <level>';
Identify the RDBA for the block This is equal to
RELATIVE_FNO * 4194304 + BLOCK_NUMBER
Dump the buffer using
where level is the RDBA e.g
e.g. for block 5/127874
= 5 * 4194304 + 127874 = 21099394
ALTER SESSION SET EVENTS 'immediate trace name buffer level 21099394';
74 juliandyke.co
m
© 2005 Julian Dyke
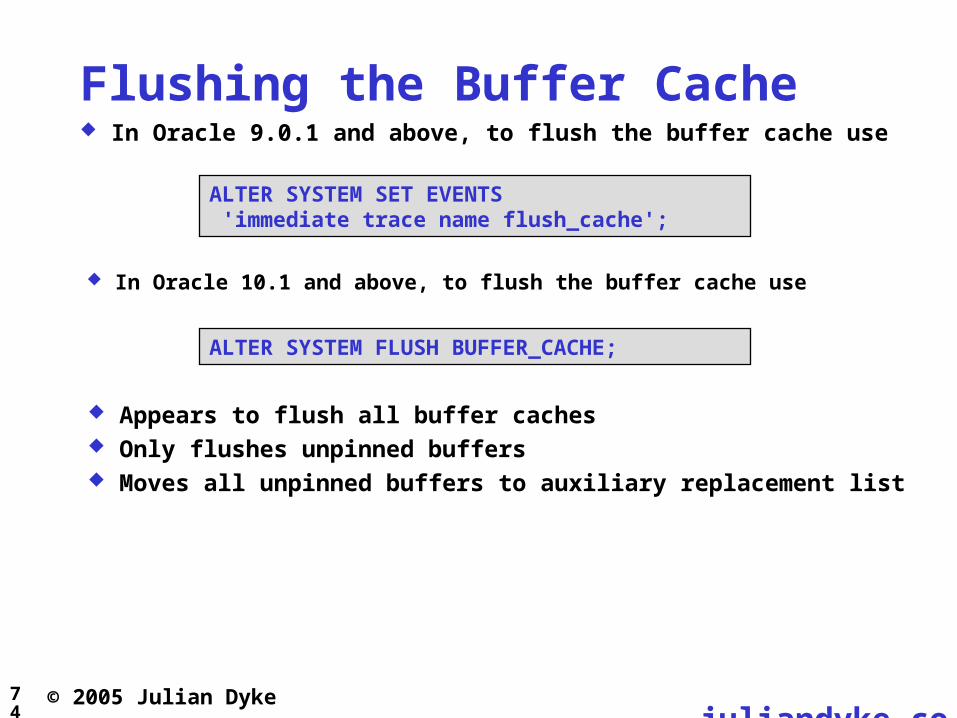
Flushing the Buffer Cache In Oracle 9.0.1 and above, to flush the buffer cache use
ALTER SYSTEM SET EVENTS 'immediate trace name flush_cache';
Appears to flush all buffer caches Only flushes unpinned buffers Moves all unpinned buffers to auxiliary replacement list
In Oracle 10.1 and above, to flush the buffer cache use
ALTER SYSTEM FLUSH BUFFER_CACHE;

75 juliandyke.co
m
© 2005 Julian Dyke
State Objects State objects are structures in the SGA describing state of
various database entities Common state objects include
# Description
2 Process
3 Call
4 Session
6 Enqueue
24 Buffer
34 DML Locks
38 Transaction
51 Library Object
52 Library Object Pin
61 Hash Table
76 juliandyke.co
m
© 2005 Julian Dyke
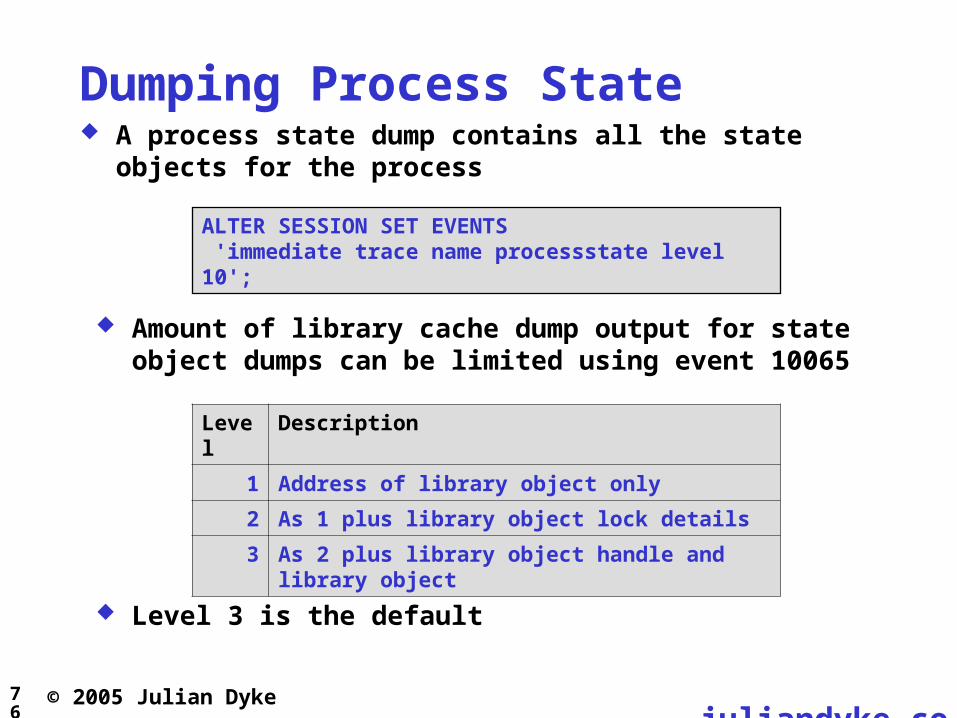
Dumping Process State
ALTER SESSION SET EVENTS 'immediate trace name processstate level 10';
A process state dump contains all the state objects for the process
Amount of library cache dump output for state object dumps can be limited using event 10065
Level Description
1 Address of library object only
2 As 1 plus library object lock details
3 As 2 plus library object handle and library object
Level 3 is the default
77 juliandyke.co
m
© 2005 Julian Dyke
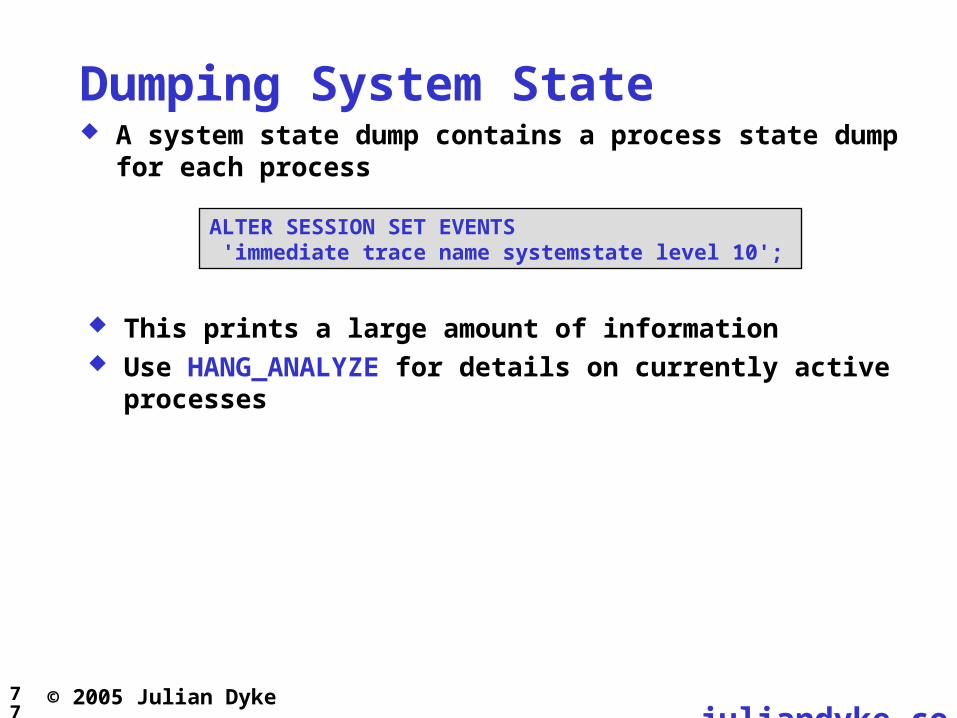
Dumping System State
ALTER SESSION SET EVENTS 'immediate trace name systemstate level 10';
A system state dump contains a process state dump for each process
This prints a large amount of information Use HANG_ANALYZE for details on currently active
processes
78 juliandyke.co
m
© 2005 Julian Dyke
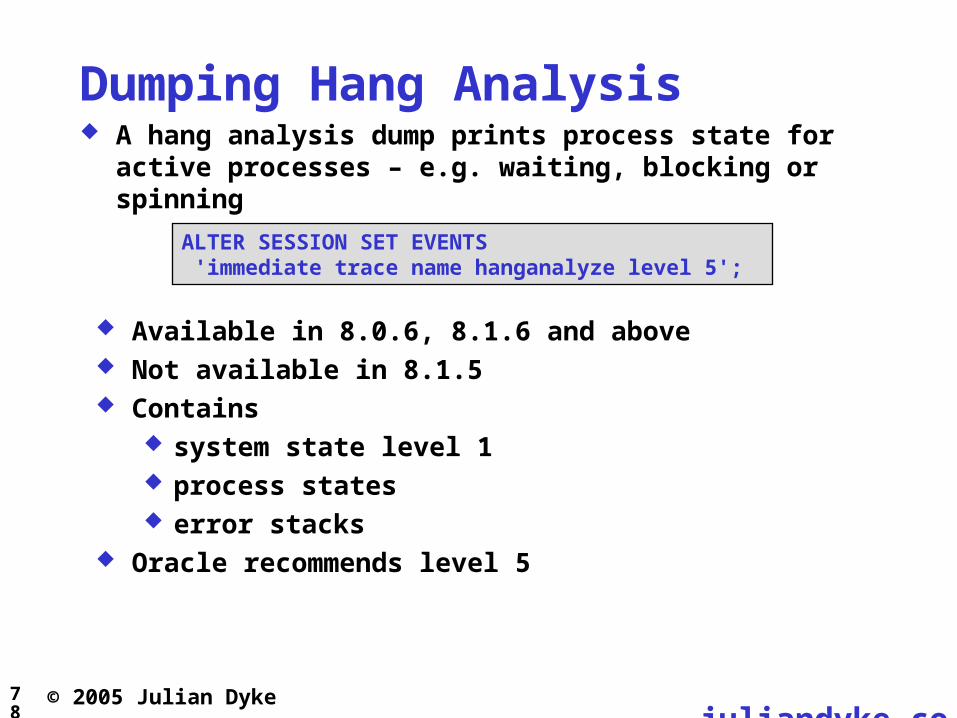
Dumping Hang Analysis
ALTER SESSION SET EVENTS 'immediate trace name hanganalyze level 5';
A hang analysis dump prints process state for active processes – e.g. waiting, blocking or spinning
Available in 8.0.6, 8.1.6 and above Not available in 8.1.5 Contains
system state level 1 process states error stacks
Oracle recommends level 5
79 juliandyke.co
m
© 2005 Julian Dyke
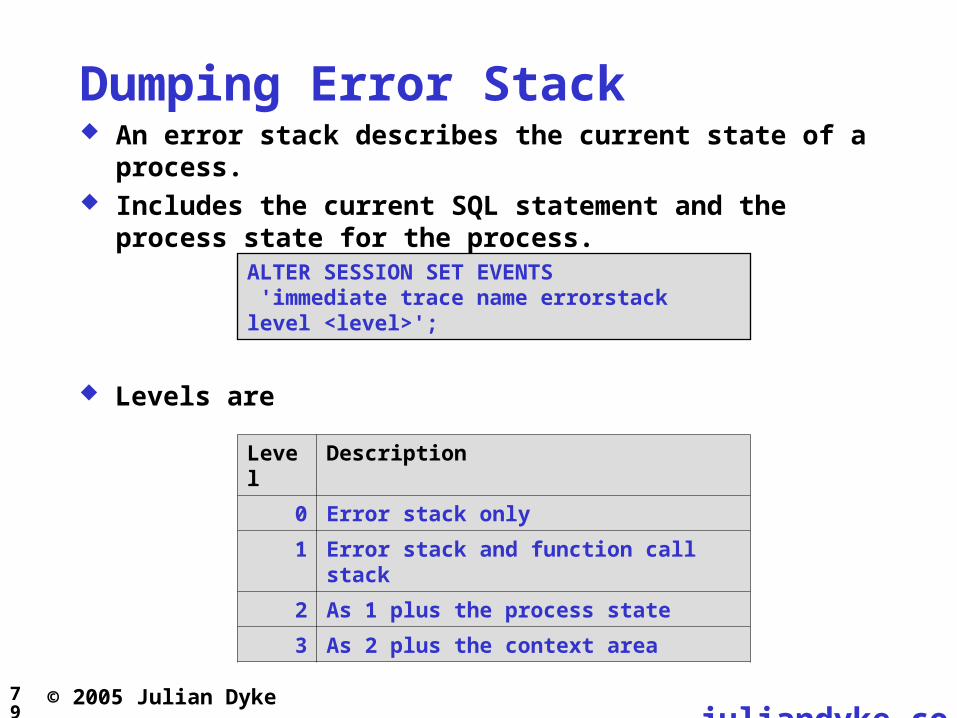
Dumping Error Stack
ALTER SESSION SET EVENTS 'immediate trace name errorstack level <level>';
An error stack describes the current state of a process. Includes the current SQL statement and the process state for
the process.
Level Description
0 Error stack only
1 Error stack and function call stack
2 As 1 plus the process state
3 As 2 plus the context area
Levels are
80 juliandyke.co
m
© 2005 Julian Dyke
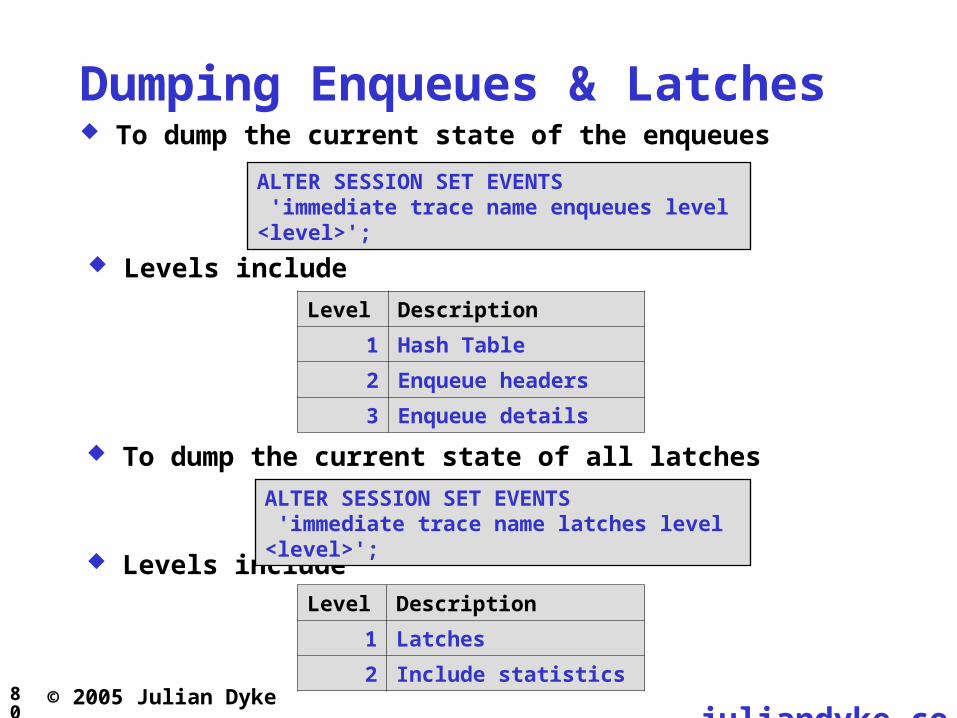
Dumping Enqueues & Latches
ALTER SESSION SET EVENTS 'immediate trace name enqueues level <level>';
To dump the current state of the enqueues
Level Description
1 Hash Table
2 Enqueue headers
3 Enqueue details
Levels include
Levels include
ALTER SESSION SET EVENTS 'immediate trace name latches level <level>';
Level Description
1 Latches
2 Include statistics
To dump the current state of all latches
81 juliandyke.co
m
© 2005 Julian Dyke
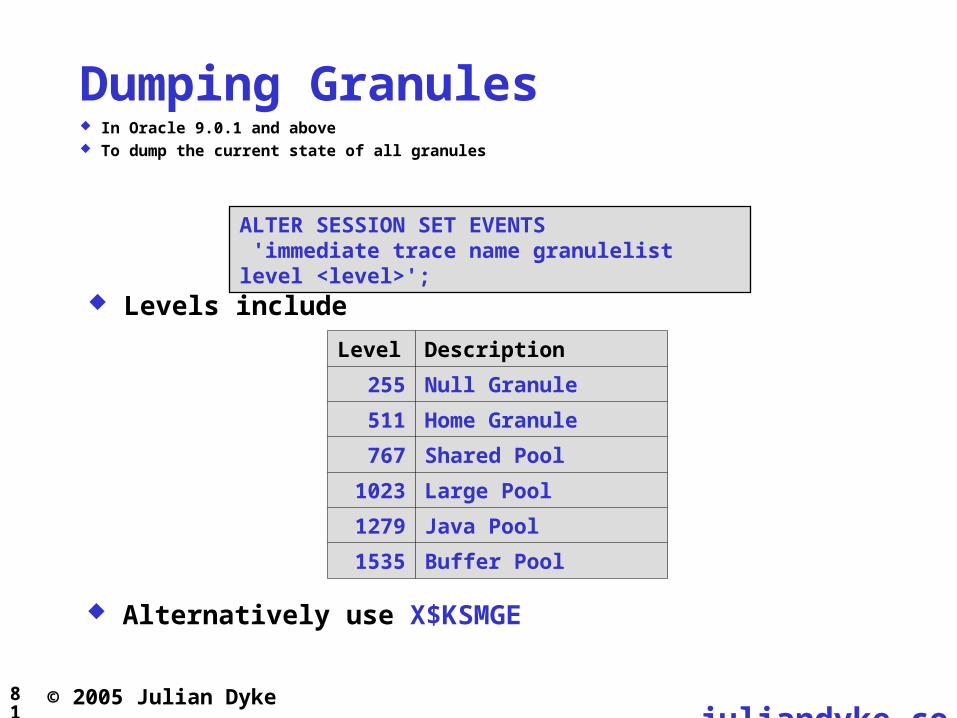
Dumping Granules
ALTER SESSION SET EVENTS 'immediate trace name granulelist level <level>';
In Oracle 9.0.1 and above To dump the current state of all granules
Level Description
255 Null Granule
511 Home Granule
767 Shared Pool
1023 Large Pool
1279 Java Pool
1535 Buffer Pool
Levels include
Alternatively use X$KSMGE
82 juliandyke.co
m
© 2005 Julian Dyke
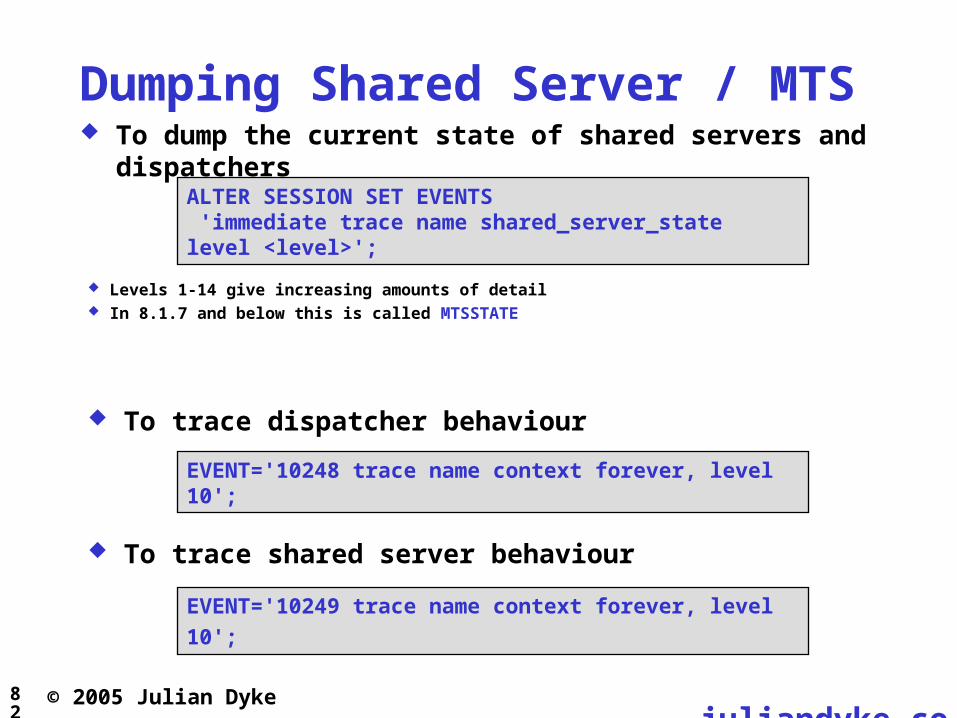
Dumping Shared Server / MTS To dump the current state of shared servers and dispatchers
ALTER SESSION SET EVENTS 'immediate trace name shared_server_state level <level>';
Levels 1-14 give increasing amounts of detail In 8.1.7 and below this is called MTSSTATE
EVENT='10248 trace name context forever, level 10';
To trace shared server behaviour
To trace dispatcher behaviour
EVENT='10249 trace name context forever, level 10';
83 juliandyke.co
m
© 2005 Julian Dyke
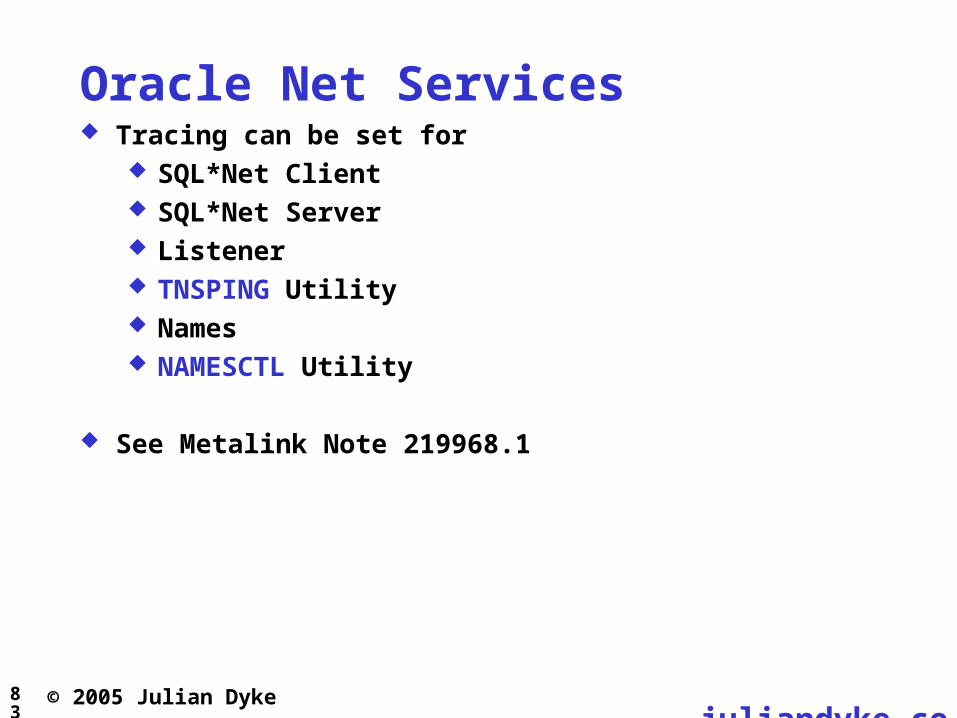
Oracle Net Services Tracing can be set for
SQL*Net Client SQL*Net Server Listener TNSPING Utility Names NAMESCTL Utility
See Metalink Note 219968.1
84 juliandyke.co
m
© 2005 Julian Dyke
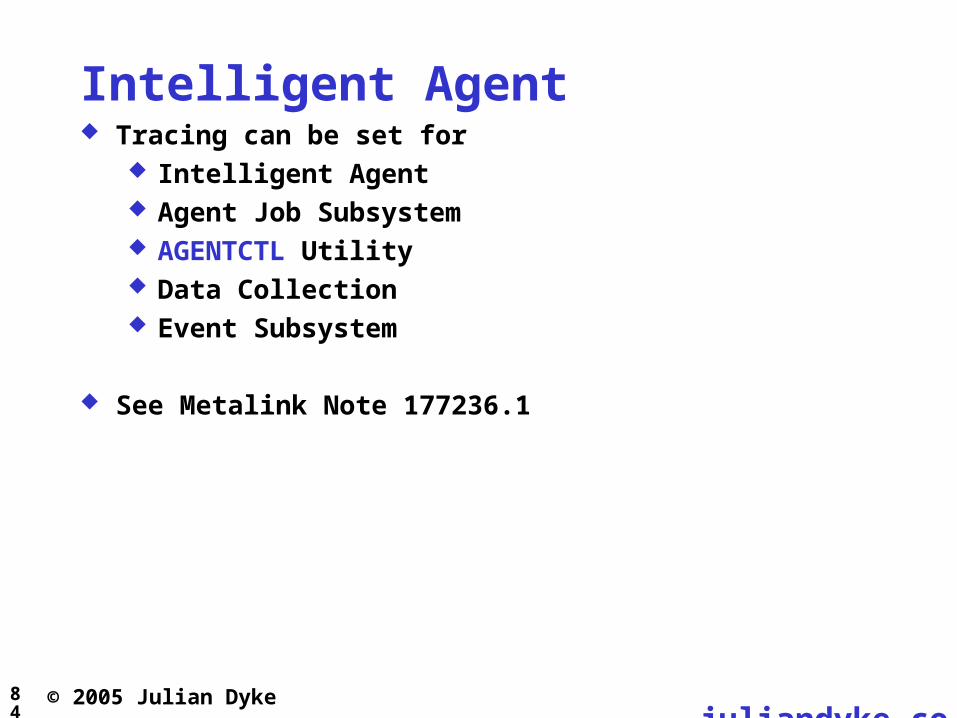
Intelligent Agent Tracing can be set for
Intelligent Agent Agent Job Subsystem AGENTCTL Utility Data Collection Event Subsystem
See Metalink Note 177236.1
85 juliandyke.co
m
© 2005 Julian Dyke
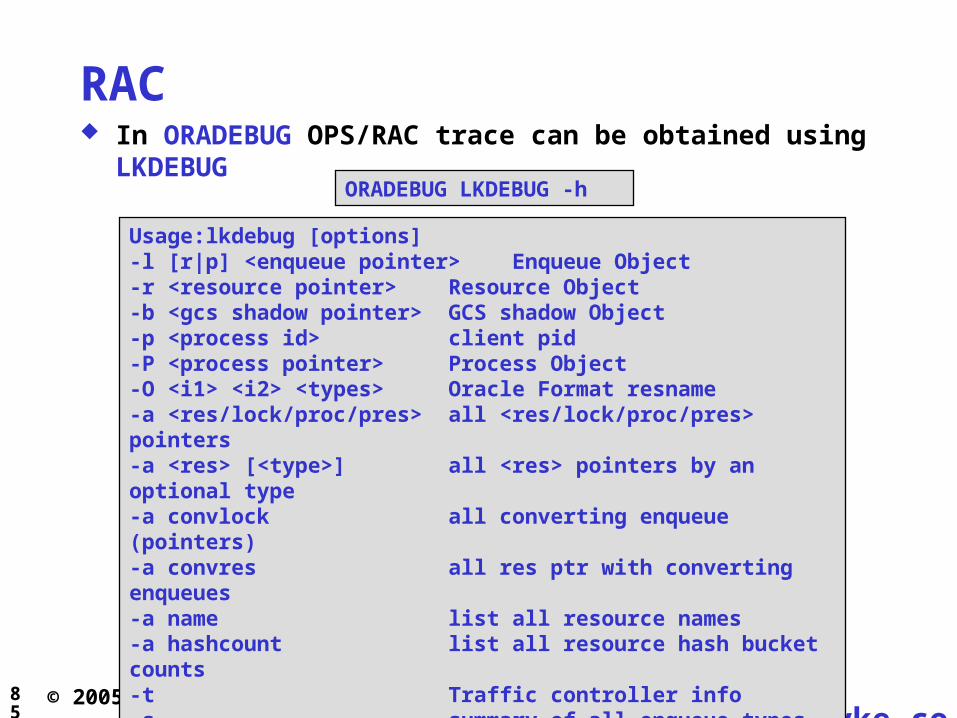
RAC In ORADEBUG OPS/RAC trace can be obtained using LKDEBUG
ORADEBUG LKDEBUG -h
Usage:lkdebug [options]-l [r|p] <enqueue pointer> Enqueue Object-r <resource pointer> Resource Object-b <gcs shadow pointer> GCS shadow Object-p <process id> client pid-P <process pointer> Process Object-O <i1> <i2> <types> Oracle Format resname-a <res/lock/proc/pres> all <res/lock/proc/pres> pointers-a <res> [<type>] all <res> pointers by an optional type-a convlock all converting enqueue (pointers)-a convres all res ptr with converting enqueues-a name list all resource names-a hashcount list all resource hash bucket counts-t Traffic controller info-s summary of all enqueue types-k GES SGA summary info

86 juliandyke.co
m
© 2005 Julian Dyke
RAC
ORADEBUG –g DEF LKDEBUG –s
All instances can be specified for subsequent commands using
The –g command prefix can also be used with LKDEBUG e.g for the default instance
ORADEBUG SETINST "all"
A list of instances can be specified using
ORADEBUG SETINST "1 2"
ORADEBUG –g "1 2" LKDEBUG –a lock
e.g for a list of instances
87 juliandyke.co
m
© 2005 Julian Dyke
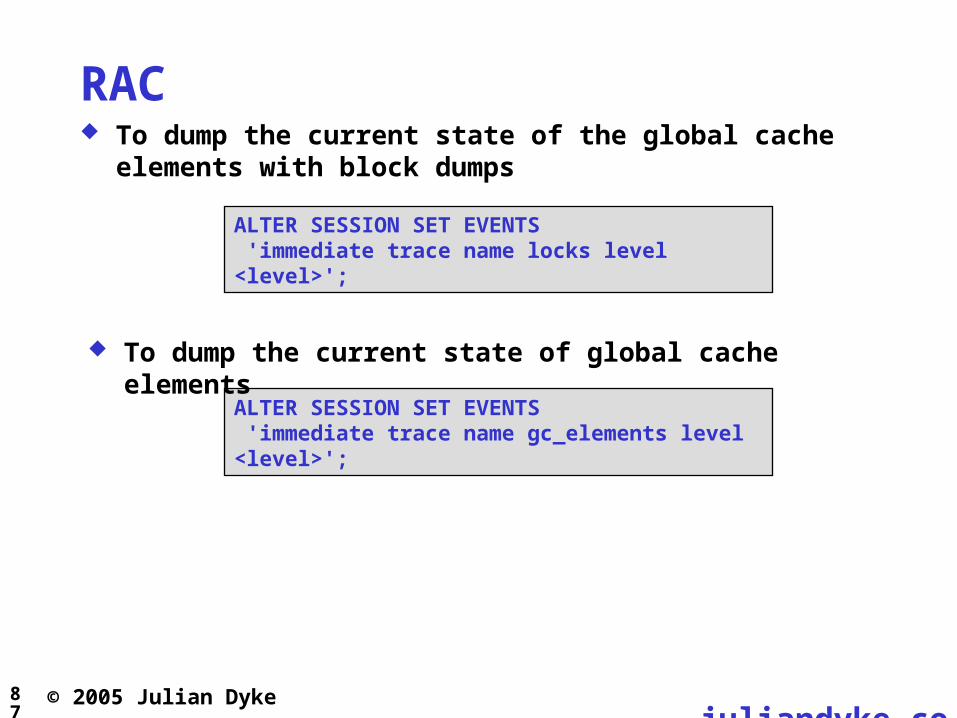
RAC
ALTER SESSION SET EVENTS 'immediate trace name gc_elements level <level>';
To dump the current state of the global cache elements with block dumps
To dump the current state of global cache elements
ALTER SESSION SET EVENTS 'immediate trace name locks level <level>';

88 juliandyke.co
m
© 2005 Julian Dyke
RAC
ALTER SESSION SET EVENTS '10704 trace name context forever, level 10';
To trace RAC buffer cache activity use
To trace which enqueues are being obtained use
ALTER SESSION SET EVENTS '10708 trace name context forever, level 10';
To trace global enqueue manipulation use
ALTER SESSION SET EVENTS '10706 trace name context forever, level 1';
_ksi_trace = 'TMTX';
To restrict the amount of information generated by this trace set _ksi_trace
e.g to restrict trace to TM and TX locks set
Instance(s) must be restarted after setting this parameter
89 juliandyke.co
m
© 2005 Julian Dyke
RAC Tracing can be set for
GSD GSDCTL SRVCONFIG SRVCTL
In Oracle 9.0.1 and 9.2 See Metalink Note 178683.1
In Oracle 10.1 and above Set the environment variable SRVM_TRACE to true
90 juliandyke.co
m
© 2005 Julian Dyke
Any Questions?
Julian Dyke
Intel Solution Services650 Wharfedale RoadWinnersh TriangleWokinghamBerkshireRG41 5TP