1 lab five. 2 lessons to be learned “look before you leap” “look before you leap” get a feel...
Post on 22-Dec-2015
213 views
TRANSCRIPT
11
Lab FiveLab Five
22
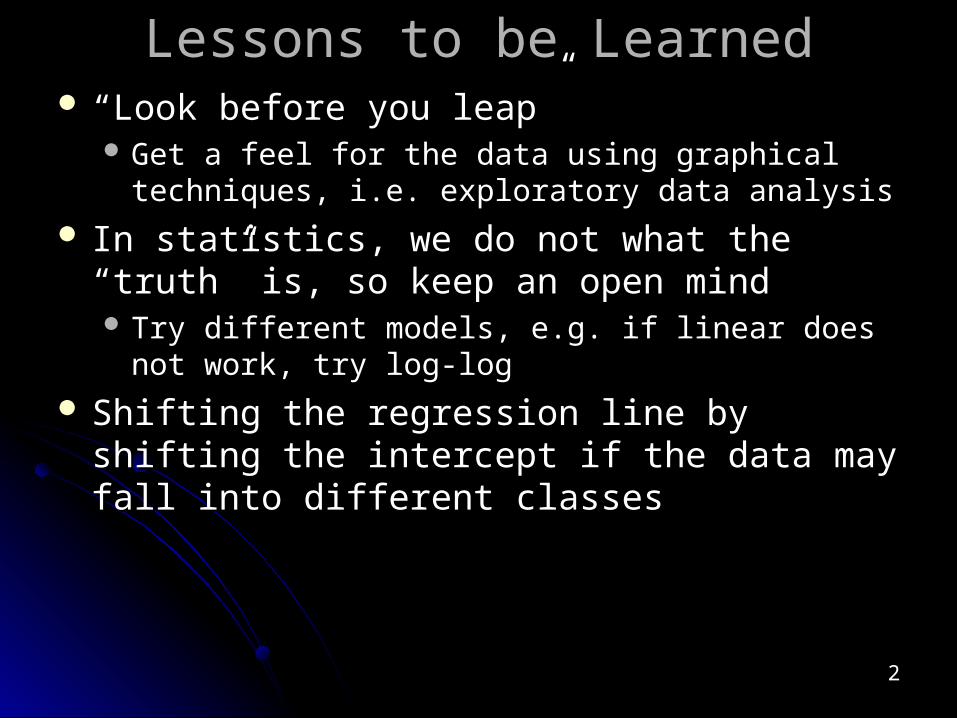
Lessons to be LearnedLessons to be Learned ““Look before you leap”Look before you leap”
Get a feel for the data using graphical techniques, i.e. Get a feel for the data using graphical techniques, i.e. exploratory data analysisexploratory data analysis
In statistics, we do not what the “truth” is, so In statistics, we do not what the “truth” is, so keep an open mindkeep an open mind Try different models, e.g. if linear does not work, try Try different models, e.g. if linear does not work, try
log-loglog-log
Shifting the regression line by shifting the Shifting the regression line by shifting the intercept if the data may fall into different classesintercept if the data may fall into different classes
33
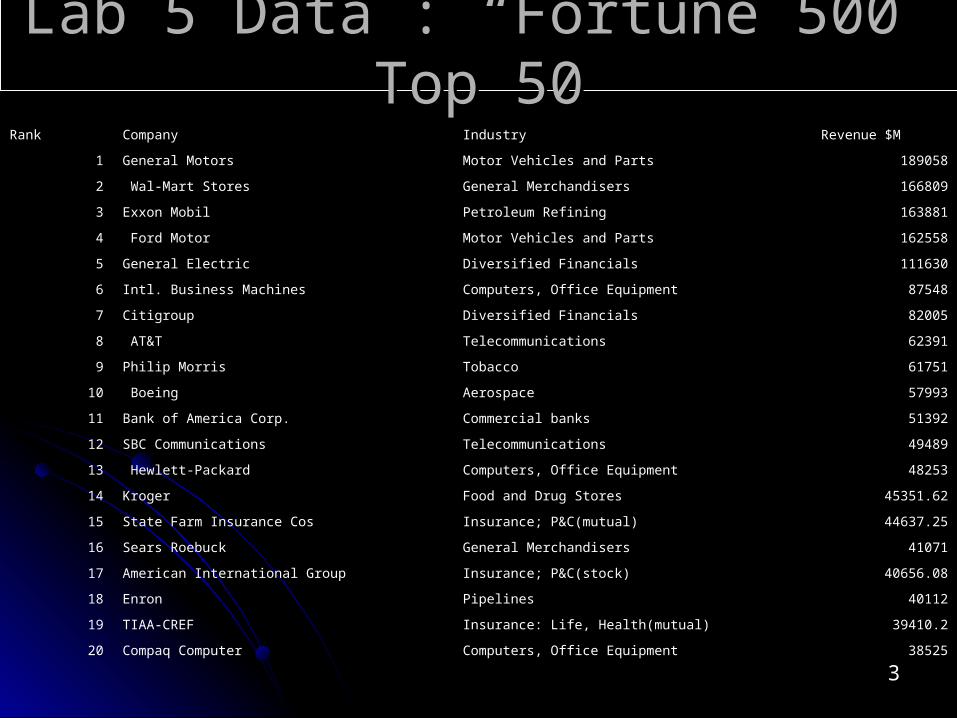
Lab 5 Data : “Fortune 500” Top 50Lab 5 Data : “Fortune 500” Top 50Rank Company Industry Revenue $M
1 General Motors Motor Vehicles and Parts 189058
2 Wal-Mart Stores General Merchandisers 166809
3 Exxon Mobil Petroleum Refining 163881
4 Ford Motor Motor Vehicles and Parts 162558
5 General Electric Diversified Financials 111630
6 Intl. Business Machines Computers, Office Equipment 87548
7 Citigroup Diversified Financials 82005
8 AT&T Telecommunications 62391
9 Philip Morris Tobacco 61751
10 Boeing Aerospace 57993
11 Bank of America Corp. Commercial banks 51392
12 SBC Communications Telecommunications 49489
13 Hewlett-Packard Computers, Office Equipment 48253
14 Kroger Food and Drug Stores 45351.62
15 State Farm Insurance Cos Insurance; P&C(mutual) 44637.25
16 Sears Roebuck General Merchandisers 41071
17 American International Group Insurance; P&C(stock) 40656.08
18 Enron Pipelines 40112
19 TIAA-CREF Insurance: Life, Health(mutual) 39410.2
20 Compaq Computer Computers, Office Equipment 38525
44
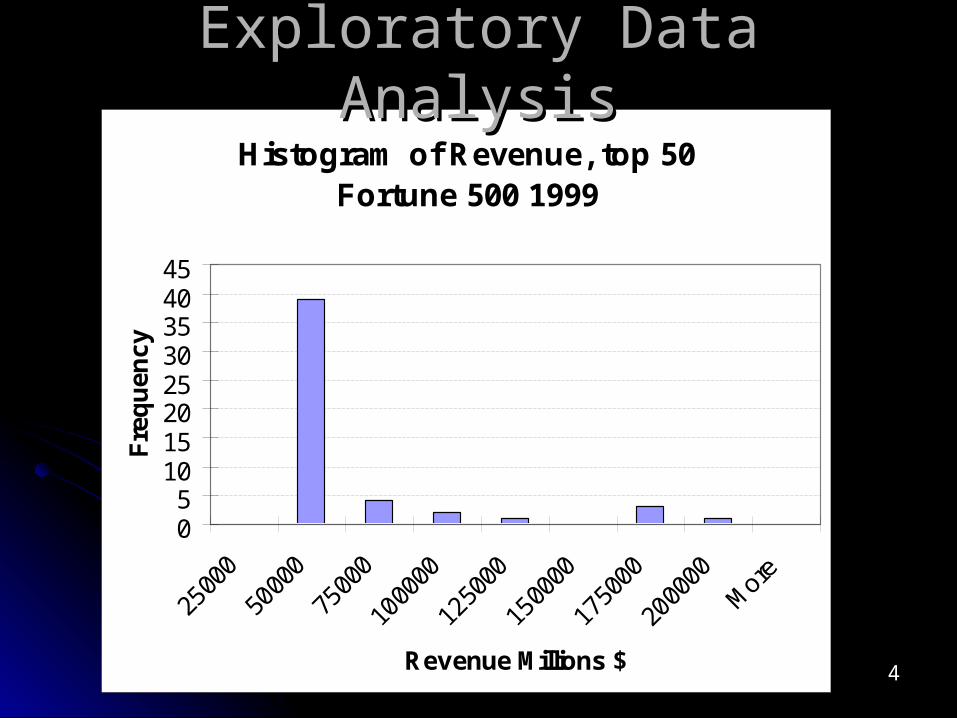
Histogram of Revenue, top 50 Fortune 500 1999
05
1015202530354045
2500
0
5000
0
7500
0
1000
00
1250
00
1500
00
1750
00
2000
00M
ore
Revenue Millions $
Fre
qu
ency
Exploratory Data AnalysisExploratory Data Analysis
55
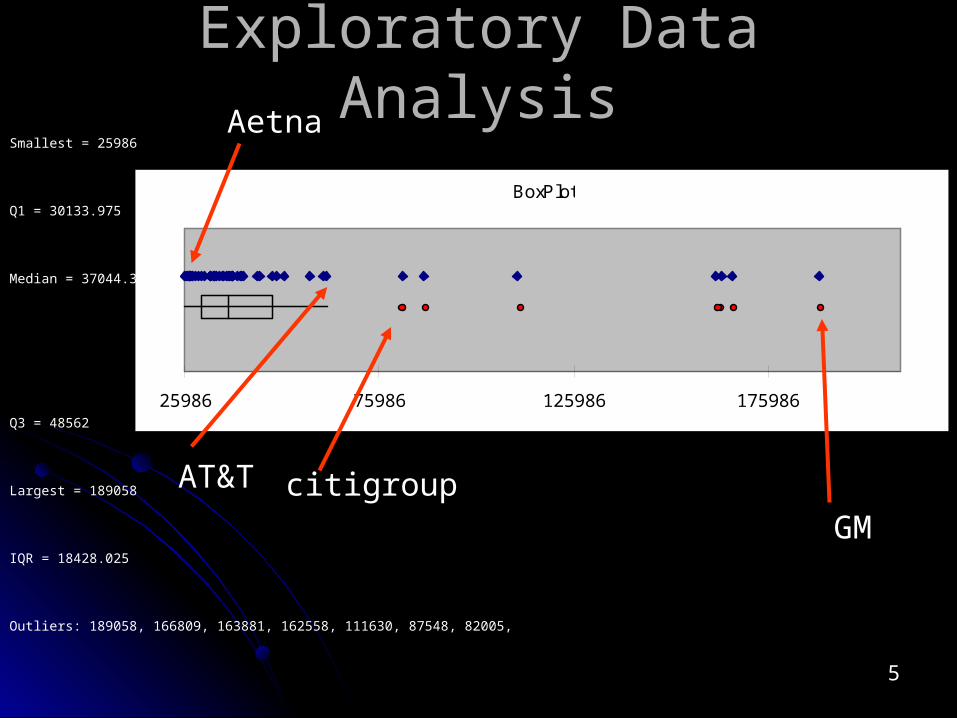
Exploratory Data AnalysisExploratory Data Analysis
BoxPlot
25986 75986 125986 175986
Smallest = 25986
Q1 = 30133.975
Median = 37044.3
Q3 = 48562
Largest = 189058
IQR = 18428.025
Outliers: 189058, 166809, 163881, 162558, 111630, 87548, 82005,
GMcitigroupAT&T
Aetna
66
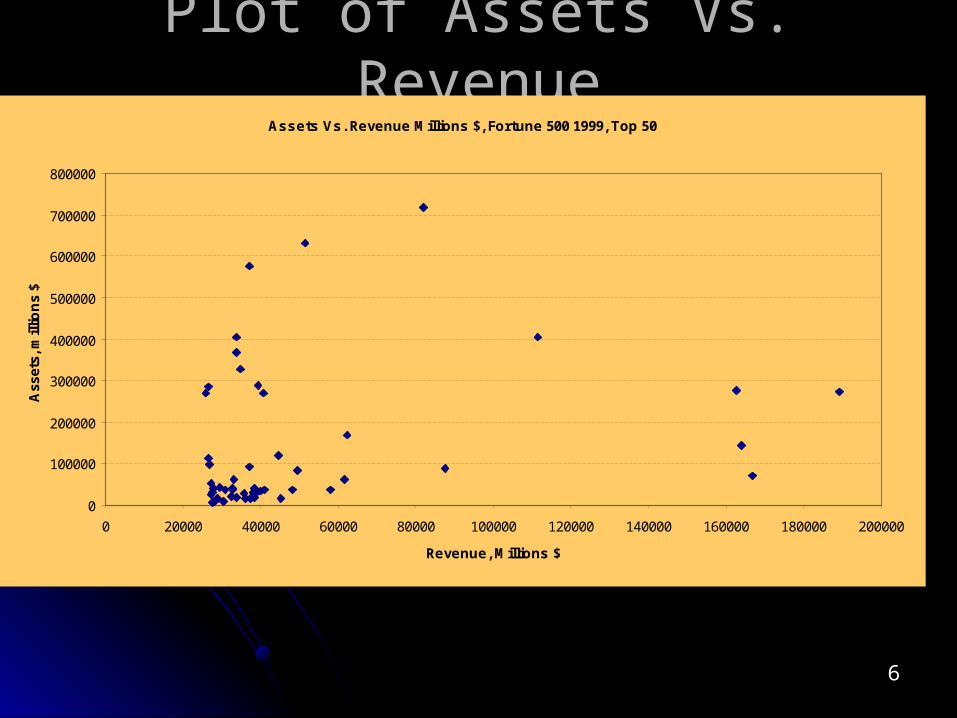
Plot of Assets Vs. RevenuePlot of Assets Vs. RevenueAssets Vs. Revenue Millions $, Fortune 500 1999, Top 50
0
100000
200000
300000
400000
500000
600000
700000
800000
0 20000 40000 60000 80000 100000 120000 140000 160000 180000 200000
Revenue, Millions $
Ass
ets,
mill
ion
s $
77
88
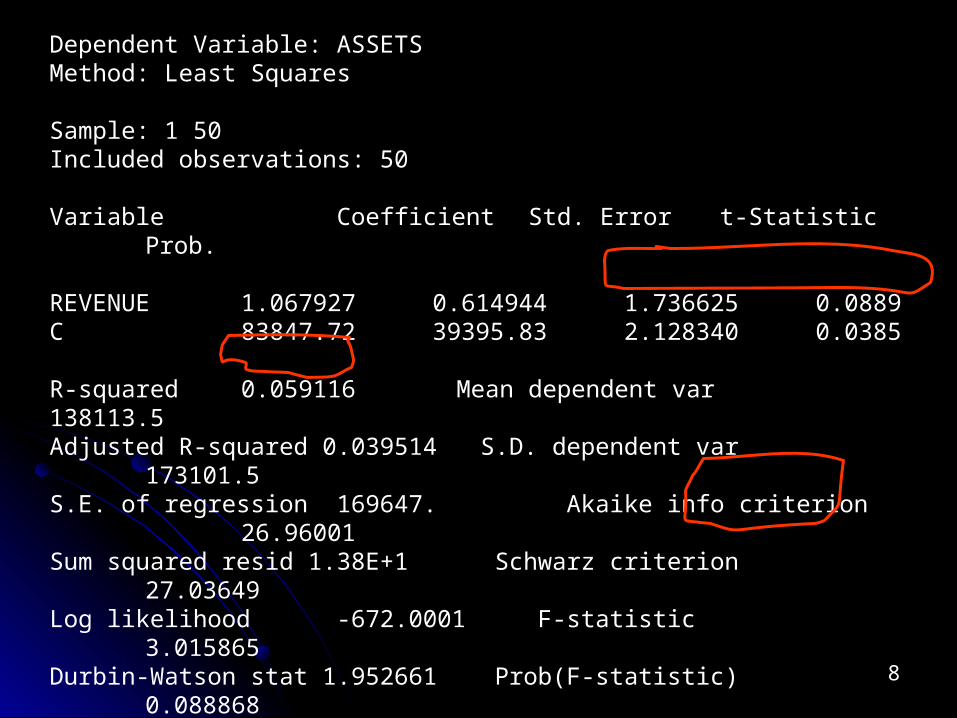
Dependent Variable: ASSETSMethod: Least Squares
Sample: 1 50Included observations: 50
Variable Coefficient Std. Error t-Statistic Prob.
REVENUE 1.067927 0.614944 1.736625 0.0889C 83847.72 39395.83 2.128340 0.0385
R-squared 0.059116 Mean dependent var 138113.5Adjusted R-squared 0.039514 S.D. dependent var 173101.5S.E. of regression169647. Akaike info criterion 26.96001Sum squared resid 1.38E+1 Schwarz criterion 27.03649Log likelihood -672.0001 F-statistic 3.015865Durbin-Watson stat 1.952661 Prob(F-statistic) 0.088868
99
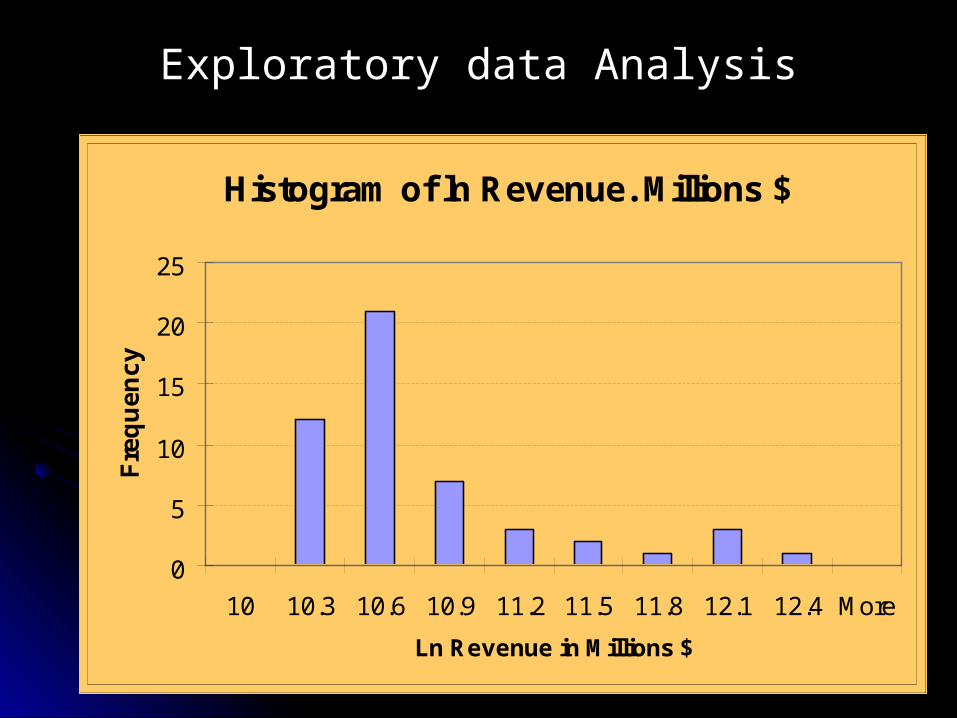
Histogram of ln Revenue. Millions $
0
5
10
15
20
25
10 10.3 10.6 10.9 11.2 11.5 11.8 12.1 12.4 More
Ln Revenue in Millions $
Fre
qu
en
cy
Exploratory data Analysis

1010
Fortune 500, 1999: Assets Vs. Revenue, In Logs
General Electric
CitigroupBank of AmericaFannie May
Chase ManhattenMorgan Stanley
Merrill LynchPrudential
Bank One American InternationalTIAA-CREF
State Farm
Allstate
1000
10000
100000
1000000
10000 100000 1000000
Log Revenue
Lo
g A
ss
ets
Transformation: Ln Assets = a+b Ln Revenue + e
1111
Finance Vs. Trade?Finance Vs. Trade?Fortune 500, 1999: Assets Vs. Revenue, In Logs
General Motors
Exxon Mobil
Wal-Mart
Kroger
Ingram Micro
Costco Wholesale
McKesson HBOC
General Electric
CitigroupBank of AmericaFannie May
Chase ManhattenMorgan Stanley
Merrill LynchPrudential
Bank One American InternationalTIAA-CREF
State Farm
Allstate
1000
10000
100000
1000000
10000 100000 1000000
Log Revenue
Lo
g A
ss
ets

1212
1313
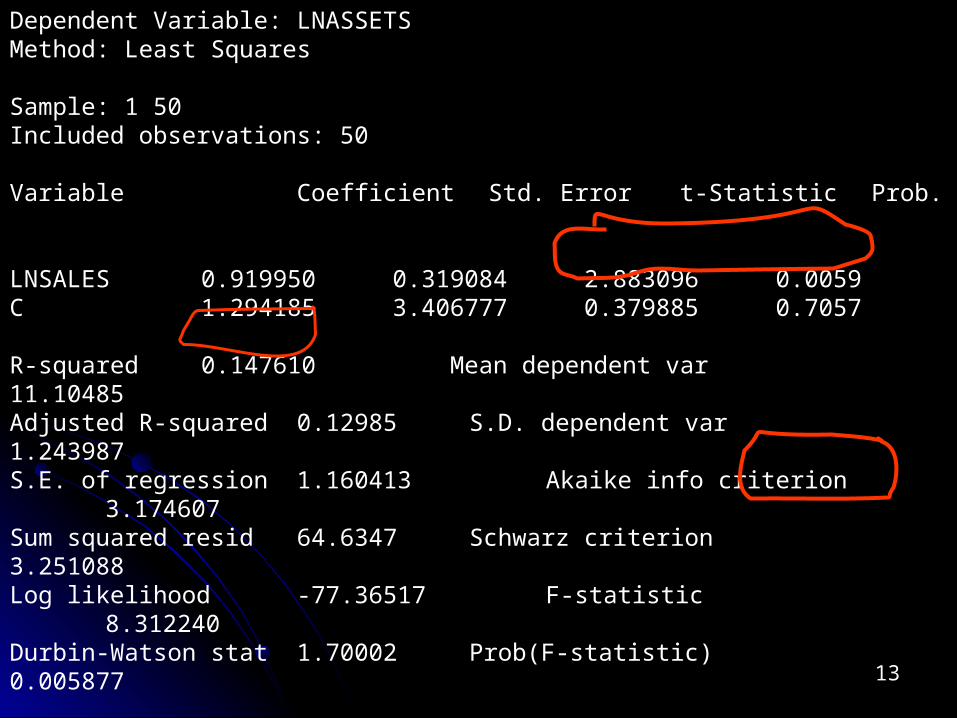
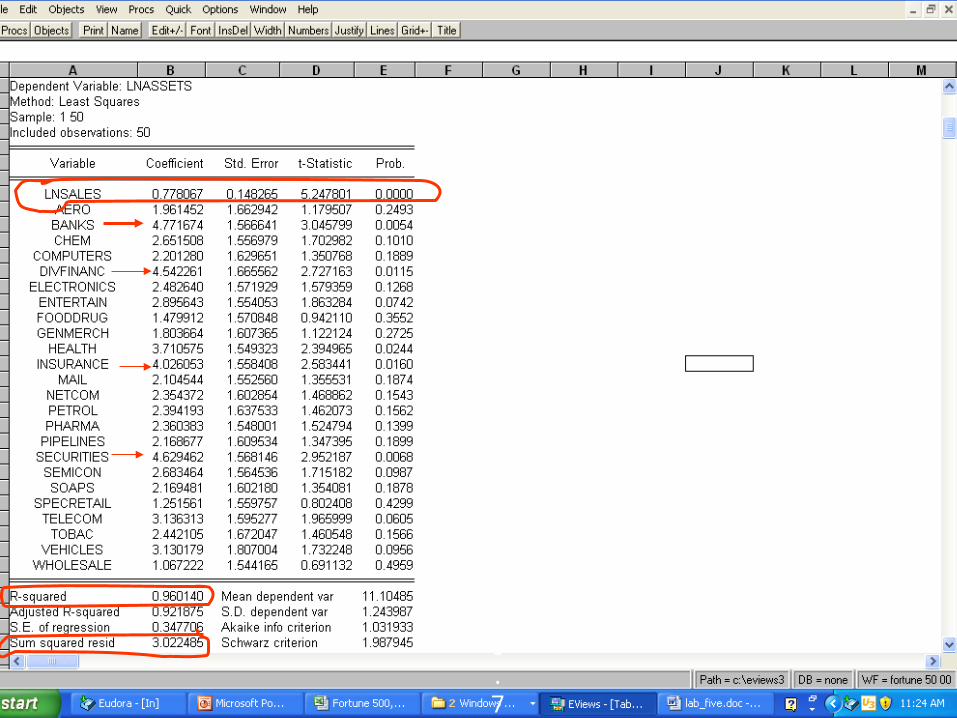
Dependent Variable: LNASSETSMethod: Least Squares
Sample: 1 50Included observations: 50
Variable Coefficient Std. Error t-Statistic Prob.
LNSALES 0.919950 0.319084 2.883096 0.0059C 1.294185 3.406777 0.379885 0.7057
R-squared 0.147610 Mean dependent var 11.10485Adjusted R-squared 0.12985 S.D. dependent var 1.243987S.E. of regression1.160413 Akaike info criterion 3.174607Sum squared resid 64.6347 Schwarz criterion 3.251088Log likelihood -77.36517 F-statistic 8.312240Durbin-Watson stat 1.70002 Prob(F-statistic) 0.005877
1414
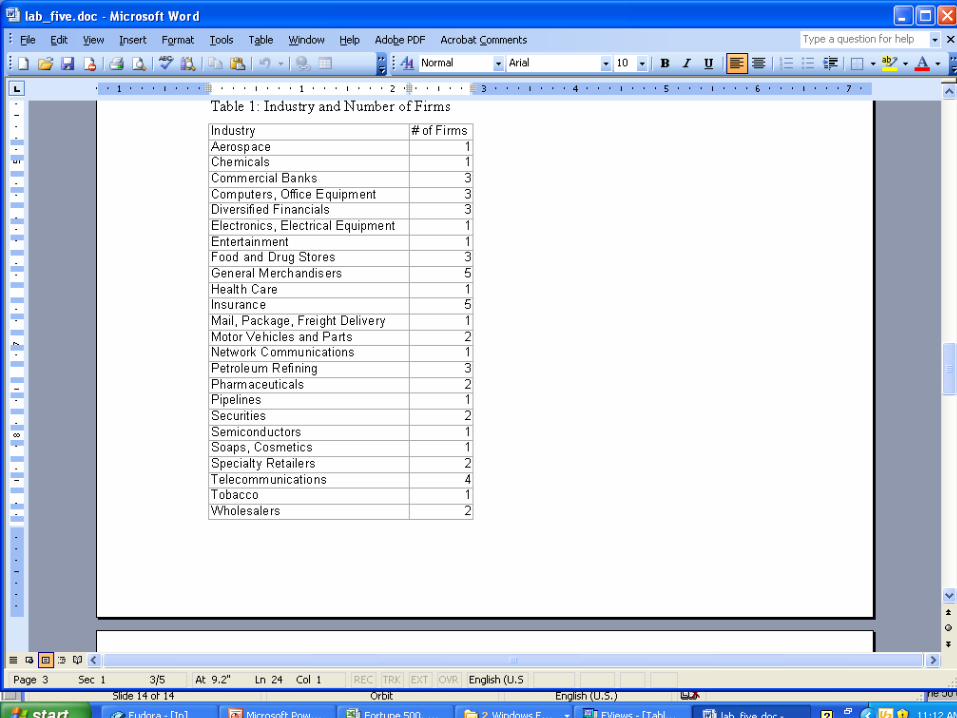
Table 1: Industry and Number of Firms
Industry# of Firms
Aerospace 1
Chemicals 1
Commercial Banks 3
Computers, Office Equipment 3
Diversified Financials 3
Electronics, Electrical Equipment
1
Entertainment 1
Food and Drug Stores 3
General Merchandisers 5
Health Care 1
Insurance 5
Mail, Package, Freight Delivery 1
Motor Vehicles and Parts 2
Network Communications 1
Petroleum Refining 3
Pharmaceuticals 2
Pipelines 1
Securities 2
Semiconductors 1
Soaps, Cosmetics 1
Specialty Retailers 2
Telecommunications 4
Tobacco 1
Wholesalers 2
Industry # of Firms
Aerospace 1
Chemicals 1
Commercial Banks 3
Computers, Office Equipment 3
Diversified Financials 3
Electronics, Electrical Equipment
1
Entertainment 1
Food and Drug Stores 3
General Merchandisers 5
Health Care 1
Insurance 5
Mail, Package, Freight Delivery 1
Motor Vehicles and Parts 2
Network Communications 1
Petroleum Refining 3
Pharmaceuticals 2
Pipelines 1
Securities 2
Semiconductors 1
Soaps, Cosmetics 1
Specialty Retailers 2
Telecommunications 4
Tobacco 1
Wholesalers 2

1515
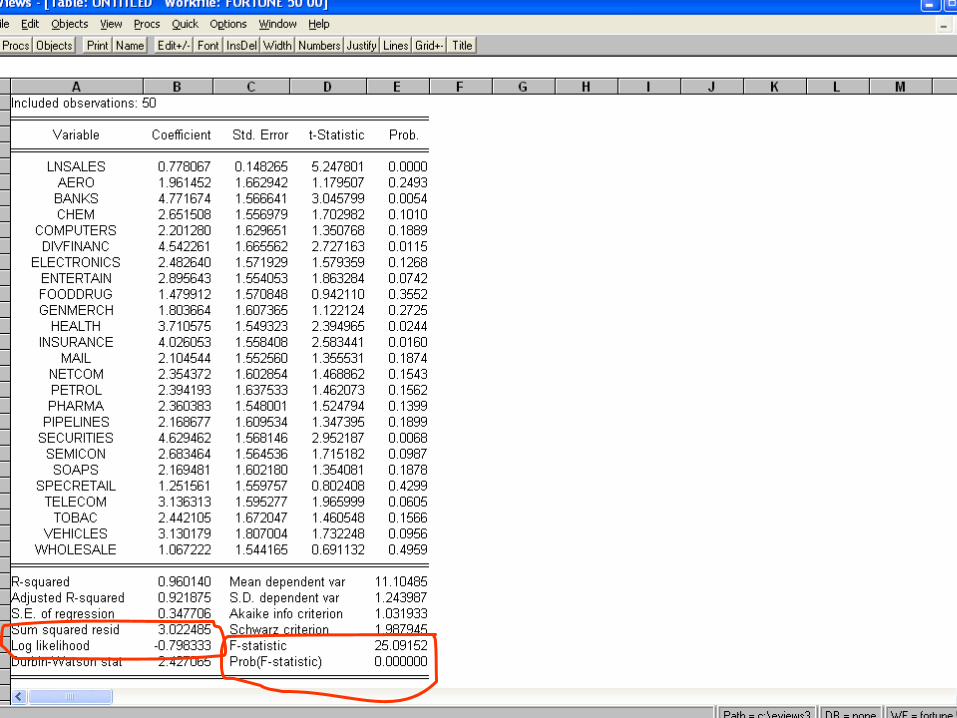
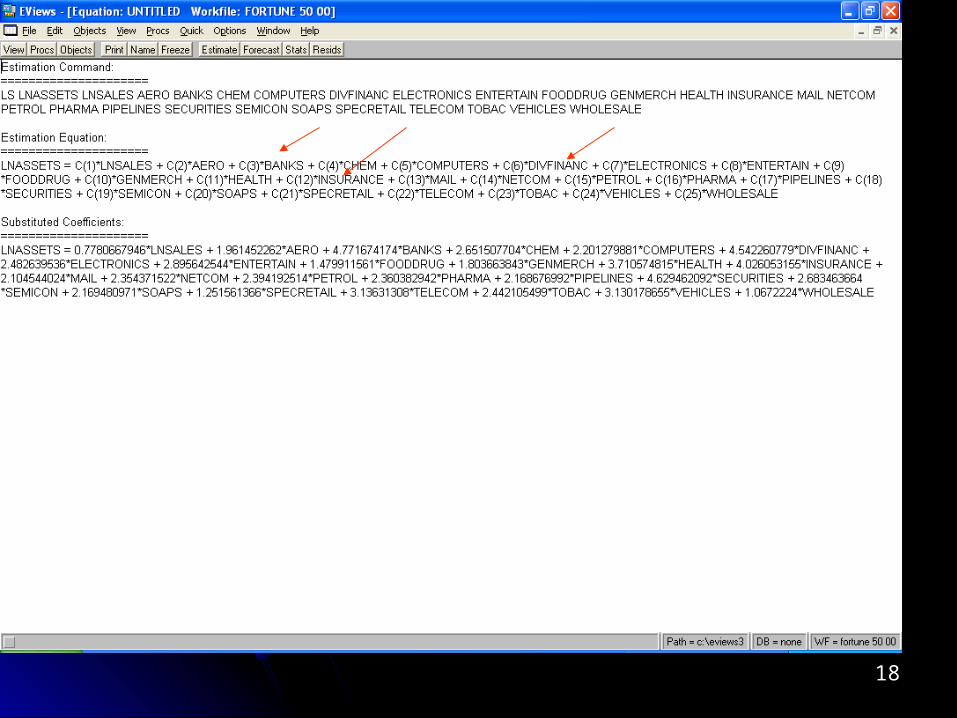
Ln-ln Regression with Industry Ln-ln Regression with Industry DummiesDummies
1616
Log likelihood
-0.798333
F-statistic
25.09152Durbin-Watson stat
2.427065
Prob(F-statistic)
0.000000
1717
1818
1919
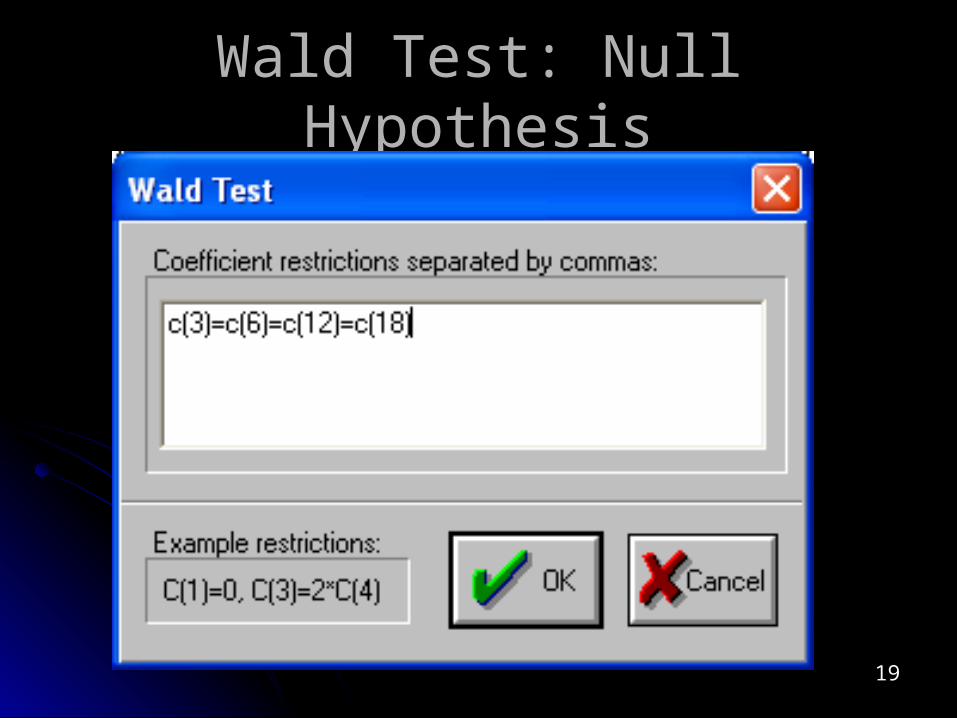
Wald Test: Null HypothesisWald Test: Null Hypothesis
2020
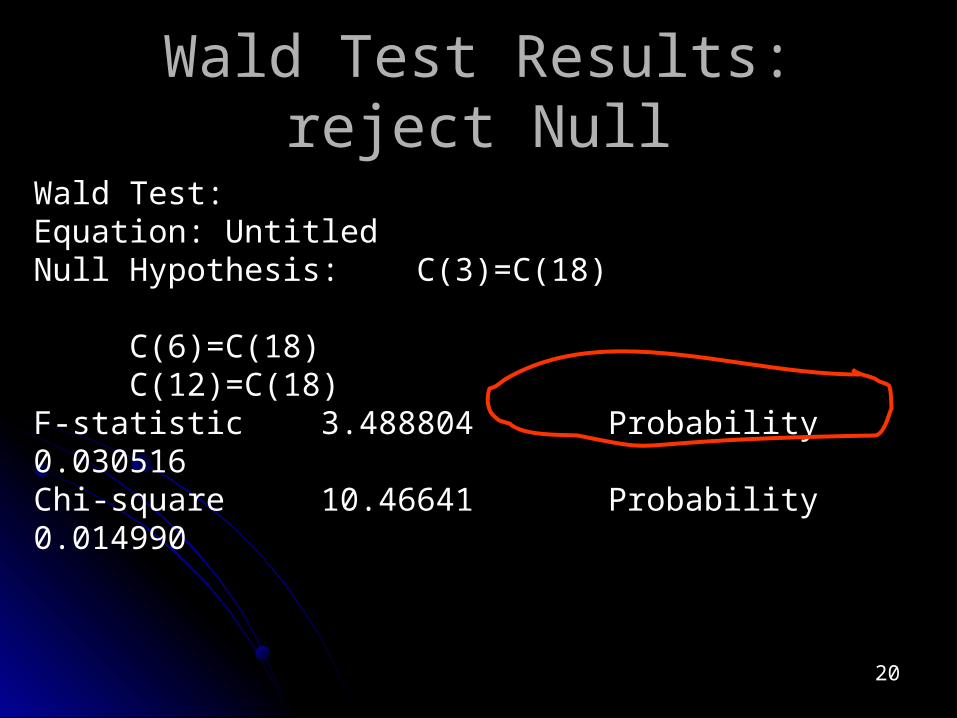
Wald Test Results: reject NullWald Test Results: reject Null
Wald Test:Equation: UntitledNull Hypothesis: C(3)=C(18)
C(6)=C(18)C(12)=C(18)
F-statistic 3.488804 Probability 0.030516Chi-square 10.46641 Probability 0.014990
2121
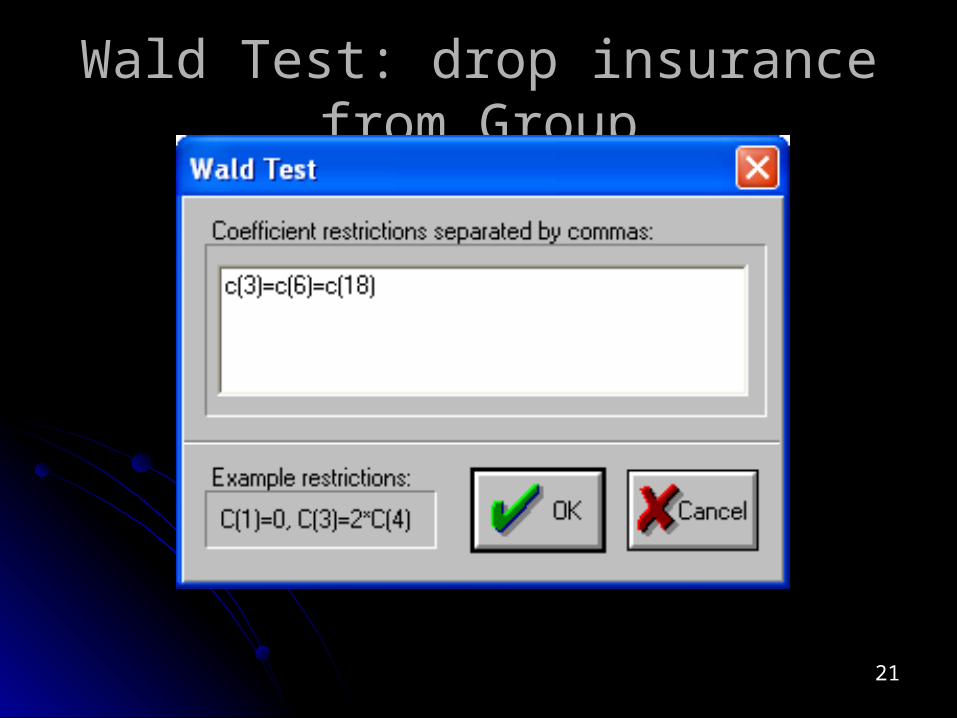
Wald Test: drop insurance from GroupWald Test: drop insurance from Group
2222
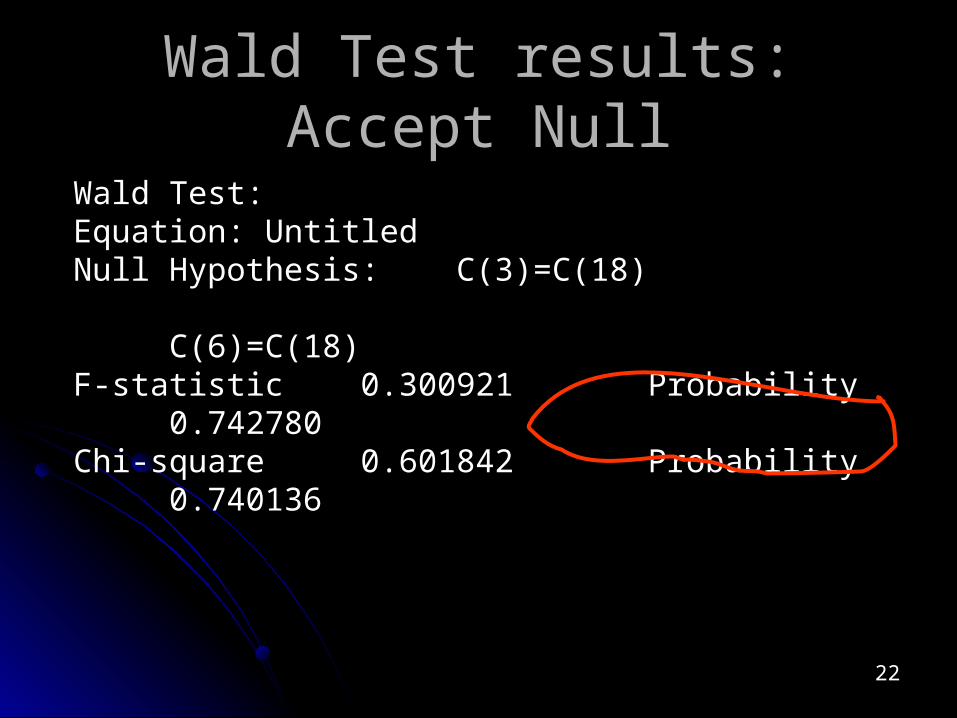
Wald Test results: Accept NullWald Test results: Accept Null
Wald Test:Equation: UntitledNull Hypothesis: C(3)=C(18)
C(6)=C(18)F-statistic 0.300921 Probability 0.742780
Chi-square 0.601842 Probability 0.740136
2323
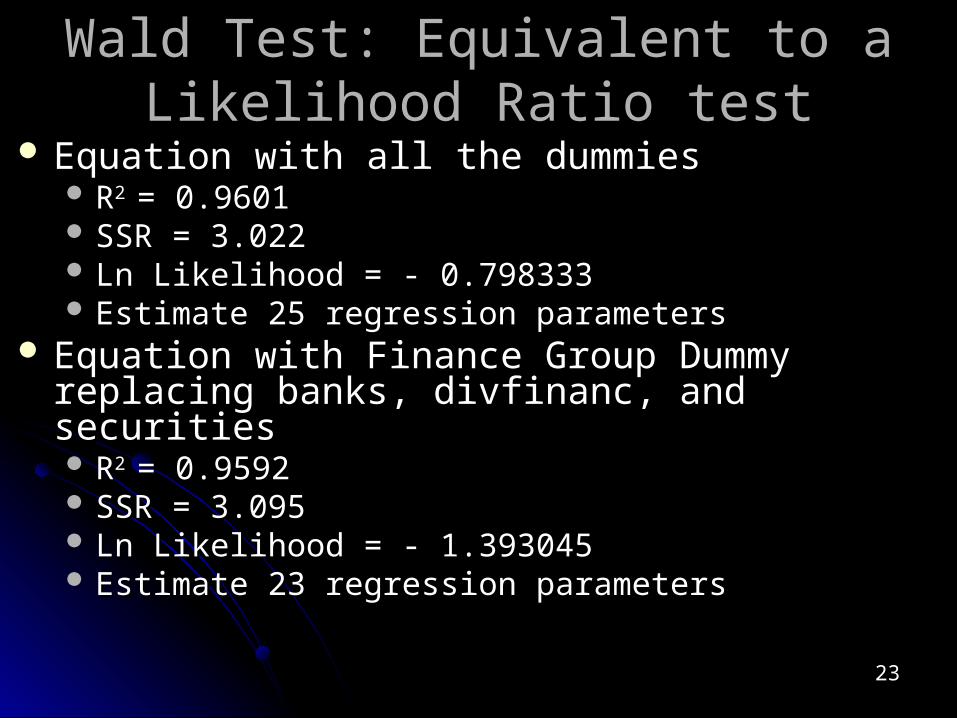
Wald Test: Equivalent to a Likelihood Wald Test: Equivalent to a Likelihood Ratio testRatio test
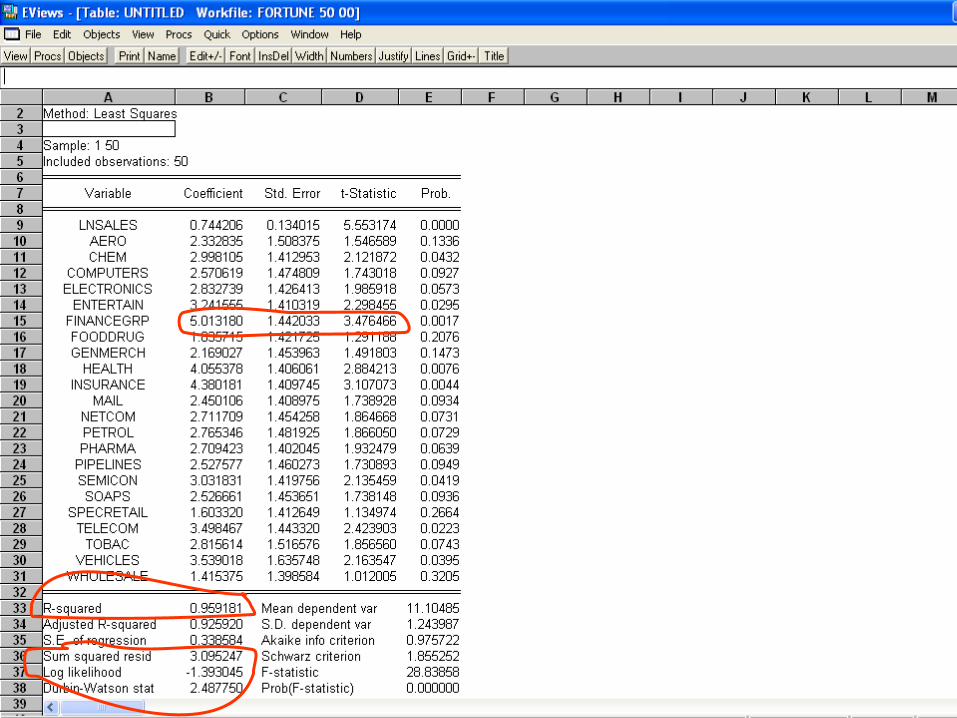
Equation with all the dummiesEquation with all the dummies RR2 2 = 0.9601= 0.9601 SSR = 3.022SSR = 3.022 Ln Likelihood = - 0.798333Ln Likelihood = - 0.798333 Estimate 25 regression parametersEstimate 25 regression parameters
Equation with Finance Group Dummy replacing Equation with Finance Group Dummy replacing banks, divfinanc, and securitiesbanks, divfinanc, and securities RR2 2 = 0.9592= 0.9592 SSR = 3.095SSR = 3.095 Ln Likelihood = - 1.393045Ln Likelihood = - 1.393045 Estimate 23 regression parametersEstimate 23 regression parameters
2424
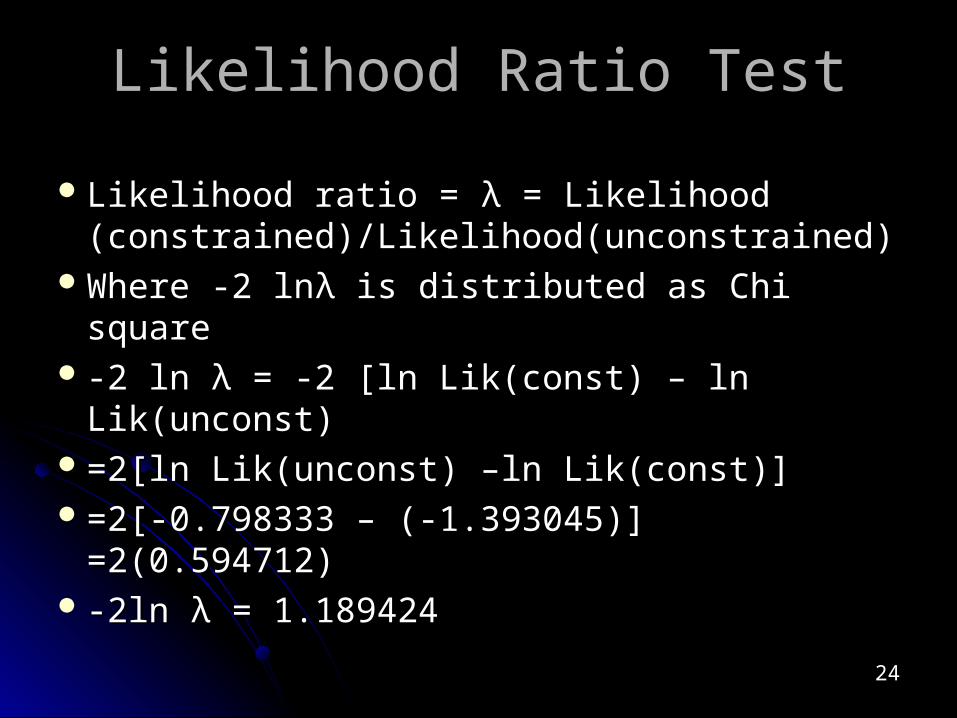
Likelihood Ratio TestLikelihood Ratio Test
Likelihood ratio = Likelihood ratio = λλ = Likelihood = Likelihood (constrained)/Likelihood(unconstrained)(constrained)/Likelihood(unconstrained)
Where -2 lnWhere -2 lnλλ is distributed as Chi square is distributed as Chi square -2 ln -2 ln λλ = -2 [ln Lik(const) – ln Lik(unconst) = -2 [ln Lik(const) – ln Lik(unconst)=2[ln Lik(unconst) –ln Lik(const)]=2[ln Lik(unconst) –ln Lik(const)]=2[-0.798333 – (-1.393045)] =2(0.594712)=2[-0.798333 – (-1.393045)] =2(0.594712) -2ln -2ln λλ = 1.189424 = 1.189424
2525
2626
0.0
0.2
0.4
0.6
0 2 4 6 8 10
RCHI
CH
IDE
NS
ITY
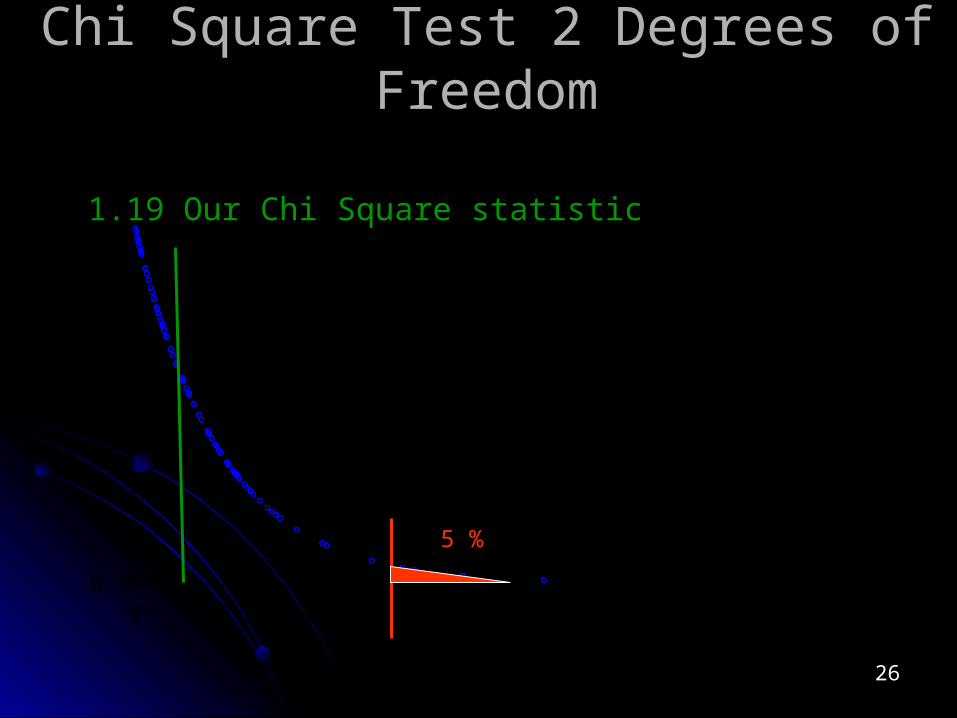
Chi Square Test 2 Degrees of FreedomChi Square Test 2 Degrees of Freedom
5.99
5 %
1.19 Our Chi Square statistic
2727
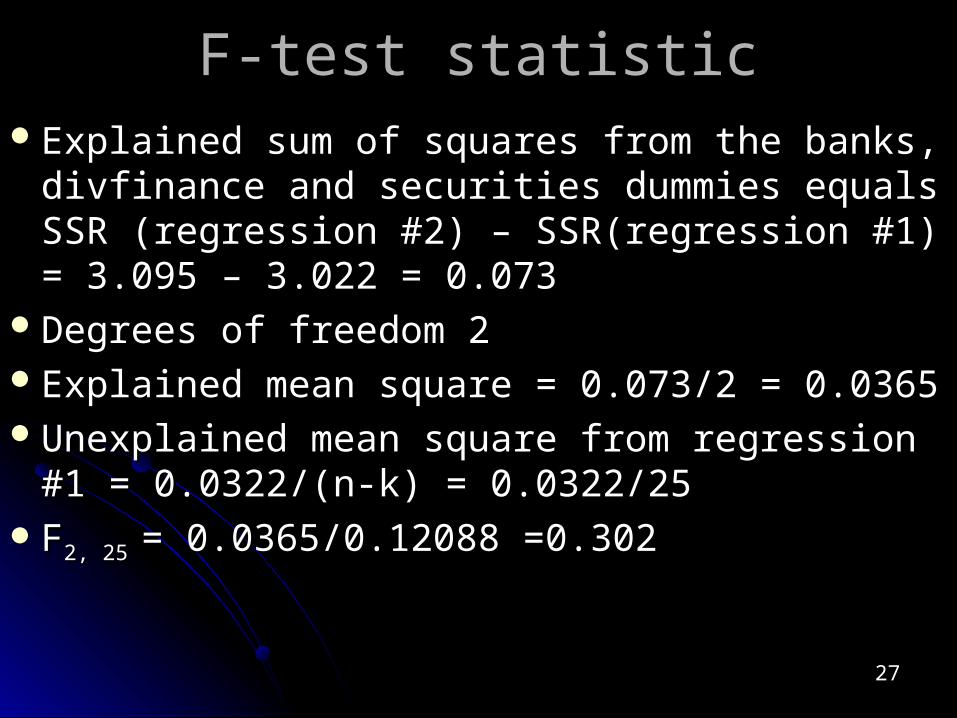
F-test statisticF-test statisticExplained sum of squares from the banks, Explained sum of squares from the banks,
divfinance and securities dummies equals SSR divfinance and securities dummies equals SSR (regression #2) – SSR(regression #1) = 3.095 – (regression #2) – SSR(regression #1) = 3.095 – 3.022 = 0.0733.022 = 0.073
Degrees of freedom 2Degrees of freedom 2Explained mean square = 0.073/2 = 0.0365Explained mean square = 0.073/2 = 0.0365Unexplained mean square from regression #1 = Unexplained mean square from regression #1 =
0.0322/(n-k) = 0.0322/250.0322/(n-k) = 0.0322/25FF2, 25 2, 25 = 0.0365/0.12088 =0.302= 0.0365/0.12088 =0.302
2828
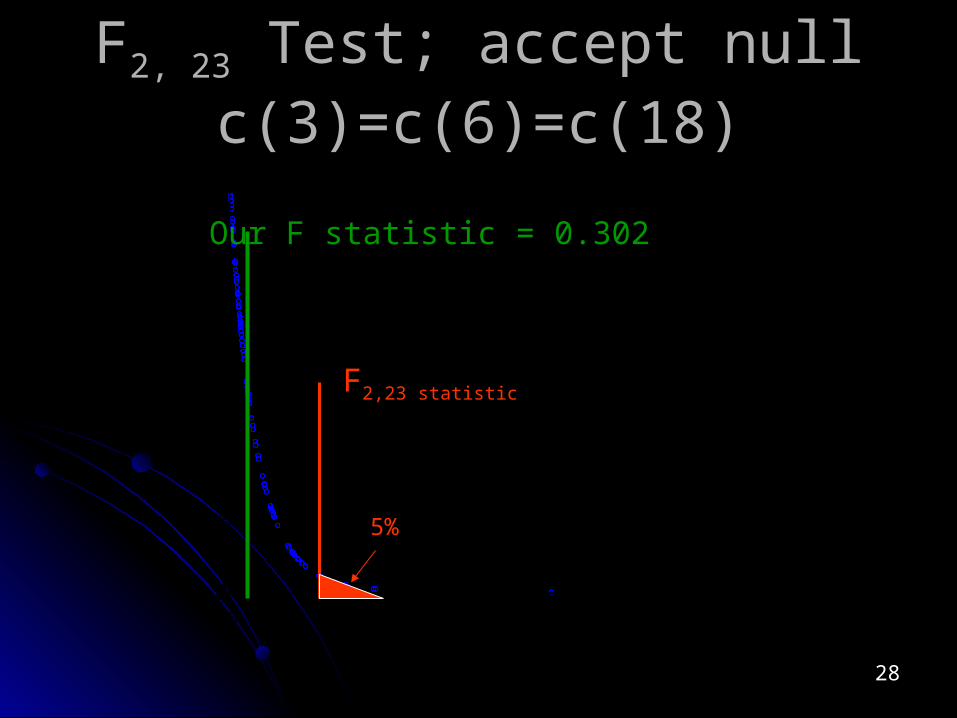
FF2, 232, 23 Test; accept null Test; accept null
c(3)=c(6)=c(18)c(3)=c(6)=c(18)
0.0
0.2
0.4
0.6
0.8
1.0
0 5 10 15
RANDF
DE
NS
ITY
F
F2,23 statistic
5%
Our F statistic = 0.302

2929
Wald Test results: Accept NullWald Test results: Accept Null
Wald Test:Equation: UntitledNull Hypothesis: C(3)=C(18)
C(6)=C(18)F-statistic 0.300921 Probability 0.742780
Chi-square 0.601842 Probability 0.740136

3030
Eviews HelpEviews Help