1 long-term sustained growth of the cosmetics market 2 · long-term sustained growth of the...
TRANSCRIPT

1February 15th 2007
Long-term sustained growth of the cosmetics market
Ability to grow sustainably faster than the market
Ability to improve margins for increasingly profitable growth
1
2
3
Ability to boost cash flows regularly and significantly4

2February 15th 2007
2
3
4
5
2004 2005 2006
Worldwide cosmetics market 2004 – 2006*
+ 4.8 %
+ 3.8 %
+ 3.4 %
*Excluding soaps and toothpastes2006 provisional estimate

3February 15th 2007
Worldwide cosmetics market 1992/2006*(in billions of dollars)
Average annual growth rate, excluding exchange rate impact + 4.5 %
66.4
1992
69.8
1993
72.8
1994
75
1995
79
1996
83.3
1997
87.9
1998
92.5
1999
101.3
2001
113.9
2004
118.2
2005
+5.0 %+4.4 %
+5.3 % +5.4 %
+5.5 %+5.3 %
+4.9 %+4.3 %
+4.0%+4.6 %
+3.0 %
+3.4 %
+3.5 %
123.9
20062000 2002 2003
+4.8% +3.8%
97.1
105.9110.1
*Excluding soaps and toothpastes2006 provisional estimate

4February 15th 2007
Western Europe + 1.9 % + 1.1 %
2004 2005
+3.4 %
2006
Cosmetics market 2004 – 2006*
20052004 2006
France - 1.5 %- 0.4 % + 3.5 %
Germany + 0.3 %- 1.8 % + 3.0 %
UK + 2.2 %+ 5.9 % + 4.1 %
Italy - 0.1 %+ 1.2 % + 2.6 %
Spain + 4.7 %+ 6.4 % + 4.0 %
Growth in constant currencies
*Excluding soaps and toothpastes2006 provisional estimate

5February 15th 2007
Cosmetics market 2004 – 2006*
2004 2005 2006
North America + 2.8 % + 3.8 % + 2.6 %
Professional Products + 4.1 % + 3.5 %
Mass market + 1.3 % + 3.1 %
Luxury market + 4.7 % + 3.8 %
2004 2005
+ 0 %
+ 4.5 %
+ 0.6 %
2006
Source NPD, Nielsen, Market and internal StudiesRetail sales
*Excluding soaps and toothpastes2006 provisional estimate
Growth in constant currencies

6February 15th 2007
2004 2005 2006
Japan - 1.2 % + 2.2 % + 0.9 %
*Excluding soaps and toothpastes2006 provisional estimate
Cosmetics market 2004 – 2006*
Growth in constant currencies

7February 15th 2007
2004 2005 2006
Rest of the World + 8.5 % + 8.1 % + 9.9 %
*Excluding soaps and toothpastes2006 provisional estimate
Cosmetics market 2004 – 2006*
Growth in constant currencies

8February 15th 2007
Worldwide and emerging cosmetics markets 1996 – 2006*
Index 100 = 1996
Emerging countries
Worldwide market
*Excluding soaps and toothpastes2006 provisional estimateGrowth in constant currencies

9February 15th 2007
Pourcentage Weight of emerging countries in worldwide cosmetics market and pourcentage contribution to cosmetics market growth
Pourcentagecontributionto cosmetics marketgrowth
Pourcentage Weightof emerging countriesin worldwidecosmetics market
*Excluding soaps and toothpastes2006 provisional estimate
20%
25%
30%
35%
40%
45%
50%
55%
60%
65%
70%
1997 1998 1999 2000 2001 2002 2003 2004 2005 2006

10February 15th 2007Real GDP (based on Purchasing Power Parity)Source: IMF International monetery Fund, World Economic Outlook
BRIMC countries Real GDP Growth rate 2001 - 2006
4.16 %3.72 %
6.48 %6.08 %
5.28 %
6.88 %
3%
4%
4%
5%
5%
6%
6%
7%
7%
2001 2002 2003 2004 2005 2006

Middle Class* High-income
Millions of inhabitants
Breakdown of world population (in millions)by income bracket
Source: World Bank*Middle Class: per capita income between 4 000 and 17 000 $ PPP
0
500
1000
1500
2000
2500
3000
3500
2005 2030
1670
1290489
670
70 millionnew potential consumers every year for L'Oréal

12February 15th 2007
Per capita cosmetics consumption (manufacturer’s price)as an index
100
150
200
250
300
350
400
450
500
550
600
1998 2000 2002 2004 2006 2008 2010
Index 100 = 1997
Brazil
Russia
Mexico
China
India
Source: Euromonitor

13February 15th 2007
Long-term sustained growth of the cosmetics market
Ability to grow sustainably faster than the market
Ability to improve margins for increasingly profitable growth
1
2
3
Ability to boost cash flows regularly and significantly4
14February 15th 2007
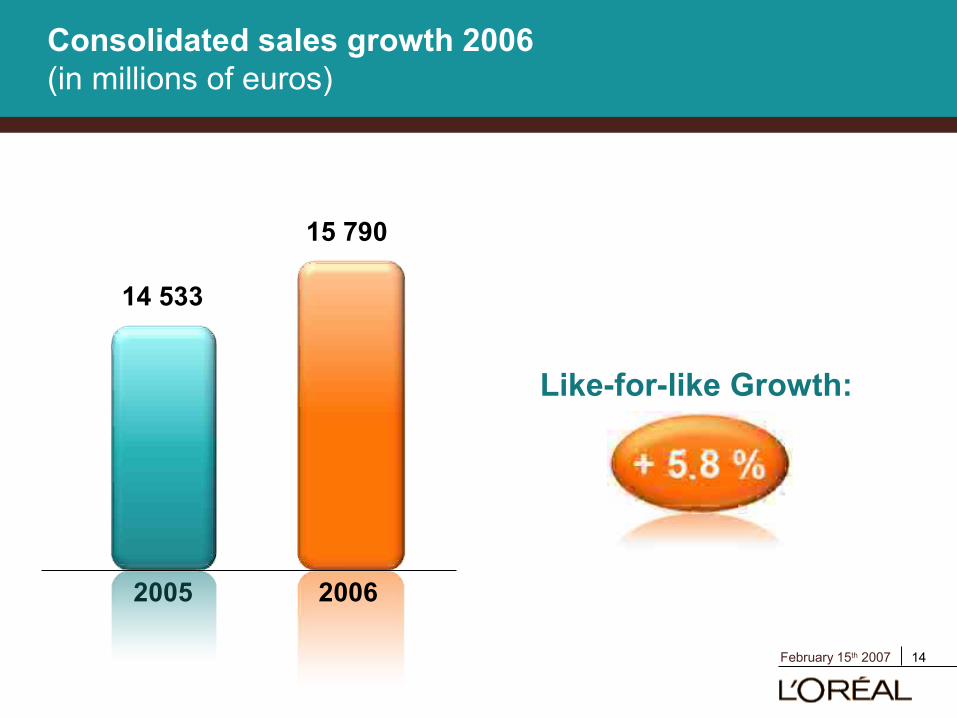
Consolidated sales growth 2006(in millions of euros)
Like-for-like Growth:
15 790
20062005
14 533

15February 15th 2007
+6.0% +5.6%+5.2%
+6.5%
0%
1%
2%
3%
4%
5%
6%
7%
Q1 Q2 Q3 Q4
2006 like-for-like sales growth, per quarter

16February 15th 2007
2001 2002 2003 2004 2005 2006
Consolidated sales growth
+ 6.5 %
+ 3.6 %
- 1.8 %
+ 4.0 %
+ 8.4 %
Published growth
+ 8,7 %

17February 15th 2007
Consolidated sales 2006(in millions of euros)
15 790
20062005
14 533
+ 1 257 M€

18February 15th 2007
+5.7%
+1.9%
+6.1% +2.4%
+1.7%
+7%
Western Europe: + 3.5%
Scandinavia
Cosmetics salesLike-for-like growth

19February 15th 2007
North America: + 2.7 %
Cosmetics salesLike-for-like growth

20February 15th 2007
Mass-Premium make-up market shareof L’Oréal Paris and Revlon from 1984 to 2006
Data Source: ACNielsen, Total US Outlets1999 based on Total US Outlets Excluding Wal-Mart2000 and forward based on FOOD/DRUG/KMART/TARGET2002 and forward Nielsen Database Event/Refresh

21February 15th 2007
5.9%
4.6%
2.4%
0%
1%
2%
3%
4%
5%
6%
7%
2003 2004 2005 2006
n°12 n°5 n°3 n°2
6.5%
Fructis market share and ranking, USA
Source AC NielsenShampoo, haircare, conditioners

22February 15th 2007
Western Europe
North America
Rest of the World
Cosmetics sales Weight of geographic zone1990-2006
1990*
72.9 %
19.1 %
8.0 %
46.6 %
26.3 %
27.1 %
20061995
64.3 %
20.2 %
15.5 %
2000
50.6 %
30.3 %
19.1 %
(*): The 1990 sales figures includes the sales of L’Oréal USA and L’Oréal Canada – French gap.

Rest of the World: + 12.7 %
Cosmetics salesLike-for-like growth

24February 15th 2007
Eastern Europe: + 22.0%
+21.4%
+13.2%+21.7%
Russia
PolandTchechRepublic
Ukraine
n.s.
Cosmetics salesLike-for-like growth

25February 15th 2007
Latin America: + 16.1 %
+15.3%
+12.7%
+14.7%
+26.4%
Mexico
Brazil
Chile
Argentina
Cosmetics salesLike-for-like growth
Cosmetics salesLike-for-like growth
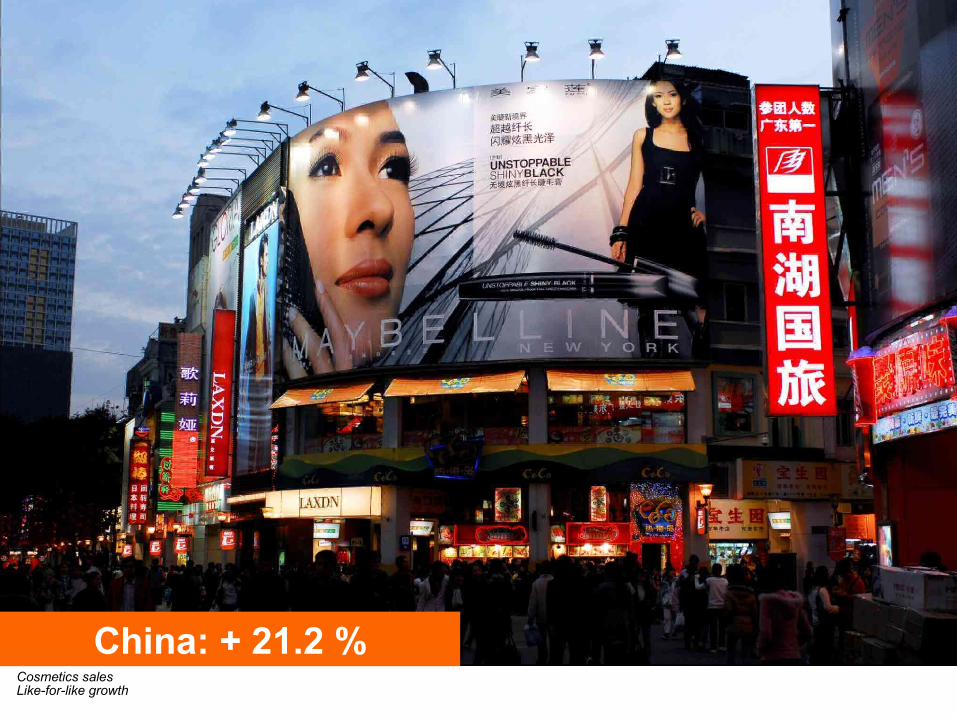
China: + 21.2 %
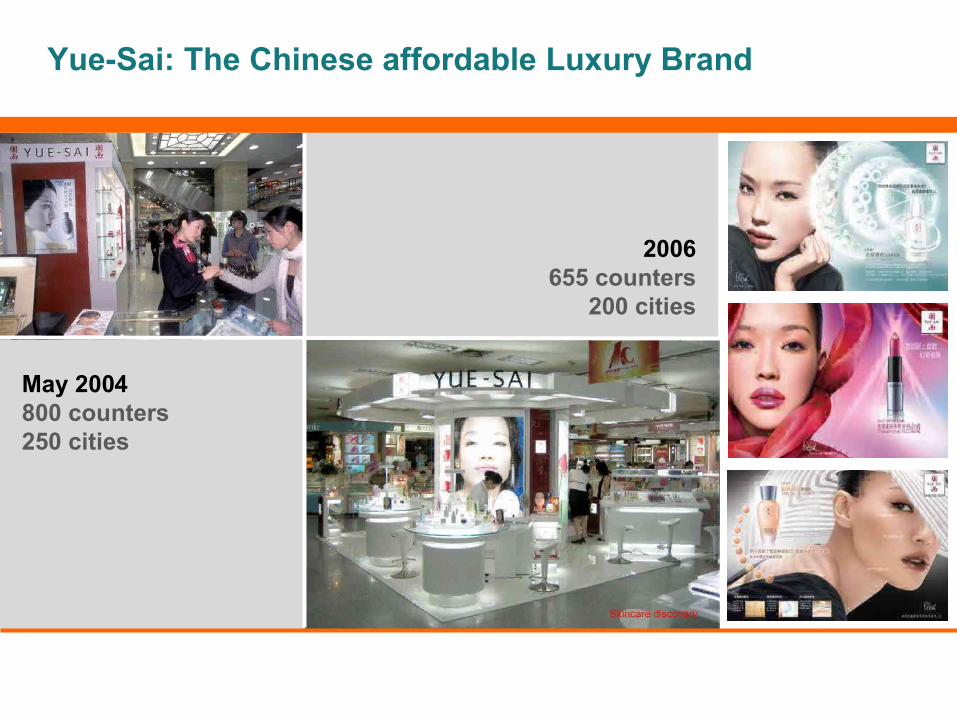
Yue-Sai: The Chinese affordable Luxury Brand
May 2004800 counters 250 cities
2006655 counters
200 cities

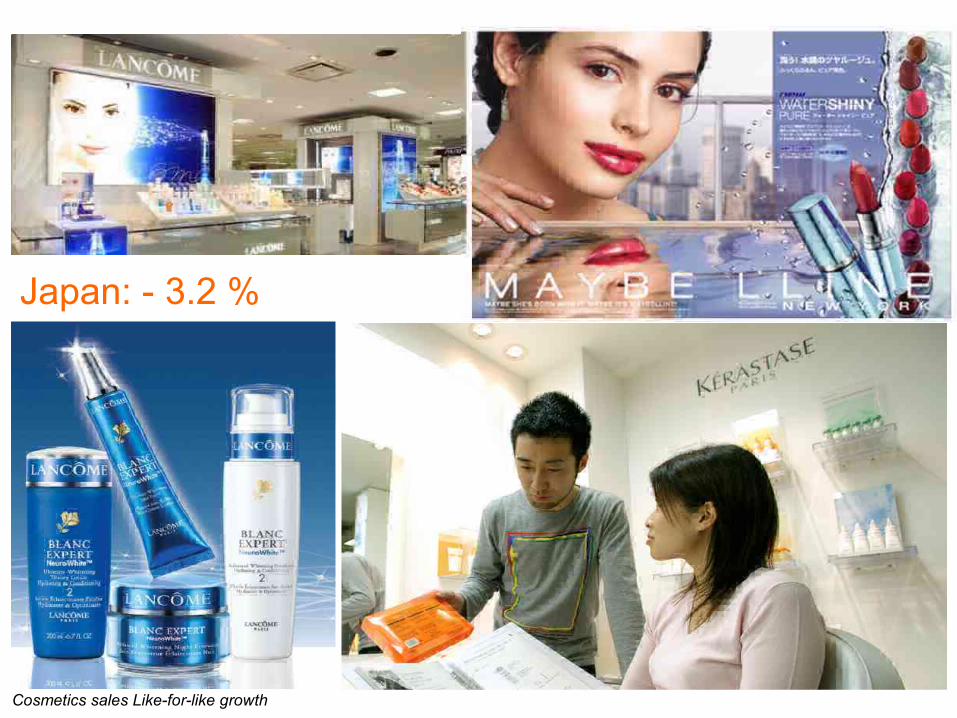
Japan: - 3.2 %
Cosmetics sales Like-for-like growth

India: + 40.3 %Cosmetics sales Like-for-like growth

31February 15th 2007
2006 Cosmetics sales Growth per Division with and without North America
Professional Products
Consumer Products
Luxury Products
Total cosmetics
Active Cosmetics
+ 3.8 %
+ 5.8 %
+ 5.1 %
Cosmetics SalesGrowth
+ 12.2 %
+ 5.6 %
Cosmetics Sales Growth without
North America
+ 6.0 %
+ 6.7 %
+ 6.2 %
+ 11.5 %
+ 6.7 %

32February 15th 2007
The 6 cylinders driving the growth engine
Technological innovation
Creation of blockbusters
Product value enhancement
Brand power
Globalisation
Acquisitions

PRO-XYLANE®

L’OREAL
®

35February 15th 2007
290
300
310
320
330
340
350
360
370
2005 2015 2025
Proportion of people over 50 in Europe,the United States and Japan
34%
38.2%
41.5 %
Source: United Nations, World Population prospects

36February 15th 2007
100
135148
169
8090
100110120130140150160170180
30-39 40-49 50-59 > 60
Average spending on Beauty Products per age group
Consumption index Base: 30-39 age group = 100
Secodip-France


38February 15th 2007
2004 2005 2006Effet Volume Effet Valeur
+ 3.7 %
+ 5.7 %
+ 2.5 %
+ 0.6 %
+ 1.1 %
+ 3.1 %
Cosmetics – Like-for-like growthVolume / Value evolution
Value Effect Volume Effect

39February 15th 2007
Professional Products
Luxury Products
Active
Cosmetics
The Body Shop
MIZANI
A diversified brand portofolio
Consumer Products


48February 15th 2007
The Body Shop Sales2nd half-year
Retail sales(1)
Retail sales with a comparable store base(2)
Consolidated sales
+ 6.6 %
+ 3.2 %
+ 9.7 %
As a %Variation
(1) Retail sales: Total sales to consumers through all channels.(2) Retail sales with a comparable store base: total sales to consumers by stores which operated continuously from July 1st to December 31st, 2005, and over the same period in 2006.

49February 15th 2007
Western Europe
North America
Rest of the World
45.5 %
21.5 %
33.0 %
% of Sales
+ 6.1 %
+ 0.8 %
+ 11.4 %
As a %
Variation
Total 100.0 % + 6.6 %
Retail sales, breakdown by geographic area

50February 15th 2007
Opening of 89 new stores, second half-year 2006*
2nd Half2006
15
8
66
Total 89
Western Europe
North America
Rest of the world
*Balance of store openings and closures


52February 15th 2007
L’Oréal market share*
20052006 with
The Body Shop
15.0 % 15.6 %
2006without
The Body Shop
15.2 %
*Excluding soaps and toothpastes2006 provisional estimate

53February 15th 2007
The 6 cylinders driving the growth engine
Technological innovation
Creation of blockbusters
Product value enhancement
Brand power
Globalisation
Acquisitions

54February 15th 2007
Long-term sustained growth of the cosmetics market
Ability to grow sustainably faster than the market
Ability to improve margins for increasingly profitable growth
1
2
3
Ability to boost cash flows regularly and significantly4

55
Consolidated profit and loss accounts without The Body ShopFrom sales to operating profit(in millions of euros)
Cost of sales
Research and development
Operating profit before foreign exchange gains and losses
Sales 14,532.5 15,355.1
31.12.2005
Advertising and promotion
Selling, general and adm. expenses
Foreign exchange gains and losses
Gross profit 10,185.2 10,940.7
2,312.6 2,538.9
- 4,347.3 - 4,414.4
- 496.2 - 531.0
- 4 367.2 - 4,717.6
- 3,009.2 - 3,153.2
- 46.6 - 56.3
%of Sales
%of Sales
71.3%
16.5%
28.7%
3.5%
30.7%
20.5%
0.4%
100%
70.1%
15.9%
29.9%
3.4%
30.1%
20.7%
0.3%
Operating profit 2,266.0 2,482.6 16.2%15.6%
31.12.2006without
The Body Shop
100%
+ 7.4%
+ 9.8%
+ 9.6%
+ 5.7%

56February 15th 2007
Industrial purchasing
7 sourcing centers
for the world
37 decentralized
sourcing centers

57February 15th 2007
Cosmetics plants labour productivity index* 2003-2006
100.0104.3
110.8
120.6
2003 2004 2005 2006
*2003 = Base 100

58
Consolidated profit and loss accounts without The Body ShopFrom sales to operating profit(in millions of euros)
Cost of sales
Research and development
Operating profit before foreign exchange gains and losses
Sales 14,532.5 15,355.1
31.12.2005
Advertising and promotion
Selling, general and adm. expenses
Foreign exchange gains and losses
Gross profit 10,185.2 10,940.7
2,312.6 2,538.9
- 4,347.3 - 4,414.4
- 496.2 - 531.0
- 4 367.2 - 4,717.6
- 3,009.2 - 3,153.2
- 46.6 - 56.3
%of Sales
%of Sales
71.3%
16.5%
28.7%
3.5%
30.7%
20.5%
0.4%
100%
70.1%
15.9%
29.9%
3.4%
30.1%
20.7%
0.3%
Operating profit 2,266.0 2,482.6 16.2%15.6%
31.12.2006without
The Body Shop
100%
+ 7.4%
+ 9.8%
+ 9.6%
+ 5.7%
59February 15th 2007
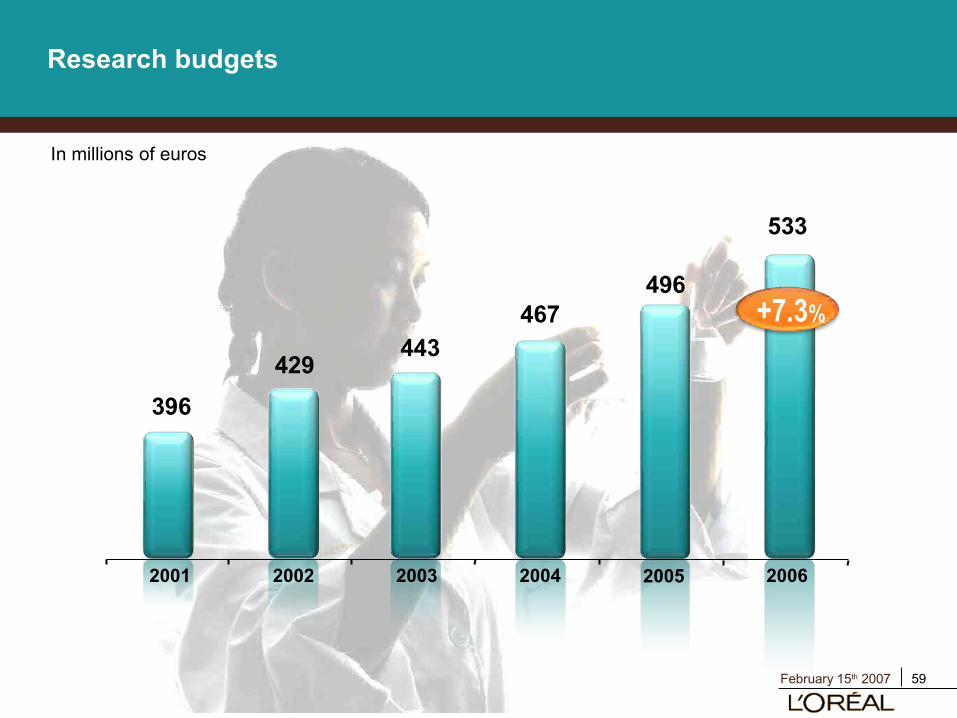
Research budgets
396429
443467
496
533
+7.3%
2005 20062001 2002 2003 2004
In millions of euros

60
Consolidated profit and loss accounts without The Body ShopFrom sales to operating profit(in millions of euros)
Cost of sales
Research and development
Operating profit before foreign exchange gains and losses
Sales 14,532.5 15,355.1
31.12.2005
Advertising and promotion
Selling, general and adm. expenses
Foreign exchange gains and losses
Gross profit 10,185.2 10,940.7
2,312.6 2,538.9
- 4,347.3 - 4,414.4
- 496.2 - 531.0
- 4 367.2 - 4,717.6
- 3,009.2 - 3,153.2
- 46.6 - 56.3
%of Sales
%of Sales
71.3%
16.5%
28.7%
3.5%
30.7%
20.5%
0.4%
100%
70.1%
15.9%
29.9%
3.4%
30.1%
20.7%
0.3%
Operating profit 2,266.0 2,482.6 16.2%15.6%
31.12.2006without
The Body Shop
100%
+ 7.4%
+ 9.8%
+ 9.6%
+ 5.7%


62February 15th 2007
Consolidated profit and loss accounts without The Body ShopFrom sales to operating profit(in millions of euros)
Cost of sales
Research and development
Operating profit before foreign exchange gains and losses
Sales 14,532.5 15,355.1
31.12.2005
Advertising and promotion
Selling, general and adm. expenses
Foreign exchange gains and losses
Gross profit 10,185.2 10,940.7
2,312.6 2,538.9
- 4,347.3 - 4,414.4
- 496.2 - 531.0
- 4 367.2 - 4,717.6
- 3,009.2 - 3,153.2
- 46.6 - 56.3
%of Sales
%of Sales
71.3%
16.5%
28.7%
3.5%
30.7%
20.5%
0.4%
100%
70.1%
15.9%
29.9%
3.4%
30.1%
20.7%
0.3%
Operating profit 2,266.0 2,482.6 16.2%15.6%
31.12.2006without
The Body Shop
100%
+ 7.4%
+ 9.8%
+ 9.6%
+ 5.7%

63
Consolidated profit and loss accounts without The Body ShopFrom sales to operating profit(in millions of euros)
Cost of sales
Research and development
Operating profit before foreign exchange gains and losses
Sales 14,532.5 15,355.1
31.12.2005
Advertising and promotion
Selling, general and adm. expenses
Foreign exchange gains and losses
Gross profit 10,185.2 10,940.7
2,312.6 2,538.9
- 4,347.3 - 4,414.4
- 496.2 - 531.0
- 4 367.2 - 4,717.6
- 3,009.2 - 3,153.2
- 46.6 - 56.3
%of Sales
%of Sales
71.3%
16.5%
28.7%
3.5%
30.7%
20.5%
0.4%
100%
70.1%
15.9%
29.9%
3.4%
30.1%
20.7%
0.3%
Operating profit 2,266.0 2,482.6 16.2%15.6%
31.12.2006without
The Body Shop
100%
+ 7.4%
+ 9.8%
+ 9.6%
+ 5.7%
64February 15th 2007
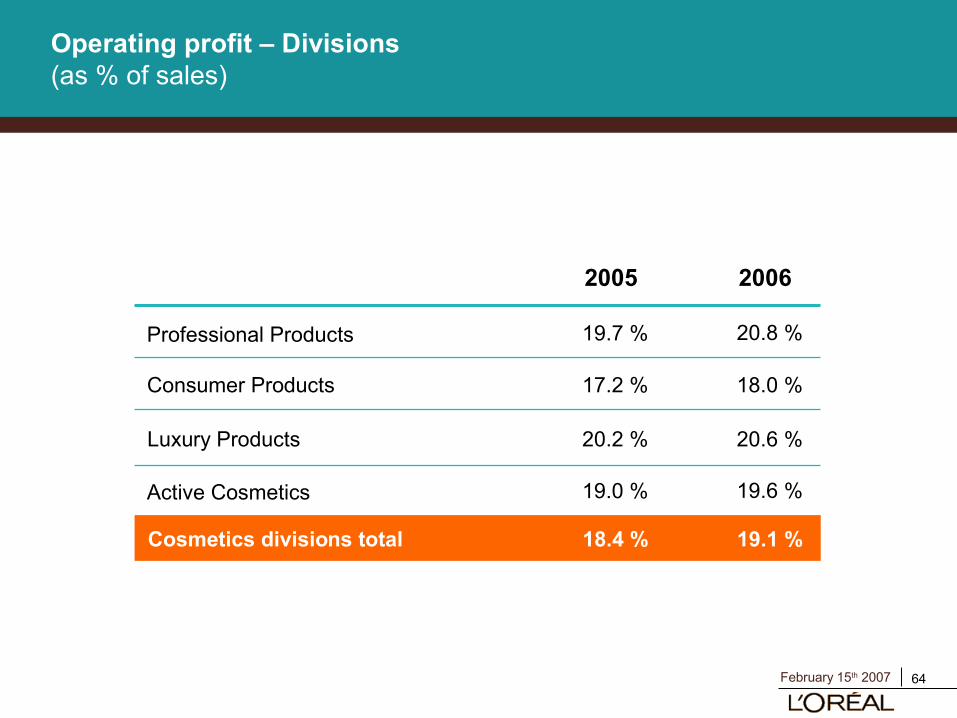
Operating profit – Divisions(as % of sales)
Consumer Products
Luxury Products
Active Cosmetics
18.0 %
20.6 %
19.6 %
Professional Products 20.8 %
17.2 %
20.2 %
19.0 %
19.7 %
20062005
Cosmetics divisions total 19.1 %18.4 %

65February 15th 2007
2005
Cosmetics – Operating profitGeographic zone
13.5 % 14.5 %Rest of the world
18.3 % 18.8 %North America
21.0 % 21.8 %Western Europe
% CA2006% CA
18.4 % 19.1 %Total of geographic zones


67
Main indicators – Impact The Body Shop(in millions of euros)
2006 GrowthPublished figures
+ 5.7%15,355+ 5.7%
Sales% like-for-like growth
Without The Body Shop(excluding non-recurrent items)
+ 9.6%2,48316.2%
Operating profit% of sales
+ 9.7%2,59916.9%
Profit before tax and non-recurrent items% of sales
+ 10.0%1,809Net profitafter minority interests
+ 13.1%€ 2.94Per share*
Group(excluding non-recurrent items)
+ 8.7%15,790+ 5.8%
Sales% expansion comparable
+ 11.9%1,833Net profitexcluding non-recurrent items after minority interests
+ 14.7%€ 2.98Per share*
+ 12.1%2,54116.1%
Operating profit% of sales
+ 11.3%2,63816.7%
Profit before tax and non-recurrent items% of sales
* Diluted net earning per share on net profit excluding non-recurrent items after priority interests

68February 15th 2007
Dividend per share
1.18 €*
20062005
1 €
*Proposed at the shareholder’s meeting to be held on April 24th, 2007

69February 15th 2007
Long-term sustained growth of the cosmetics market
Ability to grow sustainably faster than the market
Ability to improve margins for increasingly profitable growth
1
2
3
Ability to boost cash flows regularly and significantly4

70February 15th 2007
Cash flow statement (in millions of euros)
Net incomeDepreciation and provisionsGains and losses on disposals of assets, change in deffered tax and others
Operating net cash
Dividends paid
Change in working capital requirementInvestments
Divestments and others
Residual cash flow (before acquisitions or disposals)
Cash flow
31.12.2005
1,973.2426.9
- 270.5
1,431.6
- 563.3
- 35.7- 662.3
- 25.8
842.5
2,129.6
31.12.2006
2,062.1579.4
- 231.2
1,730.7
- 633.8
+ 65.6- 745.2
+ 25.0
1,121.9
2,410.3 + 13.2%
+ 20.9%
Acquisitions
Residuael cash flow after acquisitions
- 181.7
660.8
- 1,065.7
56.2
