1 measuring & explaining management practices nick bloom (stanford & nber) based on work...
Post on 21-Dec-2015
221 views
TRANSCRIPT

1
Measuring & explaining management practices
Nick Bloom (Stanford & NBER)
based on work with Raffaella Sadun (HBS) & John Van Reenen (LSE)
MIT/Harvard Org Econ Lecture 1 (February 2010)

2
Lecture 1: Measuring and explaining management practices
• Overview what are management practices, how we measure
them, why they vary and what effect they have on performance
• Highlight how little is rigorously known – management is one of
the major holes in social science, and a great research area
Lecture 2: Measuring and explaining organizational practices
• As above overview what are organizational practices, how we
measure them, why they vary and what effect this has
• Again, large holes in rigorous large sample causal evidence
Two part lecture course

3
Meeting up: I am around until late Thursday so e-mail me if you
would like to talk for individually about work or topics
Lectures: I will post all the lectures on my website (teaching
page) on Thursday PM
http://www.stanford.edu/~nbloom/ (or Google Nick Bloom)
Breaks: I’ll take a 10 minute break at 10:30
Questions: Please feel free to ask any questions and/or make
comments. I’ve not prepared material assuming this
Other points

4
1. Motivation: productivity across firms and countries
2. Measuring management practices
3. Management practices across firms and countries
4. Explaining why management practices vary
5. The effect of management practices on performance
Lecture 1: Overview

5
Large GDP & TFP differences across countries
Source: Jones and Romer (2009). US=1
Average US worker makes more in 2 weeks than a Tanzanian in 1 year

6
These TFP & GDP differences are often persistent
Source: Maddison (2008) Data is smoothed by decade

7
Productivity differences across firms are also large
• US plants at 90th percentile have 4x higher labor productivity
than plant at the 10th percentile (Syverson, 2004 REStat)
• Controlling for other inputs, TFP difference is about 2:1
• In China and India this gap is about 5:1 (Hsieh and Klenow,
2009 QJE)
• Not just mismeasured prices: in detailed industries with plant
level prices like white pan bread, block ice, concrete
productivity differences still 2:1 (Foster et al, 2008 AER)

8
TFP dispersion is particularly large in low competition industries
Source: Syverson (2004, JPE)
High competitionLow competition

9
Productivity difference between firms in one obvious motivation for looking at management
Persistent TFP differences a key part of many Macro, Trade, IO and Labor models – but these are typically silent on the casues
Could this be in part because of differences in management – even Adam Smith’s 1776 wealth of nations suggests this matters
Today will present a bunch of evidence showing that management differences do seem to be a major factor driving TFP differences
Of course, might also be interesting in management for a range of other reasons around growth, strategy and theory of the firm

10
Note, good productivity overview paper, Syversson (2010, NBER WP)Since completing your lecture outline noticed a very nice overview of the productivity literature has been complied by Syversson
“What determines productivity”, NBER WP 15712 and forthcoming in the Journal of Economic Literature
http://home.uchicago.edu/~syverson/productivitysurvey.pdf

11
1. Motivation: productivity across firms and countries
2. Measuring management practices
3. Management practices across firms and countries
4. Explaining why management practices vary
5. The effect of management practices on performance
Lecture 1: Overview
12
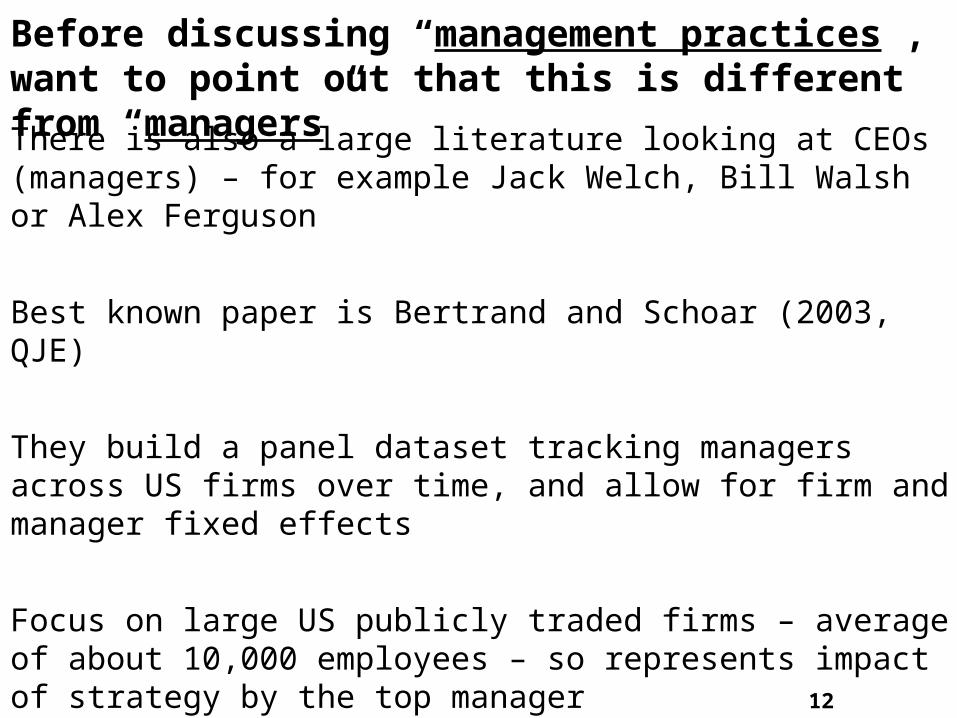
Before discussing “management practices”, want to point out that this is different from “managers”
There is also a large literature looking at CEOs (managers) – for example Jack Welch, Bill Walsh or Alex Ferguson
Best known paper is Bertrand and Schoar (2003, QJE)
They build a panel dataset tracking managers across US firms over time, and allow for firm and manager fixed effects
Focus on large US publicly traded firms – average of about 10,000 employees – so represents impact of strategy by the top manager

13
Summary of Bertrand and Schoar (2003)
Interesting results, and highly cited, finding:
1. Manager fixed effect exist, particularly for M&A, dividend policy,
debt ratios and cost-cutting
2. Managers have styles - more/less aggressive and
internal/external growth focus
3. Managers are also absolutely “better” or “worse” – performance
fixed effects exist, and linked to compensation and governance
4. These styles and fixed effects also correlated with manager
characteristics – particularly CEO age and having an MBA

14
Measuring management practices
Also a literature on management practices, which I will focus on in these lectures, as these are more about firms than individuals
Historically been strongly case study based – e.g. Ford, GM, Toyota, GE, Mayo Clinic, Citibank, Dabbawala etc.
Case-studies helpful for intuition and illustration, but potentially misleading because very selected sample – e.g. Enron
More recently work has focused on trying to systematically measure management practices in large samples of firms
• First generation, single country studies & direct questions
• Second generation, international studies & indirect questions

15
Challenges to measuring management practices
Despite sounding easy, “measuring management” is fraud with
difficulties, which has held back research.
1) How to quantify (as in put numbers on) management practices
2) How to get data from firms – surveys are tough to do
3) How to get the truth – will badly managed firms ‘fess-up’
4) Building a representative population – e.g. not just targeting Compustat firms – especially important for cross-country work

16
First generation surveys: single-country focus with direct survey techniques
Black and Lynch (2001, REStat) is a good example of a wellexecuted single country management survey
Surveyed about 3,000 establishments with the US Census bureau
1. Quantify: Asked a series of questions on employee recruitment, work organization, meetings and modern production practices
2. Get data: Administered by the US Census Bureau3. Truth: Told respondents their answers were confidential4. Population: stratified from the Census establishment database
Found large variations in management, and strong correlation ofmanagement practices and performance

17
Second wave surveys: cross countries and tries to address response bias with indirect surveys
Cross country comparisons: identification of many factors driving management typically require cross-country data
Problems with direct surveys: unfortunately people typically do not tell the complete truth in open surveys:
• Schwartz (1999, American Pschologist)
• Opinion poll-evidence
• Bertrand and Mullainathan (2001, AER P&P).
Bloom and Van Reenen (2007, QJE) is a good example of a second wave of management survey, which I’ll cover in detail

18
1) Quantifying: use scoring grid from a consulting firm•Scores 18 monitoring, targets and incentives practices•≈45 minute phone interview of manufacturing plant managers
2) Truth: use “Double-blind”•Interviewers do not know the company’s performance•Managers are not informed (in advance) they are scored•All interviews run from a single location with rotation by country
3) Getting data: a variety of tricks•Introduced as “Lean-manufacturing” interview, no financials•Official Endorsement: Bundesbank, PBC, CII & RBI, etc. •Run by 75 MBAs types (loud, assertive & business experience)
4) Population: sample randomly medium and large firms (100-5000 employees) from population databases across countries
The Bloom and Van Reenen (2007) approach

19
Score (1): Measures tracked do not indicate directly if overall business objectives are being met. Certain processes aren’t tracked at all
(3): Most key performance indicators are tracked formally. Tracking is overseen by senior management
(5): Performance is continuously tracked and communicated, both formally and informally, to all staff using a range of visual management tools
Monitoring - i.e. “How is performance tracked?”

20
Survey Video

21
Getting representative cross country samples
• So far interviewed about 7,000 firms across about 20 countries
•Obtained 45% coverage rate from sampling frame (with response rates uncorrelated with performance measures)
• Currently being extended to Charities, Hospitals, Law Firms, Retail firms, PPPs, Schools and Tax Collection Agencies
•So basic concept easily transported across industries

22
12
34
5m
anag
eme
nt_1
1 2 3 4 5management_2
Internal survey validation – useful exercise suggesting double-blind methodology may work
1st interview
2nd i
nte
rvie
w
Re-interviewed 222 firms with different interviewers & managersFirm average scores (over 18 question)
Firm-level correlation of 0.627
23
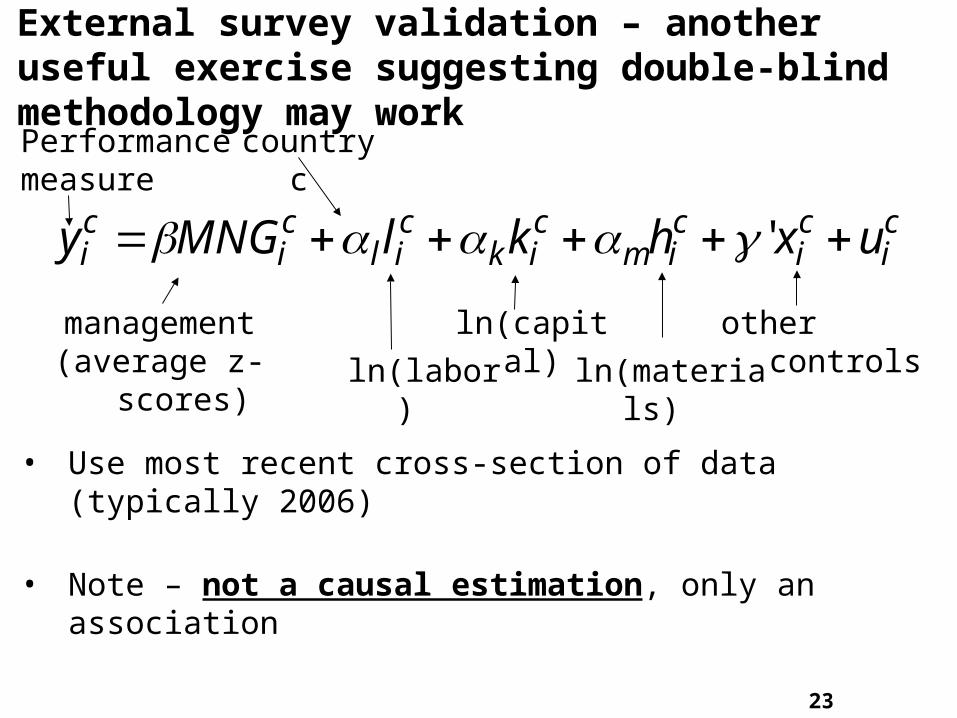
Performance measure
ci
ci
cim
cik
cil
ci
ci uxhklMNGy '
ln(capital)
ln(materials)
management(average z-scores) ln(labor)
other controls
• Use most recent cross-section of data (typically 2006)
country c
• Note – not a causal estimation, only an association
External survey validation – another useful exercise suggesting double-blind methodology may work
24
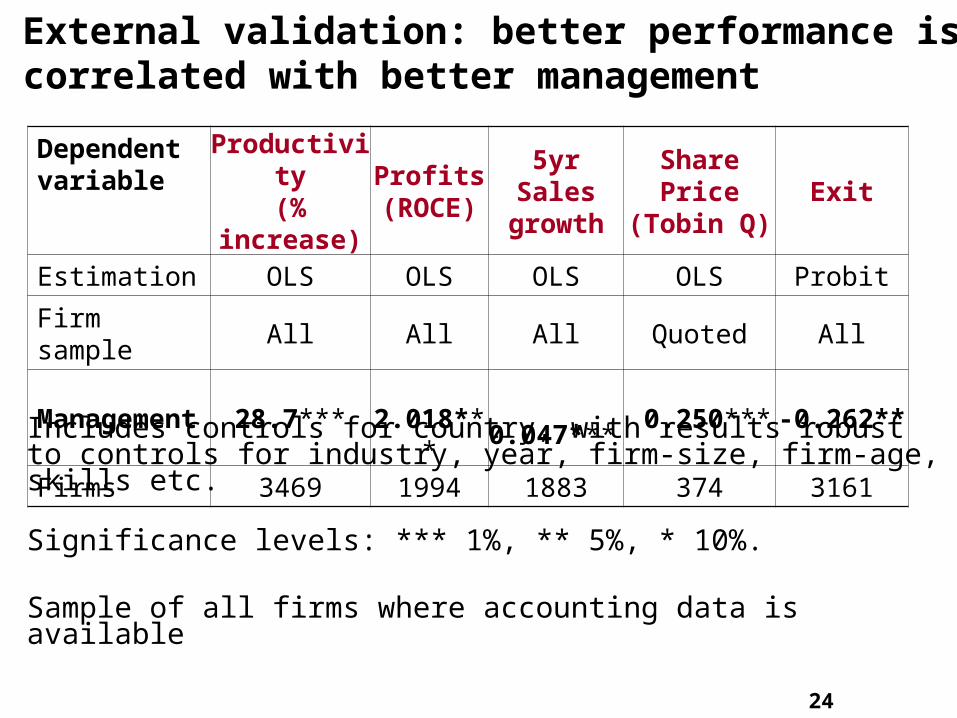
Dependentvariable
Productivity(% increase)
Profits (ROCE)
5yr Salesgrowth
Share Price (Tobin Q)
Exit
Estimation OLS OLS OLS OLS Probit
Firm sample All All All Quoted All
Management 28.7*** 2.018*** 0.047*** 0.250*** -0.262**
Firms 3469 1994 1883 374 3161
External validation: better performance is correlated with better management
Includes controls for country, with results robust to controls for industry, year, firm-size, firm-age, skills etc.
Significance levels: *** 1%, ** 5%, * 10%.
Sample of all firms where accounting data is available

25
External validation – robustness across countries (the “ooh la la” question)
Performance results robust in all main regions:
• Anglo-Saxon (US, UK, Ireland and Canada)
• Northern Europe (France, Germany, Sweden & Poland)
• Southern Europe (Portugal, Greece and Italy)
• East Asia (China and Japan)
• South America (Brazil)

26
010
2030
4050
mea
n of
exp
ort
1 1.5 2 2.5 3 3.5 4 4.5
Consistent with Helpman, Melitz and Yeaple (2004, AER) well managed firms also export more
Sha
re o
f fir
ms
expo
rtin
g
Management score (rounded to nearest 0.5)
27
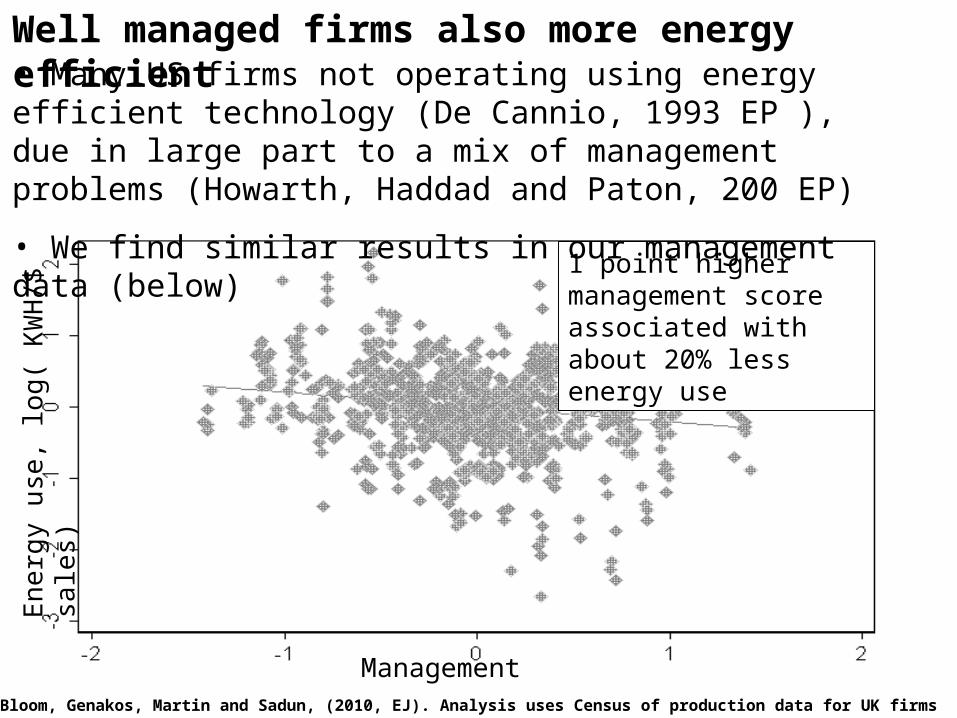
Well managed firms also more energy efficient
1 point higher management score associated with about 20% less energy use
En
erg
y u
se, l
og(
KW
H/$
sa
les)
ManagementSource: Bloom, Genakos, Martin and Sadun, (2010, EJ). Analysis uses Census of production data for UK firms
• Many US firms not operating using energy efficient technology (De Cannio, 1993 EP ), due in large part to a mix of management problems (Howarth, Haddad and Paton, 200 EP)
• We find similar results in our management data (below)

28
1. Motivation: productivity across firms and countries
2. Measuring management practices
3. Management practices across firms and countries
4. Explaining why management practices vary
5. The effect of management practices on performance
Lecture 1: Overview

29
2.6 2.8 3 3.2 3.4mean of management
USGermanySweden
JapanCanadaFrance
ItalyGreat Britain
AustraliaNorthern Ireland
PolandRepublic of Ireland
PortugalBrazilIndia
ChinaGreece
US management practices score highest on average, with developing countries lowest
Average Country Management Score
Also have data from Chile, Mexico and New Zealand, but not yet publicly released

30
0.5
10
.51
0.5
10
.51
1 2 3 4 5 1 2 3 4 5 1 2 3 4 5 1 2 3 4 5
Australia Brazil Canada China
France Germany Great Britain Greece
India Ireland Italy Japan
Poland Portugal Sweden US
De
nsity
managementGraphs by country1
Variation even greater across firms than across countries
Firm-Level Management Scores

31
-.4 -.2 0 .2 .4mean of peo_ops
IndiaPolandChina
Republic of IrelandUS
Northern IrelandBrazil
Great BritainCanadaGreeceJapan
GermanyPortugal
ItalyAustralia
FranceSweden
Relative management practices also vary by country
Relatively better at ‘operations’ management (monitoring, continuous improvement, Lean etc)
Relatively better at ‘people’ management (hiring, firing, pay, promotions etc)
People management (hiring, firing, pay & promotions) – operations (monitoring, continuous improvement and Lean)

32
1. Motivation: productivity across firms and countries
2. Measuring management practices
3. Management practices across firms and countries
4. Explaining why management practices vary
5. The effect of management practices on performance
Lecture 1: Overview

33
I will discuss five factors that seem important
• Competition
• Family firms
• Multinationals
• Labor market regulations
• Education
But, before that, I that want to raise one informational constraint for why every firm does not adopt best practices
So why does management vary across countries and firms?

Wanted to find out if firms were aware of their practices being good/bad?
We asked:
“Excluding yourself, how well managed would you say your firm is on a scale of 1 to 10, where 1 is worst practice, 5 is average and 10 is best practice”
We also asked them to give themselves scores on operations and people management separately

0.1
.2.3
.4D
ens
ity
0 2 4 6 8 10Their self-score: 1 (worst practice), 5 (average) to 10 (best practice)
To the extent they are honest, most managers seem to think they are well above average
“Average”“Worst Practice”
“Best Practice”

0 .5 1 1.5mean of gap
BrazilGreece
IndiaPortugal
ChinaRepublic of Ireland
Northern IrelandAustraliaCanada
ItalyGreat Britain
PolandGermany
JapanSwedenFrance
US
The Brazilians and Greeks overscored the most, the US and French the least
Self score (normalized to 1 to 5 scale) – Management score

-6-4
-20
2la
bp
0 2 4 6 8 10Their self-score: 1 (worst practice), 5 (average) to 10 (best practice)
bandwidth = .8
Lowess smoother
These self-scores also appear not only too high on average, but also uncorrelated with actual practices
Labo
r P
rodu
ctiv
ity
Self scored management* In comparison the management score has a 0.295 correlation with labor productivity
Correlation0.032*

So seems many firms are unaware of their poor management, consistent with a range of evidence that management practices are a type of technology
A number of studies, including several I will discuss later on this lecture, provide evidence that management is a technology
Innovations include the American System of Manufacturing, Scientific Management, Mass Production, M-form firm, Quality Movement and Lean
So one reason for bad management is like any other technology there is a diffusion curve, with many firms below the curve
Even so, many well informed firms are badly managed, hence why I will discuss a range of other factors

1. Motivation: productivity across firms and countries
2. Measuring management practices
3. Explaining why management practices vary
•Competition
•Family firms
•Multinationals
•Labor market regulations
•Education
4. The effect of management practices on performance
Lecture 1: Overview

40
Tough competition appears strongly linked to better management practices
Competition proxiesDependent variable:
Management
Import penetration(SIC-3 industry, 1995-99)
0.066**(0.033)
“1-Rents” measure1
(SIC-3 except firm itself, 1995-99)1.964**(0.721)
# of competitors(Firm level, 2004 and 2006)
0.158***(0.023)
Observations 2499 2980 3589
Full controls2,3 Yes Yes Yes
1 1-Rents = 1- (operating profit – capital costs)/sales2 Includes 108 SIC-3 industry, country, firm-size, public and interview noise (analyst, time, date, and manager characteristic) controls3 S.E.s in ( ) below, robust to heteroskedasticity, clustered by country-industry

41
We also have some management panel data, and find similar results
Competition proxiesDependent variable: Change in
Management 2006-2004
Change in Import penetration 0.013**
(0.005)
Change in “1-Rents” measure1 1.006**
(0.415)
Change in Number of rivals0.120**
(0.052)Observations 421 404 432
1 1-Rents = 1- (operating profit – capital costs)/sales S.E.s in ( ) below, robust to heteroskedasticity, clustered by country-industry
UK, US, France and Germany only

42
Competition also appears linked to selection
An additional point on the management score is associated with
an increase of employment
US 715 more workers
UK 546 more workers
India 263 more workers
Competitive forces of reallocation weak in India compared to US
43
So appears to be a mix of ways competition can improve management
“Incentives” (e.g. “Boot up the ass effect”) – competition forces badly managed firms to improve performance
“Selection” – competition selects out badly managed firms
“Learning” – competition provides more firms in and industry, increasing experimentation and learning.

44
Studies on TFP find similar results of competition on performance
Syversson (2004, JPE) looks at the concrete industry and finds that more competitive markets had higher average levels of TFP and less dispersion.
Pavcnik (2002, REStud) and Olley-Pakes (1996, Econometrica) also at changes in competition from trade-reforms and deregulations respectively, finding this weeds out low TFP firms
Schmitz (2005, JPE) shows great lakes iron-producers responded heavily to import competition
Nickell (1996, JPE) shows changes in competition lead to faster TFP growth within a panel of firms

45
1. Motivation: productivity across firms and countries
2. Measuring management practices
3. Explaining why management practices vary
•Competition
•Family firms
•Multinationals
•Labor market regulations
•Education
4. The effect of management practices on performance
Lecture 1: Overview

46
0.5
10
.51
0.5
1
1 2 3 4 5 1 2 3 4 5 1 2 3 4 5
Dispersed Shareholders Family, external CEO Family, family CEO
Founder Government Managers
Other Private Equity Private Individuals
Density PEy
Graphs by Who owns the firm?
Management practices vary strongly with ownership, even after controlling for industry, country, skills, size etc.Distribution of firm management scores by ownership. Overlaid dashed line is approximate density for dispersed shareholders, the most common US ownership type
Average Management Score

47
0 .2 .4 .6 .8
IndiaGreece
PortugalBrazil
ItalyNorthern Ireland
Republic of IrelandGreat Britain
ChinaGermanyAustraliaCanadaPolandFrance
USJapan
Sweden
mean of family mean of foundermean of government
Ownership differences are another factor behind cross-country variations in management practices
share family CEO (2nd+ generation)
share founder CEO (1st generation)
share government owned
share of ownership (for types associated with low management scores)

48
Results again consistent with other studies using other performance metrics
One nice study is by Perez-Gonzalez (2006, AER) looking at the impact of a family CEO
• Finds stock prices fall the day a firm’s founder announces they are passing the CEO position down to one of their kids• Drops particularly for hand-downs to kids who went to non-selective schools
Another clever study by Bennedsen, Nielson, Perez-Gonalez, and Wolfenzon (2007, QJE) on family firms and performance
• Use gender of the first born to instrument for family control• Find family CEOs reduce profitability and growth rates

49
1. Motivation: productivity across firms and countries
2. Measuring management practices
3. Explaining why management practices vary
•Competition
•Family firms
•Multinationals
•Labor market regulations
•Education
4. The effect of management practices on performance
Lecture 1: Overview

50
2.4 2.6 2.8 3 3.2 3.4
USJapan
SwedenGermany
CanadaAustralia
ItalyGreat Britain
FrancePoland
Northern IrelandRepublic of Ireland
IndiaChina
PortugalBrazil
Greece
Multinationals appear to always be well managed, consistent with selection and most trade models
Average Management Score
Foreign multinationalsDomestic firms

51
0 .2 .4 .6 .8
SwedenFrance
GermanyAustralia
Great BritainUS
CanadaPortugal
Republic of IrelandNorthern Ireland
ItalyPolandJapan
GreeceChinaBrazilIndia Foreign multinationals
Domestic multinationals
share of multinationals
Multinational presence also linked to cross-country differences in average management practices

52
1. Motivation: productivity across firms and countries
2. Measuring management practices
3. Explaining why management practices vary
•Competition
•Family firms
•Multinationals
•Labor market regulations
•Education
4. The effect of management practices on performance
Lecture 1: Overview

53
Australia
Brazil
Canada
China
France
Great Britain
Germany
Greece
India
Republic of Ireland
Italy
JapanNorthern Ireland Poland
Portugal
Sweden
US
2.4
2.6
2.8
33.
23.
4pe
op_m
ean
0 20 40 60WB_RigidityEmployment
Labor market regulations appear linked to worse management, particularly incentives management
World Bank Employment Rigidity Index
Ave
rage
ince
ntiv
es m
anag
emen
t(h
iring
, fir
ing,
pay
and
pro
mot
ions
)

54
1. Motivation: productivity across firms and countries
2. Measuring management practices
3. Explaining why management practices vary
•Competition
•Family firms
•Multinationals
•Labor market regulations
•Education
4. The effect of management practices on performance
Lecture 1: Overview

55
020
4060
80
1 1.5 2 2.5 3 3.5 4 4.5
mean of degree_nm mean of degree_m
Finally, education is highly correlated with better management, but no idea on causation
Management score (rounded to nearest 0.5)
Per
cent
with
a d
egre
e
Non-managersManagers

MY FAVOURITE QUOTES:
[Male manager speaking to an Australian female interviewer]
Production Manager: “Your accent is really cute and I love the way you talk. Do you fancy meeting up near the factory?”
Interviewer “Sorry, but I’m washing my hair every night for the next month….”
The traditional British Chat-Up

Production Manager: “Are you a Brahmin?’
Interviewer “Yes, why do you ask?”
Production manager “And are you married?”
Interviewer “No?”
Production manager “Excellent, excellent, my son is looking for a bride and I think you could be perfect. I must contact your parents to discuss this”
The traditional Indian Chat-Up
MY FAVOURITE QUOTES:

MY FAVOURITE QUOTES:
Interviewer: “How many production sites do you have abroad?
Manager in Indiana, US: “Well…we have one in Texas…”
Americans on geography
Production Manager: “We’re owned by the Mafia”
Interviewer: “I think that’s the “Other” category……..although I guess I could put you down as an “Italian multinational” ?”
The difficulties of defining ownership in Europe

MY FAVOURITE QUOTES:
The bizarre
Interviewer: “[long silence]……hello, hello….are you still there….hello”
Production Manager: “…….I’m sorry, I just got distracted by a submarine surfacing in front of my window”
The unbelievable
[Male manager speaking to a female interviewer]
Production Manager: “I would like you to call me “Daddy” when we talk”
[End of interview…]

References for the management data
The management data I showed you comes from two sources:
● Bloom, Nicholas, and John Van Reenen (2010) “Why do management practices differ across firms and countries”, Journal of Economic Perspectives, 24(1).
http://www.stanford.edu/~nbloom/JEP.pdf
● Bloom, Nicholas, Sadun, Raffaella and John Van Reenen (2010), “Recent advances in the empirics of organizational economics”, forthcoming Annual Review of Economics
http://www.stanford.edu/~nbloom/AR.pdf

61
1. Motivation: productivity across firms and countries
2. Measuring management practices
3. Explaining why management practices vary
4. The effect of management practices on performance
Lecture 1: Overview

62
Estimating effect of management on performance
Is there really “bad” management, or are management variations just response to different environments?
• For example, in Brazil does corruption make is better not to monitor performance?
Management discipline is big on “contingent” management (Woodward, 1958), while the Chicago school would claim bad managed firms would be driven out of the market.
Three types of approaches to investigating this:• Repeated arms-length surveys• Longitudinal ground-based studies• Experiments on management

63
1. Motivation: productivity across firms and countries
2. Measuring management practices
3. Explaining why management practices vary
4. The effect of management practices on performance
•Repeated arms-length surveys
•Longitudinal ground-based studies
•Experiments on management
Lecture 1: Overview
64
Black and Lynch (2004) and Cappelli and Neumark (2001) as good examples of panel survey-data
The survey data in Black and Lynch (2001, REStat) was actually collected in two waves (1994 and 1997)
This was matched into performance panel data to create a management and performance panel
Black & Lynch (2004, EJ) and Cappelli & Neumark (2001, ILRR) run panel regressions of performance on management finding:
• Significant effects in the cross-sectional regressions• Nothing when fixed effects are included
Appears to be because the Census management data is noisy and management changes slowly (e.g. too little signal:noise)

65
1. Motivation: productivity across firms and countries
2. Measuring management practices
3. Explaining why management practices vary
4. The effect of management practices on performance
•Repeated arms-length surveys
•Longitudinal ground-based studies
•Experiments on management
Lecture 1: Overview

66
Longitudinal ground based surveys
Classic paper is Ichniowski, Shaw and Prennushi (1997, AER) (and more recently Bartel, Ichniowski and Shaw (2007, QJE))
Ichniowski et al. (1997) collected detailed monthly performance and management data on 36 steel lines owned by 17 firms.
While the sample size is small, by looking at one very detailed industry – steel finishing – can control for host of other factors
Also collected a many other control variables from frequent plant visits - so it’s a mix of case-study and econometrics approaches
67
Summary Ichniowski, Shaw and Prennushi (1997), slide (1/2)
Key findings:
1) Strong cross-sectional and panel correlation between adoption of modern management practices and productivity
• Appears robust to controls for other factors like rotation of individual managers to external threats
2) Clustering of management practices in firms, and empirical results strongest for clusters rather than individual practices
• Both consistent with complementarity across practices

68
Summary Ichniowski, Shaw and Prennushi (1997), slide (2/2)
Main issues:
1) Performance and management relationship not fully identified – practices and performance could change in response to an external shock. No good instrument, although plausible story
2) Clustering of management practices, and empirical results being strongest for clusters, does not prove complementarity
• Clustering could equally reflect differences across firms• Question level measurement error gives the results that
clusters are more significant than individual practices
Despite this hugely cited and shows that impact that a good empirical management paper can have

69
1. Motivation: productivity across firms and countries
2. Measuring management practices
3. Explaining why management practices vary
4. The effect of management practices on performance
•Repeated arms-length surveys
•Longitudinal ground-based studies
•Experiments on management
Lecture 1: Overview

70
Very recently, academics have started running experiments on changing management practices
Running management experiments is expensive, so this is to date this has been limited to:
• Developing countries, typically on micro-enterprises (i.e. 5 to 10 person firms), or
• Single firms (i.e. fruit-picking firms) in developed countries

71
Evidence from micro-enterprises in developed countries (1/2)
A few projects are in progress (nothing published) - Karlan and Valdivia (2010, R&R REStat) in Peru; Bruhn, Karlan and Schoar in Mexico; Karlan and Udry in Ghana; McKenzie and Woodruff in Sri Lanka
These provide a limited amount (≈50 hours) of basic trainings to small firms – e.g. accounting, marketing, pricing, strategy etc.
This training is provided randomly and performance measured before and after the intervention

72
Evidence from micro-enterprises in developed countries (2/2)
Data so far extremely preliminary – my evidence on them is mainly from discussing this directly with the authors.
Some studies find evidence of impact of management training on performance, others do not (so far)
Maybe management does not matter? But I’ll present in detail another study I’ve been involved in showing large effects
Or maybe these firms are very small, so management matters less in small firms?
Or maybe to have an impact need extensive intervention – a few hours of training not sufficient to have much effect?

73
Evidence from the single firms in developing countries (1/2)
The team of Bandiera, Barankay and Rasul have produced an impressive set of papers (2005, QJE; 2007, QJE; 2009, Econometrica; and 2010, REStud)
Run experiments on incentives for workers and managers, team selection and task division on a fruit picking farm
Typically introduce managerial changes part-way through season to look at change in performance, plus use last seasons output as seasonality controls

74
Evidence from the single firms in developing countries (2/2)
Bandiera, Barakalay and Rasul find large effects of varying management practices on fruit-picking performance:
• Worker incentive pay increases their performance, especially absolute (rather than relative) incentives
• Peer monitoring effects are strong between workers when absolute group incentives exist
• Manager incentive pay improves team selection (less favoritism) and the effort they put into monitoring workers
75
Finally, a management experiment on large firms
The only experiment I know on panels of large firms is Bloom, Eifert, Mahajan, McKenzie and Roberts (2010).
Randomize management practices delivered by Accenture to 20 plants in large (300 person) textile firms in Mumbai, India
Control firms get one month of diagnostic (≈ 200 hours of help) and then monthly monitoring (≈ 20 hours a month).
Treatment firms get one month of diagnostic, four months of intervention (≈ 800 hours of help) and then monthly monitoring.
Collect weekly data for all plants from 2008 to 2010
Before discussing the details show some pictures for context

Exhibit 1: Plants are large compounds, often containing several buildings.
Plant surrounded by grounds
Front entrance to the main building Plant buildings with gates and guard post
Plant entrance with gates and a guard post

Exhibit 2: The plants operate 24 hours a day for 7 days a week producing fabric from yarn, with 4 main stages of production
(1) Winding the yarn thread onto the warp beam (2) Drawing the warp beam ready for weaving
(3) Weaving the fabric on the weaving loom (4) Quality checking and repair

The production technology has not changed much over time
Warp beam
Krill
The warping looms at Lowell Mills in 1854, Massachusetts

Exhibit 3: Many parts of these Indian plants were dirty and unsafe
Garbage outside the plant Garbage inside a plant
Chemicals without any coveringFlammable garbage in a plant

Exhibit 4: The plant floors were disorganized
Instrument not
removed after use, blocking hallway.
Tools left on the floor after use
Dirty and poorly
maintained machines
Old warp beam, chairs and a desk
obstructing the plant floor

Yarn piled up so high and deep that access to back
sacks is almost impossible
Exhibit 5: The inventory rooms had months of excess yarn, often without any formal storage system or protection from damp or crushing
Different types and colors of
yarn lying mixed
Yarn without labeling, order or damp protection
A crushed yarn cone, which is unusable as it leads to
irregular yarn tension

No protection to prevent damage and rustSpares without any labeling or order
Exhibit 6: The spare parts stores were also disorganized and dirty
Shelves overfilled and disorganizedSpares without any labeling or order

Exhibit 7: The path for materials flow was often obstructed
Unfinished rough path along which several 0.6 ton warp beams were taken on wheeled trolleys every day to the elevator, which led down to the looms.
This steep slope, rough surface and sharp angle meant workers often lost control of the trolleys. They
crashed into the iron beam or wall, breaking the trolleys. So now each beam is carried by 6 men.
A broken trolley (the wheel snapped off)
At another plant both warp beam elevators had broken down due to poor maintenance. As a result teams of 7 men carried several warps beams down the stairs every day. At 0.6 tons each this was slow and dangerous - two serious accidents occurred in
our time at the plant.

Exhibit 8: Routine maintenance was usually not carried out, with repairs only undertaken when breakdowns arose, leading to frequent stoppages.
Parts being cleaned and replaced on jammed loomBroken machine parts being repaired
Loom parts being disassembled for diagnosisWorkers investigating a broken loom

850.2
.4
.6
.8
Den
sity
1 2 3 4 5management
85Management scores (using Bloom and Van Reenen (2007) methodology)
Brazil and China Manufacturing,
mean=2.67
0.2
.4
.6
.8
De
nsity
1 2 3 4 5management
0.2
.4
.6
.8
1
De
nsity
1 2 3 4 5management
0.5
11
.5
De
nsity
1 3 5management
Indian Manufacturing,
mean=2.69
Indian Textiles, mean=2.60
Experimental Firms, mean=2.60
These firms appear typical of large manufacturers in India, China and Brazil

8686
Sample of firms we worked with

8787
Intervention aimed to improve 38 core textile management practices in 6 areas (1/2)
Targeted
practices in 6
areas:
operations,
quality,
inventory,
loom planning,
HR and sales
& orders

8888
Intervention aimed to improve 38 core textile management practices in 6 areas (2/2)
Targeted
practices in 6
areas:
operations,
quality,
inventory,
loom planning,
HR and sales
& orders

8989
.2.3
.4.5
.6
2008.25 2008.5 2008.75 2009 2009.25 2009.5 2009.75ym
Adoption of these 38 management practices did rise, and particularly in the treatment plants
Notes: Non-experiment plants are other plants in the treatment firms not involved in the experiment. They improved practices over this period because the firm internally copied these over themselves. All initial differences not statistically significant (Table 2)
Wave 1 treatment plants: Diagnostic September 2008, implementation began October 2008
Control plants:Diagnostic July 2009
Wave 2 treatment plants: Diagnostic April 2009, implementation began May 2008
Non-experiment plants:No intervention
January 2009 April 2009 July 2009October 2008July 2008 October 2009April 2008
Sha
re o
f the
38
man
agem
ent p
ract
ices
ado
pted

9090
• Quality
• Inventory
• Operational efficiency
Adoption of these 38 management practices led to clear improvements in 3 areas of these India firms

91
91
Exhibit 10: Quality was so poor that 19% of manpower was spent on repairing defects at the end of the production process
Workers spread cloth over lighted plates to spot defectsLarge room full of repair workers (the day shift)
Non-fixable defects lead to discounts of up to 75%Defects are repaired by hand or cut out from cloth

9292
Previously mending was recorded only to cross-check against customers’ claims for rebates
Defects log with defects not recorded in an standardized format. These defects were recorded solely as a record in case of customer complaints. The data was not aggregated or analyzed

939393
Now mending is recorded daily in a standard format, so it can analyzed by loom, shift, design & weaver

9494
The quality data is now collated and analyzed as part of the new daily production meetings
Plant managers now meet
regularly with heads of
quality, inventory, weaving,
maintenance, warping etc.
to analyze data

95
Figure 3: Quality defects index for the treatment and control plants4
06
08
01
00
120
140
-10 -5 0 5 10 15 20timing
Cubic Spline
Spline, 95% lower CI
Notes: Displays the average quality defects index, which is a weighted index of quality defects, so a higher score means lower quality. This is plotted for the 14 treatment plants (♦ symbols) and the 6 control plants (+ symbols). Values normalized so both series have an average of 100 prior to the start of the intervention. “Data” is plotted using a 5 week moving average. To obtain series (rather than point-wise) confidence intervals we used a cubic-spline with one knot at the start of the implementation period. The spline estimate is labeled (“Cubic Spine”), the 95% confidence upper and lower intervals labeled (“Spline, 95% upper CI”) and (“Spline, 95% lower CI”) from plant-wise block boostrap. Timing based on weeks after the intervention (positive values) or before the intervention (negative values). For wave 1 treatment plants this is relative to September 1st 2008, for Wave 2 treatment and control firms April 7th 2009. The control group’s rise in weeks 10+ are due to the pre Diwali and Ede production increase, which usually leads to a deterioration in quality due to increased speeds of production.
Control plants
Treatment plants
Weeks after the start of the intervention
Qu
alit
y d
efec
ts in
dex
(h
igh
er s
core
=lo
wer
qu
alit
y) Start of Diagnostic Start of Implementation
Data (♦ symbol)
Spline, 95% upper CI
Data (+ symbol)
Cubic Spline
Spline, 95% lower CI
Spline, 95% upper CI

9696
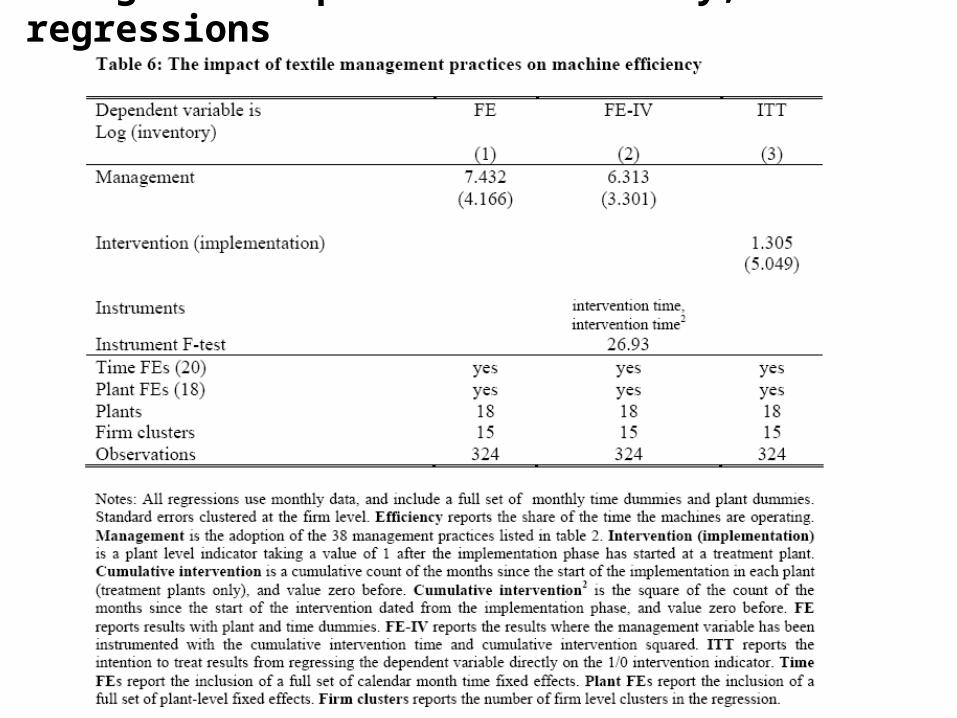
Management impact on quality, regressions

9797
• Quality
• Inventory
• Operational efficiency
Adoption of these 38 management practices led to clear improvements in 3 areas of these India firms

9898
Stock is organized, labeled, and entered
into an Electronic Resource Planning (ERP) system which
has details of the type, age and location.
Bagging and racking yarn reduces waste
from rotting (keeps the yarn dry) and crushing
Computerized inventory systems
help to reduce stock levels.
Organizing and racking inventory enables firms to reduce capital stock and reduces waste

9999
Sales are also informed about excess yarn stock so they can incorporate this in new designs.
Shade cards now produced for all
surplus yarn. These are sent to the
design team to use in future designs

100100
And yarn for products ranges no longer made by the firm (e.g. suiting fabric) was sold
This firms
used to make
suiting and
shirting yarn,
but stopped
making
suiting yarn 2
years ago

101101
Management impact on inventory, regressions

102102
• Quality
• Inventory
• Operational efficiency
Adoption of these 38 management practices led to clear improvements in 3 areas of these India firms

103103
The treated firms have also started to introduce basic initiatives (called “5S”) to organize the plant
Worker involved in 5S initiative on the shop floor, marking out the area
around the model machine
Snag tagging to identify the abnormalities on & around the machines, such as
redundant materials, broken equipment, or accident areas. The operator and the maintenance team is responsible for
removing these abnormalities.
This is all part of the routine maintenance

104104
Spare parts were also organized, reducing downtime (parts can be found quickly), capital stock and waste
Nuts & bolts sorted as per specifications
Tool
storage organized
Parts like gears,
bushes, sorted as per specifications

105105
Production data is now collected in a standardized format, for discussion in the daily meetings
Before(not standardized, on loose
pieces of paper)
After (standardized, so easy to enter
daily into a computer)

106106
Daily performance boards have also been put up, with incentive pay for employees based on this
107107
Management impact on efficiency, regressions

108108
Estimated impacts on productivity and profitability are large and rising
Estimate the intervention has increase profits by about $250,00 per firm and productivity by 9% so far from:- reduced repair manpower costs- reduced wasted materials (from less defects)- lower inventory- higher efficiency levels
Full impacts of better management should be much larger:- short-run impacts only- narrow set of management practices (almost no HR)

109109
So why did these firms have bad management?
Asked the consultants to investigate the non-adoption of each practice in each firm every other month
They did this by discussion with the owners, observation of factory, and from their experiences of changing practices
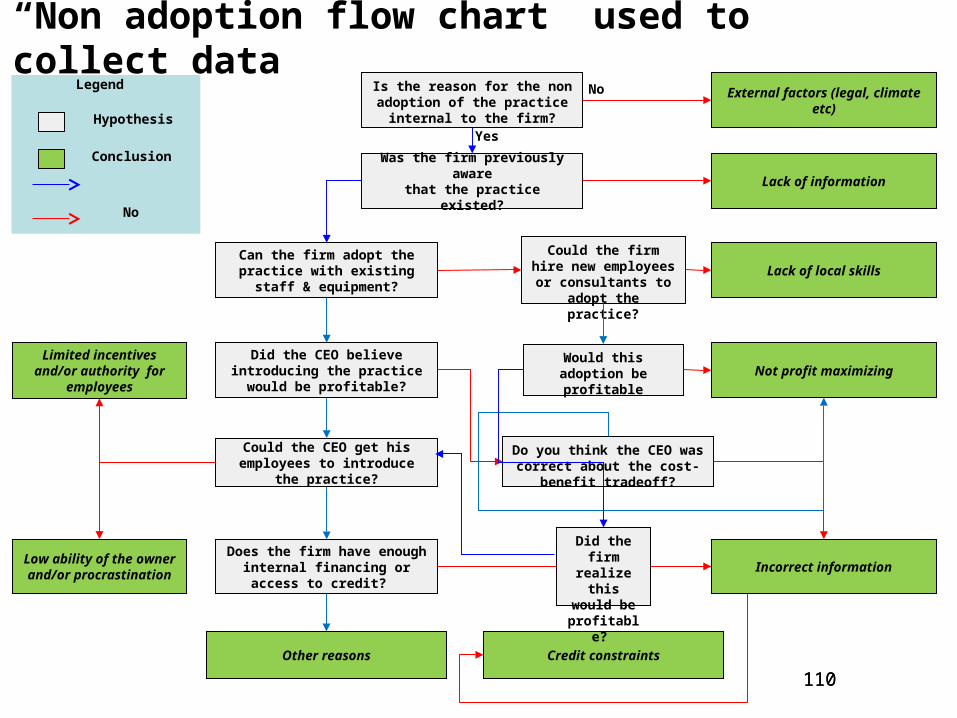
To collect this information systematically we developed a “management non-adoption” flow-chart
110110
“Non adoption flow chart” used to collect data
Was the firm previously awarethat the practice existed? Lack of information
Can the firm adopt the practice with existing staff & equipment?
Did the CEO believe introducing the practice would be profitable?
Low ability of the owner and/or procrastination
Does the firm have enough internal financing or access to credit?
Do you think the CEO was correct about the cost-benefit tradeoff?
Could the firm hire new employees or consultants
to adopt the practice?
Credit constraints
External factors (legal, climate etc)Is the reason for the non adoption of the practice internal to the firm?
Could the CEO get his employees to introduce the practice?
Did the firm realize this would be
profitable?
Would this adoption be profitable Not profit maximizing
Incorrect information
Lack of local skills
Other reasons
Limited incentives and/or authority for employees
Yes
No
Legend
Conclusion
Hypothesis
No

111111
Non adoption data in treatment firms
1) Lack of, or incorrect, information was the major reason. Firms not aware of, or incorrectly evaluated, modern practices.
2) Took time to change incorrect information, as initial trust in consultants was limited, but grew as their advice worked.
3) Blockages later arose with the owners ability or procrastination
4) Ongoing issues with managerial incentives – currently trying to introduce management incentive systems to address this

112112
Why does competition not fix badly managed firms?
Bankruptcy is not (currently) a threat: a weaver wage rates of $5 a day, so these firms can be profitable with bad management.
Reallocation appears limited: Owners take all decisions as they worry about managers stealing. But owners time is constrained – they already work 66.2 hours average a week – limiting growth.
As an illustration firm size is more linked to number of male family members (corr=0.689) - who are trusted to be given managerial positions - than management scores (corr=0.223)
Entry appears limited: Capital intensive ($13m assets average per firm), and no guarantee new entrants are any better.

113
1. Motivation: productivity across firms and countries
2. Measuring management practices
3. Explaining why management practices vary
4. The effect of management practices on performance
5. Conclusions
Lecture 1: Overview

114114
Summary
• Management practices do vary widely across firms and countries, much like productivity
• Factors associated with good management are competition, professional ownership (not families or Government), international exposure, light regulations & education
• There is “good” and “bad” management, in that monitoring, targets and incentives certain practices appear to causally improve performance
• Lastly, change appears slow to tough with many badly run firms. Suggests good management is a type of technology, with informational, incentive and behavorial barriers to adoption

115115
My five outstanding research questions
The key questions which I think remain substantially unanswered
1. What fraction of the differences in TFP across firms and countries can management causally explain?
2. What are the key factors causing difference in management?
3. Why do management practices take so long to change?
4. Are different management practices complementary, or are their impacts more or less additive?
5. What broad types of management practices are universally good and what types of contingent on firm’s environment

116116
Backup slides

117
9:00-12:00 Tuesday February 9th:Readings by category: (* are core readings)• Bertrand, Marianne, and Antoinette Schoar. 2003. “Managing with Style: The Effect of Managers on Firm Policies.” Quarterly Journal of Economics, 118 (4): 1169-1208.• * Ichniowski, Casey, Kathryn Shaw and Giovanna Prenushi. (1997), “The Effects of Human Resource Management: A Study of Steel Finishing Lines”, American Economic Review, LXXXVII (3), 291-313.• Black, Sandra, and Lisa Lynch. 2001. “How to Compete: The Impact of Workplace Practices and Information Technology on Productivity.” Review of Economics and Statistics, 88(3): 434-45.• * Bloom, Nicholas, and John Van Reenen (2007) “Measuring and Explaining Management Practices across Firms and Countries”, Quarterly Journal of Economics, 122(4), 1341-1408.• Burstein, Ariel, and Alexander Monge-Naranjo. 2009. “Foreign Know-how, Firm Control, and the Income of Developing Countries.” Quarterly Journal of Economics, 124(1): 149-195.• Bloom, Nicholas, and John Van Reenen (2010) “Why do management practices differ across firms and countries”, Journal of Economic Perspectives, 24(1).• Syverson Chad. 2004b. “Market Structure and productivity: A Concrete Example.” Journal of Political Economy, 112(6): 1181-1222.• * (read the empirical part only) Foster Lucia, John Haltiwanger, and Chad Syverson. 2009. “Reallocation, Firm Turnover and Efficiency: Selection on Productivity or Profitability.” American Economic Review, 98(1): 394-425.• Hall, Robert, and Charles Jones. 1999. “Why Do Some Countries Produce So Much More Output Per Worker Than Others?” Quarterly Journal of Economics, 114(1): 83-116.• Hsieh, Chiang-Tai, and Pete Klenow. 2009. “Misallocation and Manufacturing TFP in China and India.” Quarterly Journal of Economics,• * Bloom, Nicholas, Eifert, Benn, Mahajan, Aprajit, McKenzie, David and John Robert. (2010), “Management matters: evidence from Indian firms”, Stanford mimeo• Bloom, Nicholas, Mahajan, Aprajit, McKenzie, David and John Robert. (2010), “Why do firms in developing countries have low productivity”, forthcoming American Economic Review papers and proceedings
Summary reading list, plus papers cited in slides

118
9:00-12:00 Thursday February 11th: (* are core readings)• * Rajan, Raghuram, and Julie Wulf (2006) “The Flattening Firm: Evidence from Panel Data on the Changing Nature of Corporate Hierarchies”, Review of Economics and Statistics, 88(4), 759-773.• Acemoglu Daron, Philippe Aghion, Claire Lelarge, John Van Reenen, and Fabrizio Zilibotti (2007) “Technology, Information and the Decentralization of the Firm”, Quarterly Journal of Economics, 122(4), 1759–1799.• * Bloom, Nicholas, Sadun, Raffaella and John Van Reenen. (2009). “The organization of firms across countries”, 2009, NBER WP15129.• Bloom, Nicholas, Sadun, Raffaella and John Van Reenen. (2010). “Does product market competition lead firms to decentralize?”, forthcoming American Economic Review papers and proceedingsOrganizational structures, IT and performance:• * Bresnahan, Brynjolfsson and Hitt (2002, QJE) Bresnahan, Timothy, Erik Brynjolfsson, and Lorin Hitt (2002) “Information Technology, Workplace Organization and the Demand for Skilled Labor: Firm-level Evidence”, Quarterly Journal of Economics, 117(1), 339-376.• Baker, George, and Thomas Hubbard (2003) “Make Versus Buy in Trucking: Asset Ownership, Job Design and Information”, American Economic Review, 93(3), 551-572.• Bloom, Nicholas, Raffaella Sadun, and John Van Reenen (2007) “Americans do IT Better: American Multinationals and the Productivity Miracle”, NBER WP 13085, and revise and resubmit for the American Economic Review.
Summary reading list, plus papers cited in slides

119
Lazear (2000, AER) study on Safelite glass
Another classic, which studies the introduction of one type of management practice – piece-rate pay – on performance
The setting is Safelite Glass, who replace car windscreens, who rolled out a switch from flat to piece-rate across regions.
Examines performance-data for 19 months before and after the switch from hourly rates to piece-rate and finds:
• Increase in productivity of 44%• Combination of selection and effort effects