-1- m.g. cryogenic temperatures ames research center, …
TRANSCRIPT
-1- M.G.
PARAMETRIC PERFORMANCE OF CIRCUMFERENTIALLY GROOVED HEAT PIPESWITH HOMOGENEOUS AND GRADED-POROSITY SLAB WICKS AT
CRYOGENIC TEMPERATURES
M. Groll*, R. B. Pittman** **Ames Research Center, NASA
Moffett Field, California, 94035, U.S.A.and
J. E. EningerTRW Systems Group
Redondo Beach, California, 90278, U.S.A.
ABSTRACT
A recently developed, potentially high-performance nonarterial wick has beenextensively tested. This slab wick has an axially varying porosity which canbe tailored to match the local stress imposed on the wick. The purpose ofthe tests was to establish the usefulness of the graded-porosity slab wick atcryogenic temperatures between 110 K and 260 K, with methane and ethane asworking fluids. For comparison, a homogeneous (i.e., uniform porosity) slabwick was also tested. The tests included:
• Maximum heat pipe performance as a function of fluid inventory.
• Maximum performance as a function of operating temperature.
• Maximum performance as a function of evaporator elevation.
• Influence of slab wick orientation on performance.
The experimental data were compared with theoretical predictions obtainedwith the computer program GRADE.
BACKGROUND AND OBJECTIVES
High transport capability in heat pipes operating near room temperature canbe attained with the use of arteries, which simultaneously provide highcapillary pressure and low flow resistance for the condensed liquid. Arte-rial heat pipes, however, have several disadvantages, especially if they arealso gas-loaded variable-conductance heat pipes. In fact, arteries will notfunction at all for ammonia variable-conductance heat pipes, evidentlybecause of pressure fluctuations that occur as a result of instability of thegas front /!/. With fluids that can be used (e.g., methanol), primingfoils /2/ are required to vent the noncondensible gas and rigid levelingrequirements are necessary during test to prime the arteries.
*National Research Council Associate**Engineering Co-op Program, University of California, Davis
M.G. -2-
Conventional, nonarterial heat pipes are, in general, more reliable andeasier to test than arterial heat pipes; however, they have a far lower heattransport capability. Therefore, a high-performance nonarterial wick wasdeveloped by optimally varying its porosity along its length. A conventionalwick whose porosity is uniform along its length has an unnecessarily highcapillary-pressure limit, and, hence, an unnecessarily low permeability every-where except at the evaporator end, where the limit is reached at the maximumheat load. By varying the porosity, the capillary-pressure limit is only ashigh as required to sustain the local vapor-liquid pressure difference and,thus, the permeability is as high as possible everywhere along the length ofthe wick. The potential increase in performance of such a graded-porositywick depends on the particular application, but it is typically greater thana factor of two /3/.
Despite the fact that the original goal was to develop a high-performancenonarterial, all-aluminum heat pipe for use with ammonia at near-room tempera-tures, the need for all-stainless-steel heat pipes for use with cryogenicworking fluids, like ethane, methane, nitrogen, and oxygen was alsorecognized. The particular objective of this development was to demonstratethe performance of a graded-porosity wick heat pipe with cryogenic workingfluids and to compare it (a) with the performance of an optimized homogeneouswick heat pipe, and (b) with theoretical predictions based on the computerprogram GRADE /4,5/.
DESCRIPTION OF INVESTIGATED CRYOGENIC HEAT PIPES
Two stainless-steel cryogenic heat pipes were developed:, one with a graded-porosity wick ("G" wick), and the other with a homogeneous wick ("H" wick).The length of the heat pipes is 98 cm with 15-cm evaporator and condensersections. The tubes are made of PH 15-7 Mo stainless steel. The outsidediameter is 1.27 cm and the wall thickness is 0.7112 mm. The tubes are cir-cumferentially threaded with 40 grooves/cm. The groove opening is 0.178 mmand the included angle is 38°.
Both the "G" and the "H" wick were designed for either methane at 150 K orethane at 236 K. At these temperatures, methane and ethane have nearlyidentical heat pipe properties, as shown in Figs. 1, 2, and 3. Therefore, asingle wick design can be used for both fluids. The predicted optimum poros-ity for the "H" wick (Fig. 4) is 86.3%. The optimum volume density (1-poros-ity) variation for the "G" wick is shown in Fig. 5. In Figs. 4 and 5 thegeometrical dimensions of the wicks are also indicated. The wicks weredesigned and optimized to self-prime with the slab oriented horizontally atan evaporator elevation of 0.25 cm.
The calculated fluid inventories for the nominal operating temperatures (150 Kfor methane and 236 K for ethane) and for fill charges between 70% and 130%are given in Table 1. The temperature dependence of the fluid inventory fora given fill charge of 95% (see Optimum Fluid Inventory under EXPERIMENTS) isshown in Table 2. The fluid inventory is difficult to predict as the wickcross section is not accurately known. When the wick is inserted into thetube, it is deformed to an extent that cannot be determined.
-3-
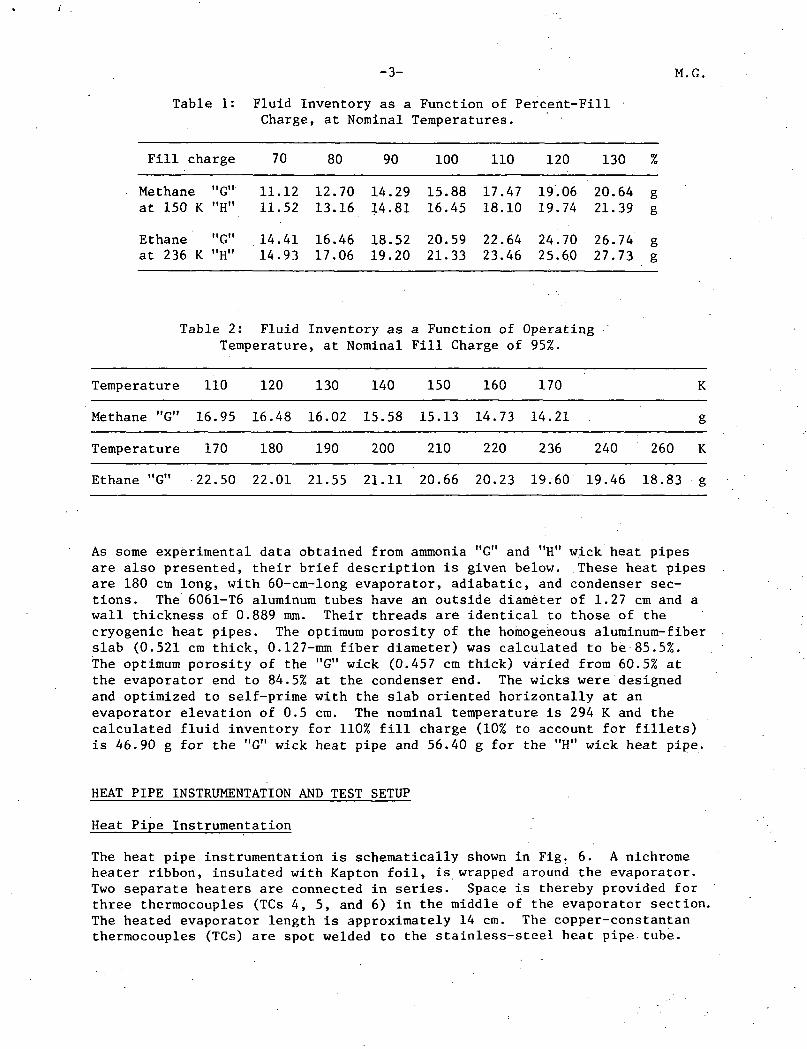
Table 1: Fluid Inventory as a Function of Percent-FillCharge, at Nominal Temperatures.
M.G.
Fill charge 70 80 90 100 110 120 130 %
Methane "G"at 150 K "H"
Ethane "G"at 236 K "H"
11.12 12.70 14.29 15.8811.52 13.16 14.81 16.45
17.47 19.06 20.64 g18.10 19.74 21.39 g
14.41 16.46 18.52 20.59 22.64 24.70 26.74 g14.93 17.06 19.20 21.33 23.46 25.60 27.73 g
Table 2: Fluid Inventory as a Function of OperatingTemperature, at Nominal Fill Charge of 95%.
Temperature
Methane "G"
Temperature
110
16.95
170
120
16.48
180
130
16.02
190
140
15.58
200
150
15.13
210
160
14.73
220
170
14.21
236 240
K
g
260 K
Ethane "G" 22.50 22.01 21.55 21.11 20.66 20.23 19.60 19.46 18.83 g
As some experimental data obtained from ammonia "G" and "H" wick heat pipesare also presented, their brief description is given below. These heat pipesare 180 cm long, with 60-cm-long evaporator, adiabatic, and condenser sec-tions. The 6061-T6 aluminum tubes have an outside diameter of 1.27 cm and awall thickness of 0.889 mm. Their threads are identical to those of thecryogenic heat pipes. The optimum porosity of the homogeneous aluminum-fiberslab (0.521 cm thick, 0.127-mm fiber diameter) was calculated to be 85.5%.The optimum porosity of the "G" wick (0.457 cm thick) varied from 60.5% atthe evaporator end to 84.5% at the condenser end. The wicks were designedand optimized to self-prime with the slab oriented horizontally at anevaporator elevation of 0.5 cm. The nominal temperature is 294 K and thecalculated fluid inventory for 110% fill charge (10% to account for fillets)is 46.90 g for the "G" wick heat pipe and 56.40 g for the "H" wick heat pipe.
HEAT PIPE INSTRUMENTATION AND TEST SETUP
Heat Pipe Instrumentation
The heat pipe instrumentation is schematically shown in Fig. 6. A nichromeheater ribbon, insulated with Kapton foil, is wrapped around the evaporator.Two separate heaters are connected in series. Space is thereby provided forthree thermocouples (TCs 4, 5, and 6) in the middle of the evaporator section.The heated evaporator length is approximately 14 cm. The copper-constantanthermocouples (TCs) are spot welded to the stainless-steel heat pipe tube.
M.G. -4-
The TC beads are protected by RTV. TC locations for both the "G" and "H"wick heat pipes are displayed in Fig. 6.
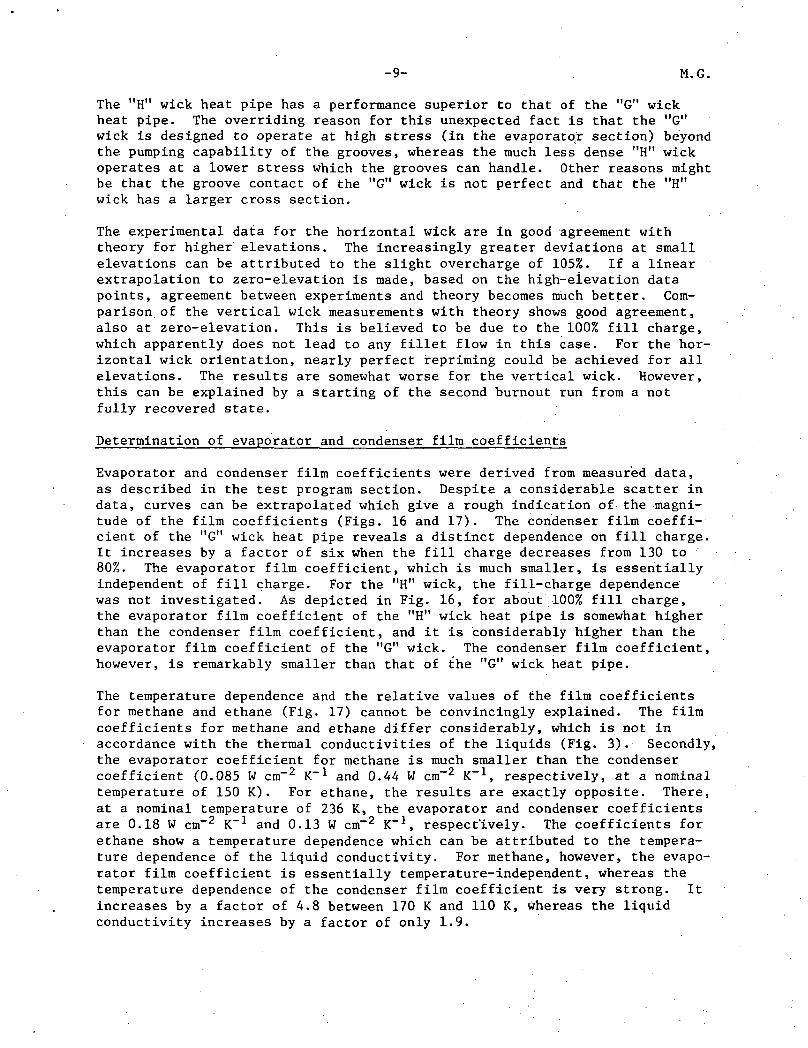
Test Setup
A schematic diagram of the test setup is depicted in Fig. 7. The tests werecarried out in a vacuum chamber with room-temperature walls. The vacuum sys-tem provides a vacuum of less than 10~5 torr. The heat pipe is mounted on atest fixture, with a support bracket at the evaporator end. The condenserend with the fill valve is held by the liquid-nitrogen-cooled condenser blockmade from copper. Six cartridge heaters, connected in parallel, are insertedinto the condenser block to provide heat for sink temperature control. Thetest frame can be elevated or lowered by means of a vacuum-tight rotatablefeedthrough. The frame and the heat pipe are leveled by means of the feed-through and the bubble level on the frame. The tilt of the heat pipe ismeasured with the ruler which is attached to the frame and the theodolite-mirror system which is firmly fixed to the floor outside of the chamber. Theheat pipe is well insulated with 20 to 30 layers of aluminized Mylar foil.
Data Reduction
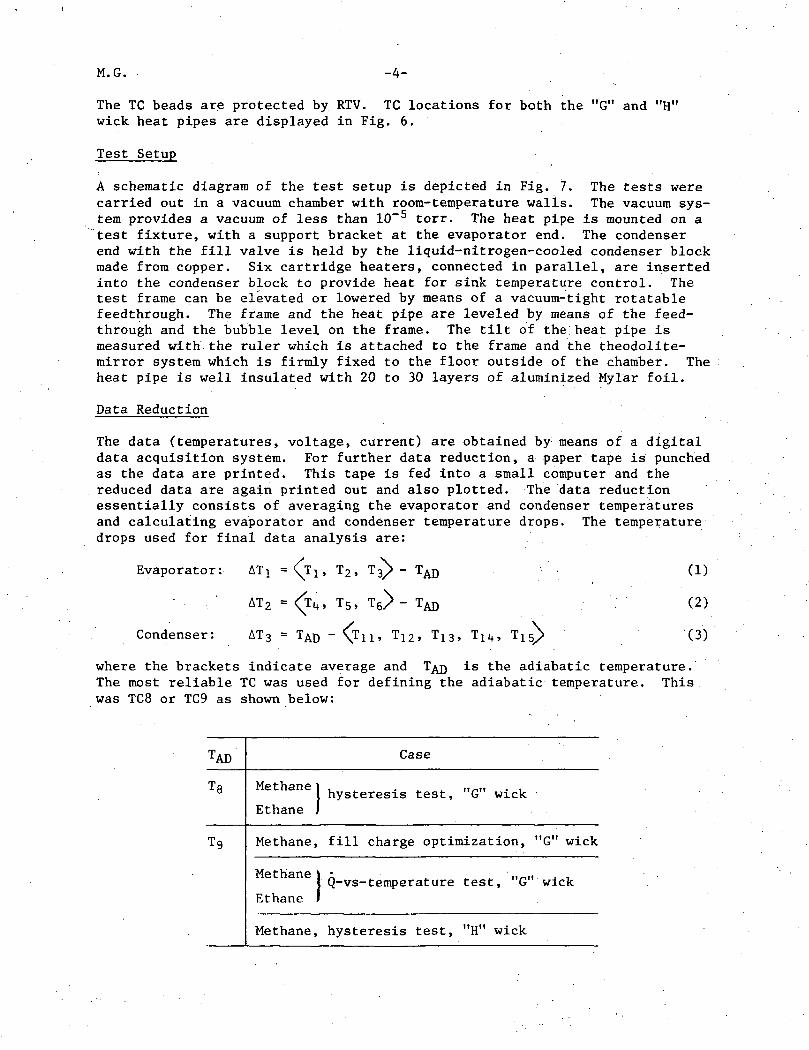
The data (temperatures, voltage, current) are obtained by means of a digitaldata acquisition system. For further data reduction, a paper tape is punchedas the data are printed. This tape is fed into a small computer and thereduced data are again printed out and also plotted. The data reductionessentially consists of averaging the evaporator and condenser temperaturesand calculating evaporator and condenser temperature drops. The temperaturedrops used for final data analysis are:
Evaporator:
Condenser:
ATj =\T\, T2, T3/> - TAD
AT2 = <*£k, T5, T6>- TAD
AT3 = TAD - <Tn, T12> T13, Tllt, T15)>
(1)
(2)
(3)
where the brackets indicate average and TAD ^s the adiabatic temperature.The most reliable TC was used for defining the adiabatic temperature. This,was TC8 or TC9 as shown below:
TAD
T8
T9
Case
Methane j
Ethane 1
Methane,
Methane \
Ethane I
Methane,
hysteresis test, "G" wick
fill charge optimization, '
Q-vs-temperature test, "G"
hysteresis test, "H" wick
G" wick
wick
-5- M.G.
EXPERIMENTS
Some Data From Ammonia Heat Pipes
Measured zero-elevation performances at 294 K were 182 W (corresponding to aheat transport capability of 21,SAO W cm) for the "G" wick heat pipe and157 W (corresponding to 18,840 W cm) for the "H" wick heat pipe. The meas-ured performance of the "G" wick heat pipe is in reasonable agreement withthe theoretical predictions. However, an old version of GRADE /4/ was usedfor the wick optimization, and the "G" wick was calculated to be everywheretoo dense. Another computer run with an updated version of GRADE /5/ showedthat the zero-elevation performance can be as high as 282 W (correspondingto 33,840 W cm) for an optimized "G" wick. The measured performance of the"H" wick was better than predicted at evaporator elevations above 0 cm. Theperformance increase of the (nonoptimized) "G" wick over the optimum "H" wickwas only somewhat more than 10%, for horizontal operation. However, thecross section of the "G" wick was 13% less than that of the "H" wick, and the"G" wick was not optimum. Based on the potential performance of the opti-mized "G" wick, an improvement of about 80% over the performance of the some-what thicker "H" wick for horizontal operation can be expected.
Test Program for Cryogenic Heat Pipes
Optimum fluid inventory
The maximum throughput and evaporator and condenser temperature drops of themethane-filled "G" wick heat pipe are measured as functions of fluid inven-tory for horizontal slab orientation, 150 K adiabatic (vapor) temperature,and 0.25-cm evaporator elevation. Two critical performance levels are con-sidered. The "burnout" power is reached when the maximum evaporator tempera-ture drop, either ATj or AT£, has risen to 20 K. This .definition of burnoutpower is used for all subsequent tests. The "dryout" power is reached when,for increasing power, either the ATi or AT£ curve shows a significantchange in slope.
The leveled heat pipe is first cooled down to the desired operating tempera-ture, and allowed to prime for 30 min. Then the heat pipe is elevatedto 0.25-cm evaporator elevation. Power is added to the evaporator heatersin 4- to 5-W increments, which are reduced to 2- to 3-W increments when theexpected burnout is approached. After burnout has been obtained, the heatpipe is allowed to warm up to room temperature, removed from the chamber, andvented to the next fill charge. From the results of these tests, an"optimum" or nominal fill charge can be defined on the basis of a tradeoffbetween performance and temperature drops.
Performance as function of operating temperature
The temperature dependence of performance is measured for the "G" wick heatpipe (filled with the nominal fluid inventory), for horizontal wick orienta-tion and at an evaporator elevation of 0.25 cm. The leveled heat pipe iscooled down to the minimum operating temperature, and the test proceduresdescribed above are repeated. After the heat pipe is removed from thechamber, it is vented to contain the same nominal fill charge at the nexthigher operating temperature.
M.G. -6-
Performance as function of evaporator elevation (hysteresis tests)
These tests are carried out for the "G" wick heat pipe with methane (wickhorizontal and vertical) and ethane (wick horizontal) as .working fluids, withthe nominal (95%) fluid inventory and at nominal operating temperatures(150 K for methane, 236 K for ethane). For comparison, these tests are alsocarried out with the "H" wick heat pipe, filled with methane (fill charge105% for horizontal wick orientation and 100% for vertical wick orientation)at the nominal operating temperature of 150 K.
The test cooldown, priming, elevation, and power incrementing steps are asdescribed above. However, 1- to 3-W increments, depending on evaporatorelevation, are used when expected burnout is approached. After burnout hasbeen obtained, the power is reduced in 2- to 3-W increments until the heatpipe recovers. Recovery occurs when the largest evaporator temperature dif-ference is not more than the respective difference before burnout; that is,the evaporator temperatures have dropped to their preburnout value, indi-cating that the evaporator has been rewetted. The heat pipe is allowed tostablize at this condition for 5 to 20 min. Thereafter, power is increasedin the same increments as described above until a burnout is obtained asecond time. Before testing at the next evaporator elevation, the heat pipeis again leveled and allowed to prime for 30 min.
Theoretical predictions
All theoretical predictions are made by means of the computer program GRADE.As the present version of GRADE does not account for excess liquid, the fillcharge optimization (variation) cannot be done on the computer. Moreover,all other calculations are carried out with a 100% fill charge.
Determination of evaporator and condenser film coefficients
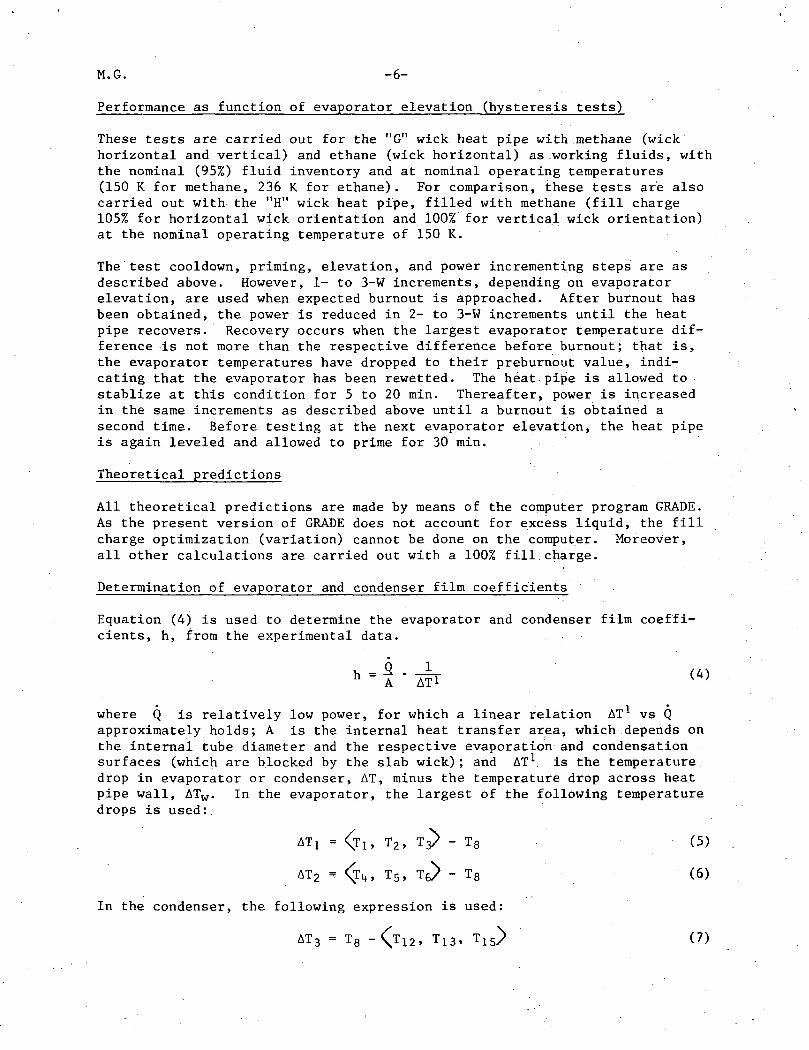
Equation (4) is used to determine the evaporator and condenser film coeffi-cients, h, from the experimental data.
* 1 *where Q is relatively low power, for which a linear relation AT vs Qapproximately holds; A is the internal heat transfer area, which depends onthe internal tube diameter and the respective evaporation and condensationsurfaces (which are blocked by the slab wick); and AT1 is the temperaturedrop in evaporator or condenser, AT, minus the temperature drop across heatpipe wall, ATW. In the evaporator, the largest of the following temperaturedrops is used: .
, T2, T - T8 (5)
AT2 = <5\, T5, Te> - T8 (6)
In the condenser, the following expression is used:
AT3 = T8 -<J12, T13, T15> (7)
-7- : M.G.
Results and Comparison With Theoretical Predictions
Optimum fluid inventory
The fill-charge optimization, as shown in Fig. 8, covers a range from 130 to80%. Between 110 and 80%, the maximum power va'ries nearly linearly with fillcharge, whereas over 110%, there is a greater-than-first-power dependence.This is attributed to the increasing effect of fillet flow which bypasses thewick. The dryout and burnout curves are nearly parallel and close to eachother. This indicates that the transition from a moderately dried-out stateto burnout (with either stable or unstable serious superheating of the evap-orator) occurs in a small power range. The performance throughout is lowerthan expected, especially the 100% fill-charge data, Figs. 8 and. 9. It isassumed that this is caused by the fact that, at higher powers, the circum-ferential grooves no longer can pump sufficient liquid away from the wick.This means that burnout is determined by a groove dry out rather than by awick failure. By optimizing groove dimensions, this limitation can be pre-vented. Another reason for the low performance is that the wick did not fittightly into the heat pipe tube, and might also have become deformed duringinsertion into the tube. Thereby, wick-groove contact is reduced, degradingthe liquid supply to the evaporator surface. A nonuniform contact of theslab wick to the grooved wall is also indicated by the TC readings.
For high fill charges, apart from a local hot spot around TC2, the "G" wick,in most cases, dries out first in the middle of the evaporator (TCs 4, 5, 6).TC6 starts rising first, followed by TCs 5 and 4. With increasing power,TC4 soon becomes and remains highest, followed by TCs 6 and 5, which lieclose together. It is possible to run the heat pipe in stable condition withthis part of the evaporator seriously dried out (AT 2 ~ 80 K). At higherpowers, the far evaporator end starts to dry out. Similar to behavior at themid-evaporator position, TC2 is always highest, then TC3 and 1, in this order,start to rise in temperature. A stable heat pipe operation can be maintainedwith the evaporator end seriously dried out (ATi * 30 to 50 K). A furtherincrease in power causes a fast runaway of the evaporator temperatures at arate of 4 K/min to 10 K/min. The situation is somewhat different for smallfluid inventories (80 to 100%). Here, TC2 no longer indicates a higher tem-perature, and the evaporator end starts to dry out very uniformly at rela-tively lower powers. Again, the middle of the evaporator dries out first, asdescribed above.
For all fill charges, both the dryout and the burnout levels are determinedby the temperature increase in the middle part of the evaporator.
Figure 8 further shows a distinct and similar fill-charge dependence ofthe evaporator and condenser temperature drops. The chief factor for theincrease of AT with increasing fill charge can be attributed to theincreasing maximum power. However, for underfill conditions, the evaporatortemperature drops level off and tend to rise again at 80% fill charge. Thiscan be explained by a superheating of the evaporator due to permanent defici-ency of liquid. The condenser temperature drop falls off sharply for fillcharges under 100%. It also seems to level off at 80% fill charge. However,the absolute value is so small (0.5 K) that the temperature precision of themeasurements is exceeded.
M.G. -8-
The conclusion is that a fill charge of 100% or somewhat less can beconsidered to be optimum. In this range, the overall temperature drops arereasonably small and the reduction in maximum performance is tolerable.Therefore, 95% fill charge was chosen as the nominal value for all tests withthe "G" wick heat pipe.
Performance as function of operating temperature
The measured data can be represented by curves (Fig. 9 for methane and Fig. 10for ethane), the shape of which is in excellent agreement with the shape ofthe theoretically predicted curves, though they are considerably lowerthroughout the entire temperature range. There is also good agreement withthe figures of merit (Fig. 1) of methane and ethane. These facts indicatethat, for both working fluids and the temperature range covered, the liquidpressure drop strongly dominates, and vapor flow pressure drops can beneglected.
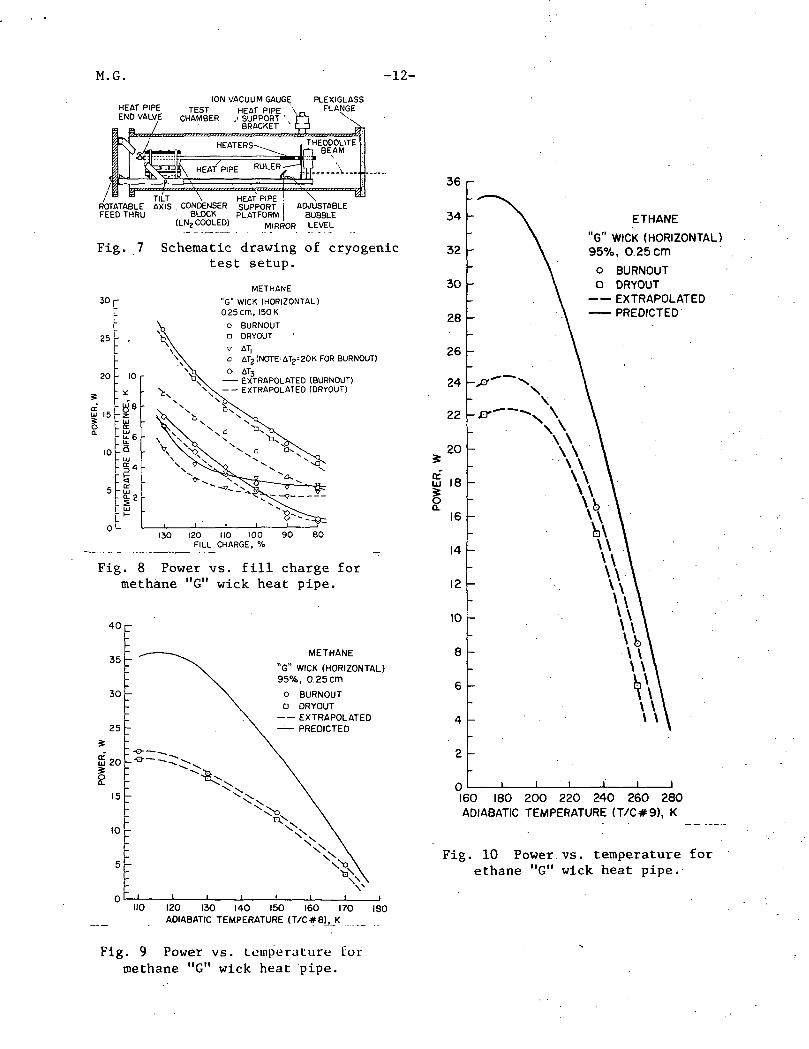
Performance as function of evaporator elevation (hysteresis tests)
The results for the "G" wick heat pipe with methane and ethane as workingfluids (nominal fill charge of 95%) are depicted in Figs. 11, 12, and 13.The results for the "H" wick heat pipe with methane as working fluid (fillcharge 105% for horizontal wick orientation, and 100% for vertical wick ori-entation) are shown in Figs. 14 and 15. In Fig. 14, the performance predic-tion for the optimized "H" wick is also included. The performance predictionsfor the actual porosity distribution of the "G" wick (wick horizontal) areincluded in Figs. 11 and 13. That the slope of the predicted power-vs-elevation curve is not constant is due to the fact that, for a "G" wick,capillary failure does not always initiate at the evaporator end.
The performance of the "G" wick heat pipe is significantly higher when theslab wick is oriented vertically, compared to the horizontal wick orienta-tion; but, in both cases, the extrapolated experimental curves are far belowthe predicted curve. The reasons for the low measured performance have beendiscussed earlier. The superior performance of the vertical wick seems to bedue to the fact that liquid supply to the circumferential grooves is somewhateasier to achieve when the wick is vertical. The measured data indicate thatthe wick has an excellent repriming capability, at least up to an elevationof 2 to 3 cm, and probably until close to the zero-load elevation. However,some data points reveal a considerably lower second burnout. This is attrib-uted to the fact that, in these cases, the heat pipe was not fully recoveredbefore beginning the second burnout run. For most of these cases, power hadnot been reduced sufficiently and/or the time period at recovery power hadnot been long enough to reduce the evaporator temperature sufficiently. Therelevant evaporator temperature differences ATj and AT2 are indicated inFigs. 11, 12, and 13.
The data for the horizontal wick orientation indicate a fillet or puddle floweffect at low elevations. At first glance, this seems to be rather improb-able, since the fill charge is only 95%. However, in fibrous wicks, asstress builds up, partial desaturation sets in as the larger pores give up.fluid. This is especially pronounced when approaching high loads. Secondaryreasons for this effect might be an imperfect wick-groove contact and thefact that, when calculating the fluid inventory, the circumferential grooveswere assumed to be completely filled with liquid. For the vertical wickorientation, the fillet flow effect is less pronounced.
-9- M.G.
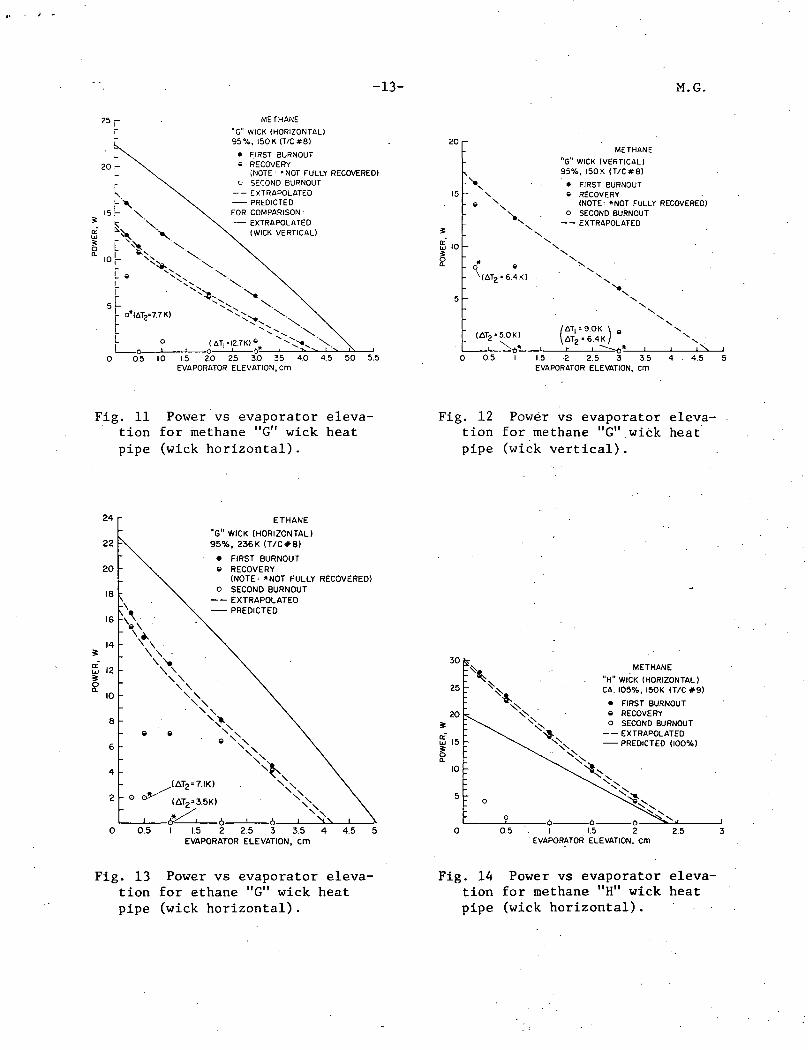
The "H" wick heat pipe has a performance superior to that of the "G" wickheat pipe. The overriding reason for this unexpected fact is that the "G"wick is designed to operate at high stress (in the evaporatqr section) beyondthe pumping capability of the grooves, whereas the much less dense "H" wickoperates at a lower stress which the grooves can handle. Other reasons mightbe that the groove contact of the "G" wick is not perfect and that the "H"wick has a larger cross section.
The experimental data for the horizontal wick are in good agreement withtheory for higher elevations. The increasingly greater deviations at smallelevations can be attributed to the slight overcharge of 105%. If a linearextrapolation to zero-elevation is made, based on the high-elevation datapoints, agreement between experiments and theory becomes much better. Com-parison of the vertical wick measurements with theory shows good agreement,also at zero-elevation. This is believed to be due to the 100% fill charge,which apparently does not lead to any fillet flow in this case. For the hor-izontal wick orientation, nearly perfect repriming could be achieved for allelevations. The results are somewhat worse for the vertical wick. However,this can be explained by a starting of the second burnout run from a notfully recovered state.
Determination of evaporator and condenser film coefficients
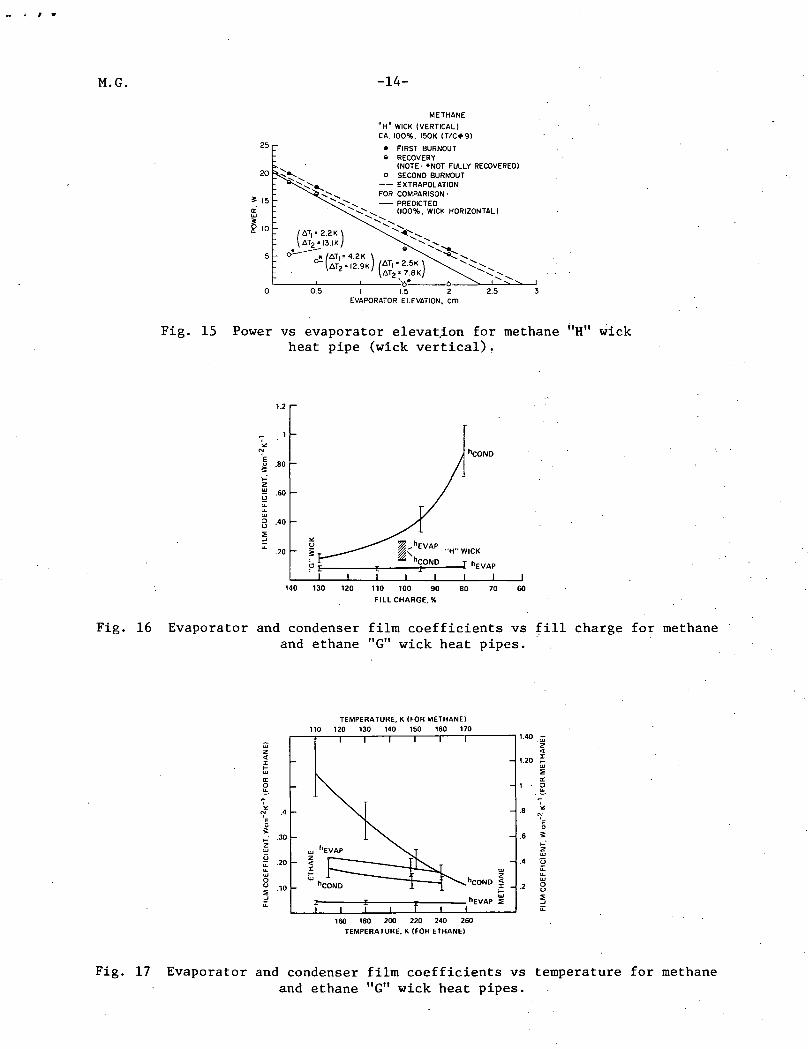
Evaporator and condenser film coefficients were derived from measured data,as described in the test program section. Despite a considerable scatter indata, curves can be extrapolated which give a rough indication of the magni-tude of the film coefficients (Figs. 16 and 17). The condenser film coeffi-cient of the "G" wick heat pipe reveals a distinct dependence on fill charge.It increases by a factor of six when the fill charge decreases from 130 to80%. The evaporator film coefficient, which is much smaller, is essentiallyindependent of fill charge. For the "H" wick, the fill-charge dependencewas not investigated. As depicted in Fig. 16, for about 100% fill charge,the evaporator film coefficient of the "H" wick heat pipe is somewhat higherthan the condenser film coefficient, and it is considerably higher than theevaporator film coefficient of the "G" wick. The condenser film coefficient,however, is remarkably smaller than that of the "G" wick heat pipe.
The temperature dependence and the relative values of the film coefficientsfor methane and ethane (Fig. 17) cannot be convincingly explained. The filmcoefficients for methane and ethane differ considerably, which is not inaccordance with the thermal conductivities of the liquids (Fig. 3). Secondly,the evaporator coefficient for methane is much smaller than the condensercoefficient (0.085 W cm~2 K"1 and 0.44 W cm"2 K"1, respectively, at a nominaltemperature of 150 K). For ethane, the results are exactly opposite. There,at a nominal temperature of 236 K, the evaporator and condenser coefficientsare 0.18 W cm~2 K"1 and 0.13 W cm~2 K"1, respectively. The coefficients forethane show a temperature dependence which can be attributed to the tempera-ture dependence of the liquid conductivity. For methane, however, the evapo-rator film coefficient is essentially temperature-independent, whereas thetemperature dependence of the condenser film coefficient is very strong. Itincreases by a factor of 4.8 between 170 K and 110 K, whereas the liquidconductivity increases by a factor of only 1.9.

M.G. -10-
CONCLUSIONS
The test program was only partially successful. The optimum performance of agraded-porosity wick heat pipe was not satisfactorily demonstrated at cryo-genic temperatures. The test results were below the theoretical predictions,by a factor of 1.3 (ethane) to 1.8 (methane), for nominal test conditions of0.25-cm evaporator elevation and 236 K (ethane) and 150 K (methane) operatingtemperatures. The optimized homogeneous wick heat pipe, however, performedvery well. Its performance was in good agreement with theoretical predic-tions, and was considerably higher than that of the graded-porosity wick heatpipe.
There is strong evidence that the grooves of the investigated cryogenicgraded-porosity wick heat pipe were not optimally matched to the slab wick.This is a crucial point, and more attention must be given to the matching ofthe.capillary capabilities of the grooves and the wick.
Theoretical predictions and experimental results indicate that both theoptimized homogeneous and the graded-porosity wick heat pipes have the poten-tial for high throughput and excellent tilt performance, when using methaneand ethane as cryogenic working fluids. Concerning the tilt capability, bothheat pipes are far superior to conventional axial groove heat pipes. Withrespect to performance, the optimized homogeneous wick is comparable withconventional axial groove heat pipes. The optimized graded-porosity wickheat pipe, though not yet fully demonstrated, promises a potentially highperformance which is superior to that of conventional axial groove heat pipesand may be strongly competitive with that of improved axial groove designs.This high-performance potential, however, can only be realized when thegrooves are matched to the slab wick. This potential is demonstrated by theexcellent performance of the ammonia graded-porosity wick heat pipe. Thegraded-porosity wick also offers favorable application in gas-controlledthermal control heat pipes.
REFERENCES '
/!/ W. T. Anderson, D. K. Edwards, J. E. Eninger, B. D. Marcus: VariableConductance Heat Pipe Technology - Final Research Report. NASA CR-114750,March 1974. .
/2/ J. E. Eninger: Meniscus Coalescence as a Mechanism for Venting Noncon-densible Gas From Heat Pipe Arteries. AIAA Paper No. 74-748, AIAA/ASMEThermophysics and Heat Transfer Conference, Boston, Massachusetts, July1974.
/3/ J. E. Eninger: Capillary Flow Through Fibrous Heat Pipe Wicks. AIAAPaper No. 75-661, AIAA 10th Thermophysics Conference, Denver, Colorado,M a y 1975. ' . . .
/4/ J. E. Eninger: Computer Program GRADE for Design and Analysis ofGraded-Porosity Heat Pipe Wicks. NASA CR-137618, August 1974. .
/5/ J. E. Eninger: Extensions to GRADE. Contract No. NAS 2-8310, August1975.

-11- M.G.
50 100 150 200 250 300 350 400
TEMPERATURE, K
Fig. 1 Figure of merit of methaneand ethane.
DIMENSIONS IN mm
POROSITY:
86.3%
••-7.37+0.254
-0.00
11.40
MATERIAL: 304 STAINLESS
STEEL WIRE0.0914 DIA.
+0.254
-0.00
Fig. 4 Cross section of homogeneouswick.
40
T 30
trO
< 20
ETHANE
METHANE
PC9
£ 0 50 100 150 200 250 300 350 400TEMPERATURE, K
Fig. 2 Wicking height factor ofmethane and ethane.
MATERIAL: 304 STAINLESS STEEL WIRE
0.0914 DIA.
4.67 + 0.254
GRPOR
W
35#> 30
i»Quj 20
!«>10
(
ADED I
OSITY
ICK\
— -
_J
DIMENSIONS IN mm
11 40 +0'25411 -w -o.oo
) 20
36 o
-+18%"
85.3cmI I/
67 cm*/U*Z*.
^T
/\
!~~
98.3 cm
X- 30%^ i!5%H
'
40 60 80 100AXIAL DISTANCE, cm
Fig. 5 Axial density distributionand cross section of graded-porosity wick.
0 50 100 150 200 250 300 350 400TEMPERATURE. K
6.83cm 7.94cm1.27cm
(101/2*1-
- AOItBATIC SECTIOI-
30.48CID— im—
®
-|— MIOEISE« —I
mcmlll/IS-i fj^
'°-'Sfm ,1, /\ ,1-(4*:2.22cm(7/8 )
-0.95c»
®
„ ^COIDEISEI 810M
HEATERS II SERIES, 4fl TOTAL, 0.32cm ll/8'l SPACE BETWEEN HEATERS III SERIES
).®,ETC. SfL|*cL ®.®."C-
"" -<-̂ T ^^<ifV\ II1TE: st"t INSTRUMENTATION FOR GRADEO-POROSITVTD® ETC ®,{rJ)®®EIC AND HOIIOCENEOUS WICK, EXCEPT HO TCs II
" vm' ' ' AND M WITH HOM06ENEOUS WICK.
Fig. 3 Thermal conductivityof methane and ethane.
Fig. 6 Schematic drawing of heat pipewith instrumentation.
M.G. -12-
ION VACUUM GAUGETEST HEAT PIPE
CHAMBER ,' SUPPORT '.BRACKET '
TILT \ HEAT PIPE ! \ROTATABLE AXIS CONDENSER SUPPORT i ADJUSTABLEFEED THRU BLOCK PLATFORM BUBBLE
(LN2 COOLED) MIRROR LEVEL
Fig. 7 Schematic drawing of cryogenictest setup.
30 r
25 -
20 - 10 r
£ 15
10
METHANE
"G" WICK (HORIZONTAL)0.25 Cm, 150 K
o BURNOUTD DRYOUT
v AT,a AT2(NOTE'AT2=20K FOR BURNOUT)
EXTRAPOLATED(BURNOUT)EXTRAPOLATED(DRYOUT)
130 120 110 100FILL CHARGE, %
90 80
Fig. 8 Power vs. fill charge formethane "G" wick heat pipe.
40 r
METHANE
"G" WICK (HORIZONTAL)95%, 0.25 Cm
o BURNOUTD DRYOUT
EXTRAPOLATED— PREDICTED
I 1 1 I I I I
36 r
34
32
30
28
26
24
22
20
18
16
14
12
10
8
6
4
ETHANE
"G" WICK (HORIZONTAL)95%, 0.25 cm
o BURNOUTo DRYOUT
EXTRAPOLATEDPREDICTED
160 180 200 220 240 260 280ADIABATIC TEMPERATURE (T/C#9), K
Fig. 10 Power vs. temperature forethane "G" wick heat pipe.
IZO 130 140 I5O 160 170ADIABATIC TEMPERATURE (T/C#8), K
ISO
Fig. 9 Power vs. temperature Cormethane "G" wick heat pipe.
-13- M.G.
METHANE
"G" WICK (HORIZONTAL)95%, I50K(T/C#8)
• FIRST BURNOUT* RECOVERY
(NOTE' 'NOT FULLY RECOVERED)o SECOND BURNOUT
EXTRAPOLATEDPREDICTED
FOR COMPARISON'EXTRAPOLATED(WICK VERTICAL)
0.5 1.0 1.5 20 2.5 3.0 35 40 4.5EVAPORATOR ELEVATION, Cm
5.0
20
:xv
S
E" 10
0 0.5
= 5.0K)
%b»-
METHANE"G" WICK (VERTICAL)95%, I50K (T/C#8)
• FIRST BURNOUTe RECOVERY
(NOTE' "NOT FULLY RECOVERED)o SECOND BURNOUT
EXTRAPOLATED
.
1.5 2 2.5 3 3.5 4 4.5 5EVAPORATOR ELEVATION, Cm
Fig. 11 Power vs evaporator eleva-tion for methane "G" wick heatpipe (wick horizontal).
Fig. 12 Power vs evaporator eleva-tion for methane "G" wick heatpipe (wick vertical).
ETHANE
"G" WICK (HORIZONTAL)95%, 236K (T/C#8)
• FIRST BURNOUT« RECOVERY
(NOTE' *NOT FULLY RECOVERED)o SECOND BURNOUT
EXTRAPOLATED• PREDICTED
30 fc
0.5 1.5 2EVAPORATOR ELEVATION, Cm
4.5
METHANE
"H" WICK (HORIZONTAL)CA. 105%, I50K (T/C #9)
• FIRST BURNOUT« RECOVERYo SECOND BURNOUT
EXTRAPOLATEDPREDICTED (100%)
I 1.5 2EVAPORATOR ELEVATION, Cm
2.5
Fig. 13 Power vs evaporator eleva-tion for ethane "G" wick heatpipe (wick horizontal).
Fig. 14 Power vs evaporator eleva-tion for methane "H" wick heatpipe (wick horizontal).
M.G. -14-
METHANE
"H" WICK (VERTICAL)CA. 100%, I50K (T/C*9)
• FIRST BURNOUTe RECOVERY
(NOTE' «NOT FULLY RECOVERED)o SECOND BURNOUT
EXTRAPOLATIONFOR COMPARISON'
PREDICTED(100%, WICK HORIZONTAL)
I 1.5 2EVAPORATOR ELEVATION, cm
Fig. 15 Power vs evaporator elevation for methane "H" wickheat pipe (wick vertical).
2£ .60
hCOND
^EVAP£< "H-WICK
-I hEVAPT I " I I I
110 100 90
FILL CHARGE. %
80 70
Fig. 16 Evaporator and condenser film coefficients vs fill charge for methaneand ethane "G" wick heat pipes.
TEMPERATURE. K (FOR METHANE)120 130 140 150 160 170
160 180 200 220 240 260TEMPERATURE. K (FOR ETHANE)
Fig. 17 Evaporator and condenser film coefficients vs temperature for methaneand ethane "G" wick heat pipes.