1 milwaukee mathematics partnership school based partnerships: using social network analysis to...
TRANSCRIPT
1
Milwaukee Mathematics PartnershipSchool Based Partnerships: Using Social Network Analysis to Measure Progress Towards Distributed Leadership
Carl HanssenHanssen Consulting, LLC
DeAnn HuinkerUniversity of Wisconsin-Milwaukee
MSP Learning Network ConferenceWashington, DCJanuary 2008

2
Agenda
Context
Methods
Results
Conclusions

3
Evaluation Goals
Help the MMP better serve its constituents and improve its effectiveness
Serve the broader mathematics education community through documentation and dissemination of MMP activities

4
MMP Evaluation Logic ModelStudent
Achievement
Teacher Content& Pedagogical
Knowledge
Math FacultyInvolvement
Learning TeamEffort
SchoolBuy-in
TeacherInvolvement
NewCourses
DistrictBuy-in
MPA Ownership
MATCBuy-In
UWMBuy-In
ClassroomPractice
MMPActivities
ProximalOutcomes
DistalOutcomes

5
Focus for this study
StudentAchievement
Learning TeamEfforts
SchoolBuy-in
TeacherInvolvement
ClassroomPractice
DistributedLeadership

6
Method
20 Schools from 2006 & 2007
Purposefully selected for diversity in
School Type Geography Student Achievement MMP Involvement

7
SNA Survey
Open survey approach
Teachers & administrators Provide names of individuals with whom you
communicated with about mathematics Demographics
Other data School staff lists Student achievement results
in terms of % proficient

8
Analysis
Maps identify
MTL MTS Teachers Principal Literacy Coach Others in school Others outside
Statistics
Network density (%)
In-Degree(z-score)

9
1a.
2006
School n Total Named Network density
Density in school
MTL Role--In Degree
MTS Role--In Degree
F 13 31 7.2% 11.7% 3.33 2.50
Average 21.1 54.0 6.7% 17.6% 13.81 5.31 SD 6.8 17.6 2.6% 9.6% 7.2 4.9 Median 19 48 6.2% 15.4% 13.07 3.75
10
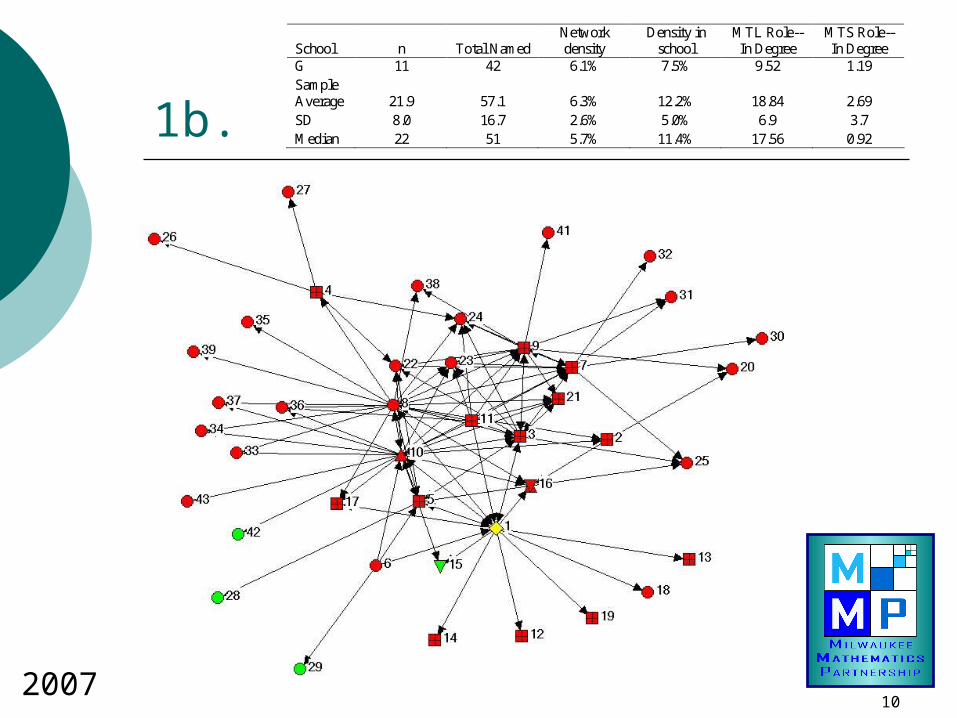
1b.
School n Total Named Network density
Density in school
MTL Role--In Degree
MTS Role--In Degree
G 11 42 6.1% 7.5% 9.52 1.19 Sample Average 21.9 57.1 6.3% 12.2% 18.84 2.69 SD 8.0 16.7 2.6% 5.0% 6.9 3.7 Median 22 51 5.7% 11.4% 17.56 0.92
2007

11
2a.
2006
School n Total Named Network density
Density in school
MTL Role--In Degree
MTS Role--In Degree
C 32 61 6.3% 9.2% 6.67 3.75
Average 21.1 54.0 6.7% 17.6% 13.81 5.31 SD 6.8 17.6 2.6% 9.6% 7.2 4.9 Median 19 48 6.2% 15.4% 13.07 3.75

12
2b.
2007
School n Total Named Network density
Density in school
MTL Role--In Degree
MTS Role--In Degree
C 36 78 3.5% 4.7% 16.98 0.64
Average 21.9 57.1 6.3% 12.2% 18.84 2.69 SD 8.0 16.7 2.6% 5.0% 6.9 3.7 Median 22 51 5.7% 11.4% 17.56 0.92

13
3a.
2006
School n Total Named Network density
Density in school
MTL Role--In Degree
MTS Role--In Degree
J 22 45 5.8% 28.4% 13.07 1.14
Average 21.1 54.0 6.7% 17.6% 13.81 5.31 SD 6.8 17.6 2.6% 9.6% 7.2 4.9 Median 19 48 6.2% 15.4% 13.07 3.75

14
3b.
School n Total Named Network density
Density in school
MTL Role--In Degree
MTS Role--In Degree
I 28.0 75.0 4.0% 12.2% 23.31 0.33
Average 21.9 57.1 6.3% 12.2% 18.84 2.69 SD 8.0 16.7 2.6% 5.0% 6.90 3.70 Median 22.0 51.0 5.7% 11.4% 17.56 0.92
2007

15
4a.
2006
School n Total Named Network density
Density in school
MTL Role--In Degree
MTS Role--In Degree
H 17 46 9.8% 28.6% 22.22 8.33
Average 21.1 54.0 6.7% 17.6% 13.81 5.31 SD 6.8 17.6 2.6% 9.6% 7.2 4.9 Median 19 48 6.2% 15.4% 13.07 3.75

16
4b.
School n Total Named Network density
Density in school
MTL Role--In Degree
MTS Role--In Degree
A 22 43 11.7% 20.1% 30.61 4.40 Sample Average 21.9 57.1 6.3% 12.2% 18.84 2.69 SD 8.0 16.7 2.6% 5.0% 6.9 3.7 Median 22 51 5.7% 11.4% 17.56 0.92
2007
17
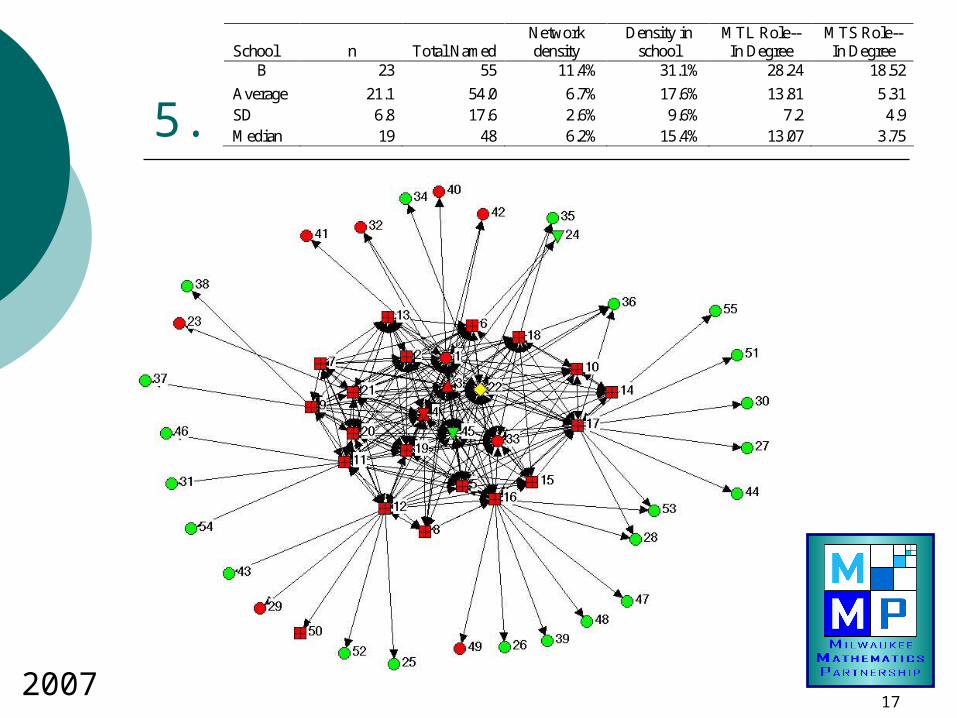
5.
2007
School n Total Named Network density
Density in school
MTL Role--In Degree
MTS Role--In Degree
B 23 55 11.4% 31.1% 28.24 18.52
Average 21.1 54.0 6.7% 17.6% 13.81 5.31 SD 6.8 17.6 2.6% 9.6% 7.2 4.9 Median 19 48 6.2% 15.4% 13.07 3.75

18
MMP Distributed Leadership Continuum
Low High
Loose NetworkMTL Not CentralFew Links to MTLMTS OutsideFew Links to MTS
Tight NetworkMTL Central
Many Links to MTLMTS Inside
Many Links to MTS
1 2 3 4 5

19
Distributed Leadership &Student Achievement
This is the same
school 2 years in a
row!

20
Overall Conclusions
There is support for the argument that schools that have more fully adopted MMP principles are demonstrating stronger outcomes — distributed leadership is one manifestation of MMP adoption.
Creating distributed leadership in a school takes time—and communication is critical
There is tremendous variabilityacross MPS in the extent to which schools have adopted MMPprinciples and ideas

21
Conclusion
No single factor—e.g., distributed leadership, teacher MKT, learning team performance—is sufficient for success, but all may be necessary
Schools that are performing well do many of the things MMP promotes well, andrealize synergy between manyof these activities and principles