1 mpumalanga province department of health and social services public hearing on conditional grants...
TRANSCRIPT

1
MPUMALANGA PROVINCE
DEPARTMENT OF HEALTH AND SOCIAL SERVICES
PUBLIC HEARING ON CONDITIONAL GRANTS AND CAPITAL EXPENDITURE
18 JANUARY 2006
2
SOCIAL SERVICES CONDITIONAL GRANTS

3
SUMMARY OF ACTUAL EXPENDITURE ON CONDITIONAL
GRANTS
4
Summary per conditional grant (current year appropriated funds)

5
Programme
Current year
Budget
R’000
Planned as at the end
of the third
quarter
R’000
Expenditure
R’000
Variance
R’000
% spent on total
budget
%
1. HIV and AIDS (Community Based Care)
20,619 19,272 14,694 5,925 71%
2. Integrated Social Development Services
Grant
27,651 20,115 20,378 7,273 74%
Total 48,270 39,387 35,072 13,101 73%
6
Summary per conditional grant (approved roll over funds)
7
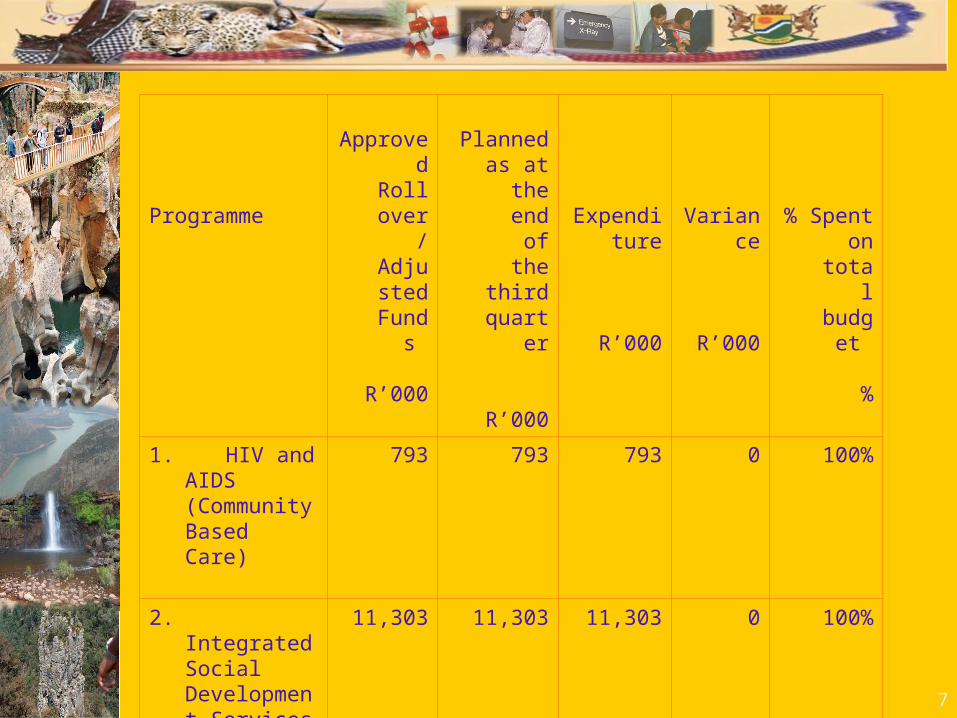
Programme
Approved Roll
over/ Adjust
ed Funds
R’000
Planned as at the
end of the third quarter
R’000
Expenditure
R’000
Variance
R’000
% Spent on total
budget
%
1. HIV and AIDS (Community Based Care)
793 793 793 0 100%
2. Integrated Social Development Services Grant
11,303 11,303 11,303 0 100%
Total 12,096 12,096 12,096 0 100%
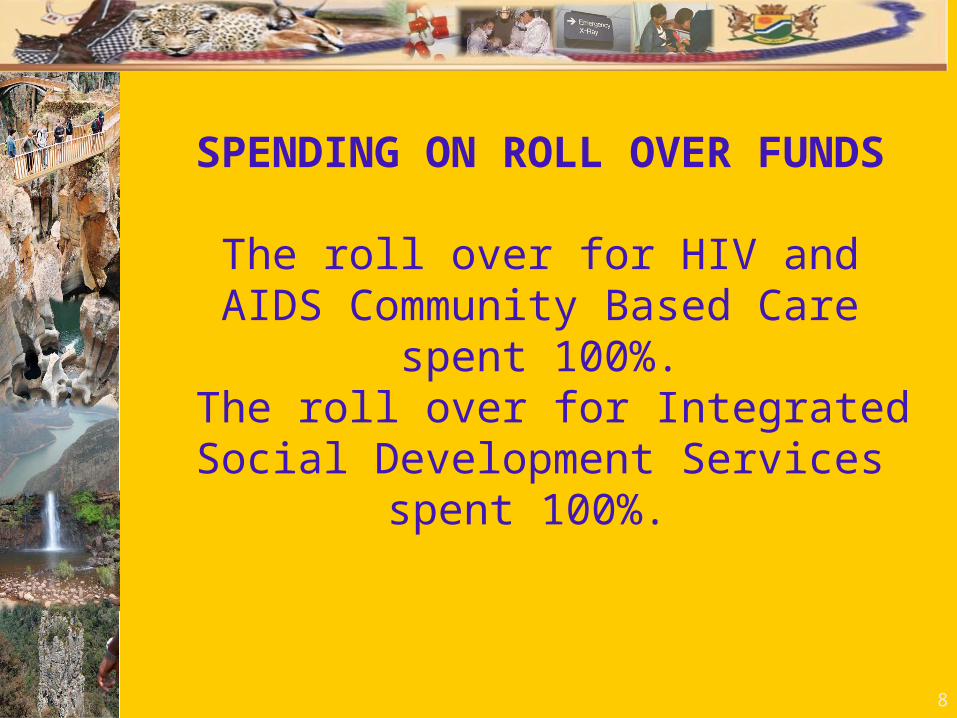
8
SPENDING ON ROLL OVER FUNDS
The roll over for HIV and AIDS Community Based Care spent 100%.
The roll over for Integrated Social Development Services spent 100%.

9
Summary per conditional grant (including current appropriated funds
and roll over)

10
Programme Current year
Budget
R’000
Approved roll over
R’000
Total Budget
R’000
Planned as at the
end of the third
quarter
R’000
Expenditure
R’000
Variance
R’000
% Spent at the end of
the third quarter
%
% Spent as at the
end of the third
quarter 2004/ 2005
%
1. HIV and AIDS (Community Based Care)
20,619 793 21,412 20,065 15,758 5,654 74% 60%
2. Integrated Social Development Services Grant
27,651 11,303 38,954 31,418 31,681 7,273 80% 14%
Total 48,270 12,096 60,366 51,483 47,479 12,927 78% 27%
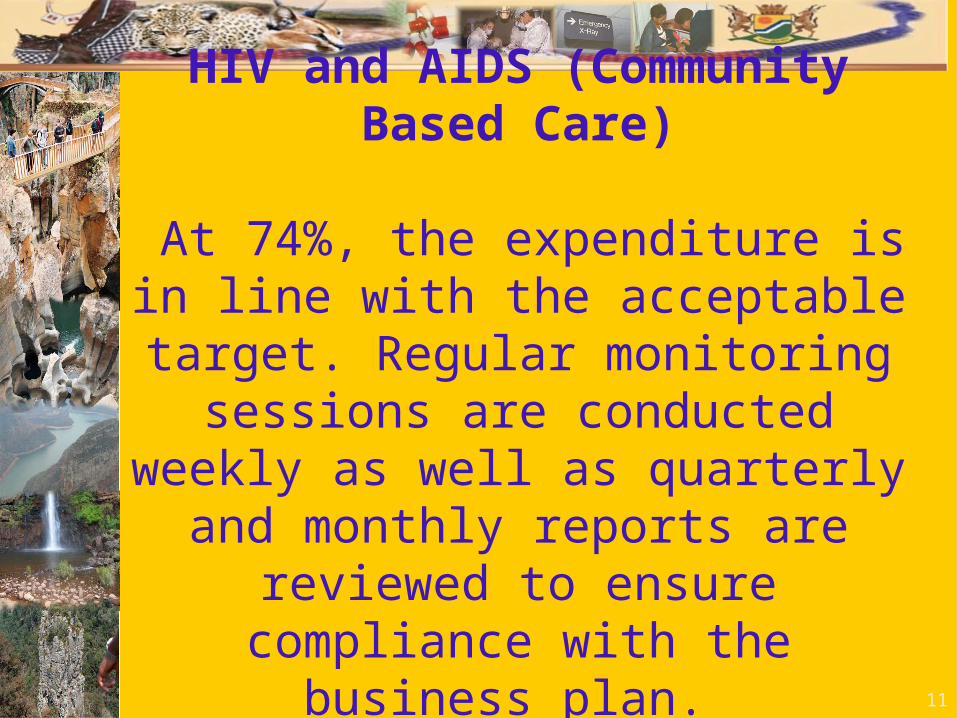
11
HIV and AIDS (Community Based Care)
At 74%, the expenditure is in line with the acceptable target. Regular monitoring
sessions are conducted weekly as well as quarterly and monthly reports are reviewed to ensure compliance with the business plan.
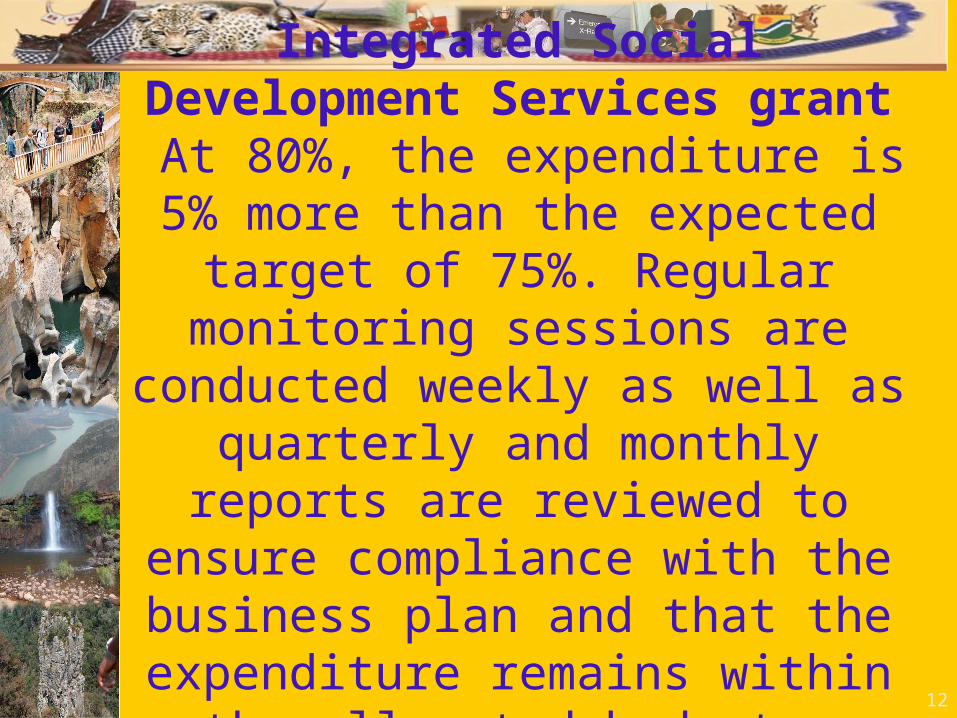
12
Integrated Social Development Services grant
At 80%, the expenditure is 5% more than the expected target of 75%. Regular monitoring sessions are conducted weekly as well as
quarterly and monthly reports are reviewed to ensure compliance with the business plan
and that the expenditure remains within the allocated budget.

13
SOCIAL SECURITYCONDITIONAL GRANTS

14
SUMMARY OF ACTUAL EXPENDITURE ON CONDITIONAL
GRANTS

15
Summary per conditional grant (actual expenditure)

16
Programme
Current yearBudget
R’000
Expenditure
R’000
Planned as at the end of
the third
quarter
R’000
Variance
R’000
% spent on total
budget
%
% spent as at the end of
the third
quarter 2004/5
%
1. Administration 246,139 123,443 80,843 122,696 50% 93%
2. Social Assistance Grants
3,531,761 2,551,964 2,624,789 979,797 72% 76%
Total 3,777,900 2,675,407 2,705,632 1,102,493 71% 77%
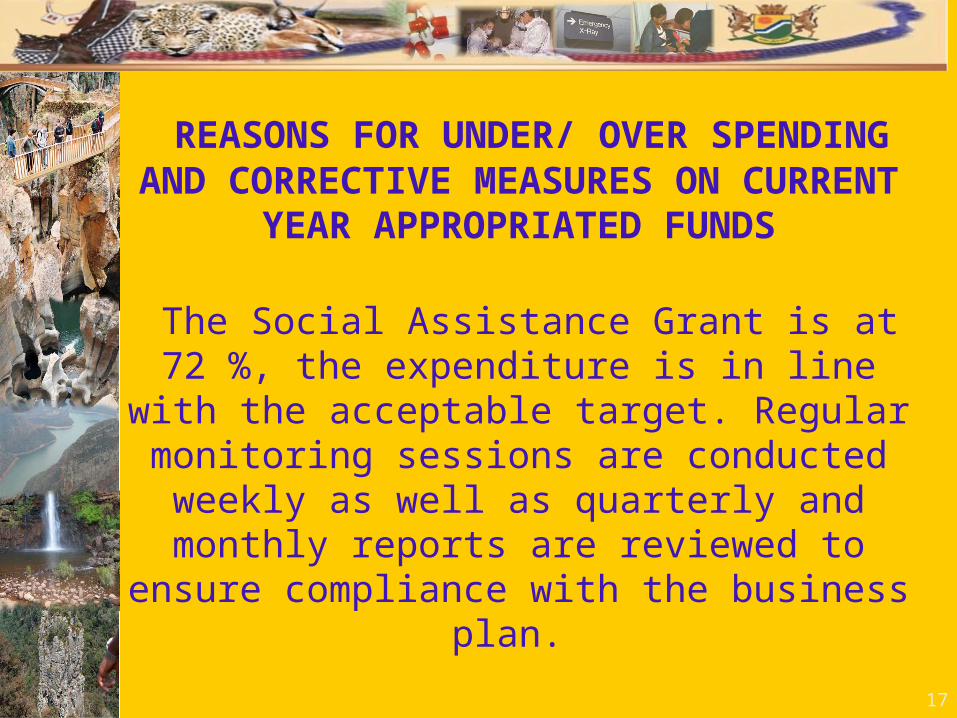
17
REASONS FOR UNDER/ OVER SPENDING AND CORRECTIVE MEASURES ON CURRENT YEAR
APPROPRIATED FUNDS
The Social Assistance Grant is at 72 %, the expenditure is in line with the acceptable target. Regular monitoring
sessions are conducted weekly as well as quarterly and monthly reports are reviewed to ensure compliance with
the business plan.
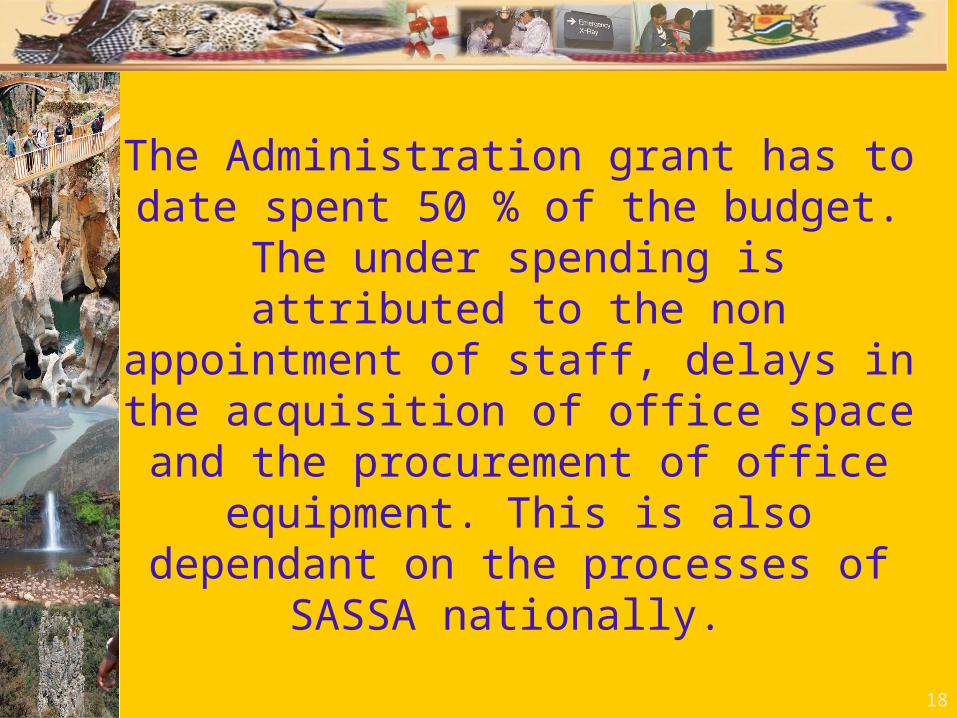
18
The Administration grant has to date spent 50 % of the budget. The under spending is attributed to the non appointment of staff, delays in the acquisition
of office space and the procurement of office equipment. This is also dependant on the
processes of SASSA nationally.

19
Social Assistance Grant
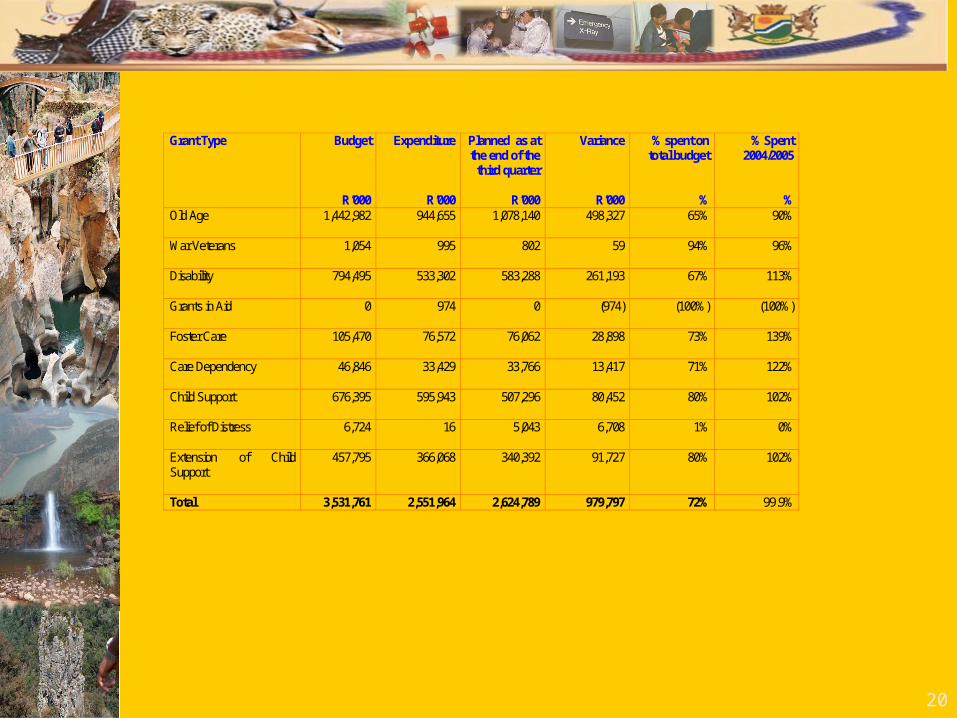
20
Grant Type Budget
R’000
Expenditure
R’000
Planned as at the end of the
third quarter
R’000
Variance
R’000
% spent on total budget
%
% Spent 2004/2005
% Old Age
1,442,982 944,655 1,078,140 498,327 65% 90%
War Veterans
1,054 995 802 59 94% 96%
Disability
794,495 533,302 583,288 261,193 67% 113%
Grants in Aid
0 974 0 (974) (100%) (100%)
Foster Care
105,470 76,572 76,062 28,898 73% 139%
Care Dependency
46,846 33,429 33,766 13,417 71% 122%
Child Support
676,395 595,943 507,296 80,452 80% 102%
Relief of Distress
6,724 16 5,043 6,708 1% 0%
Extension of Child Support
457,795 366,068 340,392 91,727 80% 102%
Total 3,531,761 2,551,964 2,624,789 979,797 72% 99.9%

21
ADDITIONAL INFORMATION
All business plans have been certified and submitted to the National Treasury for the
current financial year 2005/06 as indicated by the Division of Revenue Act.
Monthly performance reports are certified and sent to the Provincial Treasury and the
transferring National Department