1 national electricity market - aer of the energy... · 4 aer, special report: market outcomes in...
TRANSCRIPT

Mor
tlake
Pow
er S
tatio
n (O
rigin
Ene
rgy)
1 NATIONAL ELECTRICITY MARKET
STATE OF THE ENERGY MARKET 201422
The National Electricity Market (NEM) is a wholesale market in which generators sell electricity in eastern and southern Australia (table 1.1). The main customers are energy retailers, which bundle electricity with network services for sale to residential, commercial and industrial energy users. The Australian Energy Regulator (AER) plays a number of roles in the market (box 1.1).
The NEM covers six jurisdictions—Queensland, New South Wales (NSW), the Australian Capital Territory (ACT), Victoria, South Australia and Tasmania—that are physically linked by an interconnected transmission network. The NEM has around 200 large generators, five state based transmission networks (linked by cross-border interconnectors) and 13 major distribution networks that supply electricity to end use customers. In geographic span, the NEM is one of the longest continuous alternating current systems in the world, covering a distance of 4500 kms.
Table 1.1 National Electricity Market at a glance
Participating jurisdictions Qld, NSW, Vic, SA, Tas, ACT
NEM regions Qld, NSW, Vic, SA, Tas
Installed capacity 47 779 MW
Number of registered generators 322
Number of customers 9.5 million
NEM turnover 2013–14 $10.8 billion
Total energy generated 2013–14 194 TWh
National maximum winter demand 2013–14 30 114 MW1
National maximum summer demand 2013–14 33 610 MW2
MW, megawatts; TWh, terawatt hours.
1 The maximum historical winter demand of 34 422 MW occurred in 2008.
2 The maximum historical summer demand of 35 551 MW occurred in 2009.
Sources: AEMO; AER.
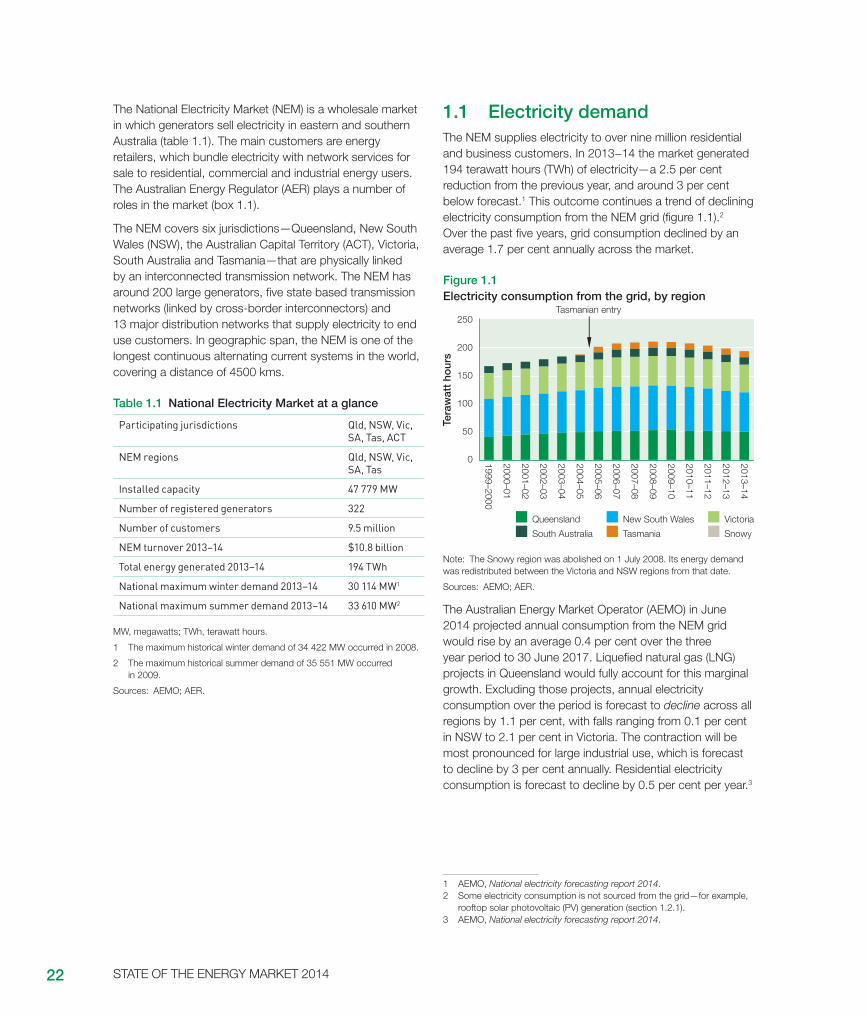
1.1 Electricity demandThe NEM supplies electricity to over nine million residential and business customers. In 2013−14 the market generated 194 terawatt hours (TWh) of electricity—a 2.5 per cent reduction from the previous year, and around 3 per cent below forecast.1 This outcome continues a trend of declining electricity consumption from the NEM grid (figure 1.1).2 Over the past five years, grid consumption declined by an average 1.7 per cent annually across the market.
Figure 1.1 Electricity consumption from the grid, by region
Victoria
SnowyTasmania South Australia
New South Wales Queensland
Tera
wat
t ho
urs
0
50
100
150
200
250
1999–2000
2000–01
2001–02
2002–03
2003–04
2004–05
2005–06
2006–07
2007–08
2008–09
2009–10
2010–11
2012–13
2011–12
Tasmanian entry
2013–14
Note: The Snowy region was abolished on 1 July 2008. Its energy demand was redistributed between the Victoria and NSW regions from that date.
Sources: AEMO; AER.
The Australian Energy Market Operator (AEMO) in June 2014 projected annual consumption from the NEM grid would rise by an average 0.4 per cent over the three year period to 30 June 2017. Liquefied natural gas (LNG) projects in Queensland would fully account for this marginal growth. Excluding those projects, annual electricity consumption over the period is forecast to decline across all regions by 1.1 per cent, with falls ranging from 0.1 per cent in NSW to 2.1 per cent in Victoria. The contraction will be most pronounced for large industrial use, which is forecast to decline by 3 per cent annually. Residential electricity consumption is forecast to decline by 0.5 per cent per year.3
1 AEMO, National electricity forecasting report 2014.2 Some electricity consumption is not sourced from the grid—for example,
rooftop solar photovoltaic (PV) generation (section 1.2.1).3 AEMO, National electricity forecasting report 2014.
23
C
HA
PT
ER
1 N
ATION
AL
ELE
CTR
ICITY
M
AR
KE
T
Electricity consumption from the grid has been declining (and will continue to decline) due to:
• commercial and residential customers more actively managing their energy use in response to price signals, including using energy efficiency measures such as solar water heating. New building regulations on energy efficiency reinforce this trend. AEMO estimated total energy savings of around 10 per cent annually over the next three years, with key contributions from more energy efficient air conditioning, refrigeration and electronics.
• subdued economic growth and weaker energy demand from the manufacturing sector. These trends reflect an ongoing decline in energy intensive industries, including the Port Henry aluminium smelter closure in Victoria in August 2014. In South Australia, the desalination plant will reduce electricity consumption once operational testing is completed in December 2014.
• the continued rise in rooftop solar photovoltaic (PV) generation, which reduces consumption of electricity sourced from the grid. In 2013–14 solar PV generation reduced grid consumption by 2.9 per cent. This growth has been driven by small scale renewable energy
4 AER, Special report: Market outcomes in South Australia during April and May 2013, July 2013. See also AER, State of the energy market 2013, pp. 42–3.
certificates and lower cost systems (section 1.2.1). AEMO projected continued strong growth in solar PV installations over the next three years (around 24 per cent annually), with the strongest growth in Queensland and Victoria.
1.1.1 Maximum demandElectricity demand fluctuates throughout the day (usually peaking in early evening) and by season (peaking in winter for heating and summer for air conditioning). Around three quarters of Australian households have air conditioning or evaporative cooling. Over the course of a year, demand typically peaks on a handful of days of extreme temperatures, when air conditioning (or heating) loads are highest.
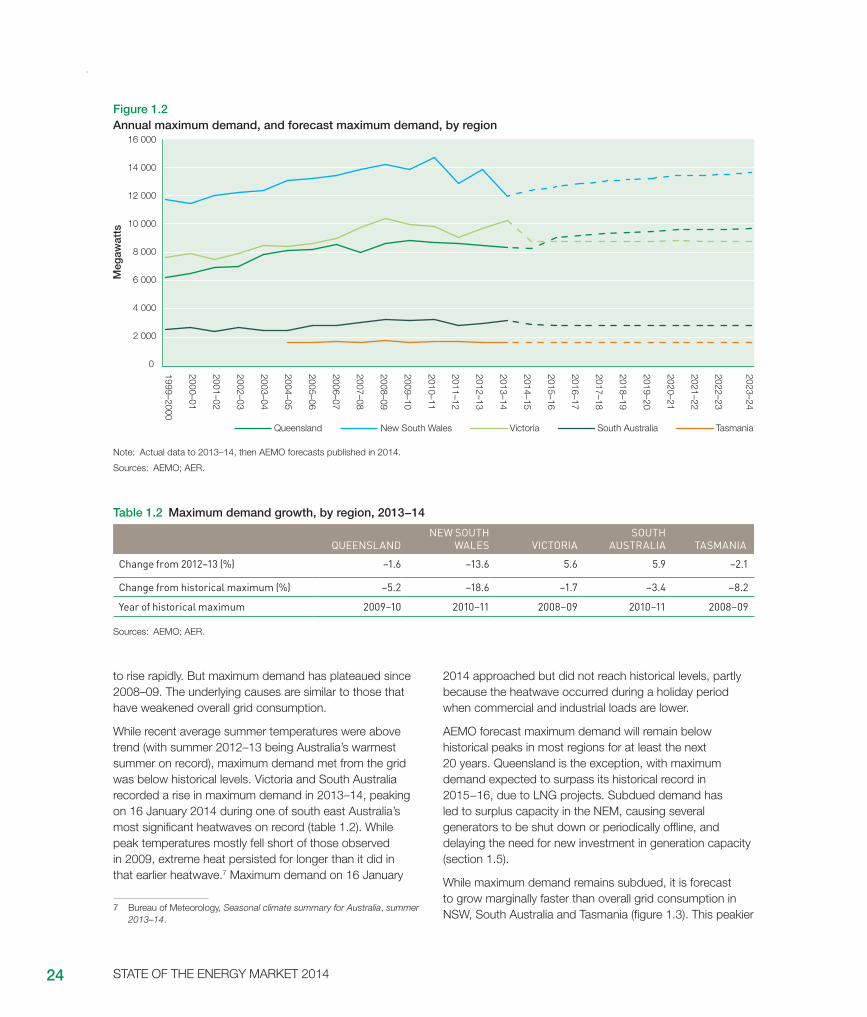
A succession of hot summers caused maximum (or peak) demand to rise steadily until 2008–09, typically at a faster rate than average demand (figure 1.2).6 The growth in maximum demand drove significant investment in energy networks to meet expectations that demand would continue
5 ‘AER takes action against Snowy Hydro Limited for alleged failure to comply with AEMO dispatch instructions’, Media release, 2 July 2014.
6 Australian Bureau of Statistics, Household energy use and conservation 2011.
Box 1.1: The AER’s role in the National Electricity MarketThe AER monitors the NEM to ensure market participants comply with the underpinning legislation and rules, and to detect irregularities and wider harm issues. We report on these issues to strengthen market transparency and confidence. In 2013–14 we published weekly reports on NEM performance, five reports on high price events (section 1.9.4), and a special report on unusual market outcomes in South Australia.4
Additionally, we draw on our monitoring activity to support compliance and enforcement work, and to advise and assist bodies including the Council of Australian Governments (CoAG) Energy Council, the Australian Energy Market Commission (AEMC) and the Australian Competition and Consumer Commission (ACCC). This compliance and enforcement work in 2013–14 included:
• advising the ACCC on energy market mergers
• assisting the ACCC to monitor energy market behaviour following the repeal of carbon pricing in July 2014 (section 1.9.3)
• investigating Snowy Hydro’s alleged failure to follow dispatch instructions from the Australian Energy Market Operator (AEMO). In July 2014, the AER instituted proceedings in the Federal Court against Snowy Hydro for alleged contraventions of the National Electricity Rules (section 1.11).5
Our wider policy work in 2013–14 included:
• proposing amendments to the rules governing the rate at which generators can be required to alter their output (section 1.11)
• developing new metrics on the impacts of rebidding, to support the South Australian Government’s proposal to amend the ‘good faith’ bidding rule (section 1.9.5)
• publishing indicators of market concentration and competitive conditions in the NEM (section 1.13).
STATE OF THE ENERGY MARKET 201424
Table 1.2 Maximum demand growth, by region, 2013−14
QUEENSLANDNEW SOUTH
WALES VICTORIASOUTH
AUSTRALIA TASMANIA
Change from 2012–13 (%) –1.6 –13.6 5.6 5.9 –2.1
Change from historical maximum (%) –5.2 –18.6 –1.7 –3.4 –8.2
Year of historical maximum 2009–10 2010–11 2008–09 2010–11 2008–09
Sources: AEMO; AER.
to rise rapidly. But maximum demand has plateaued since 2008–09. The underlying causes are similar to those that have weakened overall grid consumption.
While recent average summer temperatures were above trend (with summer 2012–13 being Australia’s warmest summer on record), maximum demand met from the grid was below historical levels. Victoria and South Australia recorded a rise in maximum demand in 2013–14, peaking on 16 January 2014 during one of south east Australia’s most significant heatwaves on record (table 1.2). While peak temperatures mostly fell short of those observed in 2009, extreme heat persisted for longer than it did in that earlier heatwave.7 Maximum demand on 16 January
7 Bureau of Meteorology, Seasonal climate summary for Australia, summer 2013–14.
2014 approached but did not reach historical levels, partly because the heatwave occurred during a holiday period when commercial and industrial loads are lower.
AEMO forecast maximum demand will remain below historical peaks in most regions for at least the next 20 years. Queensland is the exception, with maximum demand expected to surpass its historical record in 2015−16, due to LNG projects. Subdued demand has led to surplus capacity in the NEM, causing several generators to be shut down or periodically offline, and delaying the need for new investment in generation capacity (section 1.5).
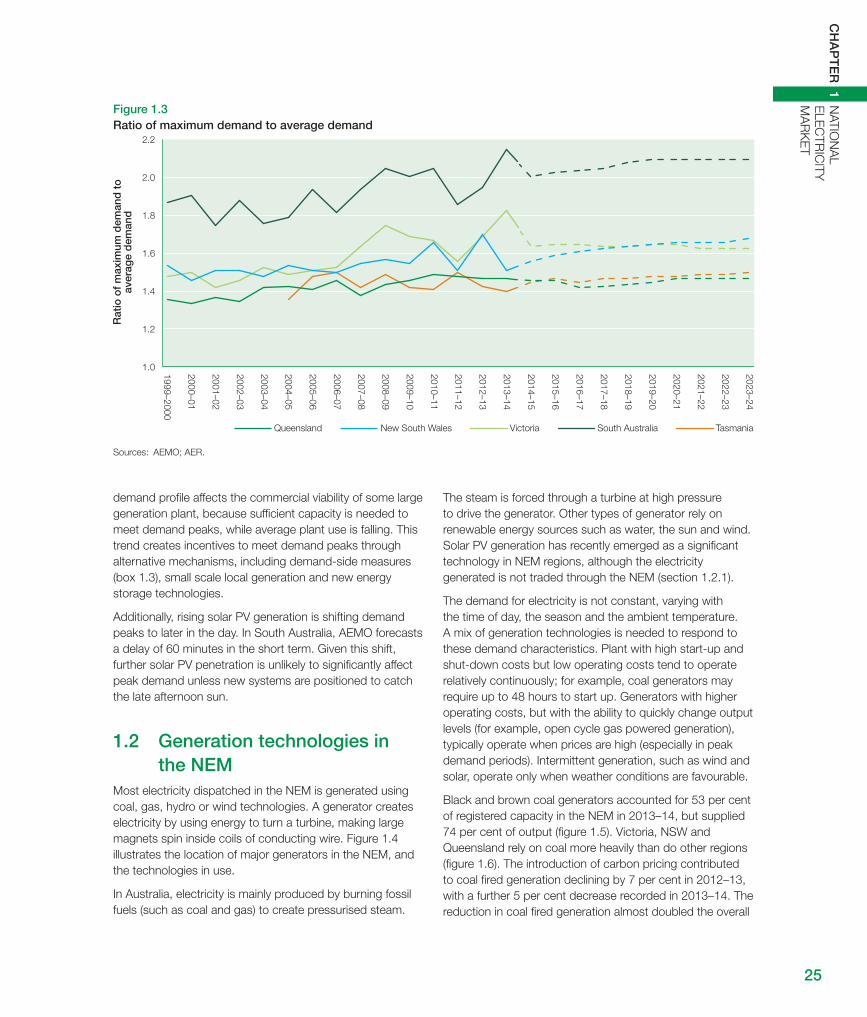
While maximum demand remains subdued, it is forecast to grow marginally faster than overall grid consumption in NSW, South Australia and Tasmania (figure 1.3). This peakier
Figure 1.2 Annual maximum demand, and forecast maximum demand, by region
Meg
awat
ts
0
2 000
4 000
6 000
8 000
10 000
12 000
14 000
16 000
TasmaniaSouth AustraliaVictoriaNew South WalesQueensland
1999–2000
2000–01
2001–02
2002–03
2003–04
2004–05
2005–06
2006–07
2007–08
2008–09
2009–10
2010–11
2011–12
2012–13
2013–14
2014–15
2015–16
2016–17
2017–18
2018–19
2019–20
2020–21
2021–22
2023–24
2022–23
Note: Actual data to 2013–14, then AEMO forecasts published in 2014.
Sources: AEMO; AER.
25
C
HA
PT
ER
1 N
ATION
AL
ELE
CTR
ICITY
M
AR
KE
T
Figure 1.3 Ratio of maximum demand to average demand
TasmaniaSouth AustraliaVictoriaNew South WalesQueensland
1999–2000
2000–01
2001–02
2002–03
2003–04
2004–05
2005–06
2006–07
2007–08
2008–09
2009–10
2010–11
2011–12
2012–13
2013–14
2014–15
2015–16
2016–17
2017–18
2018–19
2019–20
2020–21
2021–22
2023–24
2022–23
1.0
1.2
1.4
1.6
1.8
2.0
2.2
Rat
io o
f m
axim
um d
eman
d t
oav
erag
e d
eman
d
Sources: AEMO; AER.
demand profile affects the commercial viability of some large generation plant, because sufficient capacity is needed to meet demand peaks, while average plant use is falling. This trend creates incentives to meet demand peaks through alternative mechanisms, including demand-side measures (box 1.3), small scale local generation and new energy storage technologies.
Additionally, rising solar PV generation is shifting demand peaks to later in the day. In South Australia, AEMO forecasts a delay of 60 minutes in the short term. Given this shift, further solar PV penetration is unlikely to significantly affect peak demand unless new systems are positioned to catch the late afternoon sun.
1.2 Generation technologies in the NEM
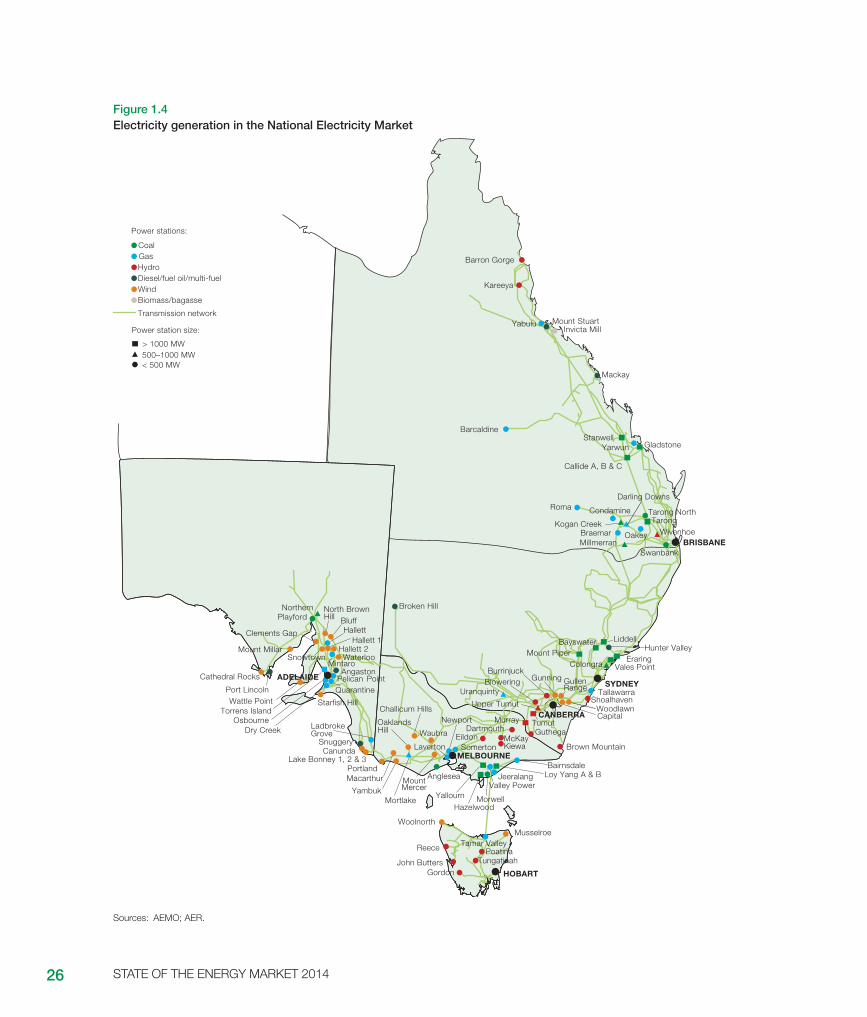
Most electricity dispatched in the NEM is generated using coal, gas, hydro or wind technologies. A generator creates electricity by using energy to turn a turbine, making large magnets spin inside coils of conducting wire. Figure 1.4 illustrates the location of major generators in the NEM, and the technologies in use.
In Australia, electricity is mainly produced by burning fossil fuels (such as coal and gas) to create pressurised steam.
The steam is forced through a turbine at high pressure to drive the generator. Other types of generator rely on renewable energy sources such as water, the sun and wind. Solar PV generation has recently emerged as a significant technology in NEM regions, although the electricity generated is not traded through the NEM (section 1.2.1).
The demand for electricity is not constant, varying with the time of day, the season and the ambient temperature. A mix of generation technologies is needed to respond to these demand characteristics. Plant with high start-up and shut-down costs but low operating costs tend to operate relatively continuously; for example, coal generators may require up to 48 hours to start up. Generators with higher operating costs, but with the ability to quickly change output levels (for example, open cycle gas powered generation), typically operate when prices are high (especially in peak demand periods). Intermittent generation, such as wind and solar, operate only when weather conditions are favourable.
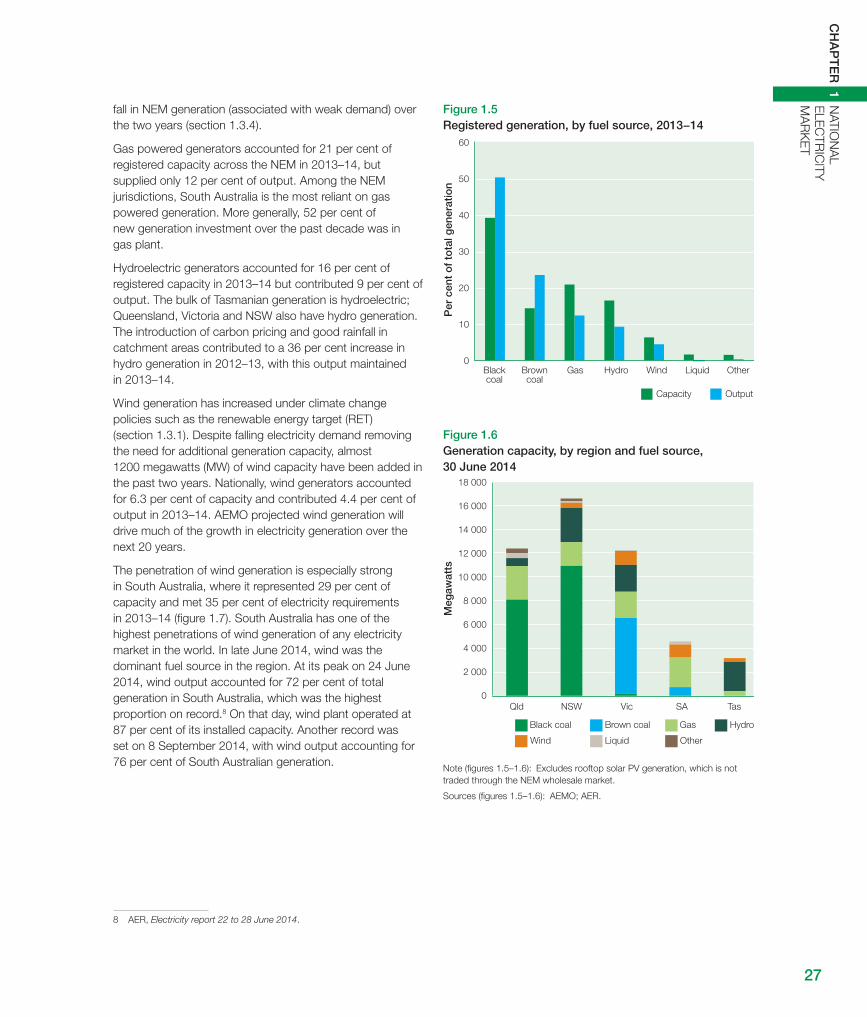
Black and brown coal generators accounted for 53 per cent of registered capacity in the NEM in 2013–14, but supplied 74 per cent of output (figure 1.5). Victoria, NSW and Queensland rely on coal more heavily than do other regions (figure 1.6). The introduction of carbon pricing contributed to coal fired generation declining by 7 per cent in 2012–13, with a further 5 per cent decrease recorded in 2013–14. The reduction in coal fired generation almost doubled the overall
STATE OF THE ENERGY MARKET 201426
Figure 1.4 Electricity generation in the National Electricity Market
Colongra
BayswaterMount Piper
Uranquinty
Broken HillPlayford
Mintaro
Clements Gap
SnowtownMount Millar
Cathedral Rocks
Osbourne
Wattle PointTorrens Island
SnuggeryCanunda
Lake Bonney 1, 2 & 3
Northern
HallettHallett 1
Hallett 2
AngastonPelican Point
Port Lincoln
Starfish Hill
LadbrokeGrove
McKay Kiewa
EildonSomerton
Challicum HillsNewport
Laverton
Anglesea
Hazelwood
Blowering
Upper Tumut
Tumut
Burrinjuck
LiddellHunter Valley
EraringVales Point
TallawarraShoalhaven
Brown Mountain
Guthega
Yallourn
Loy Yang A & BJeeralang
Morwell
Tamar ValleyPoatina
Tungatinah
GordonJohn Butters
Reece
Woolnorth
BairnsdaleMELBOURNE
ADELAIDE
HOBART
SYDNEY
CANBERRA
BRISBANE
Barron Gorge
Kareeya
BarcaldineStanwell
Roma Condamine
WivenhoeOakeyMillmerranBraemar
Kogan Creek
Callide A, B & C
Yabulu
Mackay
Gladstone
Swanbank
Tarong NorthTarong
Mount StuartInvicta Mill
MurrayDartmouthDry Creek
Darling Downs
Yarwun
Woodlawn
Gunning GullenRange
Capital
North Brown
Waterloo
Quarantine
Valley Power
Waubra
Portland
YambukMountMercer
Bluff
Mortlake
OaklandsHill
Power station size:
> 1000 MW500–1000 MW< 500 MW
Power stations:
Transmission network
CoalGasHydroDiesel/fuel oil/multi-fuelWindBiomass/bagasse
Macarthur
Hill
Musselroe
Sources: AEMO; AER.
27
C
HA
PT
ER
1 N
ATION
AL
ELE
CTR
ICITY
M
AR
KE
T
fall in NEM generation (associated with weak demand) over the two years (section 1.3.4).
Gas powered generators accounted for 21 per cent of registered capacity across the NEM in 2013–14, but supplied only 12 per cent of output. Among the NEM jurisdictions, South Australia is the most reliant on gas powered generation. More generally, 52 per cent of new generation investment over the past decade was in gas plant.
Hydroelectric generators accounted for 16 per cent of registered capacity in 2013–14 but contributed 9 per cent of output. The bulk of Tasmanian generation is hydroelectric; Queensland, Victoria and NSW also have hydro generation. The introduction of carbon pricing and good rainfall in catchment areas contributed to a 36 per cent increase in hydro generation in 2012–13, with this output maintained in 2013–14.
Wind generation has increased under climate change policies such as the renewable energy target (RET) (section 1.3.1). Despite falling electricity demand removing the need for additional generation capacity, almost 1200 megawatts (MW) of wind capacity have been added in the past two years. Nationally, wind generators accounted for 6.3 per cent of capacity and contributed 4.4 per cent of output in 2013–14. AEMO projected wind generation will drive much of the growth in electricity generation over the next 20 years.
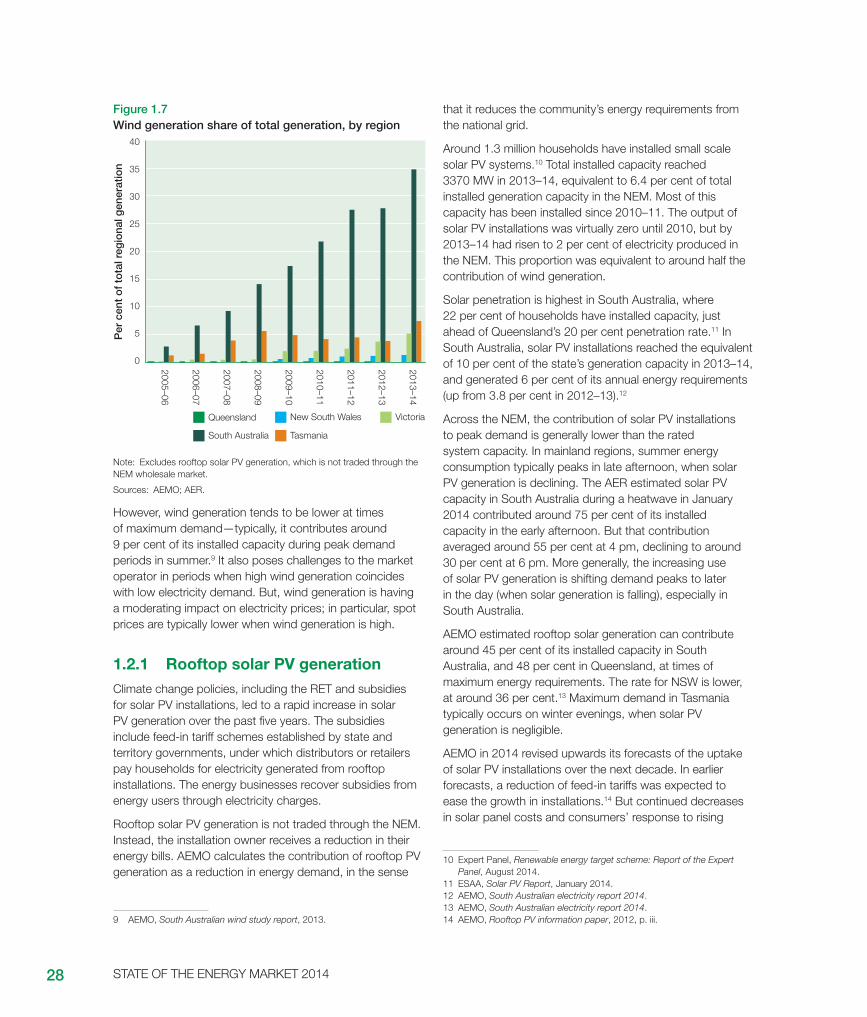
The penetration of wind generation is especially strong in South Australia, where it represented 29 per cent of capacity and met 35 per cent of electricity requirements in 2013–14 (figure 1.7). South Australia has one of the highest penetrations of wind generation of any electricity market in the world. In late June 2014, wind was the dominant fuel source in the region. At its peak on 24 June 2014, wind output accounted for 72 per cent of total generation in South Australia, which was the highest proportion on record.8 On that day, wind plant operated at 87 per cent of its installed capacity. Another record was set on 8 September 2014, with wind output accounting for 76 per cent of South Australian generation.
8 AER, Electricity report 22 to 28 June 2014.
Figure 1.5 Registered generation, by fuel source, 2013−14
Per
cen
t o
f to
tal g
ener
atio
n
0
10
20
30
40
50
60
Blackcoal
Browncoal
Gas Hydro Wind Liquid Other
Capacity Output
Figure 1.6 Generation capacity, by region and fuel source, 30 June 2014
0
2 000
4 000
6 000
8 000
10 000
12 000
14 000
16 000
18 000
Meg
awat
ts
Wind
HydroGasBrown coalBlack coal
Liquid Other
TasSAVicNSWQld
Note (figures 1.5–1.6): Excludes rooftop solar PV generation, which is not traded through the NEM wholesale market.
Sources (figures 1.5–1.6): AEMO; AER.
STATE OF THE ENERGY MARKET 201428
Figure 1.7 Wind generation share of total generation, by region
Per
cen
t o
f to
tal r
egio
nal g
ener
atio
n
0
5
10
15
20
25
30
35
40
2005–06
2006–07
2007–08
2008–09
2009–10
2010–11
2013–14
2012–13
2011–12
New South WalesQueensland Victoria
South Australia Tasmania
Note: Excludes rooftop solar PV generation, which is not traded through the NEM wholesale market.
Sources: AEMO; AER.
However, wind generation tends to be lower at times of maximum demand—typically, it contributes around 9 per cent of its installed capacity during peak demand periods in summer.9 It also poses challenges to the market operator in periods when high wind generation coincides with low electricity demand. But, wind generation is having a moderating impact on electricity prices; in particular, spot prices are typically lower when wind generation is high.
1.2.1 Rooftop solar PV generationClimate change policies, including the RET and subsidies for solar PV installations, led to a rapid increase in solar PV generation over the past five years. The subsidies include feed-in tariff schemes established by state and territory governments, under which distributors or retailers pay households for electricity generated from rooftop installations. The energy businesses recover subsidies from energy users through electricity charges.
Rooftop solar PV generation is not traded through the NEM. Instead, the installation owner receives a reduction in their energy bills. AEMO calculates the contribution of rooftop PV generation as a reduction in energy demand, in the sense
9 AEMO, South Australian wind study report, 2013.
that it reduces the community’s energy requirements from the national grid.
Around 1.3 million households have installed small scale solar PV systems.10 Total installed capacity reached 3370 MW in 2013–14, equivalent to 6.4 per cent of total installed generation capacity in the NEM. Most of this capacity has been installed since 2010–11. The output of solar PV installations was virtually zero until 2010, but by 2013–14 had risen to 2 per cent of electricity produced in the NEM. This proportion was equivalent to around half the contribution of wind generation.
Solar penetration is highest in South Australia, where 22 per cent of households have installed capacity, just ahead of Queensland’s 20 per cent penetration rate.11 In South Australia, solar PV installations reached the equivalent of 10 per cent of the state’s generation capacity in 2013–14, and generated 6 per cent of its annual energy requirements (up from 3.8 per cent in 2012–13).12
Across the NEM, the contribution of solar PV installations to peak demand is generally lower than the rated system capacity. In mainland regions, summer energy consumption typically peaks in late afternoon, when solar PV generation is declining. The AER estimated solar PV capacity in South Australia during a heatwave in January 2014 contributed around 75 per cent of its installed capacity in the early afternoon. But that contribution averaged around 55 per cent at 4 pm, declining to around 30 per cent at 6 pm. More generally, the increasing use of solar PV generation is shifting demand peaks to later in the day (when solar generation is falling), especially in South Australia.
AEMO estimated rooftop solar generation can contribute around 45 per cent of its installed capacity in South Australia, and 48 per cent in Queensland, at times of maximum energy requirements. The rate for NSW is lower, at around 36 per cent.13 Maximum demand in Tasmania typically occurs on winter evenings, when solar PV generation is negligible.
AEMO in 2014 revised upwards its forecasts of the uptake of solar PV installations over the next decade. In earlier forecasts, a reduction of feed-in tariffs was expected to ease the growth in installations.14 But continued decreases in solar panel costs and consumers’ response to rising
10 Expert Panel, Renewable energy target scheme: Report of the Expert Panel, August 2014.
11 ESAA, Solar PV Report, January 2014.12 AEMO, South Australian electricity report 2014.13 AEMO, South Australian electricity report 2014.14 AEMO, Rooftop PV information paper, 2012, p. iii.
29
C
HA
PT
ER
1 N
ATION
AL
ELE
CTR
ICITY
M
AR
KE
T
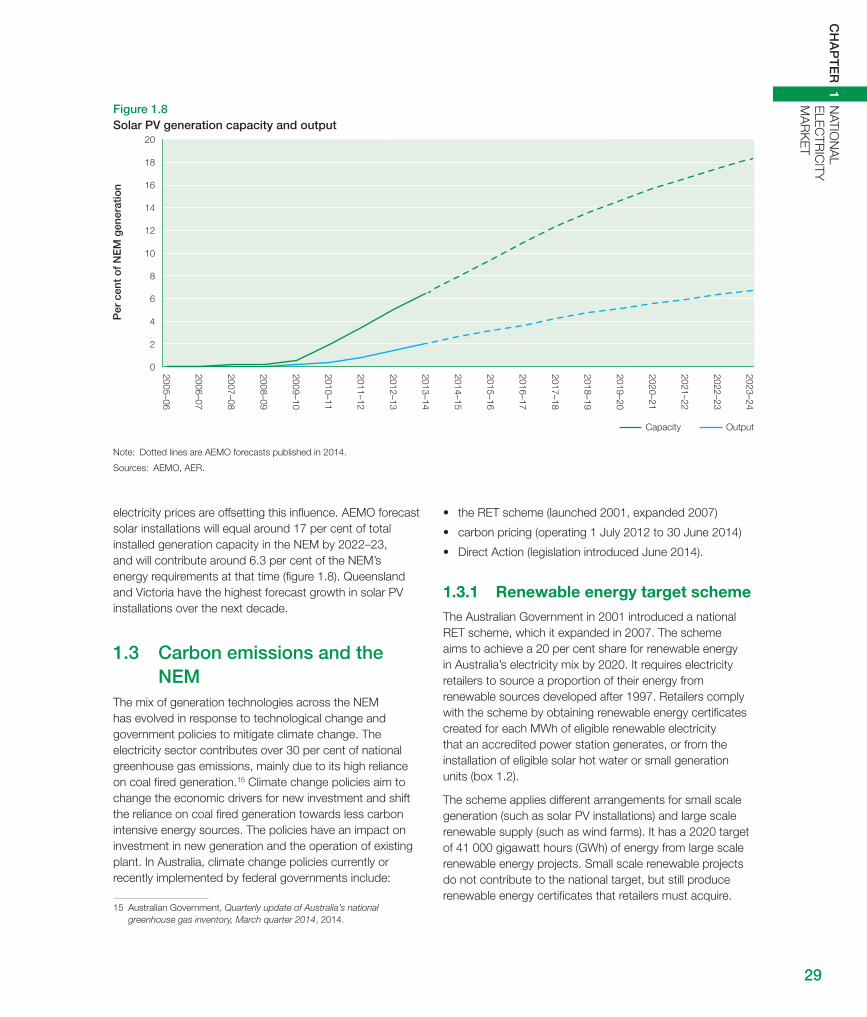
electricity prices are offsetting this influence. AEMO forecast solar installations will equal around 17 per cent of total installed generation capacity in the NEM by 2022–23, and will contribute around 6.3 per cent of the NEM’s energy requirements at that time (figure 1.8). Queensland and Victoria have the highest forecast growth in solar PV installations over the next decade.
1.3 Carbon emissions and the NEM
The mix of generation technologies across the NEM has evolved in response to technological change and government policies to mitigate climate change. The electricity sector contributes over 30 per cent of national greenhouse gas emissions, mainly due to its high reliance on coal fired generation.15 Climate change policies aim to change the economic drivers for new investment and shift the reliance on coal fired generation towards less carbon intensive energy sources. The policies have an impact on investment in new generation and the operation of existing plant. In Australia, climate change policies currently or recently implemented by federal governments include:
15 Australian Government, Quarterly update of Australia’s national greenhouse gas inventory, March quarter 2014, 2014.
• the RET scheme (launched 2001, expanded 2007)
• carbon pricing (operating 1 July 2012 to 30 June 2014)
• Direct Action (legislation introduced June 2014).
1.3.1 Renewable energy target schemeThe Australian Government in 2001 introduced a national RET scheme, which it expanded in 2007. The scheme aims to achieve a 20 per cent share for renewable energy in Australia’s electricity mix by 2020. It requires electricity retailers to source a proportion of their energy from renewable sources developed after 1997. Retailers comply with the scheme by obtaining renewable energy certificates created for each MWh of eligible renewable electricity that an accredited power station generates, or from the installation of eligible solar hot water or small generation units (box 1.2).
The scheme applies different arrangements for small scale generation (such as solar PV installations) and large scale renewable supply (such as wind farms). It has a 2020 target of 41 000 gigawatt hours (GWh) of energy from large scale renewable energy projects. Small scale renewable projects do not contribute to the national target, but still produce renewable energy certificates that retailers must acquire.
Figure 1.8 Solar PV generation capacity and output
Per
cen
t o
f N
EM
gen
erat
ion
OutputCapacity
2005–06
2006–07
2007–08
2008–09
2009–10
2010–11
2011–12
2012–13
2013–14
2014–15
2015–16
2016–17
2017–18
2018–19
2019–20
2020–21
2021–22
2023–24
2022–23
0
2
4
6
8
10
12
14
16
18
20
Note: Dotted lines are AEMO forecasts published in 2014.
Sources: AEMO, AER.

STATE OF THE ENERGY MARKET 201430
The Coalition Government in 2014 appointed an expert panel to review the RET. The panel’s report (the Warburton Report)16 found the RET had led to the abatement of around 20 million tonnes of carbon emissions and, if left in place, would abate a further 20 million tonnes of emissions per year from 2015 to 2030—almost 10 per cent of annual electricity sector emissions. The report also found the RET’s cumulative effect on household energy bills over 2015–30 was likely to be small.
But the report considered the RET to be an expensive emissions abatement tool that subsidises renewable generation at the expense of fossil fuel fired electricity generation. It recommended either closing the large RET scheme to new entrants or limiting any increase in the current target to 50 per cent of future demand growth. It
16 Expert Panel, Renewable energy target scheme: Report of the Expert Panel, August 2014.
also recommended closing, or accelerating the phase-out, of the small scale scheme. In November 2014 the Australian Government was negotiating a policy response.
1.3.2 Carbon pricingA carbon pricing scheme operated in Australia between 1 July 2012 and 1 July 2014. The Coalition Government abolished carbon pricing in Australia, effective from 1 July 2014, under legislation passed by the Senate on 17 July 2014.
The Labor Government had introduced a price on carbon in 2012 as part of its Clean Energy Future Plan. The plan targeted a reduction in carbon and other greenhouse emissions to at least 5 per cent below 2000 levels by 2020 (and a reduction of up to 25 per cent with equivalent international action). The central mechanism placed a fixed price on carbon for three years, starting at $23 per tonne
Box 1.2 Renewable energy target—certificate pricesFigure 1.9 illustrates the prices of certificates issued under each component of the RET scheme. A certificate represents one MWh of output from qualifying renewable generators (or deemed output from small scale generation). Qualifying generators in the NEM receive both the certificate price and the wholesale spot price for electricity.
Since the 2011 revisions to the RET scheme, certificates from large scale projects have traded at around $30−40. The price of certificates from small scale projects has been more volatile, trading between $20−40. Some price movements reflect scheme changes and market uncertainty about possible changes.
Figure 1.9 RET Certificate prices
Small scale technology certificatesLarge scale generation certificates
$ p
er m
egaw
att
hour
0
10
20
30
40
50
60
Jan 2009
Apr 2009
Jul 2009
Oct 2009
Jan 2010
Apr 2010
Jul 2010
Oct 2010
Jan 2011
Apr 2011
Jul 2011
Oct 2011
Jan 2012
Apr 2012
Jul 2012
Oct 2012
Jan 2013
Apr 2013
Jul 2013
Oct 2013
Jan 2014
Apr 2014
Jul 2014
Oct 2014
Source: Clean Energy Regulator.

31
C
HA
PT
ER
1 N
ATION
AL
ELE
CTR
ICITY
M
AR
KE
T
of carbon dioxide equivalent emitted. An emissions trading scheme was to replace the fixed price in July 2015 (later brought forward to July 2014), whereby the market would determine a carbon price.
1.3.3 Direct ActionThe Coalition Government in 2014 passed legislation for a Direct Action plan to achieve Australia’s commitment to a 5 per cent reduction in greenhouse emissions by 2020. The scheme requires the government to pay for emissions abatement activity. Central to the plan is a $2.55 billion Emissions Reduction Fund to provide incentives for abatement activities. The fund allows businesses, local governments, community organisations and individuals to seek funding for approved emissions reduction projects. The Clean Energy Regulator will purchase emissions reductions at the lowest available cost, generally through competitive auctions. A safeguard mechanism that penalises businesses for increasing their emissions above a baseline will commence on 1 July 2015, applying to around 130 large businesses with direct emissions over 100 000 tonnes a year. The government planned to release draft legislation to implement the safeguard mechanism in early 2015.17
1.3.4 Effects of climate change policies on generation
Climate change policies have altered the composition of electricity generation in the NEM. An expansion of the RET in 2007 contributed to 2300 MW of wind capacity being added in the following six years, more than tripling existing capacity. The RET, in conjunction with attractive feed-in tariffs, also supported a rapid uptake of solar PV installations (section 1.2.1).
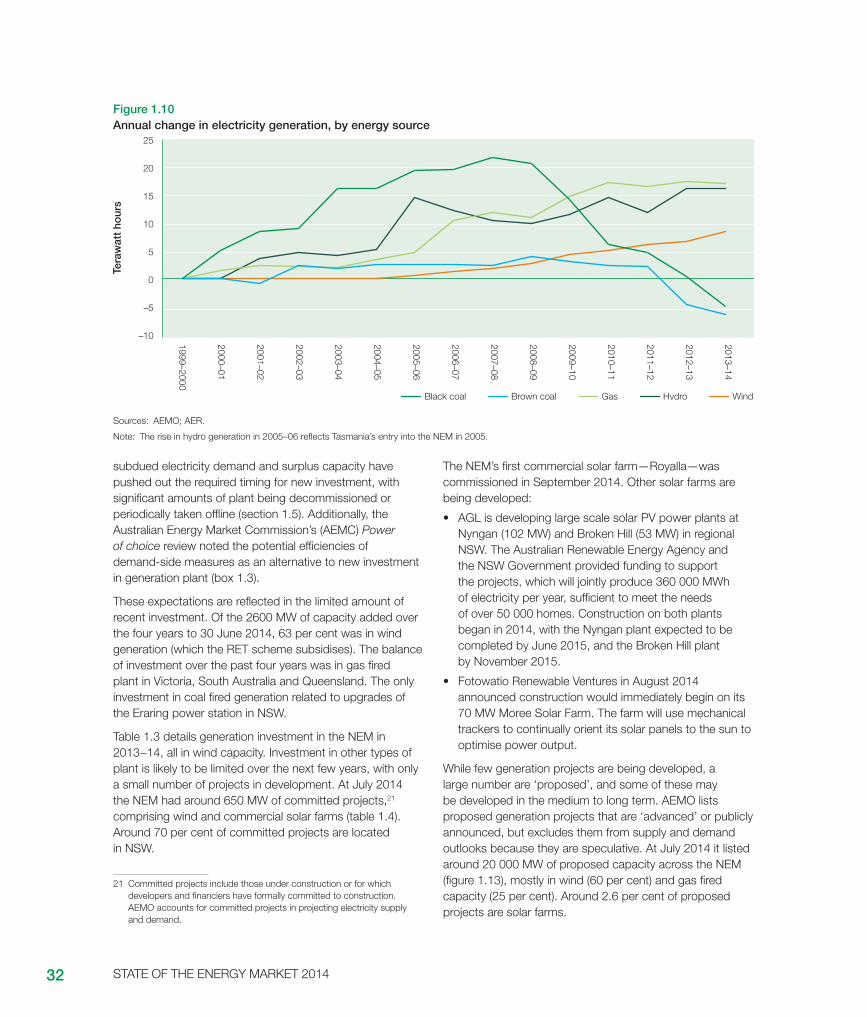
The introduction of carbon pricing in July 2012 contributed to further shifts in the mix of generation plant. Over the two years of the scheme’s operation, coal fired generation declined by 11 per cent (figure 1.10); its share of the market reached an historical low of 73.6 per cent in 2013–14. The reduction in coal generation (18 terawatt hours, TWh) almost doubled the overall fall (associated with weak demand) in NEM generation during this period (10 TWh). Over 2000 MW of coal plant was shut down or periodically taken offline during the period that carbon pricing was in place.
Some generators planned to return coal plant to service following the repeal of carbon pricing in 2014. Queensland generator Stanwell, for example, announced plans to return
17 Australian Government (Department of the Environment), The Emissions Reduction Fund: The safeguard mechanism, 2014.
700 MW of coal fired capacity to service at Tarong Power Station in 2014–15; the units had been withdrawn from service in 2012. It planned to operate the plant in place of the Swanbank E gas fired power station.18
Meanwhile, carbon pricing increased returns for hydro generation, contributing to record output levels during the two years of the scheme’s operation—output in each year was 36 per cent higher than in the year before carbon pricing. The share of gas powered generation in the energy mix also rose in the two years.
Overall, these changes in the generation mix contributed to the emissions intensity of NEM generation falling by 4.7 per cent between 2011–12 and 2013–14 (from 0.903 tonnes of carbon dioxide equivalent emissions per MWh of electricity produced in 2011–12, to 0.861 tonnes in 2013–14).19 This fall in emissions intensity, combined with lower NEM demand, led to a 10.3 per cent fall in total emissions from electricity generation over the two years that carbon pricing was in place.
Following the repeal of carbon pricing from 1 July 2014, carbon emissions from electricity generation in the NEM rose by 3.2 million tonnes in the following five months compared with the comparable period in 2013. The rise reflected both an increase in electricity demand (up 2.4 per cent) and a rise in emissions intensity (2.4 per cent higher in the year to November 2014 than in the year to June 2014) as coal fired generation increased its market share.20
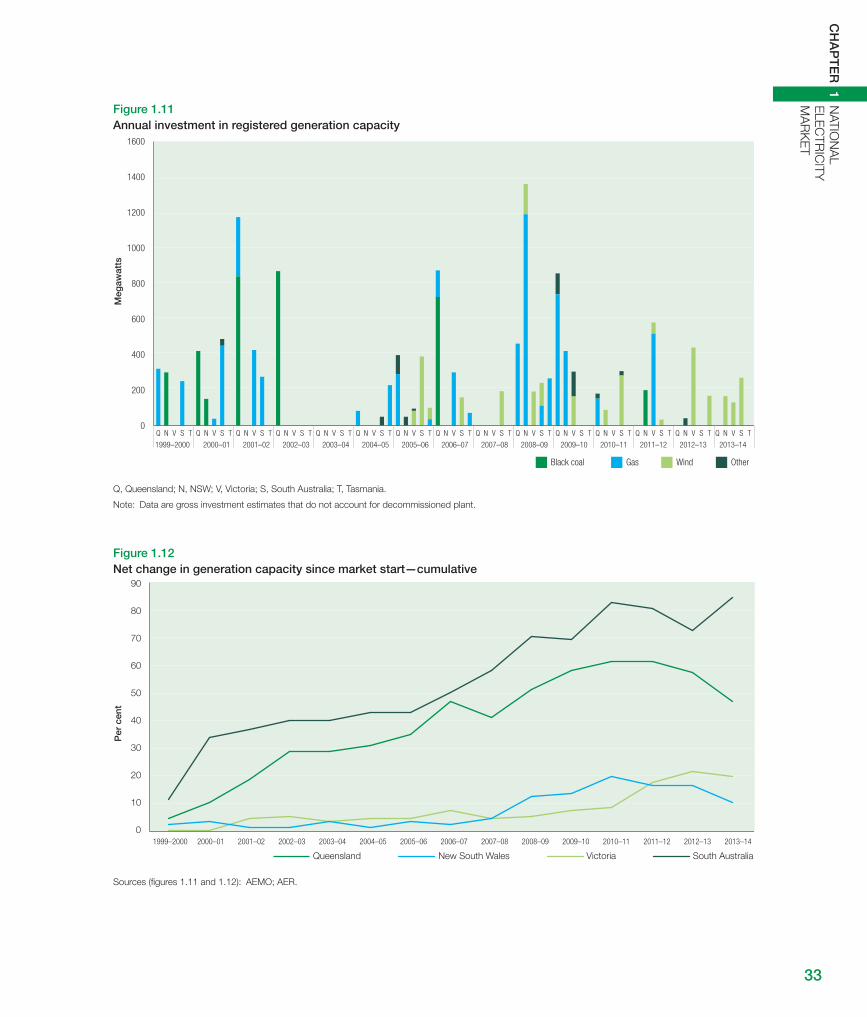
1.4 Generation investmentPrice signals in the wholesale and contract markets for electricity largely drive new investment in the NEM, with climate change policies affecting the technology mix. Between the NEM’s start in December 1998 and June 2014, new investment added over 14 400 MW of registered generation capacity—an average of around 1000 MW per year (figures 1.11 and 1.12). Additionally, significant investment has been made in generation not connected to the transmission grid, including investment in solar PV installations (section 1.2.1).
Tightening supply conditions led to an upswing in generation investment from 2008–10, with over 4000 MW of new capacity added in those years (predominantly gas fired generation in NSW and Queensland). More recently,
18 Stanwell, ‘Tarong power station to return generating units to service,’ Media release, 5 February 2014.
19 AEMO, Carbon dioxide equivalent intensity index, accessed 15 September 2014.
20 Pitt & Sherry, Cedex, December 2014.
STATE OF THE ENERGY MARKET 201432
Figure 1.10 Annual change in electricity generation, by energy source
–10
–5
0
5
10
15
20
25
Tera
wat
t ho
urs
1999–2000
2000–01
2001–02
2002–03
2003–04
2004–05
2005–06
2006–07
2007–08
2008–09
2009–10
2010–11
2011–12
2012–13
2013–14
HydroGasBrown coalBlack coal Wind
Sources: AEMO; AER.
Note: The rise in hydro generation in 2005–06 reflects Tasmania’s entry into the NEM in 2005.
subdued electricity demand and surplus capacity have pushed out the required timing for new investment, with significant amounts of plant being decommissioned or periodically taken offline (section 1.5). Additionally, the Australian Energy Market Commission’s (AEMC) Power of choice review noted the potential efficiencies of demand-side measures as an alternative to new investment in generation plant (box 1.3).
These expectations are reflected in the limited amount of recent investment. Of the 2600 MW of capacity added over the four years to 30 June 2014, 63 per cent was in wind generation (which the RET scheme subsidises). The balance of investment over the past four years was in gas fired plant in Victoria, South Australia and Queensland. The only investment in coal fired generation related to upgrades of the Eraring power station in NSW.
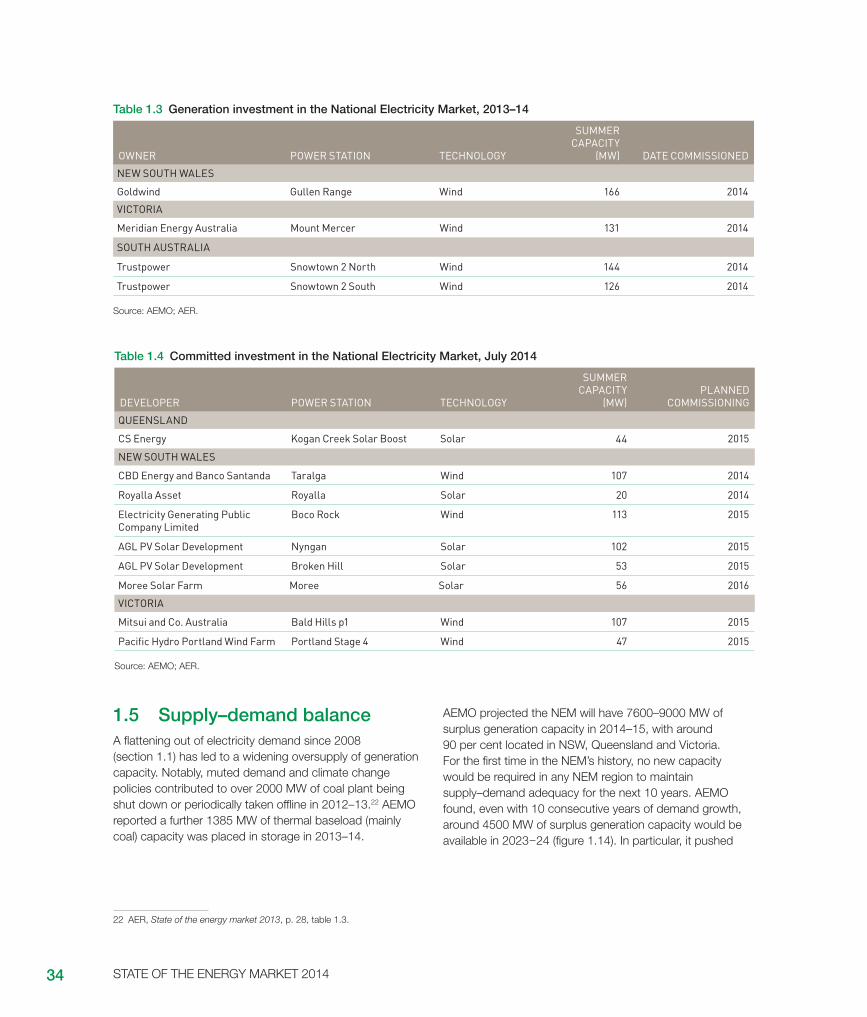
Table 1.3 details generation investment in the NEM in 2013−14, all in wind capacity. Investment in other types of plant is likely to be limited over the next few years, with only a small number of projects in development. At July 2014 the NEM had around 650 MW of committed projects,21 comprising wind and commercial solar farms (table 1.4). Around 70 per cent of committed projects are located in NSW.
21 Committed projects include those under construction or for which developers and financiers have formally committed to construction. AEMO accounts for committed projects in projecting electricity supply and demand.
The NEM’s first commercial solar farm—Royalla—was commissioned in September 2014. Other solar farms are being developed:
• AGL is developing large scale solar PV power plants at Nyngan (102 MW) and Broken Hill (53 MW) in regional NSW. The Australian Renewable Energy Agency and the NSW Government provided funding to support the projects, which will jointly produce 360 000 MWh of electricity per year, sufficient to meet the needs of over 50 000 homes. Construction on both plants began in 2014, with the Nyngan plant expected to be completed by June 2015, and the Broken Hill plant by November 2015.
• Fotowatio Renewable Ventures in August 2014 announced construction would immediately begin on its 70 MW Moree Solar Farm. The farm will use mechanical trackers to continually orient its solar panels to the sun to optimise power output.
While few generation projects are being developed, a large number are ‘proposed’, and some of these may be developed in the medium to long term. AEMO lists proposed generation projects that are ‘advanced’ or publicly announced, but excludes them from supply and demand outlooks because they are speculative. At July 2014 it listed around 20 000 MW of proposed capacity across the NEM (figure 1.13), mostly in wind (60 per cent) and gas fired capacity (25 per cent). Around 2.6 per cent of proposed projects are solar farms.
33
C
HA
PT
ER
1 N
ATION
AL
ELE
CTR
ICITY
M
AR
KE
T
Figure 1.12 Net change in generation capacity since market start—cumulative
VictoriaQueensland New South Wales South Australia
0
10
20
30
40
50
60
70
90
80
Per
cen
t
2013–142012–132011–122010–112009–102008–092007–082006–072005–062004–052003–042002–032001–022000–011999–2000
Sources (figures 1.11 and 1.12): AEMO; AER.
Figure 1.11 Annual investment in registered generation capacity
Black coal Gas Wind Other
1999–2000 2000–01 2001–02 2002–03 2003–04 2004–05 2005–06 2006–07 2007–08 2008–09 2009–10 2010–11 2011–12 2013–142012–13
0
200
400
600
800
1000
1200
1400
1600
TSVNQTSVNQTSVNQTSVNQTSVNQTSVNQTSVNQTSVNQTSVNQTSVNQTSVNQTSVNQTSVNQTSVNQTSVNQ
Meg
awat
ts
Q, Queensland; N, NSW; V, Victoria; S, South Australia; T, Tasmania.
Note: Data are gross investment estimates that do not account for decommissioned plant.
STATE OF THE ENERGY MARKET 201434
Table 1.3 Generation investment in the National Electricity Market, 2013–14
OWNER POWER STATION TECHNOLOGY
SUMMER CAPACITY
(MW) DATE COMMISSIONED
NEW SOUTH WALES
Goldwind Gullen Range Wind 166 2014
VICTORIA
Meridian Energy Australia Mount Mercer Wind 131 2014
SOUTH AUSTRALIA
Trustpower Snowtown 2 North Wind 144 2014
Trustpower Snowtown 2 South Wind 126 2014
Source: AEMO; AER.
Table 1.4 Committed investment in the National Electricity Market, July 2014
DEVELOPER POWER STATION TECHNOLOGY
SUMMER CAPACITY
(MW)PLANNED
COMMISSIONING
QUEENSLAND
CS Energy Kogan Creek Solar Boost Solar 44 2015
NEW SOUTH WALES
CBD Energy and Banco Santanda Taralga Wind 107 2014
Royalla Asset Royalla Solar 20 2014
Electricity Generating Public Company Limited
Boco Rock Wind 113 2015
AGL PV Solar Development Nyngan Solar 102 2015
AGL PV Solar Development Broken Hill Solar 53 2015
Moree Solar Farm Moree Solar 56 2016
VICTORIA
Mitsui and Co. Australia Bald Hills p1 Wind 107 2015
Pacific Hydro Portland Wind Farm Portland Stage 4 Wind 47 2015
Source: AEMO; AER.
1.5 Supply–demand balanceA flattening out of electricity demand since 2008 (section 1.1) has led to a widening oversupply of generation capacity. Notably, muted demand and climate change policies contributed to over 2000 MW of coal plant being shut down or periodically taken offline in 2012–13.22 AEMO reported a further 1385 MW of thermal baseload (mainly coal) capacity was placed in storage in 2013–14.
22 AER, State of the energy market 2013, p. 28, table 1.3.
AEMO projected the NEM will have 7600–9000 MW of surplus generation capacity in 2014–15, with around 90 per cent located in NSW, Queensland and Victoria. For the first time in the NEM’s history, no new capacity would be required in any NEM region to maintain supply–demand adequacy for the next 10 years. AEMO found, even with 10 consecutive years of demand growth, around 4500 MW of surplus generation capacity would be available in 2023−24 (figure 1.14). In particular, it pushed

35
C
HA
PT
ER
1 N
ATION
AL
ELE
CTR
ICITY
M
AR
KE
T
Figure 1.13 Major proposed generation investment, June 2014
Geothermal 0.3%
Other 2.2%Solar 2.6%
Coal 10.5%
Gas 24.6%
Wind 59.8%
Sources: AEMO; AER.
out its forecast timing of new generation requirements for Queensland by more than seven years compared with its forecasts 12 months earlier.23
Despite this trend, investment opportunities may still arise through schemes supporting renewable energy. South Australia, for example, has 16 wind farm proposals for the coming decade.24
23 AEMO, Electricity statement of opportunities 2014.24 AEMO, Energy update, August 2014.
Box 1.3 Demand response mechanismAn alternative to generation investment is demand response, whereby energy users are incentivised to reduce consumption at times of peak demand. Customer participation in the NEM spot market is currently limited and available mainly to large customers. AEMO estimated around 206 MW of capacity would likely be available through demand-side participation across the NEM during summer 2014−15 when the spot price is above $1000 per MWh. Around 880 MW would be available when the spot price hits the cap. Forty per cent of the identified capacity was in Victoria.
The AEMC’s Power of choice review recommended allowing consumers to participate directly or via their agents in the spot market, and to receive payment from the market for reducing their electricity use on days of very high demand. Payments would be based on a consumer’s
reductions in demand against a predetermined baseline for that customer. The reforms are part of a suite of measures aimed at reducing costly investment in energy networks (section 2.6).
The CoAG Energy Council in 2013 directed AEMO to develop the necessary rule change proposals, including a method for determining baseline consumption. The new mechanism would enable energy service companies to compete with retailers in offering financial incentives for customers to reduce demand when spot prices are high. But in December 2013 the CoAG Energy Council noted ongoing weakness in electricity demand had reduced the need for new investment and, therefore, may mitigate some benefits of a demand response mechanism. In 2014 it commenced a cost–benefit study of the mechanism.
1.6 Market structure of the generation sector
While the NEM operates as a single market, the pattern of generation ownership varies across regions and includes pockets of high concentration. Additionally, the trend of vertical integration among electricity generators, energy retailers and gas producers continues.
1.6.1 Generation ownershipTable 1.5 provides details of generators in the NEM, including the entities that control dispatch. Figure 1.4 identifies the location of each plant. The ownership arrangements in electricity generation vary markedly across regions. Private businesses own most generation capacity in Victoria, NSW and South Australia, while government owned corporations own or control the majority of capacity in Queensland and Tasmania.
Figure 1.15 illustrates generation market shares based on summer capacity under each firm’s trading control in 2014. It includes import capacity from interconnectors, which provide some competitive constraint on regional generators in NSW, Victoria and South Australia (equivalent to 8–10 per cent of regional capacity). The constraint is less effective in Queensland, where import flows average less than 200 MW at times of high Queensland prices—equivalent to less than 2 per cent of regional capacity.

STATE OF THE ENERGY MARKET 201436
Regional analysis
In Queensland, state owned corporations Stanwell and CS Energy control 66 per cent of generation capacity, including power purchase agreements over privately owned capacity (such as the Gladstone power station). The degree of market concentration increased in 2011, when the Queensland Government dissolved the state owned Tarong Energy and reallocated its capacity to the remaining two state owned entities.
The Queensland Government in October 2014 announced policy under its Strong Choices plan to lease government owned electricity assets for 50 years, with options to extend for a further 49 years. The assets include state owned generators Stanwell and CS Energy, as well as transmission and distribution networks.
Currently, the largest private generators in Queensland are InterGen (10 per cent of statewide capacity) and Origin Energy (8 per cent).
In NSW, the privatisation of state owned generation businesses continued in 2014. The NSW Government in 2011 sold the electricity trading (gentrader) rights to around one-third of state owned capacity to EnergyAustralia (Delta West) and Origin Energy (Eraring Energy). The businesses acquired the plant underlying those contracts in August 2013.
A second round of privatisations began in late 2013, with Macquarie Generation and Delta Coastal portfolios offered for sale. AGL Energy acquired Macquarie Generation in September 2014. The ACCC opposed the sale, but its decision was overturned by the Australian Competition Tribunal, which found the public benefits of the acquisition outweighed any detriment to competition. In December 2014, Snowy Hydro acquired Delta Electricity’s Colongra plant.
Following the sales, private entities control over 65 per cent of capacity available to NSW. They include AGL Energy (27 per cent), Origin Energy (21 per cent)
Figure 1.14 Surplus generation capacity
TasmaniaSouth AustraliaVictoriaNew South WalesQueensland
Meg
awat
ts
2023–242022–232021–222020–212019–202018–192017–182016–172015–162014–152013–142012–132011–122010–112009–102008–09–1000
–500
0
500
1000
1500
2000
2500
3000
3500
4000
Notes:
Historical data to 2013–14 reflect surplus of generation capacity (based on summer ratings) over maximum demand. AEMO forecasts beyond 2013–14 reflect capacity that could be removed while still meeting the reliability standard.
Forecast data based on a medium growth scenario with a 50 per cent probability that the forecast will be exceeded.
Wind contribution to capacity to 2013–14 based on summer ratings for semi-scheduled plant and registered capacity for non-scheduled plant. AEMO forecasts of wind capacity based on modeled contribution at times of peak demand.
Sources: AEMO, AER.

37
C
HA
PT
ER
1 N
ATION
AL
ELE
CTR
ICITY
M
AR
KE
T
and EnergyAustralia (16 per cent). Snowy Hydro’s market share rose from 14 to 18 per cent.25 The state owned Delta Electricity retained 7 per cent.
In Victoria, three private entities are the major players: AGL Energy (28 per cent of capacity), GDF Suez (21 per cent) and EnergyAustralia (18 per cent). Origin Energy has a 4 per cent share. The government owned Snowy Hydro has a 17 per cent market share.
In South Australia, AGL Energy is the dominant generator, with 34 per cent of capacity. Other significant entities are GDF Suez (17 per cent), Alinta (16 per cent), Origin Energy
25 The NSW, Victorian and Australian governments jointly own Snowy Hydro.
(10 per cent), EnergyAustralia (7 per cent) and Infigen (4 per cent). Snowy Hydro has around 130 MW of non-scheduled generation capacity following its acquisition of Lumo Energy from Infratil Energy in September 2014.
In Tasmania, the state owned Hydro Tasmania owns nearly all generation capacity, following a transfer of assets from Aurora Energy in June 2013. To encourage new entry into the retail market, the Office of the Tasmanian Economic Regulator regulates the price at which Hydro Tasmania can offer four safety net contract products, and it ensures adequate volumes of these products are available.
Figure 1.15 Market shares in generation capacity, 2014
0
4 000
8 000
12 000
16 000
20 000
Hydro Tasmania, 100%
New South Wales
AGL Energy, 27%
Interconnectors, 10%
Delta Electricity, 7%
Snowy Hydro, 18%
EnergyAustralia, 16%
Origin Energy, 21%
Victoria
Interconnectors, 8%
Origin Energy, 4%
Snowy Hydro, 17%
EnergyAustralia, 18%
GDF Suez, 21%
AGL Energy, 28%
South Australia
Interconnectors, 10%
Origin Energy, 10% EnergyAustralia, 7%
Alinta Energy, 16%
GDF Suez, 17%
AGL Energy, 34%
Meg
awat
ts
Queensland
Alinta Energy, 4% Arrow Energy, 4% AGL Energy, 4%
Origin Energy, 8%
Intergen, 10%
CS Energy, 34%
Stanwell, 32%
Tasmania
Notes:
Capacity based on summer availability for January 2014, except wind, which is adjusted for an average contribution factor.
Interconnector capacity is based on observed flows when the price differential between regions exceeds $10 per MWh in favour of the importing region; the data exclude trading intervals in which counter-flows were observed (that is, when electricity was imported from a high priced region into a lower priced region).
Capacity that is subject to power purchase agreements is attributed to the party with control over output.
Source: AER.

STATE OF THE ENERGY MARKET 201438
Table 1.5 Generation capacity and ownership, 2014
TRADING RIGHTS POWER STATIONSCAPACITY
(MW) OWNERQUEENSLAND (11 738 MW) Stanwell Corporation Stanwell; Tarong; Tarong North; Barron
Gorge; Kareeya; Mackay3151 Stanwell Corporation (Qld Government)
CS Energy Callide; Kogan Creek; Wivenhoe 1980 CS Energy (Qld Government)CS Energy Gladstone 1680 Rio Tinto 42.1%; NRG Energy 37.5%; others 20.4%Origin Energy Darling Downs; Mt Stuart; Roma 1018 Origin EnergyCS Energy / InterGen Callide C 900 CS Energy (Qld Government) 50%; InterGen 50%InterGen Millmerran 760 InterGen (China Huaneng Group 50%; others 50%)
59%; Marubeni 30%; others 11%Arrow Energy Braemar 2 495 Arrow Energy (Shell 50%; PetroChina 50%)Alinta Energy Braemar 1 465 Alinta EnergyAGL Energy Oakey 282 ERM GroupAGL Energy / Arrow Energy Yabulu 235 RATCH AustraliaRTA Yarwun Yarwun 155 Rio Tinto AlcanBG Group Condamine 144 BG GroupCSR Pioneer Sugar Mill; Invicta Sugar Mill 118 CSREDL Projects Australia Moranbah North 63 EDL Projects AustraliaMackay Sugar Coop Racecourse Mill 48 Racecourse MillAGL Energy German Creek 45 AGL EnergyErgon Energy Barcaldine 34 Ergon Energy (Qld Government)Essential Energy Daandine 33 Arrow Energy (Shell 50%; PetroChina 50%)National Power Rocky Point 30 National Power
Unscheduled plant < 30 MW 102NEW SOUTH WALES (16 254 MW)AGL Energy Bayswater; Liddell; Hunter Valley 4764 AGL EnergyOrigin Energy Eraring; Shoalhaven; Uranquinty;
Cullerin Range; Eraring3832 Origin Energy
Snowy Hydro Tumut; Upper Tumut; Colongra; Blowering; Guthega
3288 Snowy Hydro (NSW Government 58%; Vic Government 29%; Australian Government 13%)
EnergyAustralia Mt Piper; Tallawarra 1775 EnergyAustralia (CLP Group)Delta Electricity Vales Point 1320 Delta Electricity (NSW Government)Infigen Energy Capital; Woodlawn 188 Infigen EnergyEnergyAustralia Gullen Range 166 GoldwindMarubeni Corporation Smithfield Energy Facility 162 Marubeni CorporationEDL Group Appin; Tower 96 EDL GroupCapital Dynamics Broadwater; Condong 68 Capital DynamicsEnergyAustralia Boco Rock 53 Electricity Generating Public CompanyEssential Energy Broken Hill 50 Essential Energy (NSW Government)Acciona Energy Gunning 47 Acciona EnergyEraring Energy Hume 29 Trustpower
Unscheduled plant < 30 MW 416VICTORIA (11 896 MW) AGL Energy Loy Yang A; Kiewa; Somerton; Eildon;
Clover; Dartmouth; McKay2906 AGL Energy
Snowy Hydro Murray; Laverton North; Valley Power 2153 Snowy Hydro (NSW Government 58%; Vic Government 29%; Australian Government 13%)
GDF Suez Hazelwood 1600 GDF Suez 72%; Mitsui 28%

39
C
HA
PT
ER
1 N
ATION
AL
ELE
CTR
ICITY
M
AR
KE
T
TRADING RIGHTS POWER STATIONSCAPACITY
(MW) OWNEREnergyAustralia Yallourn; Longford 1431 EnergyAustralia (CLP Group)GDF Suez Loy Yang B 965 GDF Suez 70%; Mitsui 30%EnergyAustralia Jeeralang A and B; Newport 883 Industry Funds ManagementOrigin Energy Mortlake 518 Origin EnergyAGL Energy Macarthur 315 AGL Energy 50%; Malakoff Corporation Berhad 50%Pacific Hydro Yambuk; Challicum Hills; Portland 247 Pacific HydroAcciona Energy Waubra 192 Acciona EnergyAlcoa Angelsea 157 AlcoaMeridian Energy Mount Mercer 131 Meridian EnergyHydro Tasmania Bairnsdale 70 Alinta EnergyEnergy Brix Australia Energy Brix 65 HRL Group / Energy Brix AustraliaAGL Energy Oaklands Hill 47 Challenger LifeEraring Energy Hume 29 Trustpower
Unscheduled plant < 30 MW 187SOUTH AUSTRALIA (4687 MW) AGL Energy Torrens Island 1260 AGL EnergyGDF Suez Pelican Point; Canunda; Dry Creek;
Mintaro; Port Lincoln; Snuggery 790 GDF Suez 72%; Mitsui 28%
Alinta Energy Northern 546 Alinta EnergyOrigin Energy Snowtown; Snowtown North;
Snowtown South369 Trustpower
Origin Energy Quarantine; Ladbroke Grove 254 Origin EnergyEnergyAustralia Hallet 198 EnergyAustralia (CLP Group)Infigen Energy Lake Bonney 2 and 3 182 Infigen EnergyOrigin Energy Osborne 175 ATCO 50%; Origin Energy 50%AGL Energy Hallett 2; Wattle Point 145 Energy Infrastructure TrustEnergyAustralia Waterloo 111 Palisade Investment Partners / Northleaf Capital
Partners 75%; EnergyAustralia (CLP Group) 25%Snowy Hydro Pt Stanvac; Angaston 103 Snowy Hydro AGL Energy North Brown Hill 92 Energy Infrastructure Investments (Marubeni 50%;
Osaka Gas 30%; APA Group 20%)Essential Energy Lake Bonney 1 81 Infigen EnergyAGL Energy Hallett 1 71 Palisade Investment PartnersMeridian Energy Mount Millar 70 Meridian EnergyEnergyAustralia Cathedral Rocks 66 EnergyAustralia (CLP Group) 50%; Acciona Energy
50%Pacific Hydro Clements Gap 57 Pacific HydroAGL Energy The Bluff 39 Eurus EnergyHydro Tasmania Starfish Hill 35 RATCH Australia
Unscheduled plant < 30 MW 43TASMANIA (2664 MW) Hydro Tasmania Gordon; Poatina; Reece; John Butters;
Tamar Valley; Bell Bay; others2348 Hydro Tasmania (Tas Government)
Hydro Tasmania Woolnorth; Musselroe 308 Shenhua Clean Energy 75%; Hydro Tasmania 25%Unscheduled plant < 30 MW 8
Fuel types: coal; gas; hydro; wind; diesel/fuel oil/multi-fuel; biomass/bagasse; unspecified.
Note: Capacity as published by AEMO for summer 2014–15, except for wind farms (registered capacity).
Sources: AEMO; AER.
STATE OF THE ENERGY MARKET 201440
1.6.2 Vertical integrationWhile governments structurally separated the energy supply industry in the 1990s, the trend has been for vertical re-integration of retailers and generators to form ‘gentailer’ structures. Vertical integration provides a means for generators and retailers to internally manage price risk in the spot market, reducing their need to participate in hedge (contract) markets (section 1.10). Less participation in contract markets can reduce liquidity in those markets, posing a potential barrier to entry and expansion for generators and retailers that are not vertically integrated.
Section 5.1.2 of the retail chapter details vertical integration in the NEM. In summary, three private businesses, AGL Energy, Origin Energy and EnergyAustralia:
• increased their market share in electricity generation from 15 per cent in 2009 to 46 per cent in 2014, largely through the acquisition of previously state owned generation in NSW. Over this period, Origin Energy also commissioned new power stations in Queensland and Victoria, and AGL Energy acquired full ownership of Loy Yang A in Victoria
• control 57 per cent of new thermal and hydro generation capacity commissioned in the NEM since 2009. Investment by entities that do not also retail energy has been negligible, except in wind generation
• supply over 75 per cent of energy retail customers. Origin Energy and EnergyAustralia acquired significant retail market share in NSW in 2010 following the privatisation of government owned retailers. AGL Energy acquired Australian Power & Gas (one of the largest independent retailers) in August 2013
• are expanding their interests in upstream gas production and storage.
Government owned generators are also vertically integrating. The generator Snowy Hydro owns Red Energy, and in September 2014 acquired Lumo Energy from Infratil Energy. The Tasmanian Government owns Hydro Tasmania, which is a generation business that also has a retail arm (Momentum Energy), and the stand-alone retailer Aurora Energy.
1.6.3 Potential for market powerHigh levels of market concentration and vertical integration between generators and retailers give rise to a market structure that may, in certain conditions, provide opportunities for the exercise of market power. Section 1.13 sets out metrics for analysing competitive conditions in electricity markets, and tracks recent data for the NEM.
In April 2013 the AEMC found potential for substantial market power to exist or be exercised in future in the NEM, particularly in South Australia. It recommended that Energy Ministers consider conferring on the AER powers to monitor the market for that possibility. In May 2013 the Ministers tasked officials with further work on the need for changes to the National Electricity Law, before concluding a policy position.26
1.7 How the NEM operatesGenerators in the NEM sell electricity through a wholesale spot market in which changes in the supply–demand balance determine prices. The NEM is a gross pool, meaning all electricity sales must occur through the spot market. As an energy only market, it has no payments to generators for capacity or availability. The main customers are energy retailers, which pay for the electricity used by their business and household customers.
Registered generators make bids (offers) into the market to produce particular quantities of electricity at various prices for each of the five minute dispatch periods in a day. A generation business can offer its capacity across 10 different price levels of its choosing. It must lodge offers ahead of each trading day, but can change its offers (rebid) at any time, subject to those rebids being in ‘good faith’. In rebidding, a generator may alter supply quantities at each price level, but cannot alter prices.
A range of factors, including plant technology, affect generator offers. Coal fired generators, for example, must account for the high start-up costs of their plant when submitting bids; they may offer to generate some electricity at low or negative prices to guarantee dispatch and to minimise the number of times they need to start up and shut down their plant.27 Other generation technologies, such as gas powered generators, face higher fuel costs and typically offer to supply electricity at higher prices.
Bidding may also be affected by supply issues such as plant outages or constraints in the transmission network that limit transport capabilities. Some generators have a degree of market power in particular regions and periodically offer capacity at above competitive prices, knowing capacity must be dispatched if regional demand exceeds a certain level. This behaviour most commonly occurs at times of peak demand, often accompanied by generator outages or network constraints.
26 SCER, Meeting communiqué, Brisbane, 31 May 2013.27 The price floor equals −$1000 per MWh.
41
C
HA
PT
ER
1 N
ATION
AL
ELE
CTR
ICITY
M
AR
KE
T
To determine which generators are dispatched, AEMO stacks the offer bids of all generators from the lowest to highest price offers for each five minute dispatch period. It dispatches the cheapest generator bids first, then progressively more expensive offers until enough electricity is dispatched to meet demand. The highest priced offer (the marginal offer) needed to meet demand sets the dispatch price. The wholesale spot price paid to generators is the average dispatch price over 30 minutes; all generators are paid at this price, regardless of the price that they bid (box 1.4).28
Movements in supply and demand set spot prices, which may range between −$1000 per MWh and a cap of $13 500 per MWh (raised from $13 100 per MWh on 1 July 2014). The cap is increased annually to reflect changes in the consumer price index. The AEMC assesses the cap every four years as part of its reviews of reliability standards and other market settings (section 1.12.1).
The market sets a separate spot price for each of the five NEM regions. Price separation of a region occurs when only local generation sources can meet an increase in demand—that is, network constraints prevent a neighbouring region from supplying additional electricity across a transmission interconnector. At other times, prices effectively align across regions, differing only marginally to account for physical
28 Some generators bypass this central dispatch process, including some older wind generators, those not connected to a transmission network (for example, solar rooftop installations) and those producing exclusively for their own use (such as remote mining operations).
losses in the transport of electricity over long distances. Allowing for these transmission losses, prices across the mainland regions of the NEM aligned for 83 per cent of the time in 2013–14, compared with 77 per cent in 2012−13 and 70 per cent in 2011−12.
1.8 Interregional tradeThe NEM promotes efficient generator use by allowing electricity trade across the five regions, which transmission interconnectors link (figure 1.4). Trade enhances the reliability of the power system by allowing each region to draw on a wider pool of reserves to manage generator outages. Under the current market conditions of surplus generation capacity, trade also enhances opportunities for efficient dispatch by promoting competition and allowing high cost generating regions to import electricity from lower cost regions. The technical capabilities of cross-border interconnectors set upper limits on interregional trade. At times, network congestion constrains trading levels to below nominal interconnector capabilities.
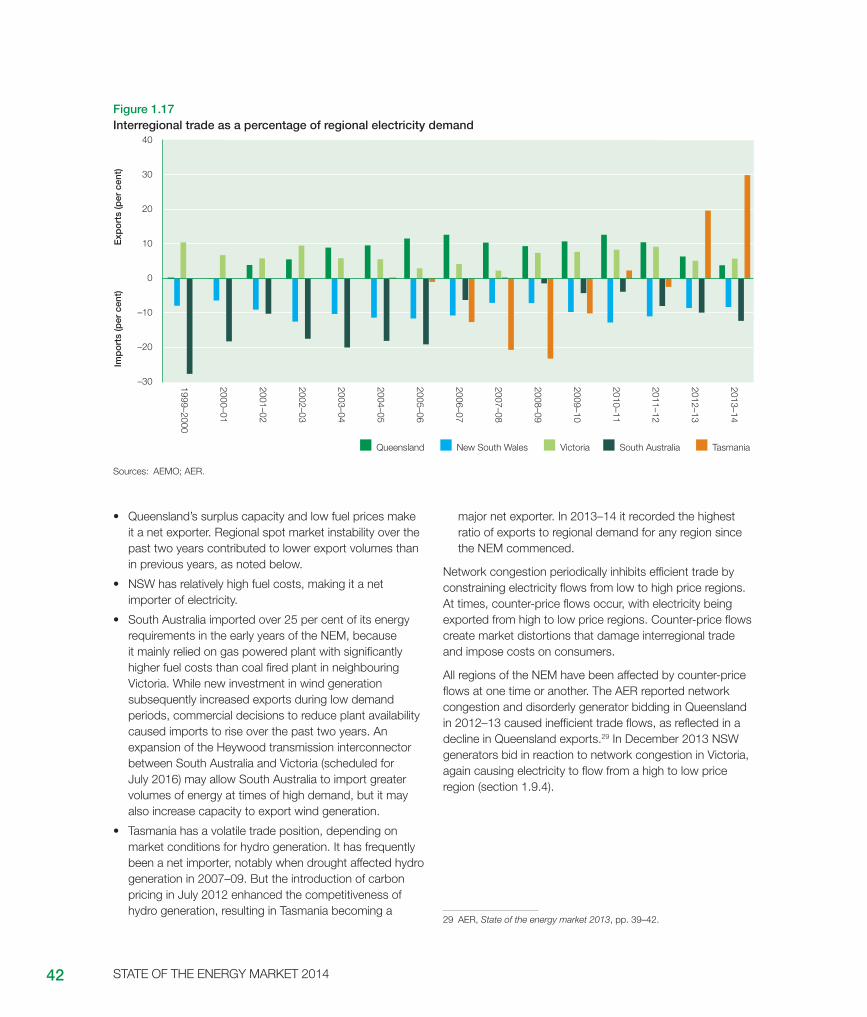
Figure 1.17 shows the net trading position of the five regions:
• Victoria has substantial low cost coal fired generation, making it a net exporter of electricity (particularly to NSW and South Australia). However, its exports to those regions in the past two years were partly offset by hydro generation imports from Tasmania.
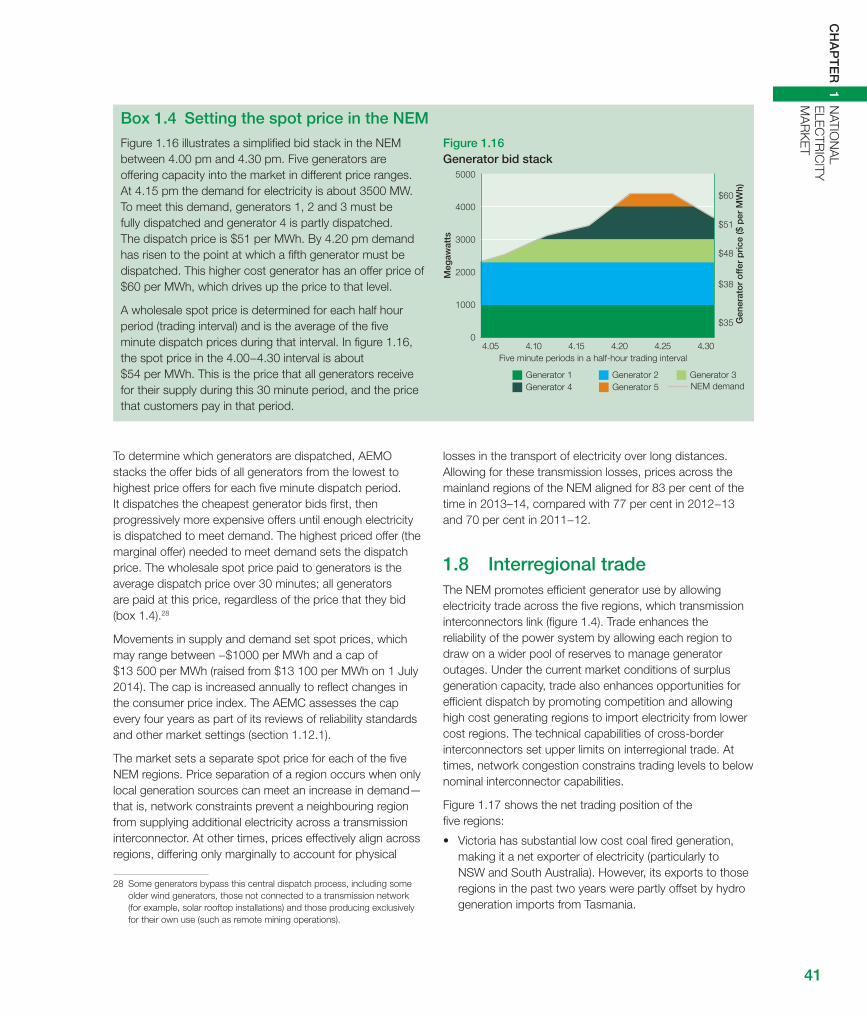
Box 1.4 Setting the spot price in the NEM
Figure 1.16 illustrates a simplified bid stack in the NEM between 4.00 pm and 4.30 pm. Five generators are offering capacity into the market in different price ranges. At 4.15 pm the demand for electricity is about 3500 MW. To meet this demand, generators 1, 2 and 3 must be fully dispatched and generator 4 is partly dispatched. The dispatch price is $51 per MWh. By 4.20 pm demand has risen to the point at which a fifth generator must be dispatched. This higher cost generator has an offer price of $60 per MWh, which drives up the price to that level.
A wholesale spot price is determined for each half hour period (trading interval) and is the average of the five minute dispatch prices during that interval. In figure 1.16, the spot price in the 4.00−4.30 interval is about $54 per MWh. This is the price that all generators receive for their supply during this 30 minute period, and the price that customers pay in that period.
Figure 1.16 Generator bid stack
Meg
awat
ts
Gen
erat
or
off
er p
rice
($ p
er M
Wh)
Five minute periods in a half-hour trading interval
0
1000
2000
3000
4000
5000
$35
$38
$48
$51
$60
4.304.254.204.154.104.05
Generator 5Generator 4Generator 3Generator 2Generator 1NEM demand
STATE OF THE ENERGY MARKET 201442
• Queensland’s surplus capacity and low fuel prices make it a net exporter. Regional spot market instability over the past two years contributed to lower export volumes than in previous years, as noted below.
• NSW has relatively high fuel costs, making it a net importer of electricity.
• South Australia imported over 25 per cent of its energy requirements in the early years of the NEM, because it mainly relied on gas powered plant with significantly higher fuel costs than coal fired plant in neighbouring Victoria. While new investment in wind generation subsequently increased exports during low demand periods, commercial decisions to reduce plant availability caused imports to rise over the past two years. An expansion of the Heywood transmission interconnector between South Australia and Victoria (scheduled for July 2016) may allow South Australia to import greater volumes of energy at times of high demand, but it may also increase capacity to export wind generation.
• Tasmania has a volatile trade position, depending on market conditions for hydro generation. It has frequently been a net importer, notably when drought affected hydro generation in 2007–09. But the introduction of carbon pricing in July 2012 enhanced the competitiveness of hydro generation, resulting in Tasmania becoming a
major net exporter. In 2013–14 it recorded the highest ratio of exports to regional demand for any region since the NEM commenced.
Network congestion periodically inhibits efficient trade by constraining electricity flows from low to high price regions. At times, counter-price flows occur, with electricity being exported from high to low price regions. Counter-price flows create market distortions that damage interregional trade and impose costs on consumers.
All regions of the NEM have been affected by counter-price flows at one time or another. The AER reported network congestion and disorderly generator bidding in Queensland in 2012–13 caused inefficient trade flows, as reflected in a decline in Queensland exports.29 In December 2013 NSW generators bid in reaction to network congestion in Victoria, again causing electricity to flow from a high to low price region (section 1.9.4).
29 AER, State of the energy market 2013, pp. 39–42.
Figure 1.17 Interregional trade as a percentage of regional electricity demand
Imp
ort
s (p
er c
ent)
Exp
ort
s (p
er c
ent)
–30
–20
–10
0
10
20
30
40
Victoria Tasmania South Australia New South Wales Queensland
1999–2000
2000–01
2001–02
2002–03
2003–04
2004–05
2005–06
2006–07
2007–08
2008–09
2009–10
2010–11
2011–12
2012–13
2013–14
Sources: AEMO; AER.

43
C
HA
PT
ER
1 N
ATION
AL
ELE
CTR
ICITY
M
AR
KE
T
Figure 1.18 Annual spot electricity prices
Tasmania SnowySouth AustraliaVictoriaNew South WalesQueensland
$ p
er m
egaw
att
hour
0
20
40
60
80
100
120
1999–2000
2000–01
2001–02
2002–03
2003–04
2004–05
2005–06
2006–07
2007–08
2008–09
2009–10
2010–11
2012–13
2011–12
2013–14
Notes:
Volume weighted average prices.
Tasmania entered the market on 29 May 2005. The Snowy region was abolished on 1 July 2008.
Sources: AEMO; AER.
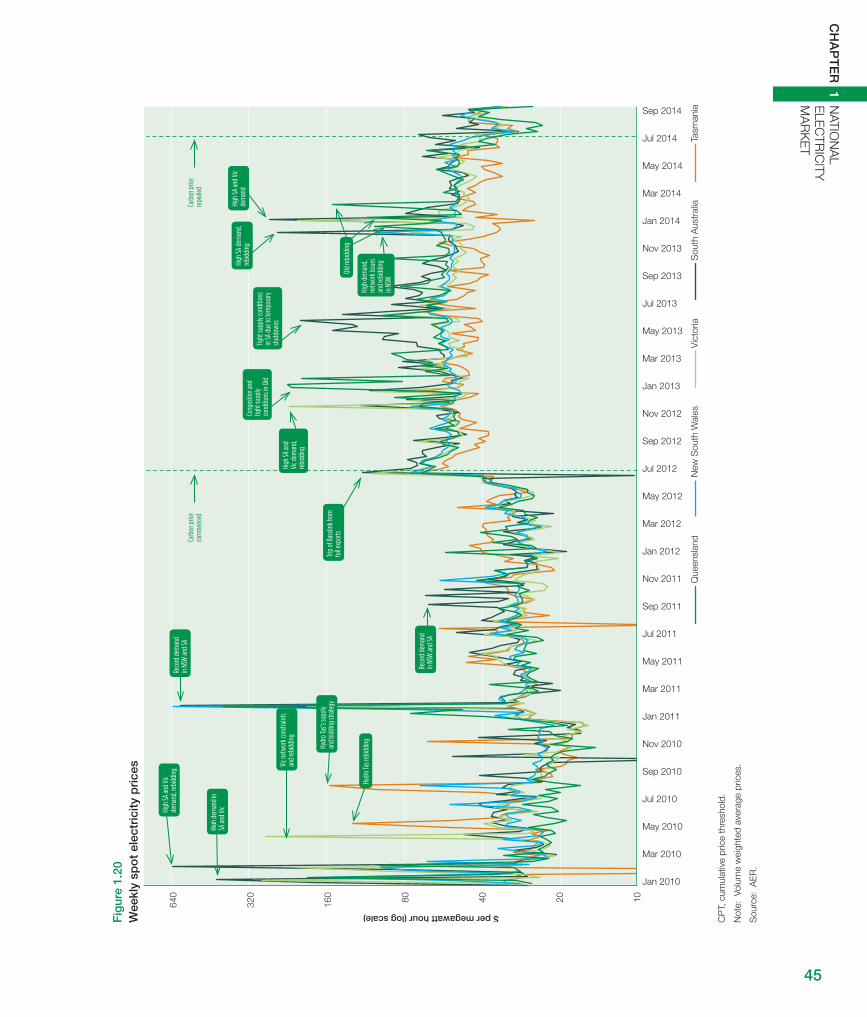
1.9 Electricity spot pricesThe AER monitors the spot market and reports weekly on activity. Figure 1.18 sets out annual average spot prices, while figure 1.19 charts quarterly average prices, illustrating seasonal movements. Figure 1.20 provides a snapshot of weekly prices.
1.9.1 Historical price trendsEscalating electricity demand combined with drought to cause electricity prices to peak across most regions during 2006−08. The AER also reported evidence of the periodic exercise of market power affecting spot prices in this period. The rising uptake of renewable generation (mostly wind) from 2009–10 coincided with energy demand plateauing and then falling, causing spot prices to fall to historical lows in 2011−12 (figure 1.18).
The introduction of carbon pricing on 1 July 2012 at $23 per tonne of emissions caused a reversal in this trend. After some initial volatility, the average NEM spot price (filtered for extreme price events) in the months following the introduction of carbon pricing settled around $21 per MWh above the average price for June 2012.
While a range of factors influence wholesale spot prices—including demand, generation availability, solar production,
fuel costs and hedge contract positions—carbon costs clearly contributed to the higher spot prices. The AER estimated for 2012–13 that the average flow through to spot prices required to cover carbon costs of the marginal generator was $17.70 per MWh on the mainland, but $10 per MWh in Tasmania (reflecting that region’s high concentration of hydro generation).
But average prices for 2012–13 rose across the NEM by $31 per MWh compared with the previous year, with higher increases in South Australia and Queensland. Factors unrelated to carbon pricing contributed to these outcomes. In Queensland, transmission network congestion precipitated generator bidding patterns that caused high prices in August–October 2012 and January 2013. In South Australia, commercial decisions to reduce plant availability contributed to lower reserves at times, enabling opportunistic bidding by major generators during April–May 2013.30 The price peaks associated with these events in Queensland and South Australia are evident in figures 1.19 and 1.20.
30 AER, State of the energy market 2013, pp. 39–43.

STATE OF THE ENERGY MARKET 201444
1.9.2 The market in 2013−14Spot prices eased across all regions in 2013–14, with falls ranging from 5 per cent (NSW) to over 13 per cent (Queensland and Tasmania). On average, volume weighted prices fell across the NEM by 10 per cent compared with the previous year.
Declining electricity demand and the continued uptake of renewable generation, including large scale wind and domestic solar PV generation, contributed to these outcomes. The weakening in Queensland prices partly reflects the resolution of some network congestion (and associated opportunistic bidding) issues affecting the region in 2012–13. But market volatility over summer 2013–14 meant that annual average prices were 14 per cent higher in Queensland than NSW, after previously being lower for several years (section 1.9.5).
The constrained supply conditions and opportunistic generator bidding that affected South Australian prices during autumn 2013 did not widely recur in 2013–14, contributing to spot prices easing by 8 per cent. But, despite having the highest penetration of wind and solar generation of any region, South Australian spot prices continued to be the highest in the NEM, averaging $68 per MWh. In part, this outcome results from the region relying on relatively high cost gas powered generation, and
Figure 1.19 Quarterly spot electricity prices
TasmaniaSouth AustraliaVictoriaNew South WalesQueensland
$ p
er m
egaw
att
hour
50
100
150
200
250
0
Mar 1999
Sep 1999
Mar 2000
Sep 2000
Mar 2001
Sep 2001
Mar 2002
Sep 2002
Mar 2003
Sep 2003
Mar 2004
Sep 2004
Mar 2005
Sep 2005
Mar 2006
Sep 2006
Mar 2007
Sep 2007
Mar 2008
Sep 2008
Mar 2009
Sep 2009
Mar 2010
Sep 2010
Mar 2011
Sep 2011
Mar 2012
Sep 2012
Mar 2013
Sep 2013
Mar 2014
Sep 2014
Note: Volume weighted average prices.
Sources: AEMO; AER.
having the highest load factor (ratio of peak to average demand) of any region (section 1.1.1).
South Australia recorded the year’s highest weekly prices ($244 per MWh for the week from 15 December 2013 and $264 per MWh for the week from 12 January 2014). The December price occurred in a week with the hottest December day since 1931, and the January price occurred during one of south east Australia’s most intense heatwaves on record.31 That heatwave also caused Victorian weekly prices to average $204 per MWh in the same week (section 1.9.4).
Generator rebidding contributed to these summer price spikes, although less so than in previous years. It also affected spot prices in the week commencing 15 December 2013 in NSW (section 1.9.4).
For the second year in a row, Tasmania recorded the lowest average spot price in the NEM ($42 per MWh), reflecting high levels of hydro generation output, which incurred no carbon liability. But the region also recorded a number of negative spot prices.
31 Bureau of Meteorology, Seasonal climate summary for Australia, summer 2013–14.
45
C
HA
PT
ER
1 N
ATION
AL
ELE
CTR
ICITY
M
AR
KE
T
Fig
ure
1.20
W
eekl
y sp
ot
elec
tric
ity p
rice
s
$ per megawatt hour (log scale)
10204080160
320
640
Tasm
ania
Vic
toria
New
Sou
th W
ales
Que
ensl
and
Sou
th A
ustr
alia
Jan 2010
Mar 2010
May 2010
Jul 2010
Sep 2010
Nov 2010
Jan 2011
Mar 2011
May 2011
Jul 2011
Sep 2011
Nov 2011
Jan 2012
Mar 2012
May 2012
Jul 2012
Sep 2012
Nov 2012
Jan 2013
Mar 2013
May 2013
Jul 2013
Sep 2013
Nov 2013
Jan 2014
Mar 2014
May 2014
Jul 2014
Sep 2014
High
SA an
d Vic
dem
and,
rebid
ding
High
dem
and i
n SA
and V
ic
Vic ne
twor
k con
strain
ts an
d reb
idding
Hydr
o Tas
’s su
pply
and b
idding
stra
tegy
Reco
rd de
man
d in
NSW
and S
A
Reco
rd de
man
d in
NSW
and S
A
Trip o
f Bas
slink
from
fu
ll exp
orts
Tight
supp
ly co
nditi
ons
in SA
due t
o tem
pora
ry
shut
down
s
Cong
estio
n and
tig
ht su
pply
cond
ition
s in Q
ld
High
dem
and,
netw
ork i
ssues
an
d reb
idding
in
NSW
High
SA de
man
d, re
biddin
g
High
SA an
d Vic
dem
and
Carb
on pr
ice
com
men
ced
Carb
on pr
ice
repe
aled
Hydr
o Tas
rebid
ding
Qld r
ebidd
ing
High
SA an
d Vic
dem
and,
rebid
ding
CP
T, c
umul
ativ
e pr
ice
thre
shol
d.
Not
e: V
olum
e w
eigh
ted
aver
age
pric
es.
Sou
rce:
AE
R.

STATE OF THE ENERGY MARKET 201446
1.9.3 Repeal of carbon pricingUnder the carbon price regime operating from 1 July 2012 to 1 July 2014, generators incurred a carbon liability based on their output and the carbon intensity of their plant. Generators sought to recover the cost of this liability by factoring it into their bids in the spot market and through provisions in hedge contracts.
Following the repeal of carbon pricing on 1 July 2014, spot prices fell during the third quarter (1 July to 30 September 2014), most notably in Queensland. The monthly averages for July 2014 were the lowest since May 2012 for Queensland, and the lowest since June 2012 for NSW and Victoria. Monthly averages for August were lower again in all regions except Tasmania. Prices in September 2014 rebounded towards their July levels in most regions (table 1.6).
Overall, while prices trended downwards during the third quarter 2014, week-to-week prices were volatile (figure 1.21). Lower prices in Queensland, NSW and Victoria from June–August 2014 reflected baseload power stations bidding greater capacity into the market at lower prices. While various factors might have contributed, the repeal of carbon pricing was likely a significant influence on this bidding behaviour. The higher September prices appear to reflect tighter supply–demand conditions, particularly early in the month. But prices fell sharply from late September 2014, especially in Queensland, when a collapse in spot gas prices triggered a surge in gas powered generation and low electricity spot prices (figure 7 in Market overview).
1.9.4 Price volatility in the NEMPrice volatility has been a feature of the NEM since its commencement, although the nature of that volatility is evolving. A relatively tight supply–demand balance contributed to an escalating trend of 30 minute spot prices above $5000 per MWh for several years from 2004–05, peaking at 95 events in 2009–10. Subsequently, declining
electricity demand and the rising penetration of renewable generation caused surplus capacity in most regions, resulting in a significant reduction in such extreme prices. Only one such event occurred in 2011–12, then four events in 2012–13.
Five spot prices were above $5000 per MWh in 2013–14:
• In NSW, the spot price at 1.30 pm on 20 December 2013 was $7696 per MWh. Overall, the five minute dispatch price exceeded $5000 per MWh eight times between 1.30 pm and 2.30 pm. A key contributing factor was high temperatures (reaching 41 degrees) that drove above-forecast demand at a time when unplanned generator outages had reduced available capacity. At the same time, network congestion in Victoria triggered rebidding by Snowy Hydro to reduce output from its Victorian plant, requiring NSW to export electricity to meet demand in northern Victoria. These counter-price trade flows further tightened the supply–demand balance in NSW, driving local prices even higher.32
This event is one of many instances in recent years of generators causing counter-price electricity flows from high priced to low priced regions.
• South Australia recorded spot prices on 19 December 2013 of $10 627 per MWh at 4 pm and $5640 per MWh at 4.30 pm. The prices were not forecast. Overall, South Australia recorded 17 five minute dispatch prices above $10 000 per MWh that afternoon. High demand due to extreme heat was a key contributor—it was the third hottest December day on record. A plant outage, a lower than forecast contribution from wind and constraints limiting interconnector import flows also contributed to tight supply conditions. Rebidding by generators during the afternoon, particularly by AGL Energy and GDF Suez, was also an important factor. The generators shifted
32 AER, Electricity spot prices above $5000 per MWh, 20 December 2013: NSW.
Table 1.6 Monthly spot prices, June–September 2014 ($ per MWh)
QUEENSLAND NSW VICTORIA SOUTH AUSTRALIA TASMANIA
June 2014 52 50 50 56 43
July 2014 34 42 40 55 34
August 2014 27 37 36 44 37
September 2014 35 41 38 43 38
Note: Monthly volume weighted averages.
Sources: AEMO; AER.

47
C
HA
PT
ER
1 N
ATION
AL
ELE
CTR
ICITY
M
AR
KE
T
significant capacity from under $300 per MWh to prices at or near the cap.33
• South Australia and Victoria experienced coincident events at 4 pm on 15 January 2014, with a spot price of $6213 per MWh in South Australia and $5972 per MWh in Victoria. The prices were lower than forecast and occurred during one of south east Australia’s most intense heatwaves on record. Spare generation capacity was extremely tight on the day, with AEMO issuing warnings of possible shortages to meet demand in both regions, and the possibility of interrupting supply to maintain system security (section 1.12.2). During the 4 pm interval, an absence of capacity priced from $100–8000 per MWh meant a small change in demand, a small reduction in import capacity from Tasmania, and some generator rebidding combined to cause prices to spike. Solar PV generation helped delay these price impacts until later in the day than otherwise might have occurred, although cloudy conditions inhibited the solar contribution to some extent.34
Additionally, South Australia experienced a price event above $5000 per MW in ancillary service markets, on 1 October 2013. During the day, transmission network
33 AER, Electricity spot prices above $5000 per MWh, 19 December 2013: South Australia.
34 AER, Electricity spot prices above $5000 per MWh, 15 January 2014: South Australia and Victoria.
outages in Victoria caused a rise in exports from South Australia to Victoria, requiring intervention to manage frequency control and voltage stability. In combination, these factors increased the requirement for local frequency control services in South Australia, which could be satisfied only by high priced offers; the price for ‘lower 60 second’ services and ‘lower 6 second’ services exceeded $5000 MWh for nine consecutive five minute intervals. The spikes led to a total cost on the day of $1.6 million, compared with less than $3000 for each service on a typical day. South Australian consumers met this cost.35
While prices spike above $5000 per MWh less frequently than in the past, greater volatility in lower price bands has a cumulative effect on prices. In 2012–13 the market recorded 704 prices above $200 per MWh (for a 30 minute trading interval)—the highest for seven years (figure 1.22). More stable market conditions led a reduction to 297 events in 2013–14, with around 44 per cent of those events occurring in South Australia. Several events in South Australia and Victoria were associated with heatwave conditions during January 2014. Queensland recorded 73 prices above $200 per MWh, of which some were linked to opportunistic generator bidding behaviour (section 1.9.5).
Market volatility can also result in negative spot prices. The incidence of negative prices greater than –$100 fell
35 AER, Market ancillary service prices above $5000 per MW: 1 October 2013.
Figure 1.21 Weekly NEM spot prices, April–September 2014
TasmaniaSouth AustraliaVictoriaNew South WalesQueensland
$ p
er m
egaw
att
hour
5 Oct
28 Sep
21 Sep
14 Sep
7 Sep
31 Aug
24 Aug
17 Aug
10 Aug
3 Aug
27 Jul
20 Jul
13 Jul
6 Jul
29 Jun
22 Jun
15 Jun
8 Jun
1 Jun
25 May
18 May
11 May
4 May
27 Apr
20 Apr
13 Apr
6 Apr
0
10
20
30
40
50
60
70
80
Note: Weekly volume weighted averages.
Sources: AEMO; AER.
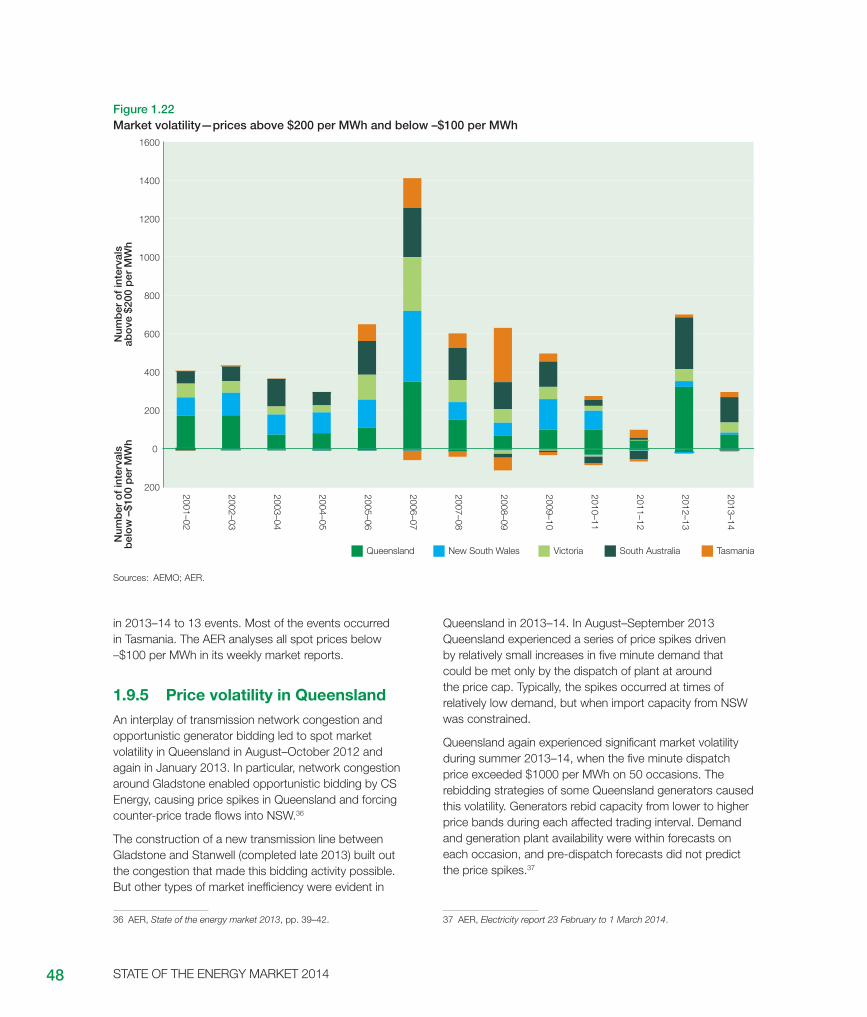
STATE OF THE ENERGY MARKET 201448
in 2013–14 to 13 events. Most of the events occurred in Tasmania. The AER analyses all spot prices below –$100 per MWh in its weekly market reports.
1.9.5 Price volatility in QueenslandAn interplay of transmission network congestion and opportunistic generator bidding led to spot market volatility in Queensland in August–October 2012 and again in January 2013. In particular, network congestion around Gladstone enabled opportunistic bidding by CS Energy, causing price spikes in Queensland and forcing counter-price trade flows into NSW.36
The construction of a new transmission line between Gladstone and Stanwell (completed late 2013) built out the congestion that made this bidding activity possible. But other types of market inefficiency were evident in
36 AER, State of the energy market 2013, pp. 39–42.
Queensland in 2013–14. In August–September 2013 Queensland experienced a series of price spikes driven by relatively small increases in five minute demand that could be met only by the dispatch of plant at around the price cap. Typically, the spikes occurred at times of relatively low demand, but when import capacity from NSW was constrained.
Queensland again experienced significant market volatility during summer 2013–14, when the five minute dispatch price exceeded $1000 per MWh on 50 occasions. The rebidding strategies of some Queensland generators caused this volatility. Generators rebid capacity from lower to higher price bands during each affected trading interval. Demand and generation plant availability were within forecasts on each occasion, and pre-dispatch forecasts did not predict the price spikes.37
37 AER, Electricity report 23 February to 1 March 2014.
Figure 1.22 Market volatility—prices above $200 per MWh and below –$100 per MWh
200
400
600
800
1000
1200
1600
1400
Num
ber
of
inte
rval
s b
elo
w –
$100
per
MW
h
200
0
Victoria South AustraliaNew South Wales TasmaniaQueensland
2001–02
2002–03
2003–04
2004–05
2005–06
2006–07
2007–08
2008–09
2009–10
2010–11
2012–13
2013–14
2011–12
Num
ber
of
inte
rval
sab
ove
$20
0 p
er M
Wh
Sources: AEMO; AER.
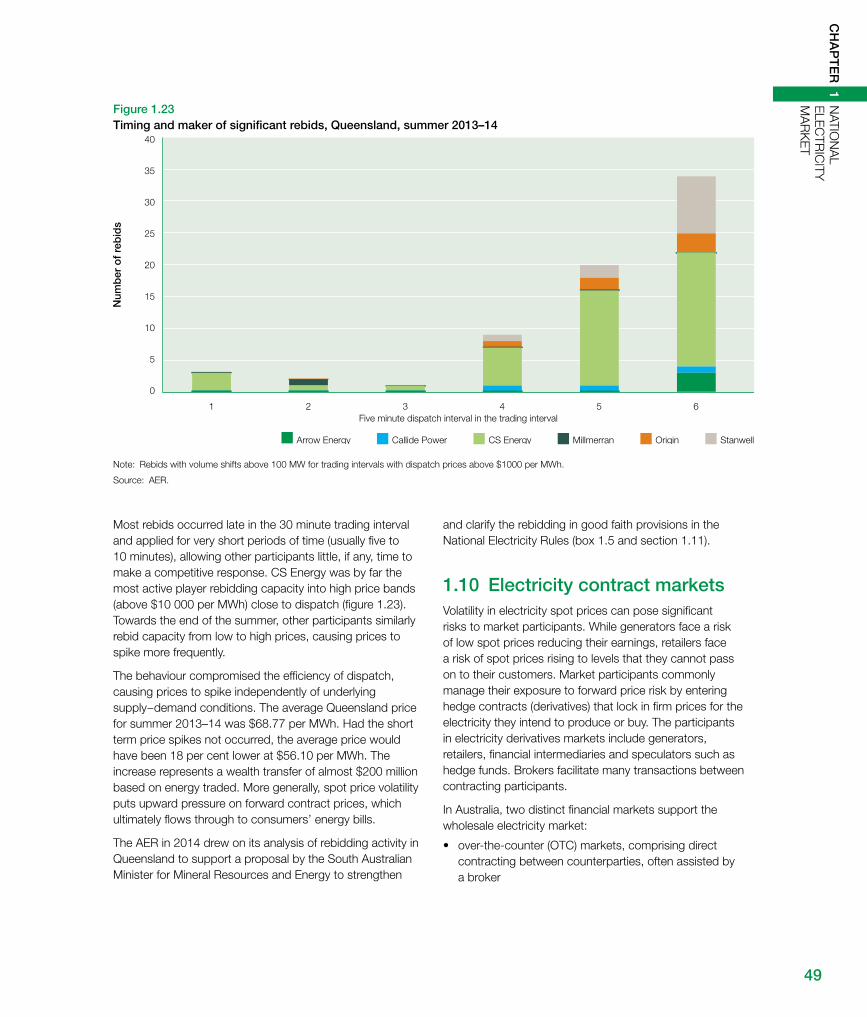
49
C
HA
PT
ER
1 N
ATION
AL
ELE
CTR
ICITY
M
AR
KE
T
Most rebids occurred late in the 30 minute trading interval and applied for very short periods of time (usually five to 10 minutes), allowing other participants little, if any, time to make a competitive response. CS Energy was by far the most active player rebidding capacity into high price bands (above $10 000 per MWh) close to dispatch (figure 1.23). Towards the end of the summer, other participants similarly rebid capacity from low to high prices, causing prices to spike more frequently.
The behaviour compromised the efficiency of dispatch, causing prices to spike independently of underlying supply−demand conditions. The average Queensland price for summer 2013–14 was $68.77 per MWh. Had the short term price spikes not occurred, the average price would have been 18 per cent lower at $56.10 per MWh. The increase represents a wealth transfer of almost $200 million based on energy traded. More generally, spot price volatility puts upward pressure on forward contract prices, which ultimately flows through to consumers’ energy bills.
The AER in 2014 drew on its analysis of rebidding activity in Queensland to support a proposal by the South Australian Minister for Mineral Resources and Energy to strengthen
and clarify the rebidding in good faith provisions in the National Electricity Rules (box 1.5 and section 1.11).
1.10 Electricity contract marketsVolatility in electricity spot prices can pose significant risks to market participants. While generators face a risk of low spot prices reducing their earnings, retailers face a risk of spot prices rising to levels that they cannot pass on to their customers. Market participants commonly manage their exposure to forward price risk by entering hedge contracts (derivatives) that lock in firm prices for the electricity they intend to produce or buy. The participants in electricity derivatives markets include generators, retailers, financial intermediaries and speculators such as hedge funds. Brokers facilitate many transactions between contracting participants.
In Australia, two distinct financial markets support the wholesale electricity market:
• over-the-counter (OTC) markets, comprising direct contracting between counterparties, often assisted by a broker
Figure 1.23 Timing and maker of significant rebids, Queensland, summer 2013–14
Num
ber
of
reb
ids
0
5
10
15
20
25
30
35
40
1 2 3 4 5 6Five minute dispatch interval in the trading interval
Arrow Energy Callide Power CS Energy OriginMillmerran Stanwell
Note: Rebids with volume shifts above 100 MW for trading intervals with dispatch prices above $1000 per MWh.
Source: AER.
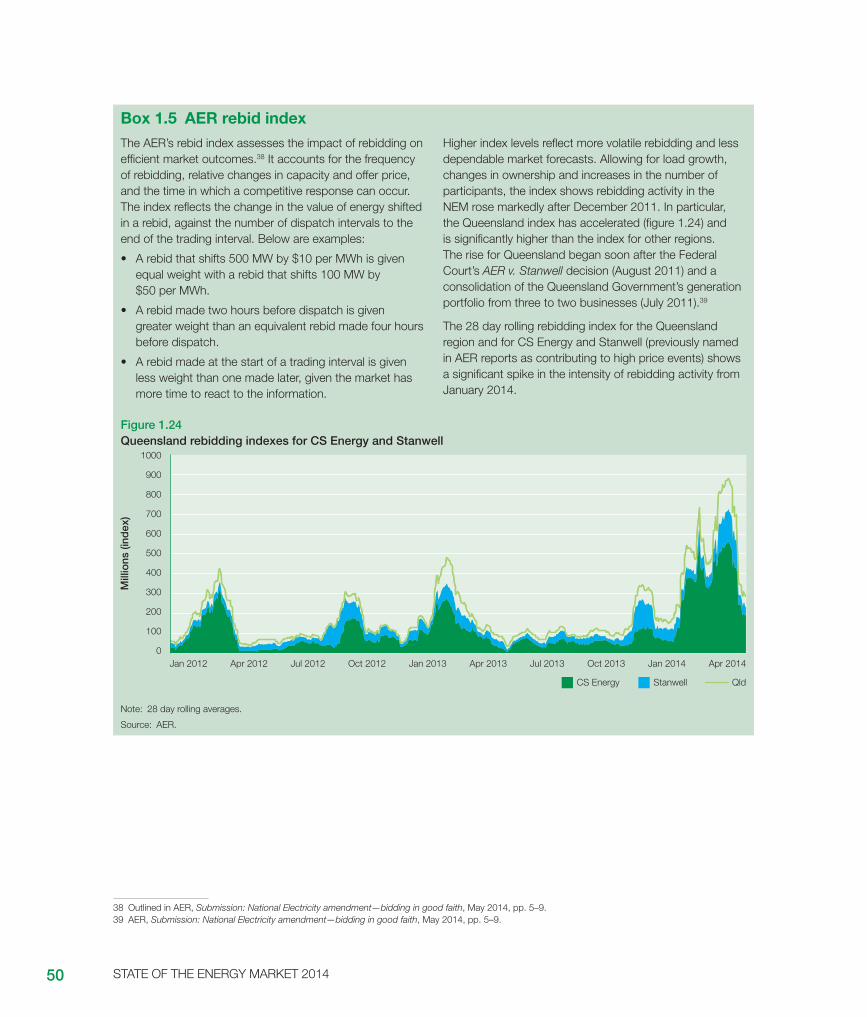
STATE OF THE ENERGY MARKET 201450
Box 1.5 AER rebid indexThe AER’s rebid index assesses the impact of rebidding on efficient market outcomes.38 It accounts for the frequency of rebidding, relative changes in capacity and offer price, and the time in which a competitive response can occur. The index reflects the change in the value of energy shifted in a rebid, against the number of dispatch intervals to the end of the trading interval. Below are examples:
• A rebid that shifts 500 MW by $10 per MWh is given equal weight with a rebid that shifts 100 MW by $50 per MWh.
• A rebid made two hours before dispatch is given greater weight than an equivalent rebid made four hours before dispatch.
• A rebid made at the start of a trading interval is given less weight than one made later, given the market has more time to react to the information.
Higher index levels reflect more volatile rebidding and less dependable market forecasts. Allowing for load growth, changes in ownership and increases in the number of participants, the index shows rebidding activity in the NEM rose markedly after December 2011. In particular, the Queensland index has accelerated (figure 1.24) and is significantly higher than the index for other regions. The rise for Queensland began soon after the Federal Court’s AER v. Stanwell decision (August 2011) and a consolidation of the Queensland Government’s generation portfolio from three to two businesses (July 2011).39
The 28 day rolling rebidding index for the Queensland region and for CS Energy and Stanwell (previously named in AER reports as contributing to high price events) shows a significant spike in the intensity of rebidding activity from January 2014.
Figure 1.24 Queensland rebidding indexes for CS Energy and Stanwell
Mill
ions
(ind
ex)
0
100
200
300
400
500
600
700
800
900
1000
Jan 2012 Apr 2012 Jul 2012 Oct 2012 Jan 2013 Apr 2013 Apr 2014Jul 2013 Oct 2013 Jan 2014
CS Energy Stanwell Qld
Note: 28 day rolling averages.
Source: AER.
38 Outlined in AER, Submission: National Electricity amendment—bidding in good faith, May 2014, pp. 5–9.39 AER, Submission: National Electricity amendment—bidding in good faith, May 2014, pp. 5–9.

51
C
HA
PT
ER
1 N
ATION
AL
ELE
CTR
ICITY
M
AR
KE
T
• the exchange traded market, in which electricity futures products are traded on the Australian Securities Exchange (ASX). Participants—including generators, retailers, speculators, banks and other financial intermediaries—buy and sell futures contracts.
The terms and conditions of OTC contracts are confidential between the parties. But exchange trades are publicly reported, so have greater market transparency than do OTC contracts. Unlike OTC transactions, exchange traded derivatives are settled through a centralised clearing house, which is the counterparty to all transactions and requires daily market-to-market cash margining to manage credit default risk. In OTC trading, parties rely on the creditworthiness of their counterparties. Increasingly, OTC negotiated contracts are being cleared and registered via block trading on the ASX.
Electricity derivatives markets support a range of products. The ASX products are standardised to promote trading, while OTC products can be sculpted to suit the requirements of the counterparties:
• Futures (swaps or contracts for difference in OTC markets) allow a party to lock in a fixed price to buy or sell a given quantity of electricity over a specified time. Each contract relates to a nominated time of day in a particular region. The products include quarterly base contracts (covering all trading intervals) and peak contracts (covering specified times of generally high energy demand) for settlement in the future. Futures are also traded as calendar or financial year strips covering four quarters.
• Options give the holder the right—without obligation—to enter a contract at an agreed price, volume and term in the future. The buyer pays a premium for this added flexibility.
Caps (which set an upper limit on the price that the holder will pay for electricity in the future) and floors (which set a lower price limit) are traded as both futures and options.
Electricity derivatives markets are subject to a regulatory framework that includes the Corporations Act 2001 (Cwlth) and the Financial Services Reform Act 2001 (Cwlth). The Australian Securities and Investments Commission is the principal regulatory agency.
The complex financial relationships among generators, retailers and other businesses create financial interdependency, meaning financial difficulties for one participant can affect others. The AEMC investigated ways to mitigate risk from the financial distress or failure of a large electricity business. One consideration was the
possible application of Australia’s G20 commitments on OTC derivatives to the electricity sector. The reforms aim to reduce the risk of financial system instability arising from counterparty default, and to increase transparency about OTC market activity. They include the reporting of OTC derivatives to trade repositories, and obligations on the clearing and execution of standardised derivatives.
The AEMC published draft advice in August 2014 that the costs of applying the G20 measures to the electricity sector would, at present, outweigh any benefits. It found the reforms would place significant costs and regulatory burdens on participants, and mandatory central clearing could discourage the use of OTCs as a hedging instrument. It argued the development of electronic trading platforms should be driven by participants’ demand for such services rather than by mandated use of such platforms.40
1.10.1 Contract market activityIn 2013–14 contracts covering 638 TWh of electricity were traded in the NEM, comprising 387 TWh traded on the ASX and 251 TWh in OTC markets (figure 1.25). Trading volumes were 32 per cent below their 2010–11 peak, but up marginally on 2012–13 levels. Overall trading volumes were down from a peak of 450 per cent of underlying NEM demand in 2010–11 to 360 per cent in 2013–14.
Figure 1.25 Traded volumes in electricity futures contracts
Tera
wat
t ho
urs
0
100
200
300
400
500
600
700
800
900
1000
2013–142012–132011–122010–112009–10
64%
36%
64%
36%
66%
34%
54%
44%
61%
39%
OTC contracts Futures NEM turnover
Sources: AFMA; ASX Energy.
Shifts between ASX and OTC trading have been significant in recent years. The Australian Financial Markets
40 AEMC, NEM financial market resilience, second interim report, 14 August 2014.

STATE OF THE ENERGY MARKET 201452
Table installation at Nyngan Solar Plant (AGL Energy)
53
C
HA
PT
ER
1 N
ATION
AL
ELE
CTR
ICITY
M
AR
KE
T
Association’s (AFMA) addendum to manage the risks of carbon price movements drew significant turnover from the ASX to OTC markets in 2012–13. But this shift reversed in 2013–14, with a 16 per cent fall in OTC volumes offset by a 13 per cent rise in ASX volumes. AFMA attributed this decline in OTC liquidity to uncertainty about carbon pricing (including the prospect of a retrospective repeal) and the continued decline in electricity demand. It argued the sale of generation assets in NSW and Queensland could negatively impact on liquidity in future years if it leads to further vertical integration between the generation and retail sectors.41
Electricity futures trading covers instruments for Victoria, NSW, Queensland and South Australia. NSW accounted for 37 per cent of ASX traded volumes in 2013–14, followed by Victoria (33 per cent) and Queensland (27 per cent). Liquidity in South Australia was low, accounting for only 3 per cent. In the OTC market, Queensland accounted for 40 per cent of traded volumes, followed by NSW (34 per cent), Victoria (24 per cent) and South Australia (2 per cent).
While the most heavily traded ASX products in 2013–14 were base futures (52 per cent of volumes), the strongest growth in that year was in options (37 per cent, up from 27 per cent in 2012–13). Cap futures accounted for 11 per cent of trade volume. By contrast, in the OTC market, swaps accounted for almost 80 per cent of trade.
Liquidity is mostly in products traded 18−24 months out—for example, open interest in forward contracts at September 2014 was mostly for quarters to the end of 2015–16, with little liquidity into 2016–17 (figure 1.26).
1.10.2 Contract pricesFluctuations in futures prices reflect changing expectations of the cost of underlying wholesale electricity. Figure 1.27 shows prices of electricity base futures contracts for calendar years 2014 and 2015, based on average daily settlement prices for the four quarters of the year.
In recent years, uncertainty about government policy on carbon pricing caused contract prices to fluctuate. Base futures prices peaked before the federal election in September 2013, then steadily declined in line with expectations that the Coalition Government would repeal carbon pricing from 1 July 2014. A continuing trend of declining energy demand and subdued peak demand (despite a heatwave in south east Australia in January 2014) contributed to a further weakening of contract prices during 2014. Overall, base futures prices for calendar year 2015 fell most significantly in NSW and Victoria (22 per cent
41 AFMA, 2014 Australian financial markets report.
and 23 per cent respectively), followed by Queensland (11 per cent) and South Australia (7 per cent). Prices then stabilised or rose from July 2014, indicating the contract market had fully factored in the carbon repeal (figure 1.27).42
At September 2014, reflecting market expectations that electricity prices will rise from their current low base, forward contracts are trading in contango—that is, quarter 1 (January to March) prices are higher in later years than for the upcoming year. This trend is most apparent for Queensland and South Australia (figure 1.28). Queensland prices likely reflect market concerns about recent spot market volatility (section 1.9.5) and forecasts of rising electricity demand associated with LNG developments in that region. South Australia’s relatively high contract prices mirror the spot market, in which the region has recorded the highest prices among NEM regions for the past four years. Liquidity for South Australian contracts is also low, partly reflecting a concentrated generation sector and some recent market instability.
1.11 Improving market efficiencyThe AER engages with the AEMC on rule change processes aimed at improving market efficiency in the NEM. It may initiate these matters, or engage in processes initiated by third parties. Two recent processes (both ongoing in October 2014) related to the rules governing bidding in good faith and generator ramp rates.
The AER also takes enforcement action against market participants in alleged breach of the National Electricity Rules. Failure to comply with the rules can impair market efficiency. In 2014 the AER instituted proceedings in the Federal Court against a generator for allegedly failing to follow dispatch instructions issued by AEMO.
1.11.1 Rebidding in good faithThe AER in 2014 supported a proposal by the South Australian Minister for Minister for Mineral Resources and Energy to strengthen and clarify the rebidding in good faith provisions in the National Electricity Rules.43 The AER argued a recent rise in the incidence of late rebidding was
42 In the OTC market, carbon costs were incorporated in contracts in a variety of ways, with many including an addendum developed by AFMA. The addendum calculated a carbon uplift by multiplying the carbon reference price by the NEM’s average carbon intensity (published by AEMO). In June 2014 AFMA set the carbon reference price to $0 from 1 July 2014.
43 AER, Submission: National Electricity amendment—bidding in good faith, May 2014.
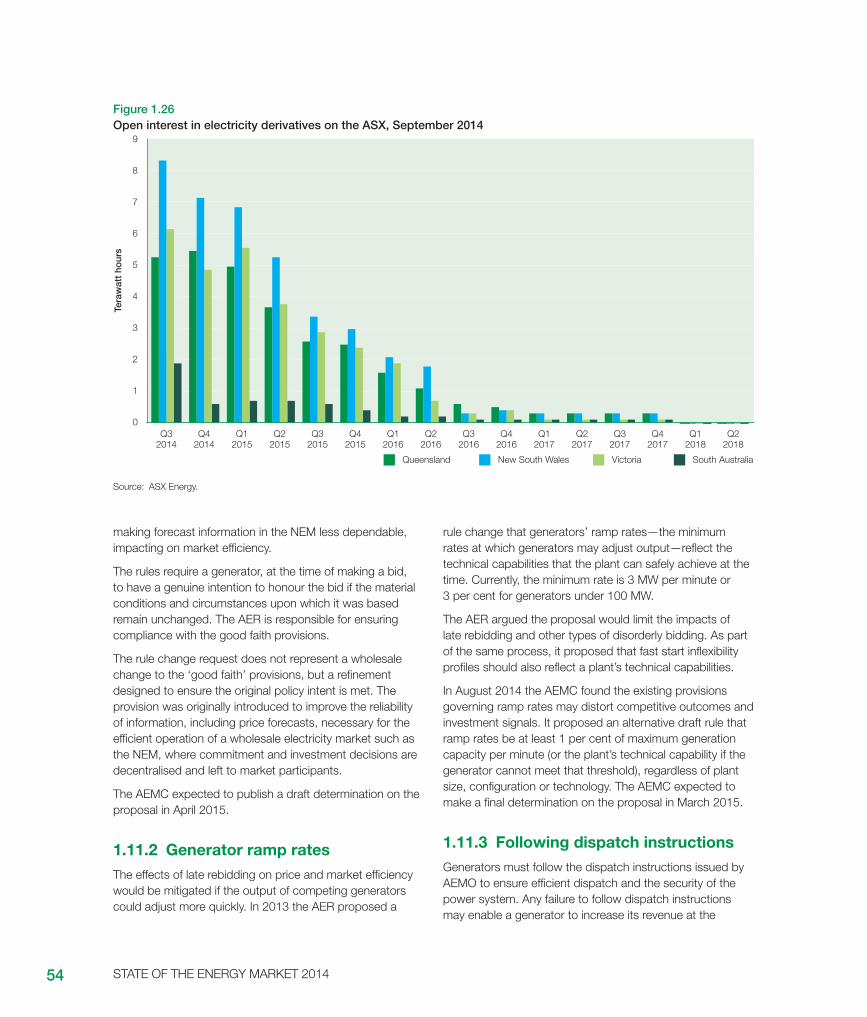
STATE OF THE ENERGY MARKET 201454
Figure 1.26 Open interest in electricity derivatives on the ASX, September 2014
South AustraliaVictoriaNew South WalesQueensland
Tera
wat
t ho
urs
Q22018
Q12018
Q42017
Q32017
Q22017
Q12017
Q42016
Q32016
Q22016
Q12016
Q42015
Q32015
Q22015
Q12015
Q42014
Q32014
0
1
2
3
4
5
6
7
8
9
Source: ASX Energy.
making forecast information in the NEM less dependable, impacting on market efficiency.
The rules require a generator, at the time of making a bid, to have a genuine intention to honour the bid if the material conditions and circumstances upon which it was based remain unchanged. The AER is responsible for ensuring compliance with the good faith provisions.
The rule change request does not represent a wholesale change to the ‘good faith’ provisions, but a refinement designed to ensure the original policy intent is met. The provision was originally introduced to improve the reliability of information, including price forecasts, necessary for the efficient operation of a wholesale electricity market such as the NEM, where commitment and investment decisions are decentralised and left to market participants.
The AEMC expected to publish a draft determination on the proposal in April 2015.
1.11.2 Generator ramp rates The effects of late rebidding on price and market efficiency would be mitigated if the output of competing generators could adjust more quickly. In 2013 the AER proposed a
rule change that generators’ ramp rates—the minimum rates at which generators may adjust output—reflect the technical capabilities that the plant can safely achieve at the time. Currently, the minimum rate is 3 MW per minute or 3 per cent for generators under 100 MW.
The AER argued the proposal would limit the impacts of late rebidding and other types of disorderly bidding. As part of the same process, it proposed that fast start inflexibility profiles should also reflect a plant’s technical capabilities.
In August 2014 the AEMC found the existing provisions governing ramp rates may distort competitive outcomes and investment signals. It proposed an alternative draft rule that ramp rates be at least 1 per cent of maximum generation capacity per minute (or the plant’s technical capability if the generator cannot meet that threshold), regardless of plant size, configuration or technology. The AEMC expected to make a final determination on the proposal in March 2015.
1.11.3 Following dispatch instructionsGenerators must follow the dispatch instructions issued by AEMO to ensure efficient dispatch and the security of the power system. Any failure to follow dispatch instructions may enable a generator to increase its revenue at the

55
C
HA
PT
ER
1 N
ATION
AL
ELE
CTR
ICITY
M
AR
KE
T
expense of power system security and, if widespread, may result in higher energy prices for consumers.
In July 2014 the AER instituted proceedings in the Federal Court against Snowy Hydro, alleging it failed to follow dispatch instructions issued by AEMO on nine occasions in 2012 and 2013. The AER alleged Snowy Hydro, on each occasion, generated substantially more power than the dispatch instruction required it to generate, and earned a greater trading amount from each transaction than it would have earned if it had complied with the instructions.
1.12 Reliability of supplyReliability refers to the continuity of electricity supply to customers. While power outages can originate from the generation, transmission or distribution sectors, about 95 per cent of reliability issues in the NEM originate in the distribution network sector (section 2.8.1).
The AEMC Reliability Panel sets the reliability standard for generation in the NEM. The standard is the expected amount of energy at risk of not being delivered to customers
Figure 1.27 Electricity base futures contracts, calendar year prices
$ p
er m
egaw
att
hour
80
70
60
50
40
30
20 Jul 2014
Oct 2014
Apr 2014
Jan 2014
Oct 2013
Jul 2013
Apr 2013
Jan 2013
Oct 2012
Jul 2012
Apr 2012
Jan 2012
South Australia 2015
South Australia 2014
Victoria 2015
Victoria 2014
New South Wales 2015
New South Wales 2014
Queensland 2015
Queensland 2014
Note: Average daily settlement prices of base futures contracts for the four quarters of the relevant calendar year.
Source: ASX Energy.
because not enough capacity is available. To meet this standard, AEMO determines the necessary spare generation capacity needed for each region (including capacity via transmission interconnectors) to manage unexpected demand spikes and generation failure. It aims for the reliability standard to be met in each financial year, for each region and for the NEM as a whole. It does not account for supply interruptions in distribution and non-core transmission networks, which are subject to different standards and regulatory arrangements (sections 2.8.1 and 2.7.1).
The current reliability standard is that no more than 0.002 per cent of customer demand in each NEM region should be unserved by generation capacity per financial year, allowing for demand-side response and imports from interconnectors. AEMO sets reserve margins so the reliability standard is met in each financial year, for each region and for the NEM as a whole. The standard is equivalent to an annual systemwide outage of seven minutes at peak demand.

STATE OF THE ENERGY MARKET 201456
Figure 1.28 First quarter base futures prices, by region, September 2014
$ p
er m
egaw
att
hour
South AustraliaVictoriaNew South WalesQueensland
30
40
50
60
70
80
Q1 2018Q1 2017Q1 2016Q1 2015
Source: ASX Energy.
Other reliability measures
AEMO publishes forecasts of electricity demand and generator availability to allow generators to respond to market conditions and schedule maintenance outages. Safety net mechanisms allow AEMO to manage any short term risks of unserved energy identified in forecasts:
• AEMO can enter reserve contracts with generators under a reliability and emergency reserve trader (RERT) mechanism to ensure reserves are available to meet the reliability standard. When entering these contracts, AEMO must prioritise facilities that would least distort wholesale market prices. The RERT mechanism is due to expire in 2016.
• AEMO can use its directions power to require generators to provide additional supply at the time of dispatch to ensure sufficient reserves are available.
1.12.2 Reliability performanceThe reliability standard has been breached only twice, in Victoria and South Australia during a heatwave in January 2009. The unserved energy from these events on an annual basis was 0.0032 per cent for South Australia and 0.004 per cent for Victoria.
On 15 January 2014, the third day of a heat wave affecting south east Australia, supply conditions in Victoria and South Australia were extremely tight, with forecasts indicating insufficient capacity was available in both regions to meet demand. AEMO issued Lack of Reserve Level 3 market notices (an infrequent occurrence), noting customers may need to be interrupted to maintain system security.45 AEMO also engaged the RERT provision. But the mechanism was ultimately not required when capability on the Basslink interconnector increased sufficiently for Tasmanian generation to meet capacity shortfalls on the mainland.
1.13 Barometers of competition in the NEM
There is no universally accepted approach to measuring competitiveness in electricity markets. The AER monitors a number of structural and behavioural indicators for each NEM region. Its analysis:
• is based on the entity with offer control, which may be distinct from the entity that owns/operates a plant, due
45 Lack of Reserve Level 3 indicates AEMO expects load shedding to be required, even if all available generation capacity and interconnectors are in operation.
1.12.1 Reliability settingsThe AEMC Reliability Panel recommends price settings that help ensure the reliability standard is met, including:
• a spot market price cap, which is set at a sufficiently high level to stimulate the required investment in generation capacity to meet the standard. The cap was raised from $13 100 per MWh to $13 500 per MWh on 1 July 2014.
• a cumulative price threshold to limit the exposure of participants to extreme prices. If cumulative spot prices exceed this threshold over a rolling seven days, then AEMO imposes an administered price cap. The threshold was raised to $201 900 per MWh on 1 July 2014; the administered cap is $300 per MWh.
• a market floor price, set at −$1000 per MWh.
The market price cap and cumulative price threshold are adjusted each year in line with movements in the consumer price index. Additionally, the reliability panel conducts a full review of the reliability standard and settings every four years. In its July 2014 review, the panel recommended not changing the reliability standard and continuing to adjust the market price cap and cumulative price threshold in line with changes in the consumer price index.44
44 AEMC Reliability Panel, Reliability standard and reliability settings review 2014, final report, July 2014.
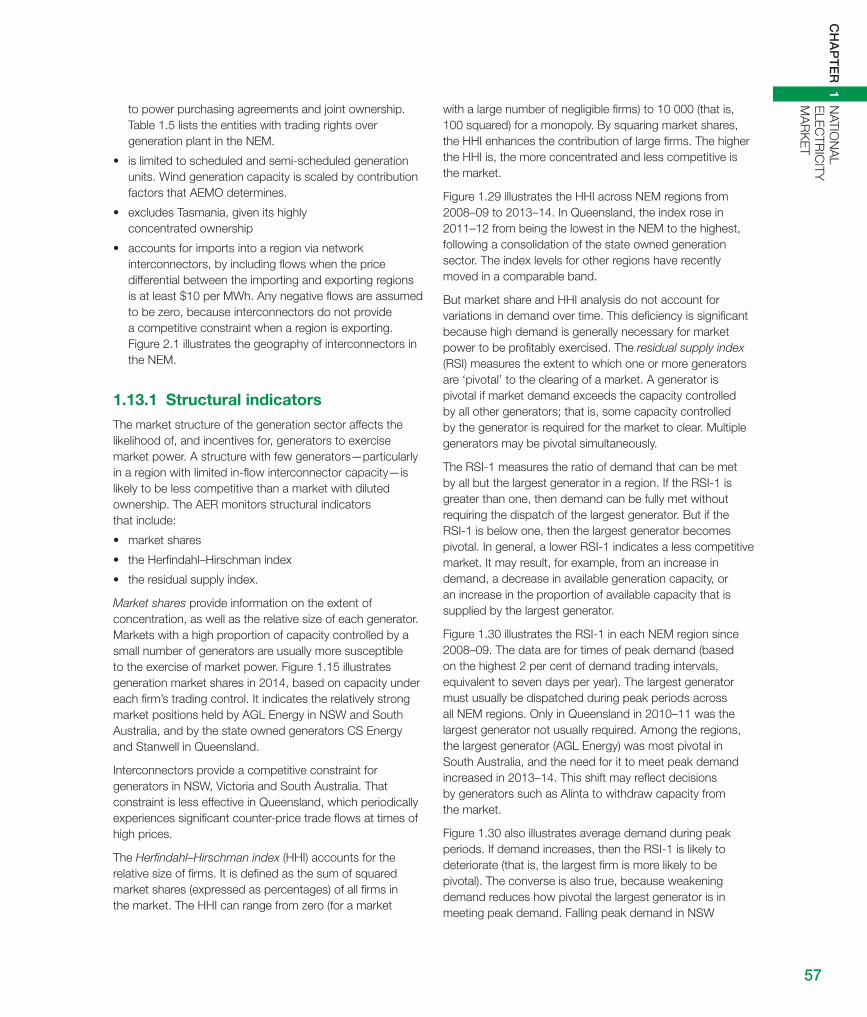
57
C
HA
PT
ER
1 N
ATION
AL
ELE
CTR
ICITY
M
AR
KE
T
to power purchasing agreements and joint ownership. Table 1.5 lists the entities with trading rights over generation plant in the NEM.
• is limited to scheduled and semi-scheduled generation units. Wind generation capacity is scaled by contribution factors that AEMO determines.
• excludes Tasmania, given its highly concentrated ownership
• accounts for imports into a region via network interconnectors, by including flows when the price differential between the importing and exporting regions is at least $10 per MWh. Any negative flows are assumed to be zero, because interconnectors do not provide a competitive constraint when a region is exporting. Figure 2.1 illustrates the geography of interconnectors in the NEM.
1.13.1 Structural indicatorsThe market structure of the generation sector affects the likelihood of, and incentives for, generators to exercise market power. A structure with few generators—particularly in a region with limited in-flow interconnector capacity—is likely to be less competitive than a market with diluted ownership. The AER monitors structural indicators that include:
• market shares
• the Herfindahl–Hirschman index
• the residual supply index.
Market shares provide information on the extent of concentration, as well as the relative size of each generator. Markets with a high proportion of capacity controlled by a small number of generators are usually more susceptible to the exercise of market power. Figure 1.15 illustrates generation market shares in 2014, based on capacity under each firm’s trading control. It indicates the relatively strong market positions held by AGL Energy in NSW and South Australia, and by the state owned generators CS Energy and Stanwell in Queensland.
Interconnectors provide a competitive constraint for generators in NSW, Victoria and South Australia. That constraint is less effective in Queensland, which periodically experiences significant counter-price trade flows at times of high prices.
The Herfindahl–Hirschman index (HHI) accounts for the relative size of firms. It is defined as the sum of squared market shares (expressed as percentages) of all firms in the market. The HHI can range from zero (for a market
with a large number of negligible firms) to 10 000 (that is, 100 squared) for a monopoly. By squaring market shares, the HHI enhances the contribution of large firms. The higher the HHI is, the more concentrated and less competitive is the market.
Figure 1.29 illustrates the HHI across NEM regions from 2008–09 to 2013–14. In Queensland, the index rose in 2011–12 from being the lowest in the NEM to the highest, following a consolidation of the state owned generation sector. The index levels for other regions have recently moved in a comparable band.
But market share and HHI analysis do not account for variations in demand over time. This deficiency is significant because high demand is generally necessary for market power to be profitably exercised. The residual supply index (RSI) measures the extent to which one or more generators are ‘pivotal’ to the clearing of a market. A generator is pivotal if market demand exceeds the capacity controlled by all other generators; that is, some capacity controlled by the generator is required for the market to clear. Multiple generators may be pivotal simultaneously.
The RSI-1 measures the ratio of demand that can be met by all but the largest generator in a region. If the RSI-1 is greater than one, then demand can be fully met without requiring the dispatch of the largest generator. But if the RSI-1 is below one, then the largest generator becomes pivotal. In general, a lower RSI-1 indicates a less competitive market. It may result, for example, from an increase in demand, a decrease in available generation capacity, or an increase in the proportion of available capacity that is supplied by the largest generator.
Figure 1.30 illustrates the RSI-1 in each NEM region since 2008–09. The data are for times of peak demand (based on the highest 2 per cent of demand trading intervals, equivalent to seven days per year). The largest generator must usually be dispatched during peak periods across all NEM regions. Only in Queensland in 2010–11 was the largest generator not usually required. Among the regions, the largest generator (AGL Energy) was most pivotal in South Australia, and the need for it to meet peak demand increased in 2013–14. This shift may reflect decisions by generators such as Alinta to withdraw capacity from the market.
Figure 1.30 also illustrates average demand during peak periods. If demand increases, then the RSI-1 is likely to deteriorate (that is, the largest firm is more likely to be pivotal). The converse is also true, because weakening demand reduces how pivotal the largest generator is in meeting peak demand. Falling peak demand in NSW
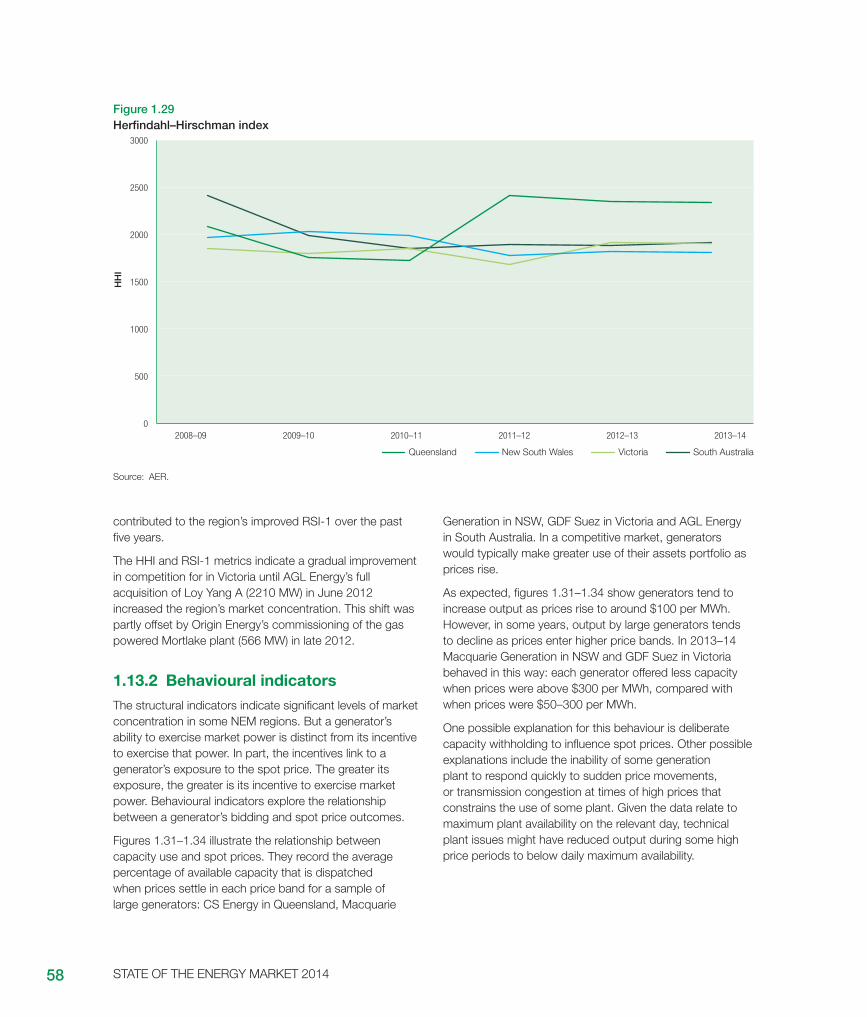
STATE OF THE ENERGY MARKET 201458
contributed to the region’s improved RSI-1 over the past five years.
The HHI and RSI-1 metrics indicate a gradual improvement in competition for in Victoria until AGL Energy’s full acquisition of Loy Yang A (2210 MW) in June 2012 increased the region’s market concentration. This shift was partly offset by Origin Energy’s commissioning of the gas powered Mortlake plant (566 MW) in late 2012.
1.13.2 Behavioural indicatorsThe structural indicators indicate significant levels of market concentration in some NEM regions. But a generator’s ability to exercise market power is distinct from its incentive to exercise that power. In part, the incentives link to a generator’s exposure to the spot price. The greater its exposure, the greater is its incentive to exercise market power. Behavioural indicators explore the relationship between a generator’s bidding and spot price outcomes.
Figures 1.31–1.34 illustrate the relationship between capacity use and spot prices. They record the average percentage of available capacity that is dispatched when prices settle in each price band for a sample of large generators: CS Energy in Queensland, Macquarie
Generation in NSW, GDF Suez in Victoria and AGL Energy in South Australia. In a competitive market, generators would typically make greater use of their assets portfolio as prices rise.
As expected, figures 1.31–1.34 show generators tend to increase output as prices rise to around $100 per MWh. However, in some years, output by large generators tends to decline as prices enter higher price bands. In 2013–14 Macquarie Generation in NSW and GDF Suez in Victoria behaved in this way: each generator offered less capacity when prices were above $300 per MWh, compared with when prices were $50–300 per MWh.
One possible explanation for this behaviour is deliberate capacity withholding to influence spot prices. Other possible explanations include the inability of some generation plant to respond quickly to sudden price movements, or transmission congestion at times of high prices that constrains the use of some plant. Given the data relate to maximum plant availability on the relevant day, technical plant issues might have reduced output during some high price periods to below daily maximum availability.
Figure 1.29 Herfindahl–Hirschman index
VictoriaQueensland New South Wales South Australia
HH
I
0
500
1000
1500
2000
2500
3000
2013–142012–132011–122010–112009–102008–09
Source: AER.
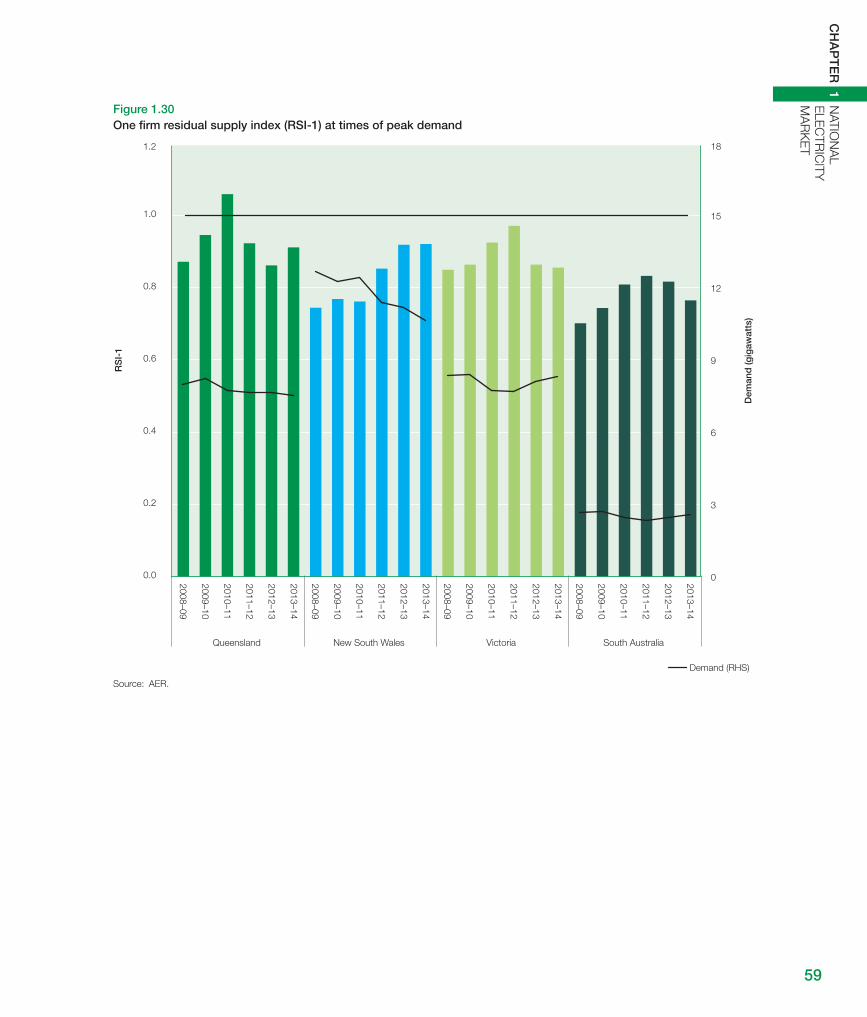
59
C
HA
PT
ER
1 N
ATION
AL
ELE
CTR
ICITY
M
AR
KE
T
Figure 1.30 One firm residual supply index (RSI-1) at times of peak demand
0
3
6
9
12
15
18
0.0
0.2
0.4
0.6
0.8
1.0
1.2
Queensland New South Wales Victoria South Australia
Demand (RHS)
2008–09
2009–10
2010–11
2011–12
2013–14
2012–13
2008–09
2009–10
2010–11
2011–12
2013–14
2012–13
2008–09
2009–10
2010–11
2011–12
2013–14
2012–13
2008–09
2009–10
2010–11
2011–12
2013–14
2012–13
RS
I-1
Dem
and
(gig
awat
ts)
Source: AER.
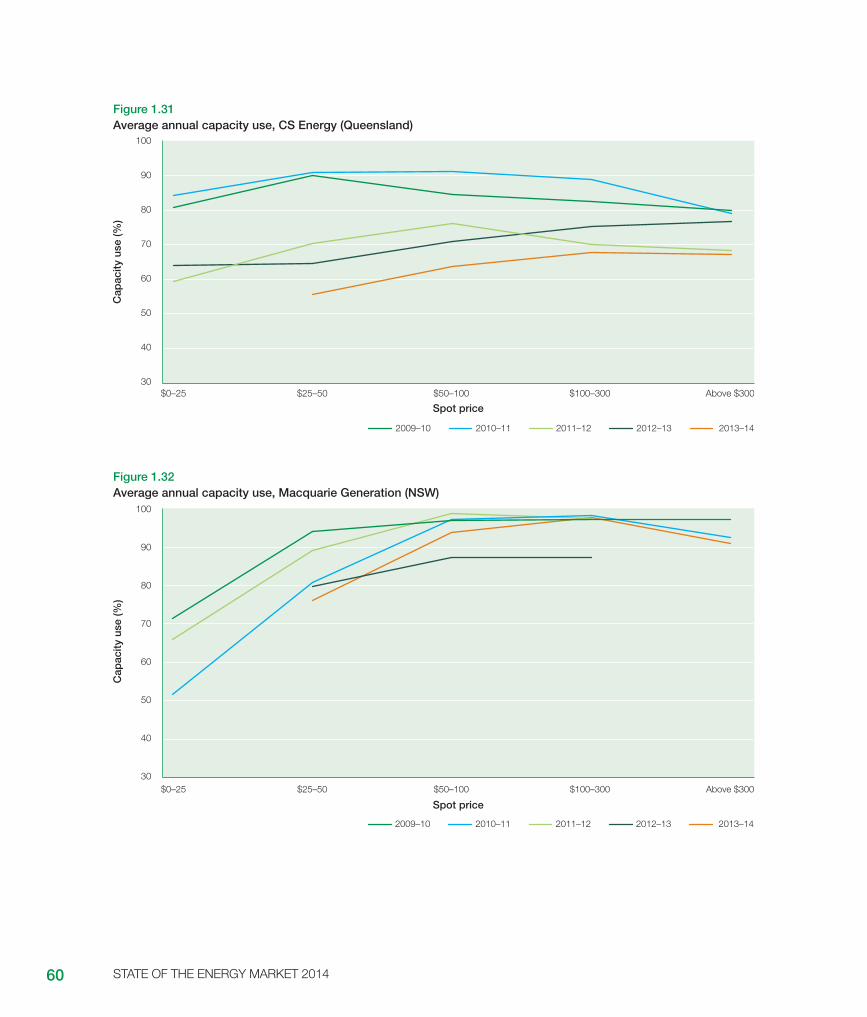
STATE OF THE ENERGY MARKET 201460
Figure 1.31 Average annual capacity use, CS Energy (Queensland)
Cap
acity
use
(%)
Spot priceAbove $300$100–300$50–100$25–50$0–25
30
40
50
60
70
80
90
100
2012–13 2013–142011–122010–112009–10
Figure 1.32 Average annual capacity use, Macquarie Generation (NSW)
Cap
acity
use
(%)
Spot price
Above $300$100–300$50–100$25–50$0–2530
40
50
60
70
80
90
100
2012–13 2013–142011–122010–112009–10

61
C
HA
PT
ER
1 N
ATION
AL
ELE
CTR
ICITY
M
AR
KE
T
Figure 1.33 Average annual capacity use, GDF Suez (Victoria)
Cap
acity
use
(%)
Spot price
2013–142012–132011–122010–112009–10
Above $300$100–300$50–100$25–50$0–2570
75
80
85
90
95
100
Figure 1.34 Average annual capacity use, AGL Energy (South Australia)
Cap
acity
use
(%)
Spot price
30
40
50
60
70
80
90
100
Above $300$100–300$50–100$25–50$0–25
2013–142012–132011–122010–112009–10
Note (figures 1.31–1.34): Data excluded if based on fewer than five observations.
Source (figures 1.31–1.34): AER.