1, -...
TRANSCRIPT

OPERATIONS RESEAI{LII iN AGRICULTURE ANlr r'lATIiR RESOURCES
D. Yaron, C. Tapiero (editors)North-Ho11and Publishing CompanyO rFoRS, 1980
NIA.NAGEIIIENT, RI SK AND COT{PETITI\iE EQUI L] BRI UT{
Yoav KislevThe llebrew University
Rehovot, Israel
1, IntroductionA farmer can vaccinate his livestock, install auxiliary irrigation systems,
apply herbicides and pesticides, and in these ways significantly l'educe the varia-bitity and uncertainty of the returns to his operation. Ilore subtle, and of nolesser importance, is the ability to reduce risk b1" da1'-to-da1' management andobservation. A good poultry groi{er u'i11 recognize a disease before it has spreadin the flock and timely cultivation reduces the amount of weeds and their effecton crop yields.
In this paper I suggest a production model in ilhich risk reduction is a
function of nanagerial ability. This abillty is not mean-preserving -- bettermanagement both rcduces the variability of production and increases ploductivity(for an alternative specification see Pope and Just (1977)). The consequencesof this ability to affect r:isk are analyzed in an industry characterized by a
dlstrlbution of nanagerial abilities and perfect competition. Risk neutralityis assurned throughout. tt ir'i11 be shown that bettel managels rr'il1 concentlatein the more risky activities -- realizing in this wa-y their comparative advantage-- and that these activities lui11, as a result, project a relativcly 1ow riskirnage. The analysis is conparative static in nature, but I have in mind an
economic selection process as the dlTramic mover of the system. Accordingly, therisk considered is the risk assoclated h'ith economic sel'ection: of failing tocover costs and having to change lines of production. Competitlon and marketforces, by reducing profit margins, increase this risk and tighten the selectionstress,
2, Production and Ski11 Distribution
2.1 The Production Acti\ritConsider an agricultural industrl' producing a single product. AL1 farms are
of identical slze and assume, for simplicit)', that the 1e\rel of input is the same
on al1 farms, Let z be the dollar value of the constant, identical input Vector.since the analysis is long run in naturc, z includes cost of capital services.
Assume that potential, maximal output in physical terms on each farm is 0
units. Production is a randorn process and actual 1eve1 of output is q -< 0
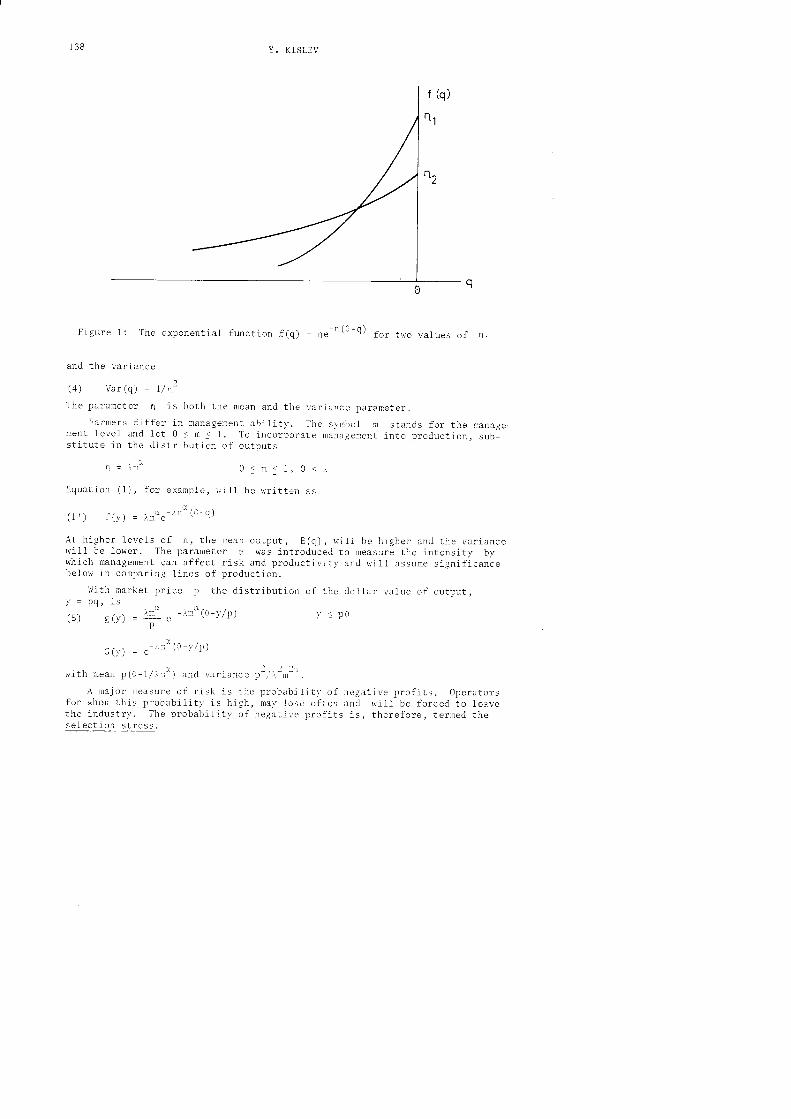
Assume that the probability di-stribution of the q r:a1ues is the exponentialdcnsit)' function (Figure lJ :
-n i0-qJ(.lt f(q,1 -'eThe cumulative distribution is
.q -r (r-x) , -1 ("-q )(2) t(.1)-.t ,e "''dr=e
tn" "*p".t"a ,}r"
(3) E(q)=0-lln
131
138 Y. KISLEV
Figure 1; The exponential function f(q) 'e - t' for tlio \'alues of
and the varlance1(4) Var(q) = 1z'n-
The parameter n is both the mean and the variance paraneter.Farmers differ ir nanagement abilit)'. The .-svnbol m stands for the manage-
rnent leve1 and 1et 0: n _< 1. To incorporate rxanagement into production, sub-stitute in the distribution of outnuts
n = imf, o : m _< 1, o < :"
Equation (1), for exampJ.e, rri1l be utitten as
(1,J f (y) = /,moe-l''* 1;-q)
At higher 1evc1s of n, the mean output, E(ql, riill be higher and the r-ariancen'111 be lolver. The paratnetcr s was introduced to measure the intensity b1,lvhich management can affect risk and productivitl, u.6 will assume significancebeloru in comparing lines of production.
l!'ith rnarket prlce p the distribution oflY = Pq, is
.t.
{.sJ ityl - r "
- "10-t/Pp
.t,.\ - ^- m'( -) Ib[]-.r = e
u,ith mean p(n-1/)mo) and variancc pl,l:. l,rlt.
A major rneasure of risk is the probabilitv ot'negative profits. Operatorsfor whon this probability'is high, mal'lose often and will be forced to 1ear,,ethe industrl'. The probability of negative profits is, therefore, termed theselection stTess.
'the do1lar value of output,
y : pe

MANAGEMENT, R]SK AND COMPETlTlVE EQUIIIBRIW
Profits are
T=Y- Z
the selection stress isz
= clz) = "-rm* ie-zlP) '
Le (y) dy(6) Pr(r < 0) =
See Figure 2.
PQ=Y
Figure 2: Risk, Pr[y<z), for two levels of management, ,1 - ,2.
Since both Svar(qJ/3m and 0G(z)/lm are negative, management reduces thevariability of outcomes of the production process and, therebv, reduces riskand the selection stress. A better manager faces, therefore,a smaller proba-biliti, of failure.
2.2 The IndustryThe industry is conposed of oper.ltors of different managerial ski11s. Let
N(m) be the number of operators rrith manage:nent 1eve1 n,.and assume the distri-bution of management ab; li1;es to l'e !,i\en '. \':, - \m ', 0 .' I. lo economlzeon symbols normalize b)' setting A I I and r,rite the distribution as
e(7) N(mJ=p", 0<6<1, 0:<m:1.
The constraint on B reflccts the assumption that the proportions of the manage-nent groups decrease with management level; see Figure 3.
Assume that the nmber of operators in the lndustry is 1arge, so that N-(m)
can be taken as continuous in m. Let T.h stand for the size of thc group ofoperators with management abilities *"
betr,,een m=a :rnd m=b
b.tlt-r8l I -i\[mt dm=T-=(b'"-a' )3D I - b
a
The total nunber of operators in the industry and outside is1
(gt[\rmtJm=,10' I-8
139
and
0

140
N(m)
Y. KISLEV
/N(m)om
o: density
Figure 3: Distribution of trlanagement
Ilowever, operators wlth relatively low 1evels of abilitiesof their production operations. Low 1eve1 managers wi11,operatlng ln the industry.
Let q.- stand for the expected output of an operatorm. Total "' expected output for a group of firms, betweena and b, is
h I -o1l0r Q , = ixl*tq 6, = /r-''fo-'a tl aa
Let 6=1-6-0, then for B+a/],
' "6 6
(l0a) O = I .0-,' o - n
'ab ab- ,r iandforE+0=1
1(10b1 Qrb - 1rbo* ^
[loSb - iogc)
Average, per firm, product in the group is(11) Qab/rab = Q..
If all operators rvith management abilities above the leve1industry, b in equations (10) and (i1) is replaced by 1.
Equation (12J specifies the variance of production inof within firm and between flrm variation.
(12) "'^n
-
^1ffi _/or,o, (q-q..)2 dq d*
1--l) dm.tm
cannot cover the costtherefore, not be found
rvith management 1eve1the management levels
m = a operate in the
the industry as the sum
b: occumutqted 1
1
1-P

MAIiAGEMENT, R]SK AND COMPETITIVE EQUILTBRII]M
f J r(n)b
Ia
. [9.,1
ab
1-- --l_ I cri + SB ll- I | -"ab ""ah Iabl _l
The symbols SW,O and SBab stand, respectively, for the within firms and betweenfirms variability components. See Appendix for details.
The interpretation of this variance is the following: if repeated censuses(say, every yearJ of the group output were taken, and the variance of all thefirm level observations around the long-run group average was calculated, itsexpected value would have been ozu as defined in (12) . The specification in (12)does not assume independence of *" output in firns.
If operators in the industry are identical, output in each period can beregarded as a sample from the population of random outcomes rr'hose variance isgiven by (12). This leads "natura11y" to regarding the observed variability ofoutput as a neasure of the r,,ariance of the probabllity distribution facing eachoperator. Such a procedure, may be fo1lon'ed by a nerr' operator contemplatingentry or by an outside observer trying to assess uncertainty anci risk associatedwith the industry (Rao, 1971). The same applies to r{eather related variability,1f observations are taken over a period of years. However, even in agriculture,much of livestock, fruits, and vegetable production is quite independent ofclimatic changes, and sti1t, as every producer is lre1l aware, output variability,risk, and uncertainty are significant in these lines also.
In equation (12) the r,ithin firm variance, S1r,r, depends on the managenent 1eve1the betrveen firrn component *- on the degree of concentration of production alongthe skil1 axis, Thus, the higher the skil1 in an industry and the more concen-trated its production, the 1oh'er the variance of output. A 1ou variance industr,vmay project the impression of a lolv-risk activity. This is the motivation forthe analysis of the next section.
3. Comparative Advaqqqge
5.1 Tx,o Industriessector, say agriculture, composed of tho industries: Onethe other producing product 2. Let the demand functions
cr,Y>0, i=1,1
141
Ir| .z:"LN,
,le )- | am
_1
Assnme a productionproducing product 1, andbe
- = " n-Yfi(1 5)
Then oliand
management abilitl'to affect the distributlon of outcones of production rii11differ from industr,y to industr;-; indcx thc llarameter:r,:. (i=1,2), in (1')tlre equat i ons that fo I lori it.h;e continue to assume an identical input vector of do1lar r,a1ue z in both
industrl'1 and 2. The output disiributional parameters: and ) are also identical,oi . o2 (Figurc 4). Demand may' differ according to (15).
Recal1 the major asscrtion of the stud\'; namely-, that certain charactcristicsof the industrial organization -- particularlI thc r,ariabilitY of output and theterms of trade -- will differ in equilibrium configuration from n'hat they other-r,ise may be. To demonstrate thc effect of the market forces, conduct arrthoughtexperiment:" in it, an inaginary configur:rtion, state zero, which n,i11 be equi-librium state in all respects but one, iii1l be comparea to a final market equi-I ibrium.
To define state zero assume, for simplicitv, that market equilibriurn can bemaintained in each industry separately rr'ith identical number and ski11 distributionof producers. Thus, let the totat number of operators ltith skil1 tevel m in the

142 Y. KISLEV
q.m
Figure 4; The funbtions q., 1
a..1in
'lto2
agricultural sector be 2m-8, of which m-B operate in each industl'v. Further, theski11 of the marginal manager, the manager for tr,hose firm revenue exactly equalscost, is the same in both industries. Ilark this marginal ski11 1eve1 n+, then
(14) I',E,u) - P2E2tyr = z. r = n-
See Figure 5. Operators riith m < m. riill, on the averagerproduce. Total e(pected output of each product is
1.- _1. I(15) Q. = I m " (9 - ' ldn't ' l.nt+ y',m
- i-*6,+= | + __, t=i_o_,.''1- \ I a
according to (10a), assuming o+1311. l!ith these quantities,are determined in the markets according to (13).
Thus state zero is an equilibrium situation in nost senses: product matketsare in equilibrium, operating producers nake profits, the marginal producers(of mr) make zero profit, there are no losers in the industries considered. Ast'i11 be seen momcntarilv, the only aspect .in which the sector is not in equi-librium is the ordering of producers according to comparative advantage positionsBut right 1sxr, at state zero, producers are distributed at random (i.e.uniformly)beth een the two i ndust r i es .
5,2 Equilibrium and Comparative StaticsIn state zero product 2 is more profitable than 1 (Figure 5) . This is not an
equilibrium situation; producers can improve their posltion b,v moving from prod-uct 1 to 2. Such a movement will reduce p, and increase pr. In equilibrium itlvi11 not pay operators to shlft productionl Define r' as 'the profit of opera-tor k in industry i. A producer in i cannot improve '" his position if for him
lose and rvilL not
prices, P, and Pr,

oJE
Eo+U^Oro-ox=tl,t g
!Evco5.o_:p
3-dtE,ooU
MANAGEMENT, RISK AND COMPETITIVE EQUILIBR]I]'}4
"'+
The functions p9., .t state zero
i' i=t'z
Figure 5:
E(rk.) : E(rkjl
The sector is in equilibrium if the inequality holds for all k. An equilibriumis depicted in Figure 6.
In equllibrium, there are two break-even leveis of management: at m*
(16) p1E1(q) =p2E2(q) n=D*
and m* thus defines the boundary m -- farrners rvith m < m* produce product 1;those with m* < m produce 2. The second break-even point mo is defined by zeropro fit s
(17) trEr(l)=z *=ro
Producers with m < m- will not produce product 1; those with management abilityon the range tm^, m*o) will opeiate in industru L ln Figure 6, fr^'m.-- theshjft to " ' o-"qllribriun called into produ.tion 1omfnag"mentooperltors fromother industries who could not have survived econornically in state zero. The1evel m is defined bvo'rlel r = ,r r'n - 1 ,\av, " r].' G.,
Iimo
where u- is'1
-1m = ftr(0 - z/p-l)Gro ,t r
143

Y, K]SLEV
PQ ..Producers of
ProducersoI 2
m^mU+ ffi*1
Figure 6: Equilibrium configuration of the agricultural sector
m*
i19.) pl =.1 ( I z^-B r. - -1-1ar)-Y =.rQl 'mlo 'm
liote the factor 2 in the i-ntegrand in (19) ; it reflects the accurnulatlon ofproducers from both industries. The same factor ui11 apply similarly'in thecaiculation of Q^. (The integral in (19) assumes that potential producers ofm^ < m < m. are -a1so distributed according to N(m) = lm-t.)o+
BV substituting m^ fron equationr(I8t into C(y' in (5.] one finJs that form_ the se.lection " stress is e ' = .3-. The marginal producer rii I I break
"?"n o., the average, he rr'i11 lose a third of the time and mike profits 2/5 of
the time.
In a dynamic environment, r,ith farmers entering into and exiting from linesof activity, the selection stress is interpreted as the probabiiit)'that aproducer, chosen at randon, will attenpt to enter an industrl,, lose and fai1.Comparing the equilibrium to state zero, we note, that since pa is lorier and p,is higher the selection stl'ess is, in equilibrium, tighter in -industr)'2 and -looser in industry' 1 than in state zero.
The shift from state zero tc equilibrium also changcC riskiness, as defineciln ecluation (6). It is nor\'more risky for a retatively 1ow n farner to move fronproduct I to 2. In equation (6) for girrerr m anci ,
iG (')
'orp
z
m

T'ANAGEMENT, R] SK AND COMPETITIVE EQUILIBRII,'}I
The changes in the terms of trade made industry 1 less risky and industry 2 more
risky than in state zero.
The observed variance, as defined in equation (12) , also differs in equili-briun from the state zero variance. In industry 2, equilibrium variance isclearly lower than state zero variance -- both within firms and between firnsvariances are sma11er. The reduction in the variance in the value of the outputis even larger since p2 is sma1l at equilibriun than in state zero.
It is probable that the observed vatiance in industry 1 will grow with theshift from state zero to equllibrium -- within firms rrariance glows and p] rises--but since the variance between firms may be smal1er, this conclusion cann6t begeneral.
4. A Nunerical Example
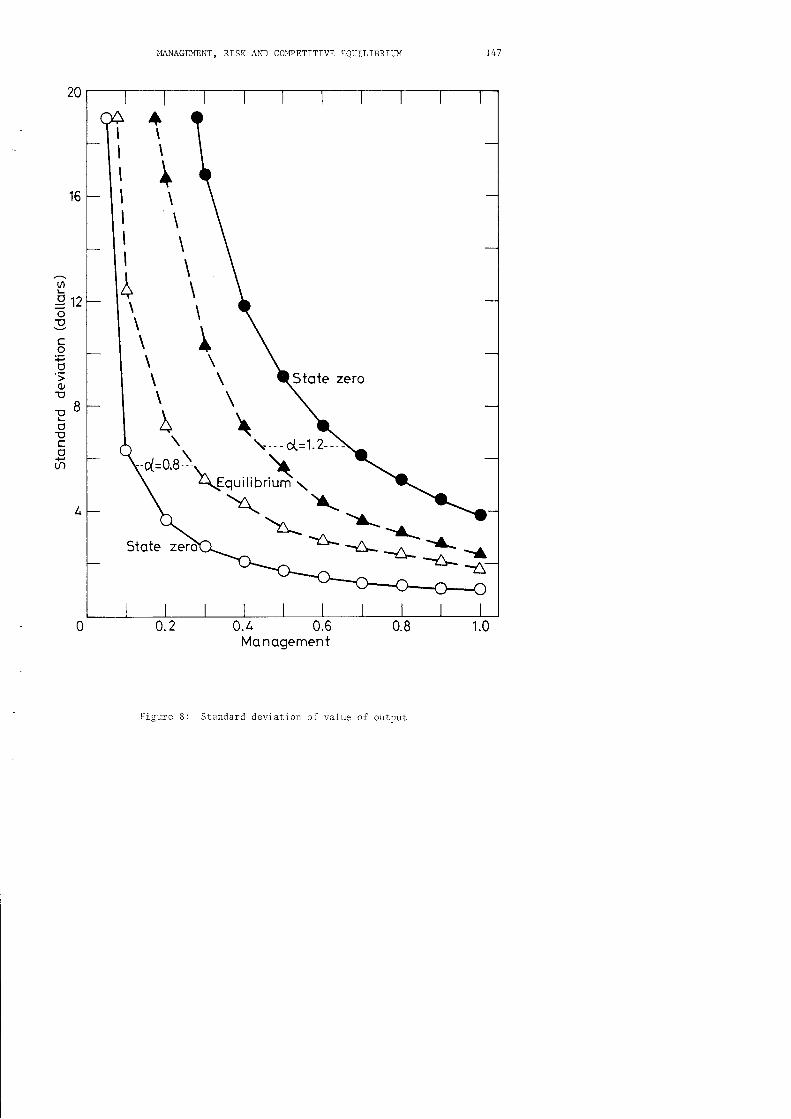
Consider 2 industries with the folloruing comnon parameters:
0=8)=lY= 1
B = 0'5z = 4.38
The industry-specific parameters are: o. q.11
lndustry I 0.8 6.78Industry 2 L.2 23.3).
With these specifications m+, the break-even point for both industlies atstate zero, is 0.2 with prices:
P1 = 1'00
P2 = 3'97
and p.E.(q) = p^E^(il = z = 4.38. See the solid lines in Figure 7.
To simplify the calculations, I assuned in this numerical example that m willalso in equilibrium be the loH,er bound management 1eve1. That is, new op".rto..rii11 not enter the industly even if profits are positive for a range of management
1eve1 lower than m.
The second equitibrium break-even point is n* = 0'3742' This is the dividinguianagement 1eve1 between the equilibrium allocation of producers to industries 1
and 2. See the broken lines in Figure 7.
Figure 8 clepicts standard deviation of do1lar value of output for bothindustries, p.m-oi, for state zero (so1id lines) and for equilibrium (brokenlinesJ. a
Table 1 presents a set of selected results of the numericat example. The
reading of the tabl.e can be exemplified with the average product variable (q. ' ) .
At state zero the average product per operating farn in industry 1 is 6'13;the same variable assumes the value of 5.19 in equilibrium. Per-farn product isLoh,er in equllibrium; it is only 84 percent of the state zero level. 0n theother hand, the equilibrim 1evel of industry 2 is 116 pelcent of the state zeroa\rerage product of that industry.
The magnitudes reported in Table 1 illustrate rve11, I tlust, the theoreticalanalysis o? the earlier sections of the paper. Since their meaning has mostlybeen discussed at length, I am leaving the detailed examination and interpreta-tion of the table to the interested reader.
145

Stote zero0( =1.2
Stote zero
q=1-2lndustr
G.a 2t,=og+f,o-520o
bO)JE16IJOJ
Uoo-6tz!tro+.fg8bFoOt(J't
0
-2L0
Monogement
Figure 7: Value of output as a function of management
20
16
I,IANAGEMENT, RrSK AND COI4PETTTTVE EQUTLTBRTW 147
0.2 0.4 0.6 0.8 1.0Mo nogement
Figure 8: Standard deviation of value of output
oL9tzo!
coFo';olJ
T)8LoEtro(,
I
I
I
I
I
I
llIA
+II
\\\
\i\\
Siote zero
\
\
\\^\-!-*-*t:t_^-$__
^ rlr )A-

Y. KISLE\'
o(4+
!o*3
Q@+*€94eC-i-CoOC
€c<oeN{eo,4-a€oc€
+O
sOAhniOCN+lC$@!4€N9nO@6;NOQiOOOIsONC
rO
rNi--€OOO$X'€ st-
O64-@ONalnOmO
€-9,€FOa_4rralO'5t-€€O+N@NOc
-ehoD6O€Accc
od{in--NNgtNONi+TO6D-S+N
-tc
,iLOI N!lNl:t Iil.,l'=lrlsl;l -
I
o o. Np dld ol;.1
l-
0a4.4!-a
aQC>I!-,c
o
Io
d
,
OsF
-o
InJF
,t,-lr
I
E
=-_z
l
;!
3
ll
:-!€O
O
N,.=:- .?
=r]-iE!\=P=qo^'E
L-e
) a E.r ! v d dd-oer5--.a!.ir-d[,th7FO-'-=,t.'t'p.llo{'+JjCOa
^ a ! . tr ! !^ ! 4 4 a,,-(.-f,i-tf-L
j I ) > = = -- )+ { L I O
CO=P?ra-rt)=-i-=t-x>.r a i p i i >
=a d p P
- x ) a O : X, ) < '!o'^o!J).-.--p P d ! i i ( p !o a p ! 3
ordo.rdnaq39i-l : t i a - | - aa u - I )-i>lu-1c=>tL,

Concludi
}IANAGEMENT, RISK AND COTIPETITIVE EQUILIBRII]M
Remarks
It'lost economic discussions of risk assume a given, subjective or objective,variability in production and returns and anaTyze the behavior of economic agentsin terms of decision theory and readiness to accept risk. An economic rmit isassumed to be able to affect its total risk position by selecting portfolios ofventure but otherwise it accepts passively whatever risklness nature offers.Perhaps t1pica11y, Arrowrs (1971) book deals rvith risk bearing, 0perationsresearch applications have followed the same lines.
The first purpose of this paper was to draw attention to the managerialabllity to affect risk and to its economic consequences. But the moral of thatstory is of wider implications: it means that subjective assessment of the worldlsubjective probabilities) and capricious preferences (utl lity) are, in a compe-titive environment, restricted by technology and rnarket forces. This seems oftento have been neglected (for example, by Anderson, Di11on and Hardacker (L977) andby Lin Deal and lvloore (1974), but not by Roumasset (1974). The analysis is alsopresented as a contribution toward the construction of a theory of econornicevolution (Alchian (1950), which will have though, by its ver,v nature, to be adl.namic theory.
AC KNOI{I,FDG F,N{ENT
An earlier version of this paper Nas written in the Department of Agriculturalard Applled Economics, the University of }linnesota, St. Paul, Minnesota. InIsrael the study was part11, supported by a grant from the Ford Foundation throughthe Israel Foundation Trustees.
Conrnents and suggestions by Nleir Kohn, Yakir Plessner and members ofseminars at li{innesota and Iowa are greatly appreciated.
REFERENCES:
[1] Alchian, A.A., Uncertainty, Evol.ution, and Economic Theory, Journal ofPolitical Economy,58 (1950) 271-222.
[2] Anderson, Jock R., Di11on, John L. and Hardaker, J. Brian, AgriculturalDecision Analysis (Iowa University Press, Ames, 1977).
[3] Arrow, Kenneth J., Essays in the Theory of Risk Bearing (Ilarkham, Chicago,1971).
Ia] Lin, i{., Dean, A. and Nloore, C.V., An Empirical Test of Utility vs. profitIlaximization in Agricultural Production, American Journal of AgriculturalEconomics, 56 (1974) .197-508.
[5] Pope, Rulon D. and Just, Richard E., Production Function Estimation andRelated Risk Consideration, American Journal of Agricultural Economics,61 (1979) 276-284.
[6] Rao, C.H. Hanumantha, Uncertainty, Entrepreneurshlp and Sharecropping inlndla, Journal of Political Economy l9 (1971) 578-595.
[7] Roumasset, James A. Rice and Risk: Decision llaking Among Low Income Farmers(North-Ho11and, Amsterdam, 197,1) .
t49

r50 Y, KISLEV
APPENDIX: Industry wide variance of production.
(A.1)- b.._ 0
"1, = i *@ i tror (q - q..;2ay d,aab
= J Pi-t*rt(s-q.,)2 * (q.,-q. .)2'2(c-c.,)(r.,-Q..)l dq dm
b
= f [s,r,o*ra,o1 * 2l y3i ,,o,fQr.,-cc.. -qi* * e.,,e..) dQ dm
aD a aD -6
=fltr.o+SB.6Jat)
(A.2)
(A. 5)
h .)sw , = I N(n) I (q-q. l' dq dmab '' "m-
ht -t\ I=Jm (-;-;-Jdma im
rrI h'-a'=.;---.?-x's't _.
= --=- (1og b - log a)
E = I - B-2a
h -o )SB.= / m " (v - v )- dm
aba
Define
u-r-p-u
66. b -ao = ----T-=1ogD-1oga
qR -1 ,,b6-a -A2,""ab 2' E 'lA aD
E+2o.17
a + )^ = l
B+o. 17
B+a= 1
(A.4) 9+2al\
lA2=--t(logb-loga-i-) B+2n=I ab
Two cases apply if I plus 2a I 1, either B + o I I 61 g + a = 1.

Prices versus Quantities: The Political Perspective
Israel Finkelshtain and Yoav Kislev Hebrew University
Regulation regimes subject to the influence of interest groups are compared. It is shown that the allocation of the regulated com- modity varies with the implemented control and that the advantage of prices (vs. quotas) increases with the elasticity of the demand for or the supply of the commodity and decreases with the number of organized producers in the regulated industry. Control regimes can be ranked for negative, but not positive, externalities. Finally, a control regime leading to a more efficient commodity allocation also entails using fewer resources in rent-seeking activities.
I. Introduction and Summary
Given that government intervention is subject to lobbying and politi- cal pressure, when is regulation by prices the preferred regime and when is quantitative control adequate? The neoclassical answer to the control dilemma is that price and quota regimes are identical in their effect: both yield the same resource allocation and social
welfare level. But, as Weitzman (1974) has already shown, the equiva- lence of the controls does not hold where information is imperfect
and monitoring incomplete.' We focus on a different issue: the polit- ical aspect.
We analyze a single regulated industry, employing a factor with
We acknowledge with thanks useful comments from Arye Hillman, Yair Mundlak, Martin Paldam, Gordon Tullock, Norbert Wunner, Pinhas Zusman, and a journal referee.
1 For extensions and applications of Weitzman's analysis, see, e.g., Fisher (1981) and Cropper and Oates (1992).
ournal of Political Economy, 1997, vol. 105, no. 1] ? 1997 by The University of Chicago. All rights reserved. 0022-3808/97/0501-0003$01.50
83
This content downloaded from 132.64.29.148 on Thu, 21 Sep 2017 05:39:03 UTCAll use subject to http://about.jstor.org/terms

84 JOURNAL OF POLITICAL ECONOMY
negative or positive external effects. The political equilibria, and
hence the magnitude of the distortions, differ with the external ef-
fect and the implemented control. Under quota and when taxes are imposed to reduce negative effects, the employment of the con-
trolled factor will lie between the private profit-maximizing utiliza- tion and the social optimum; with subsidies (when the effects are positive), there is a political struggle for higher payments, and equi- librium allocation will be greater than both private, noninterven- tion, utilization and the social optimum. In this case, resource alloca- tion in the political equilibrium may be worse than free-market factor utilization.
It is further shown-for negative externalities-that the compara- tive advantage of either of the control regimes depends on a factor involving the share of organized producers in the industry, the value
of the demand elasticity for the regulated good, and the tax rate. A price regime yields a more efficient political equilibrium when this factor is less than one. If this is not so, quota is the more efficient instrument. The preferred control cannot be unambiguously char- acterized when the external effects are positive. Finally, describing the political process as a menu auction with a single industrial lobby, we show that the relatively more efficient regime in terms of resource allocation induces a lower level of rent-seeking expenditures.
II. Society and Polity
Regulation is called for where external effects exist: in production
or consumption, where scale economies lead to a natural monopoly, or in the provision of public goods. The analysis in this paper is confined to regulation of a factor of production with externalities affecting consumers or producers elsewhere in the economy; they do not affect producers in the regulated industry. An example of a
negative externality would be an irrigation project lowering the wa- ter table of a nearby urban center. An example of a positive effect would be the utilization and disposition of reclaimed sewage. Re- stricting the discussion to an input does not affect the generality of the conclusions.
The producers using the regulated factor are assumed to behave
rationally and disregard externalities associated with their activity. In a free market, the producers tend to overutilize factors of produc- tion with negative effects and underutilize factors with positive ef- fects. A social planner, taking into account both the value of produc- tion in the controlled industry and its effect on others, can
This content downloaded from 132.64.29.148 on Thu, 21 Sep 2017 05:39:03 UTCAll use subject to http://about.jstor.org/terms

PRICES VERSUS QUANTITIES 85
determine socially optimal utilization of the factor. (Income distri- bution is disregarded in the analysis.)
The government in our analysis is a political entity whose own utility is affected both by social welfare and by political rewards or contributions. The producers and the government (the politicians), being engaged in political give and take, constitute a polity, and the ensuing allocation reflects the equilibrium reached in the political struggle. The government willingly accepts rewards and bends its policy but is not powerless. We assume that if a political agreement is not achieved, socially optimal resource allocation is enforced. The producers may also retreat to the social allocation and thus deprive the politicians of the rewards they desire. The social optimum is the threat point of the political game.
The producers either operate individually in the political arena or are organized into lobbies. We analyze the effect of collaboration in the influence groups but do not discuss the structure of the lob- bies and modes of collaboration. Also, by our assumption, the indi-
vidual political contribution is not determined in the political equi- librium; it is left to the lobby to charge its members. Political rewards may come in all shapes and forms: monetary political contributions (or even outright bribes), demonstrations, letter writing, and assis- tance in campaigns. They may be negative when the producers pun- ish the government or demonstrate against it. Sometimes the politi-
cal rewards may enhance welfare-the welfare of the receiving politicians or in a wider sense, for instance, when a builder offers a new school in return for a desired permit.
The discussion in the paper is limited to the effect of political contributions on government regulation; the nature of the rewards and their wider implications are not analyzed. As in Grossman and Helpman (1994), only "linear," money-like rewards are considered, and the political influence technology is restricted to exhibiting con- stant returns to scale. This assumption simplifies the analysis consid- erably by permitting recursive calculation of the variables making the political equilibrium. The use of the controlled factor is set in the first stage, and the political rewards-the distribution of the po- litical surplus-are determined in the second stage. An important advantage of the linear model is that factor allocation is the same for a variety of political economies. The political contributions, on the other hand, are model-specific. We remark on possible general- izations in the concluding section of the paper (Sec. VIII).
The political process we consider is embedded in a "constitution"
by which the control regime may be either a quota or a price regime. The constitution is accepted as predetermined, it is not debatable,
This content downloaded from 132.64.29.148 on Thu, 21 Sep 2017 05:39:03 UTCAll use subject to http://about.jstor.org/terms

86 JOURNAL OF POLITICAL ECONOMY
and we do not consider here the political process leading to its estab- lishment.2
Our main concern is to compare a quota with a price regime.
Under quota, the producers must comply with administrative regula- tions. With price control, they either pay a tax or receive a subsidy and freely choose the quantity of the factor they use. Focusing on the efficiency of the controls, we eliminate income differences by
introducing revenue-neutral policy shifts; that is, lump-sum pay- ments are seen as balancing taxes or subsidies. For example, when the change is made from a quota to a tax, the government pays up- front the value of the taxes that will be applied in the political equi-
librium. A shift to a subsidy regime entails a compensating lump- sum tax. Similarly, a move from a tax to a quota control is associated
with a lump-sum payment to the government. The compensation is not debatable, and the producers cannot expect to affect it, even if the magnitude of the tax or subsidy is modified in the political
negotiations that follow once the control regime has been in place and the compensation scheme implemented.3
Compensations of this nature are observed in reality. The govern- ment of Israel, for example, is at the present time "purchasing" production quotas in agriculture in an attempt to gain political ac- ceptance of steps toward the elimination of planning and adminis- trative intervention in farming.
III. Recent Theories of Political Economy
Political processes affecting public intervention in the economy have been the subject of intensive literature. Examples include Zusman
(1976) in agricultural planning; Rodrik (1986), Hillman (1989), and Grossman and Helpman (1994) in the context of international trade; and Scarpa (1994), who studies the consequences of political
influence by a public utility. These studies analyze political equilibria for particular control regimes. In contrast, we attempt to compare the performance of alternative politically influenced regimes.
The political process may be viewed in many ways. Following the
2 A similar approach is taken by both Rodrik (1986) and Grossman and Helpman (1994), who view the evolution of the political process as proceeding in two stages. In an analysis of the political choice of regimes, Buchanan and Tullock (1975) con- cluded that politicians will, generally, prefer quantitative controls. These authors, however, ignore the possibility that rent-seeking activities will modify the level of controls once they are implemented.
3 Lump-sum compensating payments eliminate income effects of control regimes and facilitate an analysis of net allocation effects. Sometimes, however, a crucial consideration in the choice of a control is revenue raising and cost covering. These considerations are disregarded in the present analysis.
This content downloaded from 132.64.29.148 on Thu, 21 Sep 2017 05:39:03 UTCAll use subject to http://about.jstor.org/terms

PRICES VERSUS QUANTITIES 87
Peltzman (1976) tradition, Hillman (1989) sees the government as setting policies to maximize a political support function that trades welfare of voters with divergent interests. In Zusman (1976) and Scarpa (1994), the political process is a Nash (1950) bargaining game, with politicians and lobbies negotiating policy parameters and political contributions. Grossman and Helpman (1994) describe the political process as a menu auction.
Although these models differ, they share a common property: The equilibrium reached is politically efficient and is located on the poli- ty's contract curve. Moreover, as we show shortly, in the case of linear political rewards, the allocation of the controlled factor is indepen- dent of the magnitude of the political contributions, and all the models above predict identical allocations (Hillman does not specify
rewards explicitly). We make use of this property in the next four sections of the paper.
IV. The Model
Net income of a producer in the regulated industry is
yi = 7ti(q?) - Ci- tqt +R (1)
where q marks the ith producer's utilization level of the regulated factor and the magnitude t marks the tax imposed by the govern-
ment (for a subsidy t < 0). The compensation payment is R, and it is equal to the equilibrium level of tq. The variable c indicates political contribution. The function nit(qi) is the ith producer's profit in the production activity; it is concave and subsumes the prices of goods
other than the regulated good. It also subsumes the private market price, p, of the regulated factor, but taxes or subsidies are not in-
cluded in ii. The industry supplying q is competitive and is character- ized by constant returns to scale with a perfectly elastic supply. There are Nproducers in the regulated industry, and total factor utilization and political rewards are given, respectively, by
N N
Q qi C ci. (2) i=1 i=1
If only K producers participate in the industry's lobby (K ' N), ci may be zero for some values of i.
The second sector, the government, is viewed as maximizing the sum
W= V(q) + aC, (3)
where V(q) is social welfare defined over the vector q = ql,..., qN,
This content downloaded from 132.64.29.148 on Thu, 21 Sep 2017 05:39:03 UTCAll use subject to http://about.jstor.org/terms

88 JOURNAL OF POLITICAL ECONOMY
and the constant a > 0 represents the preference of the government for political bribes relative to public welfare. It can also be seen as standing for the political power of the influence group in the indus- try. Lobbies in different industries may have different a values.
The welfare function, V, is given by
N M
V(q) = > ci(qi) + E (4) i=1 j=1
where ji(Q) is the money-metric utility function of the jth person who is affected by the external effects of the regulated factor. The
function g increases with Q for positive externalities and decreases for negative effects. Utility is also defined over the vector of prices of consumption goods, but under the assumption of a small econ- omy with all goods traded, prices are constant and are not repre- sented explicitly in the function.
It is assumed that pi is concave in Qand hence in each qi. Similarly, since Vis the sum of concave functions (in each qi), it is a concave function itself. All functions are second-order differentiable, and in- tenor solutions are assumed throughout.4 It is also assumed that en- forcement of the regulation instrument is costless.
Because of externalities, optimal levels of q' from the points of view of the producer, qtr. and the society, q', do not agree. That is,
qtr = argmax [n(q)] ? q' = argmax[V(q)]. (5) qi qi
This, of course, creates the conflict that induces rent seeking and political rewards.
As indicated, producers in an industry may operate in the political arena individually or in the industrial lobby. We assume that a lobby maximizes total income of the members in the group:
K
Y = yk. (6) k=1
The formulation is general: an industry may have just a single pro- ducer (N = K = 1); this may be a monopsonist in the use of the regulated factor, perhaps a public utility. Alternatively, some or all
4Among other things, interior solutions mean that all producers use positive quantities of q at any of the prices considered.
This content downloaded from 132.64.29.148 on Thu, 21 Sep 2017 05:39:03 UTCAll use subject to http://about.jstor.org/terms

PRICES VERSUS QUANTITIES 89
producers in an industry may form an influence group and lobby for their interests.5
One difference between the regimes affects behavior in a crucial way. Taxes are uniform, and in an industry with many producers, both those who lobby to modify the policy and those who do not face the same tax. We show that an industry with a comparatively large share of free riders is politically weaker, but, as indicated, we do not analyze the internal structure of the lobby groups and the forces that keep them together.
Under a quantity control, on the other hand, a producer who does not engage in political activity will be assigned the social quota (with negative externalities, nonparticipants may even get zero quotas to balance overutilization by the political activists). There is, therefore, no free riding in the political equilibrium of a quota regime: all pro- ducers participate and are members of the industrial lobby.6
V. Equilibrium Utilization of the Regulated Factor
In the first stage of the recursive calculation of the political equilib- rium, we set the allocation of the regulated factor. This first stage is described here. The contributions by the K politically active pro- ducers are determined in the second stage, which is presented in Section VII.
Let y mark a common label for the allocation parameters in the two alternative regimes considered in the paper: a quota system in which y = q = q l, .I. ., qN; and indirect control, a price regime with a per unit tax or subsidy, y = t. Exogenous to the political equilib- rium are the production technology, prices, private and social pref- erences, and the constitution specifying the instrument of regula- tion.
An efficient agreement between the government and the produc- ers, located on the polity's contract curve, can be characterized by the necessary conditions for an internal solution to the following constrained maximization problem:
yPO, cP0 = argmax W(y, c) Y, (7)
subject to Y(y, c) ' Y.
I With linear political rewards, the analysis is not modified by the number of lobby groups in the industry. For simplicity and brevity, the discussion is conducted in terms of a single lobby.
6 Similar considerations underlie Rodrik's (1986) analysis of trade with either a uniform tariff or firm-specific subsidies.
This content downloaded from 132.64.29.148 on Thu, 21 Sep 2017 05:39:03 UTCAll use subject to http://about.jstor.org/terms

90 JOURNAL OF POLITICAL ECONOMY
In equation (7), Y, defined as in (6), is the reservation utility, the alternative income of the lobby members in the event that an agree- ment is not reached, and c is the vector of political rewards. We commence with a quota control.
A. A Quota Control
The government sets quotas, q, the magnitudes of which are subject to political pressure. In this case, i = 7I(qi) - c', and a politically efficient agreement concerning q satisfies (7) and is characterized by the following N first-order conditions (derivatives are marked as subscripts):
M
7rq +a) =-Z IQ(Q), i E {1, ... , NJ. (8) j=1
Remarks.- (a) The political rewards, ci, do not appear in the nec- essary conditions for the determination of the quotas. This verifies our earlier assertion on the recursive nature of the solution of the political equilibrium. (b) The utilization of the regulated factor like- wise does not depend on the compensation, R. (c) Equations (8) will be the same whether the producers in the industry are unionized in a single lobby or in several groups or whether they operate individ- ually. Political organization does not affect the equilibrium reached. These three features arise from the linear nature of the political reward system. The equilibrium would have been different with non- linear rewards: if the political action was subject to economies or diseconomies of scale.
A useful result that emerges from condition (8) is that, as the
right-hand side, Xj', g4Q(Q), is identical for all i, 7ic = 7c, = 2tq for all i, jE {1, ...,NI (similarly, Vqi = Vq = Vq for all i, j E {1, . NJ). In words, the value of the marginal profit (VMP) of the regu- lated factor is the same for all producers. The political game distorts the level of aggregate factor utilization, but allocation among pro- ducers is efficient. This is a reflection of producers with a higher VMP pressing harder for quotas.7 When resources are administra- tively allocated, the political process replaces the market in securing between-firm efficiency.
Because of the signs of the derivatives WjQ, equation (8) implies that for negative (positive) externalities 2t' > (<) 0. In addition, equations (8) can now be rewritten as
'The argument that producers with a higher VMP press harder relies on a "truth- ful" property, namely, that producers struggle more-offer higher rewards-for more valuable political favors. We comment further on this property in Sec. VII.
This content downloaded from 132.64.29.148 on Thu, 21 Sep 2017 05:39:03 UTCAll use subject to http://about.jstor.org/terms

PRICES VERSUS QUANTITIES 91
TABLE 1
PROPERTIES OF THE POLITICAL EQUILIBRIUM
MARGINAL
CONTRIBUTION OF q
Social Private QUANTITY
Negative Externalities
Quota/tax Vq<0 7cq>0 QS< QpO< Qpr
Positive Externalities
Quota Vq>0 7rq<0 Qpr< QPO< QS Subsidy Vq < 0 lrq < 0 Qpr < QS < QPO
Vq= Wtcq (8')
which implies that for negative (positive) externalities Vqi < (>) 0 for all i e I, . . . , N). Since all VMPs are equal, all the q values move together, and it follows unambiguously from the sign of Vq that for negative (positive) externalities, qit > (<) q for all iE {1, . . . , NJ. Thus, under quota, the political equilibrium is a "compromise": With negative externalities, factor utilization exceeds the social opti-
mum (where Vq = 0) but is lower than free-market use (character- ized by Icq = 0). With positive externalities, utilization at the political equilibrium is smaller than socially optimal and larger than the pri- vate profit-maximizing quantity. These findings are summarized in the first two rows of table 1.
The political equilibrium is depicted graphically for a single pro-
ducer and negative externalities in figure 1. The graphs WI, W2 and Yl, Y2 are the government's and the producer's indifference curves; their slopes are - Vq/a and qrc, respectively. (For the government, the curve is drawn with all other producers at the equilibrium con-
figuration.) Because of differences in political payments, W2> WI and Y2 > yi. Each indifference curve of the government has a mini- mum at q = qS, the socially desired level, and the point q = qS, c = o is the disagreement threat point. The equilibrium quota is qPO, and the segment [a, b], between indifference curves passing through the origin, marks the core of the political game.
B. Indirect Control
A pure price control is either a tax or a subsidy. In this case, - r0(q') - tq' - c' (R is omitted), and the producer is free to utilize any quantity of the factor. The private first-order condition charac-
This content downloaded from 132.64.29.148 on Thu, 21 Sep 2017 05:39:03 UTCAll use subject to http://about.jstor.org/terms

92 JOURNAL OF POLITICAL ECONOMY
C
The Polity's
Contract Curve
W~ W y~~~~~~~~~~
s a pr q2
qS qP0 qpr
FIG. 1.-Construction of political equilibrium: negative externalities
terizing the producer's choice of q' is then
isq=t, (9) which implies
aqil q= _ 1. (9')
at t0q
By (9), for t ? 0, qPO < (>) qPr for negative (positive) effects. Solving (7) with respect to t and c, using equation (9), yields the
condition that characterizes the political equilibrium under a price regime:
j Vq i - at, (10) i=1
where QK is the aggregate factor utilization by the members of the industrial lobby. The marginal effect of a tax on the whole industry is balanced against its effect on the active group whose utility is re- served on the political contract curve. The remarks following equa- tion (8) on the independence of allocation apply here too. Also, producers in an industry controlled by prices may operate in several groups; their contributions will be aggregated by the receiving politi- cians in the government, and their effect will be a function of the sum. In this situation, K stands for the total number of participants in all groups.
This content downloaded from 132.64.29.148 on Thu, 21 Sep 2017 05:39:03 UTCAll use subject to http://about.jstor.org/terms
PRICES VERSUS QUANTITIES 93
It follows from iC' = t, for all iE {1, . , NJ, that
m
Vqi=q+ Q Vq i E Z{ .. .. N}
and that (10) can be written as
Vq= ( aaQ (11)
By concavity of i7, ir0 < 0; then by (9'), at/aQ < 0, implying that Vq < 0 regardless of the sign of 2q. Thus, under a price control, the producers overutilize (socially) the regulated factor both when the external effects are negative and when they are positive. With nega- tive externalities, the political pressure is to reduce the tax. With positive effects, it is to increase the subsidy up to and above the so- cial optimum (table 1). Consequently, while under a quota regime the political equilibrium is always a compromise (between the free- market allocation and the social optimum), in the presence of politi- cal power and with positive external effects, a price regime may yield an allocation that is socially worse than the free-market utilization of the regulated factor. In the presence of political pressure, the intervention of an otherwise benevolent government may detrimentally impair resource allocation.
That taxes and subsidies differ in their effects on resource alloca- tion modifies-for a political economy-the Coase (1960) and Weitzman (1974) conclusion that property rights do not affect the nature of the solution to an externality problem. If the producer owns the right to pollute the air, to take an example from these references, q will stand for the resources going into pollution pre- vention, and their use will have positive externalities and will be sub- sidized. If the public, represented by the government, owns these rights, the polluters will be taxed. With political pressure, resource allocations will differ. In the first case the equilibrium will be charac- terized by overinvestment in pollution prevention; in the second it will be suboptimal.
Another useful way to write equation (11) is
Vq a a q, (12) s11
where s = t/ (p + t); rj is the factor demand elasticity, defined at the price the producer actually pays, p + t; and a = QK/ Q is the share of the regulated factor utilized by the producers in the lobby
This content downloaded from 132.64.29.148 on Thu, 21 Sep 2017 05:39:03 UTCAll use subject to http://about.jstor.org/terms
94 JOURNAL OF POLITICAL ECONOMY
group.8 The formulation of (12) is utilized in the analysis to follow.
Expressing Vq in its extended form, we can rewrite equation (12) as M
E = aq t ) (13) i=1
which implies that, for positive externalities and a price regime, internal tangency solutions are confined to the region in which aa/srl < 1.
VI. Comparative Efficiency of Factor Utilization
We are ready now to turn to the question of prices or quantities. To examine this, we make the following definition: a control yields a more efficient utilization of the regulated factor than the alternative regime if and only if it yields a higher level of social welfare, V(q).
A. A Formal Proposition
With negative externalities, both under quota and in a tax regime, the quantity of the regulated factor lies between the privately desired level and the social optimum. This "closeness" of the equilibria en- ables an analysis of the comparative performance of the alternative regimes. Such an analysis is impossible for a positive externality be-
cause of the distance between equilibria in which, under a quota,
qi, i E {1, ... , NJ, are lower than the social optimum and with a subsidy are above the optimum. These considerations are reflected in the following proposition, which summarizes the principal find- ings of the paper.
PROPOSITION 1. Suppose that the government is regulating the utilization of a factor by either a price or quota control. The factor is used by many producers. With quotas, all producers are repre-
sented in the political process; with prices, not all producers are nec- essarily members of the industrial lobby. Then (i) with a negative externality, a price (quota) regime yields a more efficient factor utili- zation if and only if I a/il sI < (>) 1 (the inequality is evaluated at the price regime equilibrium); (ii) with a positive externality, a price regime yields a larger factor utilization than under quota; efficiency comparison is, however, inconclusive; (iii) under both types of exter- nalities, the efficiency of a price relative to a quota control increases
'With a subsidy (t < 0), s can be either negative or positive. When I tI < p, s < 0; when ItI > p, s > 0. In the latter case, calculated i1 > 0; in both cases, sl > 0. For completion, we set sil = 1 for I I = p.
This content downloaded from 132.64.29.148 on Thu, 21 Sep 2017 05:39:03 UTCAll use subject to http://about.jstor.org/terms

PRICES VERSUS QUANTITIES 95
with the elasticity of the demand for the regulated factor and de- creases with the share of organized producers in total production; and (iv) the efficiency of both controls increases with the ethical norms of the politicians, 1/a.
Proof. To prove part i, denote E = I a/il s . For E = 1, resource allocation under quota is identical to allocation in a tax regime. To compare the controls, consider a shift in a given industry from a quota to a tax. Since the move occurs between equilibria, the com- pensation (R) is implemented and the only difference in the first- order condition occurs in the value of E. Examining (8') and (12),
one realizes that, for E < 1, Vq in (12) is smaller in absolute value than in (8'); a tax regime is then comparatively more efficient. The inequality is reversed for E > 1, as required for the proof. Part ii is proved by noting that because of the differences in Vq values in table 1, comparative advantage cannot be determined. Parts iii and iv are proved by examination of (12). Q.E.D.
We now discuss interpretations and elaborations.
B. Demand Elasticity
The intuition behind the role played by demand elasticity in compar- ing efficiency of the regimes in part i of proposition 1 can be ex- plained conveniently for a = 1, p = 0, and s = 1; that is, the industry consists of a single producer or of an all-embracing lobby, there is no charge for the factor q under a quota regime, and the tax is the
entire unit price under a price regime. For this situation, qo in figure 2 is an initial quantity, either determined by a quota or reached by the producer when the tax was set to to.
Consider the rent-seeking effort that increases the quantity to qi. Depending on the control, the change may be achieved by either
increasing the quota itself or reducing the tax to tj. The correspond- ing gain to the producer is
price regime: A + B,
quota regime: B + C,
difference: A - C.
With unitary elasticity, A = C and the difference vanishes, the re- gimes are equivalent at the margin. The returns to marginal political
efforts of equal quantitative effects are identical. Alternatively, if the factor demand is elastic, A < C, the returns under a price regime are smaller than under quota. Consequently, under a price regime the political struggle is less intensive and the equilibrium is closer to the social optimum. Similarly, for part iii, the more elastic the
This content downloaded from 132.64.29.148 on Thu, 21 Sep 2017 05:39:03 UTCAll use subject to http://about.jstor.org/terms

96 JOURNAL OF POLITICAL ECONOMY
t
to
A B ti
C fIq tll n~~~~~~q q0 q1
FIG. 2.-Gains from political influence: prices vs. quantities
demand function passing through (qo, to), the smaller the area A + B and the less intensive the political struggle. In figure 1, more elastic demand is expressed in smaller slopes of the producer's indifference curves and a move of the political equilibrium quantity to the left.
These findings may seem to contradict the established Ramsey- Boiteux tradition (Atkinson and Stiglitz 1980) of optimal taxation by which the more elastic the demand (or supply), the more socially harmful an intervention in prices. The apparent contradiction is re-
solved by recognizing that when taxes are levied to raise revenue, optimal rates minimize their effect on resource allocation; here the sole purpose of taxes is to modify the use of resources.
C. Organization of Producers
With a single producer, a = 1 and the difference between the con- trol regimes is reflected only in the size of the product srj. As we saw earlier, under quota, all producers are politically active and the degree of their organization does not affect the equilibrium reached. Similarly, if in a tax regime all producers are organized in a lobby and operate in unison, a = 1 and the number of producers or their organizations does not affect equilibrium. But a price re- gime is conducive to free-riding.
The explanation of the importance of cooperation in determining
This content downloaded from 132.64.29.148 on Thu, 21 Sep 2017 05:39:03 UTCAll use subject to http://about.jstor.org/terms

PRICES VERSUS QUANTITIES 97
the political equilibrium of an industry is simple, and the situation is familiar to observers of administrative controls. With a quota, every producer tries to increase his or her own utilization of the controlled
factor as does a lobby arguing for its members. The political activists
present convincing arguments aplenty. For the government, it is comparatively easy to yield to the pressure of a particular individual or lobby; the quantitative effect is relatively small. Alternatively, in a price regime with a uniform tax rate, the government stands firmer: a concession to one producer or group is a concession to
the whole industry. Consequently, the greater the amount of free- riding in a price regime, the stronger the comparative social advan- tage of this control.
According to conventional thinking, heterogeneity of the produc- tion units argues in favor of price control, since prices, being uni- form, economize on information; with heterogeneous producers,
efficiency calls for unequal, individually tailored quotas. This argu- ment was qualified by Weitzman (1974), who noted that for iterative planning there is no significant information difference between a price and a quota regime. In a political environment, between-firm allocation is efficient, and heterogeneity in production affects equi- librium allocation only to the extent that it may lead to a looser
organization and to a larger number of free riders.
D. A Caveat
The intuitive interpretations, and indeed proposition 1 and particu- larly its part i, should be accepted with care. The proposition is de- fined for the conditions of a political equilibrium. The equilibrium ratio s is endogenously determined, and the elasticity of the factor
demand is also, in general, an endogenous magnitude. These vari- ables are components of a political equilibrium. The proposition, as indicated, characterizes the equilibrium. If in equilibrium (with
negative externalities) I (Y/il s I < 1, price control dominates. It may, however, happen that even for an elastic demand and a compara- tively small lobby, the equilibrium value of s will be so small that
I al/s I> 1, and then a quota regime will be more efficient. The situation is simpler for an inelastic demand and a = 1; it is then assured that 11/11 sI > 1, and a quota control clearly dominates.
VII. Political Contributions
While the characterization of the allocation parameters in the first stage of the calculation of equilibrium was based solely on the com- mon property of political efficiency, the contributions depend on
This content downloaded from 132.64.29.148 on Thu, 21 Sep 2017 05:39:03 UTCAll use subject to http://about.jstor.org/terms

98 JOURNAL OF POLITICAL ECONOMY
the specific political process. The analysis in the paper is confined to Grossman and Helpman's (1994) model, which employs the pro- cedure of a menu auction. As before, the analysis is conducted under the assumption that all organized producers are members of a single industrial lobby and that under a price regime some producers may not participate in the political game. As indicated earlier, with our structural assumption of constant political cost and effect, only the aggregate reward, C, is determined in the political equilibrium; the individual c values are set by the lobby. The model conceptualizes the political process as a two-stage noncooperative auction game. In the first stage, lobbies, which may have opposing interests, offer political contributions for changes in policy parameters. In the sec- ond stage, the government chooses parameters that maximize its utility, which is, as in equation (3), a weighted sum of social welfare and political rewards. The perfect Nash equilibrium of this game is not unique, but "truthful" strategies lead to unique Nash equilibria that are coalition proof and focal.9 With a single lobby, which is the situation we analyze, the government obtains only its reservation util- ity, and all surplus in the polity is received by the producers.
The government reservation utility is given by V(qs,... , qs). Ac- cordingly,
C V(qs. . . ,qs) - V(ql, * * q;P). (14) In figure 1, the payment to the government is represented by the distance, on the contract curve, from the q axis to the point a. The political contributions grow with the deviation of equilibrium alloca- tion of the regulated factor from the social optimum.
Using equations (14), we make the following conclusion. PROPOSITION 2. Consider the setup of proposition 1 with negative
externalities, and suppose that the political process follows the pro- cedure of a menu auction. Then a quota (price) regime induces a larger level of political contributions if and only if I a/il sI < (>) 1.
If the political process follows the procedure of a menu auction, then proposition 2 and part i of proposition 1 complete the main answers to the question of prices or quantities: (a) the comparative advantage of either of the regimes can be determined unambigu- ously for negative externalities; (b) with negative externalities, the condition for price regimes to be more efficient both in yielding resource allocation closer to the social optimum and in saving on
9 Marginally and when contribution schedules are differentiable, all politically efficient equilibria are truthful: at points of tangency in fig. 1, producers under quota offer Dc/lq = lsq; in a tax regime, they offer ac/at = q. In both cases the marginal contribution is equal to the true value of an additional unit of the negoti- ated control.
This content downloaded from 132.64.29.148 on Thu, 21 Sep 2017 05:39:03 UTCAll use subject to http://about.jstor.org/terms

PRICES VERSUS QUANTITIES 99
political pressure and rewards is that lo/lisl < 1; and (c) with posi- tive externalities, the comparative efficiency of either of the regimes cannot be determined in general terms.
VIII. Concluding Remarks
Government intervention invites political pressure, and a political environment affects the efficiency of the instruments of public regu- lation. Our principal findings were that conditions for preference
of a tax or a quota regime can be identified for negative externalities, but not for positive effects, and that a regime with more efficient factor allocation will also have lower levels of political activity. More- over, the comparative advantages of the control regime-always in terms of factor allocation and in many cases also in terms of political contributions-are the same for markedly different modes of politi- cal activity.'0
Simplifying and clarifying, we chose to restrict the discussion to linear political influence structure. But the cost of political activity can increase, for example, when it becomes more and more difficult to mobilize demonstrators and other activists, and it can decrease when a large lobby is more effective than the sum of its members. Likewise, the marginal political influence may decrease with the amount of the political contributions or with the intensity of the demonstrations. Incorporating decreasing or increasing cost and in- fluence, we have found elsewhere (not as yet reported) that alloca- tion and contributions are determined simultaneously; more inter- esting for the purpose of the present analysis, the major findings of the paper are left intact and are not affected by the adoption of the simplifying assumptions. The robustness of the conclusions in the face of changes in structural assumptions and in the political mecha- nism augments our confidence in the generality of our findings.
The analysis can be expanded in several directions. An immediate extension would be to apply it to the external effects caused by a product and not a factor. Another would be to examine the finding that the conclusions are the same whether the industry has one lobby group or several. In a nonlinear structure, lobbies may compete, and
one may be stronger than the others. A further possibility envisages that consumers and socially conscientious individuals-not only pro- ducers-may organize in influence groups and counterbalance, at least partly, the political pressure of the industrial lobbies. One may
'1 In a working paper version of this article (Finkelshtain and Kislev 1995), we considered also the Harsanyi-Zusman model of cooperative bargaining (Zusman 1976) and reached similar conclusions.
This content downloaded from 132.64.29.148 on Thu, 21 Sep 2017 05:39:03 UTCAll use subject to http://about.jstor.org/terms

100 JOURNAL OF POLITICAL ECONOMY
also consider the imposition of mixed control combining a binding quantity control with some level of taxes. In a preliminary analysis in this direction, we found that an optimal policy combination can
be identified and that it is not always true that an increased reliance on prices, in a mixed regime, improves allocation efficiency. We hope to examine these and other possibilities in the future.
References
Atkinson, Anthony B., and Stiglitz, Joseph E. Lectures on Public Economics. New York: McGraw-Hill, 1980.
BuchananJames M., and Tullock, Gordon. "Polluters' Profits and Political Response: Direct Controls versus Taxes." A.E.RP 65 (March 1975): 139- 47.
Coase, Ronald H. "The Problem of Social Cost." J. Law and Econ. 3 (Octo- ber 1960): 1-44.
Cropper, Maureen L., and Oates, Wallace E. "Environmental Economics: A Survey." J. Econ. Literature 30 (June 1992): 675-740.
Finkelshtain, Israel, and Kislev, Yoav. "Prices vs. Quantities: The Political Perspective." Manuscript. Rehovot: Hebrew Univ., Dept. Agricultural Econ. and Management, 1995.
Fisher, Anthony C. Resource and Environmental Economics. Cambridge: Cam- bridge Univ. Press, 1981.
Grossman, Gene M., and Helpman, Elhanan. "Protection for Sale." A.E.R. 84 (September 1994): 833-50.
Hillman, Arye L. The Political Economy of Protection. Chur, Switz.: Harwood, 1989.
Nash, John F.,Jr. "The Bargaining Problem." Econometrica 18 (April 1950): 155-62.
Peltzman, Sam. "Toward a More General Theory of Regulation." J Law and Econ. 19 (August 1976): 211-40.
Rodrik, Dani. "Tariffs, Subsidies, and Welfare with Endogenous Policy."J Internat. Econ. 21 (November 1986): 285-99.
Scarpa, Carlo. "Regulation as a Bargaining Process: Negotiation over Price and Cost-Reducing Investments." Oxford Econ. Papers 46 (July 1994): 357-65.
Weitzman, Martin L. "Prices vs. Quantities." Rev. Econ. Studies 41 (October 1974): 477-91.
Zusman, Pinhas. "The Incorporation and Measurement of Social Power in Economic Models." Internat. Econ. Rev. 17 (June 1976): 447-62.
This content downloaded from 132.64.29.148 on Thu, 21 Sep 2017 05:39:03 UTCAll use subject to http://about.jstor.org/terms

T'Z
sJeJnpoJd eqJ 'flllouoJo eql Jo lsal oLIl uo slceJJe lEuJslxa qlr,r JotsBJelqBrJE^ olSurs B 8ur,(oldure sr srecnpord snoauaSouroq N qtl^\ fulsnpur uy
DNIITAS AHI Z
'(9661 'na1sry puu urulqsla{urg) eraq,treslapetuasard sr srs,(1uue I€crletueqtutu snoro8u y .sEurpug eql ,(e^rns pueurelqord eql eqrrJsep a,r,r raldeqc srqt u1 6alenbepe aJou loruoc ,(tltuunb'lJeJIp Sr ueq/h puu auIISer paua3erd aql secrrd ,(q uorleln8eJ sr ueq,r'ecuenuur pcrlrlod ue,rr8 :sr pesod uorlsenb roleu eq1 .(s,(um
lute^esuI srno selqueseJ qcq,r sls,(1euu uB ur .9961 .{lrpog ,(q (prcrldxe eperusr uorldunsse J?lrlurs u) aleqep pcllrl0d aql ol lcelqns 10u sr pue .,(1puor1-nlllsuor, pourr.urelop sr eur8er uorlelnEer eql'uorldrunssu ,(g .ea,rlrsod areslceJJe aql ueqlrr 'JolJuJ poteln8ar aql Jo uortezrlrln e8ernocue ol ,pasn ereserprsgns pue enrle8au eJu sarlrleuJalxa eql ueq,r pesodrur oru sexel .raltul
aql Jepun 'aurrEer ecrrd e ro '(ssepsoc sr luouecroJue) slo.lluoc ,(uuenbqltzn euliSar e^Ilullslultups uB Jar{lre aq ,(uru eur8ar uorleln8er eq1
'loJluocJo supolu pup serlrl?uJolxe oql Jo eJnlEu ar{l r{}r,r sarJu^ runrrqrl-tnba pcgllod Surnsue aq; ',(cr1od patueueldurr eqt ,(;rpour ol 8ur,ftl .lcuar
srecnpord eqt pue rolceJ er{l Jo uonezrlrln elelnEal ot Burldueu? sr luatu-ure,ro8 aqJ ('slcaJJa eirrlrsod anuq ,{utu uorlu8rrrr .roy e8unas peur8lcaJSursn pue saruluuratxe enrle8eu aluarc ,(uur acJnos pareqs B rxou JatB^\Sur,nerg)'enrlrsod ro etne8eu - slJaJJa l?uJolxe qtr/( JoloBJ e Burfold-tue ,(rlsnpur uB Japrsuoc errr 'aldurexa aleJcuoJ E sV .eJuanUur
lucrlrlod;osecuanbesuoc eql az,(1uue a,tr 'elaldutocur sr uorlBurroJur eJeq^\ sloJluocslseJtuoo ueruzlral[ alrq^\'Je^e,{\o11 .uosrredruox (nL6l) s.uutuzlrelAutlJBhl sl slqJ, 'serlrluenb Jo loJluo, e^rlBJlsrurupu 'lceJlp ol secrrd,{q uorlelnEer lceJlpul areduoc em .rulncrgud uI 'uorleln8ar erurouocouo arnssard pcnrlod go lcaJJo aqt ssnJsrp ot sr reldeqc sqt;o asofund aqa
NOIIf,NCOUINI I
]SVUSI .hIA.IYSNUEf CO AJISUAAINN,,!\AUS!IH EHI
^elsr) AEoA pue urulqsle{urg [euJSI
recuenuul lBcrlrlodpuu uorlsln8eg cruouocg zt
'l L-2,91 'dd '(reteur6 :{ro1 ,reN) .i1ddn5 r,:-rzo;g'(spe) IIIC 'S 'g pue uroqf, S .\\ -:::y :srsaqlod.(g uosuqo[-q)]a^V oql Jo s:s:I
'88-i9 c; '
ur uuoJa6 ,ftoteln8e1 puz '8ulrntcnrlseu --'(sserd .\t i s..l; .. :
-to{ atntcnt$o$u1 :p661 Ttoday tuauc .;
'(qtueH J'O:tI;i:)twouo)g (ZOAy)'A qdesol'uo13ul"EH i j.
'€ 'luetuetels euolJr1:o3 .Ga:i-:i :
uottolJtA :Jalpws wntutunlv puolu-'t) :
stsilouy JrtuouoJg uD :uottosuo,rrlJ i!!a .
'r \ii--:;uototaqs aW tD maq acuata{uo1 o 1'o si'- :._io acuowolrad )tuouoJg atlt Suur;:t1,,ur '.ecueuuolad ol spJeA\eU 8ur>iur1. ' .;-
i6l) E9 'lo^ 'proraY ctwouo)Z a?J '.S! ;::'JotssrruluoJ ,(1rcrr1ca1g aql Jo slsoJ u:,.:i::uv :uouesrluo puE elErs Jo saruouor![ -r-
uotlousnv '.slf,EC eql - ,(cuarcg;1 .,::'-:::3 i
'ieunf) (E6l) 99 'lo^ 'pto)ay rtuouo:? ?-;qlnos lrreN :,(1ddng ,(lrcu1ca1g ur tunted -: :
'69-S9 'dd '(raquralda5) (€) 8 'to ls,a,':; -::
Iro,.,r\oruejd ,&oteln8eu oql puE uoupsljE 1Ld -_fr-Zet. 'dd '(requaceq) 6S 'lo^ 'ptotay -.7'- 1.or uortecrlddy uV :lel\od pso.I-eseg,Io ts:J -
'(SaCV :BxequeC) sasttdLa:'"1 i -:lot)o! lotoJ aqt 3uunsoa741 'sasHd.ra:u3 i-.r)ueulJoJred leuorleN uo eellrrutuo3 i--:::.ErleJlsnv JoJ sernsBetrl{ aJueuuo}ad. _l-',,
irtcHtcelg puelsuaen) ;o; pe:eda:d :::.:;pue lsuaan| aql JoJ s{Jurrrr{rue g IEuo lt? uj.-: - -.'cllEllsnv
Jo lr]unoJ ssaursng :o; pr.rr::-: -s.erlBrlsnv .roJ Ileuqruog leuo r1Er.u ]tul'j-t .
s!:':uortoln8aY uo s(ossg :a@g aqt pu, 'r?::-''r sse.r4 ,(1rs:anrun pJoJxO :ploJxO ) ddua'.'7- -, -
iey '1 'doqsrg 'I{ ur '.uorlplnts-ag det-a,.;4 1'-r9-_4. .::
ro satnlrlsqns :uorlrladulo3 pr" r. l:_:: v,
]b loutnoT llaBr '.str3JJA ,&orelniaX _Io ts: i :
spoo9 )tlqnd.;,r _ij,-.:

244 Policy Aspects of Public Goods
maximize profits and disregard the externalities they create. A planner,taking into account both the value of production in the industry andits effect on others, can determine socially optimal utilization of theexternalities-inducing factor.
The role of the social planner is undertaken by the government, withone modification: politicians are sensitive to political pressure, to rent-seeking efforts. We model the pressure as contributions or rewards paid bythe producers to the politicians. In this framework, rent-seeking lowerssocial welfare but creates a political surplus which is shared by the politi-cians and the producers. The magnitude of the political contributionsdetermines the division of the surplus: the higher the rewards, the largerthe share of the politicians and the smaller the share of the producers. Therewards may take many forms: monetary campaign contributions, outrightbribes, demonstrations, strikes, letter-writing, and personal services. Thepolitical rewards may enhance welfare, the welfare of the politicians oreven public welfare as when a constructor builds a school in return for alucrative permit. Concentrating on political influence, we disregard theparticular nature of the rewards and their wider implications.
One assumed characteristic of the producers-government polity whichhas significant implications for the analysis is linearity: the politicalrewards are in money or money-like contributions, they are of constantcost and effect. We do not consider the possibility that the cost of col-lecting political contributions is rising or that their effect may showdiminishing returns.
The policy regimes - taxes, subsidies or quotas - have different andopposing income and budgetary effects. Concentrating on allocation, weput the alternative regimes on the same footing by introducing a lump-sum compensation payment which, by assumption, is introduced with theimposition of a regime. For example, the implementation of a tax regimeis accompanied by a compensation equal to the computed equilibriumvalue of the tax and distributed to the producers as a side-payment; whenthe control shifts to a subsidy regime, the producers are asked to pay thelump-sum. Being a lump-sum payment, the compensation does not affectallocation - either the magnitude of the political rewards or employmentof the variable factor. Such payments, which are here introduced as ananalytical device, are observed in practice. For example, the governmentof Israel is now considering a reform in the country's water economy.Prices will rise to replace administrative allocation, farmers will be com-pensated. The compensation will be a function of the water quota a farmerhas held, independent of future water utilization.
Finkelshtain & Kislev: Economic Regu,;:
By construction, taxes and subsidies a;<
individually tailored. Consequentlv. tree-xregime. Accordingly, we assume that onil .
in the industry's lobby if prices are rhe ::.s'K is taken as exogenous; that is, the sjzeanalysis as given. Under an adminisua::'the government may assign each firm ir :
the regulated factor, producers can then be
to modify personal quotas. Moreover. a-< ifirm to invest in political activiry, ir is uTherefore, in a quota regime, full paniciparthe definition of a political equilibrium rrc I
is not an assumption of the analysis. Sull.individual political activity, we keep the n:
Formally, let net product, or profirs - brproduction activity ofthe ith producer b€ u
Ti(qi)= pf(qi)-pqi
In (l), q marks the regulated factor; q is r-hr
of this factor; p is the price of the indus:duction function with q the only variable r:price of the variable factor. By assumpricalso prices of other, non-variable input-< :that the function ni(qi)is concave in q'
Maximizing profits, the producers mar::
yi=Iri(qi)-ci-tqi+Ri
The variable r marks the tax; for a sut'si:'.quota, , = 0. The variable c indicares l-.pensation payment is R, equal to the eqi:;.::producers in the industry, total incone.rewards are given, respectively, b)
If, under a price regime, rf < N. c' m3r :t
andC=!-LNt{
Y =>y,,Q=}n,,

(e)
Q)
'? Jo senp^ euos JoJ o.raz eq Keru ,c N >;y 'erurEet ecud u Jepun :I
,(q',(1aa,l1cedser'uenr8 aJB spJe&oJpcrlrlod pue uorluzrlrln JolcEJ 'ourocur p1o1 ',(rlsnpur oql ur srecnpord
N qll^\.bt- lo epnllu8eur unuqrltnbe eql ol pnbe 'y sr luaurfed uorlesued-uIoJ aqJ 'suorlnqrJluoc pcrlrlod selgolpul , elq?rru^ eql '0 = , 'BlonbB sI IoJIUOJ Ar{l ueq/r\ puB 0 > 1 ,(prsqns 3 roJ :xEl aql $u?ru, elqBrJB^ 3qI
,A*,bt-,c-(,b),u=,K
ut ,{ azrurrxuru sracnpord oqt 'ugord Surzrturxel4i
,D ur elBJuoJ sr. (,b),u uorlrunJ eql luqlpaunssu oslu sr U 'luulsuoc eru slndur olqurJu^-uou 'Jeqlo Jo secFd ospos pue lu?lsuoc eru d pue d 'uorldtunsse ,(g 'rotcug elqerJpl eqt go acudlelJ?ur alezrrrd aql sr d puu llndur alquuerr fluo eqt b qlrzn uorlcunJ uorlcnp-ord eqt \ (P)J ilcnpord s.,(rlsnpur aql go ecud aql sr d :rolrpJ srql JoIe^al uorlezrlnn s.JaJnpold qU aqt sr ,b :ro1ce; paluln8ar oql ${JEur D'(t) ul
(t) ,bd - (,b)Ji| = (,b),u
sB uallu^r aq rocnpord qll aqlJo,(lrancu uorlcnpordoql uI - sarprsqns Jo sexul aJoJeq - slgord:o lcnpo-rd tau lel ',(lprurog
'uorluluaserd oql ur I xepur ruJg eqt daal e,r',(lrrrncu pcqrlod pnpr^rpurJo f,tlllqlssod aq1 eztsuqdue ol 'llps 'srsfpue eql yo uorldurns$ uB lou sr
:(moleq pezuetoeruqc JequnJ aq ot) unrrqrlmbe pcngod B Jo uoqruUep eql
Jo uud sr srecnpord 19 11u go uouudrcrged gry 'aurr8a: elonb e ur 'eJoJeJeqI'IIUg JAqIO ,ftarre ro3 elrq/r\quo/r\ sr 1r
"(lr,rncu pcqrlod ur lse^ur 01 ruJg
auo s,(ed 1l JI 'lucIluapl erz srruu sB 'Ja^oeJoN 'sulonb puosred (grpour ol[lpnprrrrpur {qqo1 ot palcadxa eq ueql uur srernpoJd 'rolceg paplnEer aqt
;o 1uau,(o1dua tunurndo Iurcos slr uuu r{3ua u8rsse ,(etu luauuralo8 eql'pueq Jeqlo eql uo 'lo4uoo alrlu4srurtupu uE Japun 'ualr8 su srs,(1uue
eqt ur peldaccu sr ,(qqo1 aql Jo ezrs eql 'sr l?ql lsnouaSoxe su ue{ul sl XJaqrlnu eql 'loJluoc Jo luaunJlsur eql eJB secud gr ,(qqo1 s.{4snpur eql uratedrcrued srecnpord 1g eqt Jo X ,(1uo luql ounssu alr ',(13urp.roccy 'eur8arecud u ur palcedxa eq UBJ Surpr.r-eerg ',(lluanbesuoJ 'peJolrpl flpnprlrpureq ,(eu selonb eFq/r\ uuoJrun ere sarprsqns pue sexpl 'uorlon4suoc ,(g
SrZ acuan{u1 yocrrrtod puo uouo1n?ay crutouo?g :^apty 7p ulolqsplull
'uorlezrliln j;::JaurJEJ u elonb JelB^\ aql Jo uoltrun-I E r-I'uoc eq IIrA\ sJeuJBJ 'uoll€3ollB a.\ui:'',(ruouoce ralu,tr s.,(rlunoc aql uI uua--
luaururero8 aqt 'elduexa rog ecrt.';::u3 sB pecnpoJlul eJsL{ alu qclq,\\ 'slir?'-
lueur,{o1dua Jo spJeA\er 1ecr1r1od aq: -::IJaJJB lou saop uorlesueduoc aqt 'tua::
aq1 (ud ol pe{se eru srecnpord eqt '!;.ueqlr l1uau,(ud-epts u se stacnpord ;;:unrrqrpnbe palnduroc eql ot lenba '::aurr8ar xel p Jo uorlulueureldur aqt 'ey;
aql qllt\ peonporul sr 'uotldunsse ic. ':
-durn1 e Sutcnporlur ,(q Surtoog aurEs ;eA\ 'uorlpcolle uo SutleruaJuoJ stta-l_:.
puu lueJeJJrp aleq - selonb Jo setpis;.
moqs ,(eu lceJJe JI3I{1 leql ro 3ursi:-Ioc Jo tsoc eql tuql ,(lrltqrssod aqt :::luBlsuoJ 3O ere ,(eqt 'suollnquluol !l{:pcrlrlod eql :,(ltreeurl st srs,{ieur a'q:
qcrqm,(tr1od luauuro,roS-sracnpo:d a';'suotlucrldut JoPI,\\ 113$ ;
aqt pruEerstp eA\ 'sJuonuut lucrtrlo.i l:
8 JoJ uJnler ur Ioor{JS E spllnq JolJn-ilsl
ro suutctltlod ol{l Jo eJBJIo/y\ eq1 'a:z_;t;
aql 'se3l^Jes luuosred pue '3utlu.'rr-:;::
lq8r4no'suollnquluoc u8tudruec .i-re:;'-
oql 'sJaJnpord aqt;o eJpqs aql JallEtus
re8rul eql 'spJe/ral eqt req8rq aqt :sn1:
suorlnqrrluoc yucrlrlod aql ;o epntru:'-pllod oql ,(q peruqs sI I{rIq,{\ snld:ns rsJet\ol Suplaes-luar '{Jo^\eue4 sI'.i't
-r
,(q prcd spJu/reJ Jo suollnquuoJ se a.t:!-lual ol 'arnsserd pcrlrlod 01 o.\IlISu:)qlri( 'lueuuJa,r.oB eql ,(q ualeuapun s
eqt Jo uoltuzgpln lerurldo ,{lptcos ;':puu ,{rlsnput eql uI uollcnpord -1o a:.
'reuuuld V 'eluerc ,(eql serltpu.tet\e ;:
spoog cr1qn4.io ;.
,rK= cp*',bK=A',K!= t1{NN
I=t I=l

246 Policy Aspects of Public Goods
The second sector, the government, is viewed as maximizing theweighted sum
W = V(q) + aC (4)
where V(q) is social welfare defined over the vector q = et, ... , {.Theconstant a ) 0 represents the preference of the government for politicalbribes relative to public welfare; it can also be seen as standing for thepolitical power of the influence group in the industry. Lobbies in differentindustries may have different a values.
Welfare is taken to be the sum of net product and external effects.Accordingly, the function V is written as
v(O=>i(qi) +Z^,rn,
where y'(Q) is the money-metric utility function of the jth consumer whois influenced by the external effects ofthe regulated factor. The function pincreases with 0 for positive externalities and decreases for negativeeffects. Utility is also defined over the vector of prices of consumptiongoods; but, assuming a small economy with all goods traded, prices areconstant and they are not represented explicitly in the function. It isassumed that p! is concave in Q, and hence in each qi. Similarly, since V isthe sum of concave functions (in each q,), it is a concave function itself.All functions are second-order differentiable and interior solutions areassumed throughout.
Note that c and C enter linearly in (2) and (4). This reflects the linearnature of costs and effects in the political process and will simplifysignificantly the analysis below.
3 POLITICALEQUILIBRIUM
As indicated, politicians in the government are willing to accept politicalcontributions in return for economic favours. In our model the politiciansare willing to lower taxes, raise subsidies or modify quotas. By the 'politi-cal process', we mean the particular interaction between the politiciansand the interest groups attempting to influence them. The threat point ofboth sides to the political give and take is the social allocation with norewards. This is the situation either side may retreat to if it is not satisfied
Finkelshtain & Kislev: Economic Reer.;:-
with the outcome of the political prcte.,sumption, force social optimum: the p:cc_the social allocation and in so doine de;:--,they desire.
A political process leads to a polrri;i e
our model is characterized by a se! of re; =price regime, the equilibrium is defined r,,quota, the equilibrium is characterized :.'equilibrium is process-specifi c. S e r eral ;:.,:,been suggested in the literature (exampie ::Hillman, 1989; Grossman and Helpman.sider below two game theoretic moJeis. :political auction. The political equrhbn-:example, will be the Nash (1950) solurior :
Though often differing in manl $3) >. :.literature - including the games emploi e:natural common property: they are pe.liu;-on the contract curve where the inditfe:epolitical process are at points of tan_qen.-refficiency in the presentation belo*'.
In principle, equilibrium political cor-::'mined simultaneously; but when. as r,,e
linear in cost and effect - the equilib,nu:. :recursively: the controls are set regardie>: :
(provided that no side chooses rhe rhrear >:of controls for all processes mainninin_e .::the particular model specifying rhe pr;ir'-:.affecting only the division of the polri::ibetween the producers and the polrri;:":.presentation and start with the ernplor:-_::postpone the specification of the games 1-.:ical payments to Section 6.
4 FACTOR UTILIZATION
Relying on the linearity of the polirr;a- :::.derivation ofthe conditions specifr ing le;:_tion is based in this section solell o: e:::rium; that is, on the equality of rhe n::-::.-..the control and the political conmbu:.-:
(5)

eql qlr/h srscnpord aql JoJ uorlnqrJluoc psnrlod eql pu? IoJluo, eqluee,trlaq uollnlllsqns Jo alur leur8ruu eqt go ,(trpnbe oql uo .sr
luql :unu-qrlrnba 1ecr1r1od eql 3o ,(cuercgJe uo f,lalos uorlces srql ur pesuq sr uorl-ezIIIln rolc,J pu' slorluoJJo s1ala1 Eur,(;rceds suorlrpuoa oqlJo uorl,Arrepeqt 'sacuanbasuoc slr puu ssacord pcqrlod eql 3o ,(1ueaur1 ,qi uo aurftrS
NOIJVZI'IIJN UOI)VC '
'9 uorlJos 01 sluetu/{Bd IB3l1r1od aqt go uorleuruua ep ar.ll puu seure8 eql Jo uorluogrceds eql euodlsodpue rolcBJ palulnEer eql go tueur,{o1dua eql qll^\ uBts pue uorluluasardaql aleredas oJoJsJer{l el[ z'suurcrlr10d eqt puu sJecnpoJd aql uae,nteq'sart.rud eql uee^rloq snldrns lecqrlod oqt Jo uorsr^p aqt ,(1uo BurtcaJJesp uaes aq ueql uec ssecord pcgrlod aqt Bur,(glceds lepou relncrged aq1:FruarJgJe pcqryod pue ,(lrrueur1 Eururelururu sessacord Ip roJ-sloJluoc Jo sla^al lecrluepr eJB aseql .(turod
l?eJqt eql sesooqo oprs ou teql paprirord)suollnqrJluoc eql Jo le^el eql Jo sselpJu8ar les eJE slorluoo eql :{le^rsJnmJpelBlncpc 3q u33 uorlurnEguoc urnrrqrlrnba eql - rceJJe pue lsoc ur ;rBaurleJE suollnqrJluoc aql .eurnssB am se ,uaqlr tnq l,(lsnoeuBllnllJrs pauru-Jelep oJB slorluoc puu suorlnqr4uoc pcrlrlod utnuqrUnbe .aldrcurrd u1
uo,(1er or ruerua^uoc eq r r r^\,, ^r""sfi:'r"J
r::ffi ::t:# :J":i j'J:lilj;eql ol soprs aql Jo soAJnJ ecuoJeJJrpur eql eJaqt\ sAJnJ l3EJluoJ eql uoar1 uuqrpnbe JreqI .luerrgJa ,(11ucnr1od are ,(eq1 :dlrodord uoutuoc prntruJaqlBJ u eruqs - reldeqc eqt ur pe,(o1dua saure8 eqt Bupnlcur _ eJnlel?trleql uI peJaprsuo, sessecoJd lsoru .s[elr ,(ueru ur Buuaggrp ueuo qEnoqJ
'atuut anneradooc u ot uorlnlos (OSOt) qsBN aql eq [vn-.a1duuxeroJ 'lepou Surure8ruq oql Jo urnlrqrpnbe pcrlloa aql .uoricnu
Jucrlrlode puu Surure8ruq e,rrluredooc e ,slepou JrloJoer.Il eurn8 o^t
^o1"q ,rpn
-uoc o.r\,\ '9661 ,edncs :r,661 .ueurdlag puu ueussorg :6g61 .uerullrH:9861 '{lrpod :9161 .ueusnTam a1&texe) erryere1r1 eqt ur pelse88ns ueeqe^Eq sassooord lucrlrlodSo slapotu IEJe^oS
.cgrceds_ssecord sr urnuqlllnbapcqqod aqJ 'b Joloa^ B pue 3 ,(q pazrrotc?&qc sr unuqlrnbe eW lutonbJepun :l puu, senp^ go rrcd u ,(q peugap sr urnrrqrlnbe eql .arur8ar ecudu Jepun 'snqJ 'sloJluo3 puB spJB/her Jo les e lqpezt]r,lcBJEr{3 sr Iaporu Jnour urnuqrpnba eqJ .runrrqrlmba pcrlrlod u o1 speal ssacord pcnrioA y
.a:rsap ,{eqtspru^\eJ eql Jo suurcqrlod aqt eaudap Burop os ur pue uorl?Jolle Iurcos aqlldecce ot aprJep osp ,(eu sracnpord eq1 lurnurldo p,ro. ,rrog ,uoqdurns-se ,(q 'uuc luaruureao8 oq1 'ssaoord lucpglod
"qiyo ,*or1io
"qt qt,^
LnZ acuan{u1 Toc4nod puD uotlolngay orutouo?g :^aFtX T ulotqqa4ul
It-lillES lou SI ll Jl 01 lEai:- ..i ;: . -;--.;u qlr.r\ uorlEJollE IEr:xts :ut sr eli-- :;:.- tutod learql eql uraqt a--ua:'i:-: :: :-_:.uerrrlrlod aql uas.rlaq uorttej!tul jz-::::-r:r1od. aql ,(g selonb ,(JIporu lo s:iFi:J-!suercrlrlod aqt Iapou lno ul .sJno\!-l r:'-'-plrtrlod tdaccu ot Eur11r.r are luru:u:;.. _ i
i.yldurs IIr,/r\ pue ssaco.rd lerriricd :.;-: .
reaurl aql stcauer slqJ '(f) puE (i, Ur ..---I
aJE Suorlnlos torrelur puE alqprtu?l;-t-t:: :'Jiesll uollcunJ a^BJuoc e sI 1I '( , q:Ea -:sr / acurs ',(peprur5 ',b qcea ur aluau :.-: ,;
sr U 'uorlcunJ aql ur ,(ltrcrlCxa pa:_;r:-:are secrrd 'papgrl spoo8 11u qlrt .,u:,--::uotldurnsuoc go sacud Jo JotJe.\ 3u: i:._enrle8au JoJ sesueJcep puu saitiiE.ji.:r:z/ uorlcunJ eqJ 'JolcBJ pelelnSa: aL,t --: :-.::-oqltA Jeunsuoc qtlaqt Jo uorlJunl i. -:-- - _
SE U3L:i y.
'slceJJa luuJelxa puu lcnpord leu -lo ruirs'senF.. i
luoJaJJIp ur sarqqo.I '{rlsnpur eqr ur dno:_=- :otll JoJ Surpuels su ueos aq osle uBJ tl r.;pcrlrlod JoJ luaruuJe^oS eqt 3o acuera-I?jceqJ '/p ' "' 'rb = b rolcen eql Ja^o ppuull
G)
eql Surzrurx?ru sa pa^\er^ sr .luauruja\:
spoog c4qn4 {o stta;
(s)
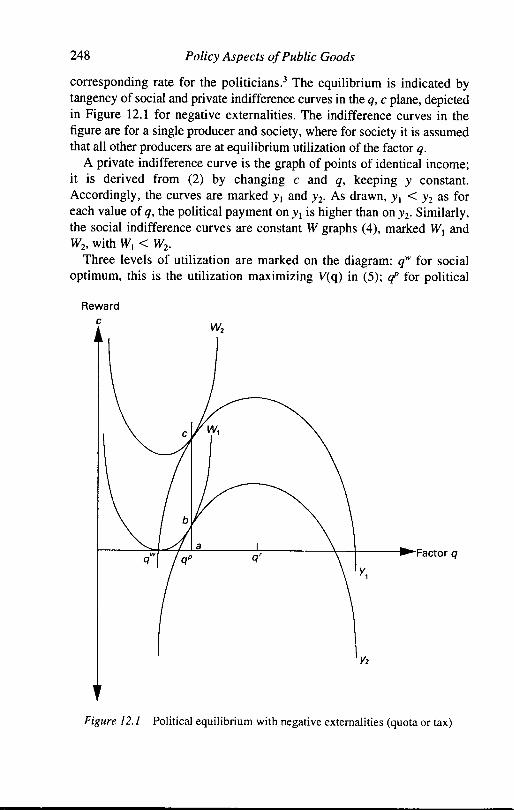
248 Policy Aspects of Public Goods
corresponding rate for the politicians.3 The equilibrium is indicated bytangency of social and private indifference curves in the q, c plane, depictedin Figure l2.l for negative externalities. The indifference curves in thefigure are for a single producer and society, where for society it is assumedthat all other producers are at equilibrium utilization of the factor q.
A private indifference curve is the graph of points of identical income;it is derived from (2) by changing c and q, keeping y constant.Accordingly, the curves are marked y, and y2. As drawn, y, ( y, as foreach value of q, the political payment on y, is higher than on y2. Similarly,the social indifference curves are constant W graphs (4), marked W1 andWr, with WrlWz.
Three levels of utilization are marked on the diagram: q" for socialoptimum, this is the utilization maximizing y(q) in (5): d for political
Reward
Figure l2.l Political equilibrium with negative extemalities (quota or tax)
Finkelshtain & Kislev: Economic Req,.::.
equilibrium, and 4' for private. non-:n:-:.:The contract curve is the line ertendrns ::the property that the quantity of the reg--level of the political reward. As Figure -iities are negative, the political equilib,r::-:factor is a compromise between the sw:r :
private profi t-maximizi ng empl or, trle fl I t- ]'-:ties, the graphical configuration is the s-quota control and the political utilizarion :s(not necessarily the same quantit) q '. T:.:positive externalities ; but before c on s iie:: :,
view the equilibrium reached in terms c: :of Figure 12.2. ln this diagram, r,o marisVn marks marginal social welfare (t'cl:diagram). The political equilibrium fcr :-.e_s
to be a compromise in which privare rnr:.marginal welfare is negative.
The indifference curves Y, and It', in Fr:point q*; the segment bc on the conrraci .game. The segment ab indicates the amcu:.to be kept on their reservation utilitl. Ir :s :
for the politicians to participate. ro rr1r.'.3
cation to the political equilibnum.Panels b and c in Figure 12.2 depi;l :'-
externalities. Under a quota regime. e;-..mise - as it is for negative effecrs - :e:'.iallocations. Under a price regime. on lh: .
not be forced to increase production: u:::and they further augment the price etTe:: :sidies. As a result, the political equilitr:*=.12.2, panel c, ( is to the right of both ;' .ternalities are positive and the conrrol i:-...:.equilibrium may be socially infenor :,: :.of a free market without governmenr rr:3:.
5 PRICES OR QUANTITIES
The central question of this chapter rs: *:s:ment and when is a quantity conrrol te:::relatively more efficient, it will thereit:: :,

tuaJeJJrp eql .(JtrEIO ot InJosn aq eJoJeJeql IIr^\ tr luerJgJe eJoru ,(1anr1u1e-r
sr lr Jr elquJeJard sr lorluoc V aJo1aq IoIuoJ ,(lrluunb B sr ueq^\ puu lueur-nlsur elunbepe eql secud eJE uoqt\ :sr relduqc srqlJo uorlsenb p4uec aql
SAIJIJNVNO UO SACTUA E
'uorluelJelur lueruureno8 lnoqlr,rl le{rutu eerJ u Jouorleoollu Surzrurrxeru-tgo-rd aqt 01 JorJeJur ,(lprcos aq ,(eu urnrrqrpnbapcrlrlod aqt ',{prsqns E sr luo[unrsur Io{uoc aql puu a,rqtsod eJE seIlIIBuJel-xe ueq^\ ',(lluanbesuo3 '^b pue,D qtoq ;o lq8rr eql ol sr p 'c puud '7'71arn8rg u1 'esrurorduoc E lou sr urnrrqrpnbe pcnrlod aql 'llnsal B sV 'serprs
-qns req8rq ue^e roJ Sursserd ,(q tcegga ecud eql tuaur8ne requnJ ,(eqt puu,(13ur11rm ty op ,(aqt serprsqns qtr^\ :uorlJnpord esuercut ol pecJoJ eq loupeeu sJecnpord aqt 'pueq raqlo eql uo 'aurEer acud e Jepun 'suollecolle
elea,rrd eql puu lurcos eql ueelueq - slmJJe a,trlu8au roJ sI l[ sB - esllu-orduoc e sr uorlecolp urnrrqrpnbe 'etur8er ulonb u Jepun 'sorlrleuJalxe
earlrsod JoJ runrJqrlrnba pcqrlod tcrdep 7'71 ern8rg ur c puu q sleu?d'unuqrpnbe pcrlrlod eql ot uorluc
-o1p purldo ,(lprcos eqt tuor1 elour ol 'eludrcqred ol suercrlrlod aql roJ
luaur,(ed pcrlrlod runrurur(u eql sl lI ',{tIpn uorlB^JeseJ rreql uo 1de1 eq o1
enreoer ol e^uq suercnllod eql lunor.ue eql salgcrpur qa lueur8es aq1 'euru8
pcqrlod eql Jo eroo eql sr o^JnJ lcuJluoc aql uo rq lueruEes eql :,, lulodleoJql eql q8norqt ssud 1'71 ern8rg ur I7g puu Ir1 sa.rrnc ocueJeJJrpul eqJ
'elrle8eu sr aJEJIaA\ put8reurprcos puB errrlrsod sr lgoJd pur8reru elerrud qcrqA\ ur asttuorduroc B eq oluees ure8e sr sarllleuJalxa oir.rle8au JoJ r.unrJqrlrnba lecqrlod eq1 '(ua8etpeqt ur ,(1rp1n leurEreur peuJol qtoq) eruglem yercos leur8reu sryeu '1elrq^\
''slgoJd purEmu elu,rrrd s1:uur bz 'ruer8urp sql uI 'Z'ZI ern8rg go
u lauud ur sapnlru8eru luur8reu Jo s{uJal ur poqcuoJ unrrqrynbe aql A\erA
ol InJosn sl lr 'slcoJJo alrlrsod Suueprsuoc aJoJeq lnq :serlrleuJetxa eir.nrsod
qlr.r\ tueJeJJrp oq IIII( uorlenlrs eql '(/ ,(11uunb erues eql ,(luusseceu lou)seurEer qloq JoJ esruordruoc B sr uorluzrlqn pcqrlod erp puu lorluoc ulonbe :o aur8ar xel B roqlro JoJ etues eql sr uorleJn8guoc pcrqdur8 eql 'sarl-rleuJelxe ent1u8au rod 'JolJBJ eqt;o tueu,(oldura Surzrurxuu-1gord els,{ud'uouue^Jelur-ou eql prru runu,rrldo Ieroos aql ueetueq esnuorduroc B sr JolcBJ
patuln8ar eqt;o 1uaru,(oldura unrrqrgnbe pcqrlod eql 'e.trtuEau aJB selll-luuJalxo eqt uoqttr 'saluorpur 1'71 arn8rg sV 'pJuh\eJ pcrlrlod eql Jo lo^ol,(uu rog aums eql sr JolcuJ paluln8er eql yo ,{1r1uunb eqt teql ,gradord eq1
slcogeJ lecrue^ Sureq t1 i,b wotl Supualxe ouq oql sr alJno lcurluoc eql'1e,te1 Surzrurrxutu-1gord 'uorlualJelur-uou 'elelud tol ,b puu'urnuqrpnbe
6nZ acuan{u1 lDctttlod puo uouo1n?ay rtuouocg :^aFtX ? ulotqqa1ul
(xet ro elonb) saulleuetxa a.rtteiau q:i t :
b .lolceJ
pcqrlod ro3 ,6 :(g) ul (b)A Sutzttutrrau :Iurcos JoJ
^b .luuetterp eql uo pelrelu ;-
puu Il4 pelmtu '(y) sqderE 6 luslsuo-' 3-',(1ru[urg 'z( uo uuql raqtrq st li uo :u:u: i;rog su z( > I{ 'u^\uJp sV 'z( pue I.i Par-:'luelsuoc I Surdaol 'b pue I Suriur:;-':eruoJul IBcIluopI go slurod 1o qderS aqt si ;
'b rc1c4 aqlJo uolluz l1tln urnuqtr:::perunssu s1 lt ,tatcos roJ eJeqa '.{tatcos puieql uI se^Jnc ocueJeJJIpuI 3l{L 'seIlII?uJ::l
palcrdep'aueld a'D eql ut seAJnJ esuala-ulF'J
,(q petucrpur st urntrqtltnbe ?qJ r'suElll::i
sPoo) rqqnd ]'o s::?J.

Marginalutility
a: Negative externalities (quota or tax)
250 Policy Aspects of Public Goods
E actor
Factor (
Factor (
Figure 12.2 Marginal welfare and marginal profits
dimensions of efficiency in the analysis. political efficiency was defined inSection 4 as Pareto-efficiency of the polity: the producers and the politi-cians are on their contract curve. Allocative efficiency as used below for apolitical equilibrium is measured by the distance of the employment of thefactor q from social optimum utilization. The closer the employment, themore efficient the equilibrium. s-efficiency (for rent-seeking) is defined bythe size of the political reward: the smaller the reward, the more efficientthe political equilibrium.
Finkelshtain & Kislev: Economic Reei.;:
Since the political equilibrium m3\ :Estages and it is, by construction, politr.;:r-...sions of efficiency - allocative and S-e::.separately. We start with allocatire e::.marized in Proposition l, in which the f:..
__Q(K) the share of producrion :r :"=O@i price regime
4 = the elasticity of the demand for ::s = tl(p+t) the ratio of the tar ro rhe ::
Proposition I
Consider political equilibria calculate c i::subsidy) then,
(i) With negative externaliries. a pn,-e .
allocation if and only if in equihbri r::more efficient when the inequairirequally efficient when lfi | = 1.
(ii) Under both types of control. rhe ::quotas increases with the elasticrrr c:decreases with the share of the proc-lobby.
(iii) Efficiency of both controls decrea_iesproducers, a.
(iv) With positive externalities. a pri;e :of the factar q than a quora rei::inconclusive.
As indicated, a formal proof is gir e: ::, iWe limit the present discussion to a ie..iinterpretations and elaborations.
5.1 Remarks
The comparative advantage of a regime ; .'negative externalities. When the erter.-r:j e:
rium utilisations for the alternative 13S:::always 'far apart', one being a comprc:.:sright of the no-intervention profi t- mar r it-.. r :
MarginaIutitity
Marginalutil ity
sl 1I '(Z'ZI ernBIC) ,(tpuenb Surznurxuur-tgord uoqua,uelur-ou eqt 3o lqErreqt ol pelucol reqlo eql puu aslurorduoc u Buraq auo .,uude ru;, s,(empere - i(prsqns puu ulonb - seur8ar e^rl?urellu oql JoJ suorlBsrlrln unrJ-qrlrnbe eql'elqrsod eJB stoeJJe leuJelxa eql ueqid .serlrlBurelxa etrlu8euro; ,(1uo pegrluopr (pue1c eq uuc eurr8ar e go a8uluenpe anrlereduoc eq;
$lJBruau I.s
'suorluJoqele puu suorlelarfu alureuos puu s{JBtuaJ 3ur,(gue1c A\aJ € ol uorssncsrp luesard oql l}urrl eA\'(S0e t)
^elsry pu? urut{.{slelurg ur uoa,rB sr;oord IBturoJ u ,palucrpur sy
'sArSnlcuocursr uosrreduoc (cuarcggg .eun8er elonb B uet4l b rolcuJ aql JouorlEzrlrtn raqSrq sp1er,( lorluoc ecrrd 3 'serlrlEuJelxe anrlrsod qll/( (^l)
'a'srecnpordeql go remod pcrlrlod eql qlr^\ seseoJcap sloJluoc qloq Jo ,(cuercggg (rrr)
.,{qqot
pptsnpul eql ur pasruuSro srocnpord aqt go eJer.ls aqt qlr/\\ saseetcappuu JolcBJ eql JoJ puuruap eql go ,(lrcqsulo aql qlr,r sesuerJur selonbol elrlulal secrrd ;o ,(cuarcg;e 3r.11 'loJluoc 10 sad,(l qloq Jepun (u)
't = I *l uaq,rl luarcuJe ,(ypnbaeJB SIoJIUOC 3qJ 'pesJe^o: sr ,(lrpnbaur eql ueq^\ luercgJe eJor.usr loJluo3 ,(luuenb V 'l > | $l runrrqrpnbe ur gr ,(1uo puu;r uorlp3olleluarogJe aJouI e splar{ lorluoc ocud u 6sarlrleuJelxa errrle8au qlr11\ (l)
'uaqt ((prsqnsB ro xBl e raqtre) seurSar ecud rog palBln3luc urrqr[nba pc4r10d JoprsuoJ
1 uo.rlJsodorg
b go ecpd racnpord oql ol xel aql Jo orluJ erlt (t+d)p = sD rolce; or{l JoJ puuuep eql go ,{lrcrlsule eg = &,
aurr8ar acrrd (MOB repun,(qqol aqt ur suug dq uoqcnpord;o areqs eqtdrd=o
;pesn oJB s1oqu,(s Eurlrollo; eql qorq^\ ur ,1 uorlrsodoJd ur pezrJurrr-tuns eJe s8urpug rn6 .,(cuarcgge o^neJollu gllrrr uels e16 .,(lelurudes
p3u(rrBxa eq osp uec - ,(cuercgJe-s puu e^n?3ollE - ,(cueregSa Jo suors-ueulp Jeqlo 0/$ aql 'luer3gJe ,(1pcn110d ,uollcnlsuoc ,(q ,s1
t1 puu sa8e1so/rU ur ,(lenrsrncer pelnduoc eq ,(eur urnrrqrFnba 1ucril1od aql acurs
lgz acuan{q Tocrlttod puo uo4o1n8ay crutouoog :^alsrx ? utDtttsp)tull
luerJgJe erou aql 'pJu,ry\eJ aql JsllBus aql ::
,(q peugep sr (Suqae5luar ro;) ,(cuarcg,la-,qaql 'tueu,(oldrua aql Jesolc eqJ 'uorluzrlr::aqr;o tueur,(oldrua aqt3o aruetslp eqr iq prB JoJ
^\olaq pesn se f,cuarcg;a a^rletolly !
-qr1od aqt puu sJecnpoJd aqt :,{tr1od eqr _i..
ur paugap sum ,(cuarcg;e lecnrlod 'srs.ileur
slgord luur8reur pue e:eg1a.,n p';=
) folJed
) JOICeJ
ro1cP.{
saTlT'[Eiji3-
spoog ct1qn4 {o stta;
(xel, ro elonb)

252 Policy Aspects of Public Goods
therefore impossible to find analytically conditions under which theregimes are equally efficient and conditions which characterize compara-tive efficiency of either of the controls. Given the necessary data for anyparticular situation, one can, of course, calculate the political equilibriumutilization for both regimes and compare their welfare implications.
Item (iii) in Proposition I could be expected intuitively: the morepowerful the producers, the more they succeed in moving the politicalequilibrium closer to profit-maximizing allocation and further away fromthe social optimum.
Item (iv) is again a reflection of the differences in Panels b and c inFigure 12.2.
5.2 Demand Elasticity
The intuition behind the role played by the elasticity of the demand for theregulated factor in comparing allocative efficiency of the regimes in part(i) of Proposition 1 can be explained conveniently for the special case
where o = l, p = O,s = I ; that is, the industry consists of a single produceror of an all-embracing lobby, the factor can be acquired freely up to thedesignated amount under a quota regime, and the tax is the entire unitprice under a price regime. For this situation, let qs in Figure 12.3 be an
initial quantity, either determined by a quota or reached by the producers
when the tax was set to f6. Consider the rent-seeking effort that increasesthe quantity to q.1. Depending on the control, the change may be achievedby either an increase in the quota itself or by reducing the tax to 11. Thecorresponding gain to the producers is
Priceregime A+BQuotaregime B + CDifference A - C
With unitary elasticity, A = C and the difference vanishes, the regimesare equivalent at the margin. The returns to marginal political efforts ofan equal quantitative effect are identical. Alternatively, if the factordemand is elastic, A < C, the returns under a price regime are smallerthan under quota. Consequently, under a price regime, and with elasticdemand, the political struggle will be relatively less intensive, and theequilibrium will be closer to the social optimum. Similarly, for Part(ii): the more elastic the demand function passing through (qs, rs) thesmaller the area A + B, and the less intensive the political struggle. InFigure 12. l, more elastic demand means smaller slopes of the producer's
Finkelshnin & Kislev: Economic Rep.-;-
t
Figure 12.3 Gain from polirical ::i -.'
indifference curves and a move of the p.to the left.
These findings may seem to conrradr;: '-:
tradition (Atkinson and Stigliu. 198ti c:more elastic the demand (or supplr r i::e :vention in prices. The apparent conur;,:::that when taxes are levied to raise re.,e:.-effect of the tax on resource allocar;c.-.. ';
taxes is to modify use of resources so 1. ::the negative externalities.
5.3 Organization of Producers
With a single producer, a = I and i:e :regimes is reflected only in the size ,:: ':.plained already that under quota ali p:;c-the extent of their organization does nc: e:-

lBcrlrlod eql Jo srsfpuu eql Jelus lou saop uorluzruBSJo Jrar{l Jo luelxe 3qlpu? e^rlcB ,(1pcr1r1od aJB sJe3npoJd 1p utonb Jepun lBql fpuerlu peureld-xe ueeq suq t1 '&.s lcnpord eql Jo ezrs eqt ul ,(1uo pelcegeJ sr seurrEar
IoJtuoc 3r{l uee/$eq aJuaJeJJrp eql puB I = .o 6Jacnpord e13urs u qll/!\
sJernpoJd Jo uoJlezrue8.rg g.S
'serlrluuJslxe arrrleEeu aql
Jo slceJJa Sunureq eql mnpeJ ol sB os seoJnosar yo esn ,(;rporu ol sr sexBl
;o asofund elos aql eJeq elq^\ 'uorleJollu ecJnoser uo xel aql Jo lcaJJeeql azrururu seler Ieurrldo 'enueneJ asrer ol par^el eJB soxu1 ueqln luqlEurzruSoca: ,(q penloser sr uorlcrperluoc luemddu aq1 'sacud ur uorlue^-Jatur uB InJruJBq ,(lprcos eroru eql (flddns ro) puuuep aql Jrtsela eJorueql qclqa .(q uonuxq purqdo Jo (0861 'zlllEFS pu? uosuD{lv) uorlrpurlxnelrog-fasurug peqsrlqelse egl lJrpe4uoc ol tuees ,(uru sEurpug aseql
'uel eql ollueur,(o1dua unrrqrlrnbe pcrlrlod eql Jo e^ou B puB se^Jnc ecueroJJrpur
serlrluenb ',r secFd - ecuenuur 1ecU11od uro{ ureo g'77 atn?tg
Lb 0b
tgz acuan{u1 Tocrttlod ?uo uouo1nSay znuouory :^aF!X T ulotqspluu
s.:acnpo:d eqlJo sedols JallBlus sueau pusl
u1 'eltEnrts yucrlrlod eql e^Isualul ssal ?'d:
eqt (0, .0b) qEnorqt Eurssed uorlJunJ puEu
tJBd roJ ',(Fu1rurr5 'unlulldo IEIsos 3q: .-
eql puB 'eltsuelul ssal ,(1a,lt1e1eJ 3q Ill tf' ;rrlsele qllt\ pup 'eurlteJ actrd e rapun '',-:
Jallulus aru eurt8er acud e repun sulnl?i 3
JolceJ eql ;r ',(lezrrleuraqv 'leclluapl a-Jo suoJJe lecqrlod luutEruu ol sulnlsl au-l
seurEar eql 'saqsluB^ arueJaJJlp aql pw -)
SI SJ?:i::
aql 'lt ol wl eql Eutcnpar ,(q lo;1as:t r:,1:
pe^orqcB eq,(eu aSueqc eq1 'loJluoJ 3L'l'i:sesealcul leql uoJJo Eutleas-lua: 3ql J3pls-
sJeonpoJd al{l ,(q peqceer Jo utonb e iq :;'-ue eq ['ZI ernErg ur 0b 1e1 'uolleuls sli{: :.
lrun erllue eql sI xel eql puB 'atutr-a: r::-eql ot dn ,(1ear3 perrnbc? eq UEJ JoIJE-l ?.1
racnpord alturs u Jo slslsuoJ fulsnput ap '.
esec lutcads eql JoJ ,(lluarua,nuoc paun':rtmd ur sewt8er eql 3o (cuetcgJo a.\Ilc]l'-ier{] JoJ puuuep aql;o ,(1rcBse1a eqt (q p:'.:
uI c puB q sleuBd uI SocueJaJJIp OQI -Itl ::
uror; ,(etru JeqUnJ puB uollBsolle 3utztu:rpcrlrlod eql 8ul^otu uI paaocns ,(eq: e:'; -
eJor[ eql :,(lelrlrnlut palcadxa aq pl..':'suolleclldtul aJBJIe,t\ rleql areducl :
unuqtltnba IBJIlllod oql aIBInJIEJ '3-slnol -:
,{ue ro; elep ,{russaceu eql ue^IC 's[oJlur-l
-ureduoc ezIJolcBJEt{c qclq,tl suoIlIpuo I l'-aql qclq/( Japun suolllpuoc illeruirr:::
spoog )llqnd J'c] s::.:
c -v :ecueJoJrlo
gTg- :aur6al elonpg+y:aur6aracrl6

254 Policy Aspects of Public Goods
equilibrium. Similarly, if in a tax regime all producers are organized in alobby and operate in unison, o = I and the number of producers or theirorganization does not affect equilibrium. But a price regime is conduciveto free-riding.
The explanation for the importance of cooperation in determining thepolitical equilibrium of an industry is simple and the situation is familiarto observers of administrative controls. With a quota, every producer istrying to increase his or her utilization ofthe controlled factor and so does
a lobby arguing for its members. The political activists present convincingarguments aplenty. For the government it is relatively easy to yield to thepressure of a particular individual or lobby; the quantitative effect is rela-
tively small. In a price regime with a uniform tax rate, on the other hand,
the government is standing firmer - a concession to one producer or groupis a concession to the whole industry. Consequently, the greater the amount
of free-riding in a price regime, the stronger the comparative social advan-
tage of this control. Similar considerations underlie Rodrik's (1986) analy-sis of trade regimes, though he views subsidies as firm-specific.
By conventional wisdom, heterogeneity of the production units argues
in favour of price control as prices, bcing uniform, economize on informa-tion while, with heterogeneous producers, efficiency calls for unequal, in-dividually-tailored quotas. This argument was qualified by Weitzman(1974), who noted that for iterative planning there is no significant infor-mation difference between a price and a quota regime. In a political envir-onment, heterogeneity in production further affects equilibrium allocationas a more heterogeneous industry may tend to be more loosely organizedand have a larger number of free-riders.
5.4 A Caveat
The intuitive interpretations, and indeed Proposition I and particularly itsPart (i), should be accepted with care. The proposition is defined for theconditions of a political equilibrium. The equilibrium ratio s is endo-genously determined; the elasticity of the factor demand is also in generalan endogenous magnitude. These variables are components of a politicalequilibrium. The proposition, as indicated, characteizes lhe equilibrium: ifin equilibrium for a price regime (with negative externalities) lft I < I,price control dominates. It may however happen that even for an elasticdemand and a comparatively small lobby, the equilibrium value of s will be
so small that l# | > l, and then a quota regime will be more efficient. Thesituation is simpler for an inelastic demand and o = l; it is then assured
that l-r | > I and a quota control clearly dominates.
Finkelshtain & Kislev: Economic Re_i,-:-:
6 POLITICAL CONTRIBUTIO\S
The derivation of the conditions s:e:::..quotas, taxes, or subsidies - was ba-,e; :: '--,
equilibrium solely on the common p:rs:i,litical contributions, and with rhem rhe :: ,:producers and the politicians. depend ::the political process. We have examinec :-;the Harsanyi-Zusman model of cocpe:i':Zusman and Amiad, 1977), the equilibn .::lution to the bargaining game, and Grc,s=r..which employs the procedure of Firsr P::--.analysis is conducted under the assumri,t:_of a single industrial lobby and rhar in " ::..not participate in the political actir in T:.: :mines the total industrial political connr-'iby the producers in the indusul" are lefi i,: ':
The two political games differ rn l:.ethe cquilibriunr level of conuiburions. Brwith a single lobby, as is the case anal,, ze;the political surplus and the poliricians ::eIn Figure l2.l,rhe politicians are sire: .-:.,
divides the surplus and the equilibnum --.-:--
be located on the segment Dc in Figure i i -
As with political allocation. equiii'r:--:characterized unambiguously for posrr:,, e e,
limited to negative effects. The majr ::.:marized in Proposition 2 in which ihe .-,::terms of S-efficiency and a regime is re .,::.smaller political contributions rhan the .-:::
Proposition 2
With negative externalities,
(i) Both for a Nash solution of a c;':-:a First Price Menu Auction: rt. ::. :;lfi I < l, a quota regime induces " .-.price regime is the more efficien: : ::.-:
(ii) For a Nash solution, if l* I > i. ":: .-a larger or smaller polirical c.:::r:-

eqt Jo ozrs a^rleleJ oqJ 'uonnqrJtuos lecllllod ralleus ro re8rel up1ar,(,(eu aurEer BtonbB 'I >-o pue.l < ;$lgr.uonnlos qsENe roC (lt)
'loJluoc luerJgJe eJou eql sr aur8er ecrrde pue uortnqrruoJ lucrlrlod re8rel B secnpur eul8ar elonb e .l > I *l 'loruoJ xsl B Jepun urnrrqrltnbe ur 3r :uorlcny nuoru ecrrd tsJrC E
JoJ pue aue8 8ururc3req err.rleredoo, B Jo uorlnlos qsBN B loJ r{tog (t)
'serlrluuJolxe a^neBeu qlllt\
7 uogl.rsodo.r4
'lor1uoc e^nuuJellu eql ueql suorlnqrluoo pcqryod Jelletusol spBel ]l JI lueDUJs erour ,(1ezrr1e1er sr aurEer e pue trcuercuJs-s Jo surJalur pereduroc are seurr8er loJluoc eql qJrq/r\ ur 7 uorlrsodord ur pozrruru-IUns eJu srs,(1uuu aqt go sEurpug urBr.u aql .slJaJJe eleetau ol palrr.urlaJE suorsnlcuoo eql 'sorlrluuJolxe e^rlrsod ro; (lsnon8rqr.uuun pezualouJuqceq louuEc spJBir\ar pcllrlod wnrrqr[nba ,uorlecolle pcrlrlod rlll^\ sv
'1'91 arn8rg ur cq luau8as eql uo petecol oq[[I,t\ uoonlos lBqt ot Surpuodsauoc runuqrrnba aql puB snld:ns aql sepr^rpuorlnlos qs?N V'qa lueu8es eql ua,rrE eJu suurcrlrlod aql .I.ZI ern8rg u1'{trltn uor]u^Jasal Jraql uo uel oJe suercqrlod aqr pue snldrns pcrlrlod aqtIP se^Ia3eJ fuisnpul 3r{l 'aJeq paz(pue as?c eql sr se
"(qqo1 a18urs e qtvvr
'uorlcnv nuetrAl aJrJd lsrrC eql ,(g 'suorlnqr4uoc Jo la^el tunrJqrlrnbc eqlur - uorlnlos Jraql Jo aJnlBu eql ur JaJJrp saureS pcqrl0d o/l\l eq-L
'tas ol ,tqqo1 aql ol Uat oru ,fttsnpul aql ur sJarnpord aqt ,(qsuorlnquluoo lunpt,l,rpur oql :uounql:1uoc pcrlrlod pulsnpur plot eql seuttu-Jelap 'lepotu Jar{lro JoJ 'srs,(puu eql ",(il,trtce pcltllod aql ur eledrctued lou,(eru srecnpord ouros 'aurSor acud u ul ler.ll puu {qqo1 prgsnpul el8urs u 3osraqrrreu ore sracnpord IIB luql uorldurnsse eql Jepun pelcnpuo, sr srs,(puuaqt 'eroJeq sV 'uorlonv nuehi ecl.'d tsrrC Jo arnpacord eqt s,(oldrua qcq,nIapou (1661) s.ueurdleg pu? uBrussoJg puu .erue8 Eurure8req eqt ol uoqnl-os (0S6 I ) qsBN aql sr qrrr{^r Jo runpqrlrnba eql ,(LL6l ,pBIurV puu uerusnz:9/61 'uuusnT) 8ururcBmq a,rqeradooc Jo Iapou uutusnT-r,(uusJeH er{l:suorlElnuuoJ aueS anrluurellE o/$ pourrrBxa a^Bq al& 'ssocord pc4110d eqtJo scrlsrJalJBrEqJ JulncruEd eq1 uo puadep 'suercr1r10d oql puE sracnporder.{l uae^\teq snldrns eql Jo uorsr^rp eqt uaql qll^r pw ,suoqnquluoo
lecrtrl-od aql ',(cuarcgge pcqrlod;o ,(uadord uoruruoJ aqt uo ,(1a1os unuqrlrnbeJo uollulncl8c eqt30 eEas lsJg eql ur pssEq sE^\ - sarprsqns Jo .sex4 ,szlonb
- sralauerud uortEsollu aqt 3ur,(Srceds suorlrpuos aql Jo uorlB^lJop aqr
SNOIINSIUINOJ'IVCIU'IOd 9
SgZ acuan{u1 Tocttllod puo uorpp*ay olwouocg :^apty T ulotqqayqt
pernss* uaqr sI rr :I -;Hffi;JiXi;;;,eql 'tuelcgJe atotu eq 11tlr aur8ar Ylonb : 'jaq III/I\ s Jo enlE^ urnuqrltnba aqt '.a,qqcr1 1':::JrlsBIa u€ roJ ua^e rqt uaddeq Ja.\aflL-'J '.:'I > l +l (ser1r1eu:a1xa aatluEau qlr\\ 1 e:.gr :unuqrlrnbe eqt sazuaprlt {, 'petetlP'il }-:
pcqtlod u;o sluauodluo, aru selqslre,. -\a-lerauaE ur osle sI puuluep rolJEJ et+ JL' '::::-.-opue sr s oIleJ untrqrpnba aqf '[!nu;.':er{l JoJ peugep st uotltsodord aq1 'a:r-'::::'s1r,(pelncrped pue 1 uorlrsodor6 paapu: :-.
'sJ:p L -;:.pezrue8ro ,(1esoo1 aJou eq ol puat .ieu ';suorteoollB urnrrqtltnba slcaJJB Jaqun-I u.- : - r --rrnua lucrlrlod u u1 'erut8ar ulonb E pur ::--roJur luetgtutts ou st araql Suruueld :',::;:ueuzlre1Y\ ,(q pagrpnb su,u luaurnsrr .:-'-ur 'lunbeun JoJ slleJ ,(cuarog;a 'srarnp,:: ;-BuxoJuI uo ezlluouoJe'IruoJlun 3utr*1's : :'-
san8re $Iun uoucnpord oqt 3o ,tllau3sLaj;:i'cgrceds-urg sB soIPISqns s Y,::'.
-,(puu (9961) s.IIJpoU ellrapun suollure::s:-uB^pB Ieroos eAIlEJBdtuoc eqt Je8uors ;J: ;
lunoure aqt retuer8 aqt ',(puenbesuo3 (is-:dnor8 ro racnpord euo ol uolssssuos E - j;;'pusq Jeqlo aql uo 'aluJ xul lruoJlun E lli::'i.
-BIer sr lcaJJe a^Itetlluunb eqt i(qqo1 ro 3::eqt ot p1er,{ ol (sea ,(la,rrtelar sI lI lueuuj;'.Surcur,ruoc luaserd slsIAIlJe lucnrlod aql !-
seop os puu JolcBJ pollo.uuoc eql Jo uotl?z:'
sr recnpord ,fuane 'ulonb u qll1ysloruo:JellpuuJ sI uollpnlts eql pu€ eldurs st t:s:.eql Sutunuralap uI uollsJedooc 3o aJuzu];
a^rcnpucJ st eurt8ar acud e lng 'unpqrlrr,:
Jreql Jo srecnpord Jo Jeqlunu a{l pue | = Iu ur paztue8ro oJB sraonpotd 1p eurSar rz:
spoog u1qn4 {o stta;

256 Policy Aspects of Public Goods
political contribution in a First Price Menu Auction is not affected bythe magnitude of a.
The inequality condition in Proposition 2, part (i), is the same conditionas for allocative superiority of a price regime in Proposition l. The explan-ation being that with comparatively high allocative efficiency, I is rela-tively close to q' and the compensation needed to keep the politicians ontheir reservation utility (the segment ab in Figure 12.1) is low. Hence themore efficient the allocation in the political equilibrium, the smaller thepolitical contribution if the political process follows the procedure ofthe First Price Menu Auction. Also, the political surplus to be dividedbetween the politicians and the producers is small when allocativeefficiency is high, and so also the absolute contribution to the politicians isrelatively small - whatever their share by the Nash solution to thebargaining game.
Part (ii) in Proposition 2 is a consequence of the fact that a small lobby,relative to the size of the indusry, will often raise small amounts of politi-cal contributions. Hence, even ifthe sign condition indicates superiority ofthe quota regime (in terms of S-efficiency), it may still happen, in a par-ticular case, that a price regime induces smaller contributions.
7 SUMMARY AND EXTENSIONS
The principal findings ofthe analysis are:
(a) The comparative advantage of one of the regimes can be character-ized only for negative externalities. Then, if 16l < t, a price regimeinduces socially preferred allocation and relatively less intensive rent-seeking efforts.
(b) The political equilibria for negative or positive effects are not sym-metric. With negative externalities, the producers struggle to increasequotas under administrative control and they attempt to reduce thetax when regulation relies on prices. The political influence - underboth control regimes - results in increased employment of the regu-lated factor, compared to the social optimum utilization. With posi-tive externalities, on the other hand, depending on the control regime,the producers attempt to reduce quotas or to increase the subsidy. Theresults are different, higher subsidies increase production.
(c) Consequently, when the effects are positive, subsidization withpolitical influence may reduce welfare compared to a free market no-intervention situation.
Finkelshtain & Kislev: Economic Rr:.-;-(d) Political modification of a un:::::-,
subsidy - is a public gooC. The:::_:riding will erode rhe political r: -::regime.
The conclusions of the anall sis 3ie t:: -
work of the chapter, of external ene;.r. ri:of production. They can be exlentjej. :.-.
=the conclusions apply, with obricus :-.caused by a product or a service. Like;:sIimited to externalities, it applies tur i.:-... .tion: of a national government. a mun:::: la corporation. Political acrivir\ is p:e.::groups can gather around common tn:3:a!:
The political rewards are seen here :_. :.-..
ers to the politicians. The analysis --::. rwe did indicated that the conclusions c-- -:formulation of the model covers erp.::::rent seeking. Further, the anall,sis \\ Li x::costs and effects in the political prc.:e.scosts or decreasing effects yielded s:n-.r-:strengthened our confidence in the r:.:a:i .ein the chapter.
It is natural to expect political arr:,.r:.with a specific fixed factor or u[g1g 3-.-open access to all factors may erode ie ":cal struggle. We have therefore contrll: --:
given number of producers. Still. one s.-:.:activity where entry is not successfullr .:::be taken as examples. We hope ro re)t- _:
this direction.
Notes
l. We received useful commenrs r:: :-Hillman, Yair Mundlak, Manin pi.=: \
2. The rewards, C and ci, do n..r :::e- .:Nash solution determining eirhe: ;':: q -equation determining the rerr ard:.
3. The conditions characterizins efi:.:,-.: =:ing W in (4), with respecr ro r.e ,=.-isubject to an arbitrary pre-assirne: r i_:
4. Remember that d,q,) stands fcr pr--::, :t:
'sarprsqns ro sexel atoJeq slgord roJ spusls (pv wrll reqrueue1 .,i:rsnpur eql ur euocur plol F Jo enlel pauErsse-erd frurlrqre ue oi tcelqni
'rb:o l:aqrra) slorluor eql pue spre^{eJ eql ol lcdser qll/h.(r) urr6.Eul-zrrurxeru ,(q pelHep e:e unFqrgnbe luercgJe turzFelcereqc suorlrpuoc eql .E
'spru,reJ eqt Surururalap uorlenbeaqr ur readde op slorluoc eql elrqt\ ,b:o J reqgra tururturelap uonnlos qsBNaut _Io suorlrpuoc lapro-lslg aql ur readde tou op ,,J pue, ,spl?A\er eqJ .Z'rrEr.usnz s?quH puB reuun/t\ UaqroN .ruBpled uruehl ,{€lpunIAI rrBI .r.mtullrH:uy uro:; suorlsatEns arrrlcnpo.rd pu? sluaruuoc InJesn palreceJ aA\ .I
saloN
'uorlseJrp srqlur uorsualxe uB uo sJnlnJ 3ql ur uodeJ ol edoq e16 .selduexe sE u?{H aqUEJ sarlsnpur ULrBJ lsJe^as :pel[url ,(lpJsseccns 10u sr /fulue eraq,r ,(1ra,r1cupcrlrlod esuelur se^resqo eurleuos euo .llps .sracnpord
3o requnu ua^r8e qtra,r (4snpur uB ol srs[luu? eql peuguoc aJoJereql e^eq e71\ .el8EnJls
IEc-rtr1od,(psoc eqlJo slueue^erqc? ar{l opoJe,(uu srolceg IIB ol ssecc? uedopuB ,{rlue eeU se 'pelltull sr rJlue eJoq/r\ Jo JolcBJ pexg cgrJeds s qu^\sarlsnpur ur {1uo punoJ eq 01 {lr^rlcu luJrlllod lcedxe ot IBJnlEu sl 1I
'JeldBr.lc eql urpatuosaJd srs/(lBuB er{l Jo suossal urelu eql ur ecuepguoc Jno peueqlEue4ssSurpug asar4J 'suorsnlJuoc relrurrs pepler,( slceJJe Burseetcap Jo slsoc3ursuarcur r{lr^\ sluerurJedxg .ssecoJd pcrlrlod aql ur slceJJe pup slsocluEtsuoo Surrunsse ,(q aldrurs epBru sB/h srs,(1eue eql .JeqUnC .Sunleos luerur saJJnosal IBeJ Jo uorluzrlrln llcrldxe sJeloc Iepour aql Jo uonelnr.rroJaq: ;r eSuuqc 10u op srs,(1uuu eql Jo suorsnlcuoJ eql lBrll pelBJrpul plp e/r\qro,tr ,(reururlaJd 'peleJoqule oq uuc srsfleuu aqJ .suercrlrlod aql ol sJe-onpo:d eql ruor; sJeJSuEr eruocur su aJeq uees eJu spre^\eJ pcqrlod eq1
'slseJalur uoluruoc punore JaqlBA u?c sdnor8qlrq,r ur uorluzru?8Jo ,(ue ur luese.rd sr ,(lrzrrlce IBcrlrlod
.uor1u:od:oc eJo lualue8euBrx oql ua^o ro ',(lrpdroruntu e .lueuruJe^oE
lBuorl?u B Jo :uorl-ua.\Jatur e^rluJlsrurupu Jo asec ,(ue ol serlddu lr .sonlluuJelxe ol pelrurliluessaceu lou sr srsfpuu eql .esrA\e{r.I .eJrAJes u ro lcnpord e ,(q pasnecslJaJJa lBuJelxa ol 'suorluogrpou snorlqo qlrt\ ,,(lddu suorsnlJuoc eql'alduruxa loC 'suorloeJrp IBJeAos ur pepuelxe eq uec ,(eq1 .uorlcnpord goJotJBJ e Jo asn aql qllrtr pelurrossu slcaJJe luurelxo Jo
,reldeqc aql Jo {Jo^\-airrE{ pagrldurrs eql ol peuguoc lou eJu srs,(pue eql Jo suorsnlouoo eql
'erurBaracud e ur dnor8 lseJalur aql go raznod lecnllod eql apoJe lprrr Burprr-aa{ turll pelJedxe eq uur ll ,oroJaJeqJ .poo8 crlqnd e sr - ,(prsqnsE Jo x't E - lueurnJlsur esrJd ruJoJrun B Jo uorlsrgrpotu lBcrlrlod (p)
LgZ acuan{u1 lDJullod puD uogolnSay ctwouosg :^apty T ulDjqslayql
-ou le{JBru eaJJ 3 ol peJBdIIroJ erBJia,$ a3nB;
r{lr^\ uorlszrprsqns 'sAIlISod eJE slJaJJa a:
'uoncnpoJd esaeJcul salptsqn-s lalaqa'fprsqns eql esBalcul ol Jo saonb ef,np€j
'aur8eJ Io4uoo al{l uo tuPuadap'plrBl{ ra{,'Ll
-rsod qlll& 'uoIlBzIIIln urnulldo IEIrcs aul .-
-n8ar aql Jo luau,(oldtuo pesealJul uI slltis;-repun - ecuenuul IBoIIIIOd eq,L 'secud uo s.
eql ecnpeJ ol ldluellB ,(eqt puu loJluof 31::esBeJcur ot el88ruts sJeJnpoJd etp 'saollPtu;:-u,(s lou eJB slcaJJe eAIlISod ro sAIlPAau l'1-:
-luar e^rsuelut ssal [1errr1u1eJ pue uonBJol{E a
eurEer eclrd B 'I > l+lJI 'ueqJ 'sanllEll::r-re13EJ3q3 Aq UBJ S3I[IEaJ aql Jo auo ;c ei:
:AJB SISiTE'x
S.\OIS.\
'suollnqlrluoc JallBlus seJnPu: ::-red e ur 'uedduq IIps [Eur tt '((cuatogJa--c :
;o ,{luouadns selBJIpuI uolllpuo3 uSls aql -:: .
-p11od go stunoure IIEtus esIEJ uauo llt rA '\:t',(qqo1 lpurs e luql lJeJ eql go acuanbosllral i
oql ol uollnlos qspN eql ,(q eJeqs lMsr suurcrlrlod oql ol uoqnquluoc slnlosq? J.;l
a^qucollu ueq^\ il?rlrs sI sJesnpoJd 3q: :
pepl^p aq o1 snldrns pcrlrlod eql 'oslY 'i
3o ernpacord eql s^\olloJ ssacord PrnllNeql JellBrus oql 'tllnuqlllnbe pcnrlod arir u:
eql ocuaH '/t\ol sI (1'71 ernSrg ur gn tuauS;uo suurcrlrlod eql dea{ ol papaau uotlesuaJ:
-BIaJ sr oD ',(cuercg;a e^Ilucolle q8rq .i1ari;-ueldxe eql 'I uonlsodor6 ur euISaJ a:ud ruoqrpuoc etu?s eql sl'(l) wd '7 uontsodo:.i
[q patcagp lou sI uoq3nv nuery aJud lsJU !
spoog rtlqnd ]'o sl)?:t

258
References
Policy Aspects of Public Goods
Atkinson, A. B. and J. E. Stiglitz (1980) Izctures on Public Economics (NewYork: McGraw-Hill).
Coase, R. H. ( 1 960)'The Problem of Social Cost', J oumal of lnw and Economic s,vol.3, no. I, pp. 1-44.
Finkelshtain, I. and Y. Kislev (1995) 'Prices vs Quantities: The PoliticalPerspective', Working Paper, 9508, The Center for Agricultural'EconomicResearch, Rehovot, Israel.
Grossman, G. M. and E. Helpman (1994) 'Protection for Sale', AmericanEconomic Review, vol. 84, no. 4, pp. 833-50.
Hillman, A. L. (1989) The Political Economy of Protection (Chrt: Harwood).Nash, J., Jr (1950) 'The Bargaining Problem', Econometrica, vol. 18, no. 1,
pp. 155-62.Rodrik, D. (1986) 'Tariffs, Subsidies, and Welfare with Endogenous Policy',
Journal of International Economics, vol. 21, pp. 285-99.Scarpa, C. (1994) 'Regulation as a Bargaining Process: Negotiation Over Price
and Cost Reducing lnvestments', Oxford Economic Papers, vol. 46, no. 3,pp. 357-65.
Weitzman, M. L. (1974) 'Prices vs Quantities', Review of Economic Studies,vol.41, no.4, pp. 477-91.
Zusman, P. (1976) 'The Incorporation and Measurement of Social Power inEconomic Models', International Economic Review, vol. 17, no.2,447-62.
Zusman, P. and A. Amiad (1977) 'A Quantitative Investigation of a PoliticalEconomy - The Israeli Dairy Program', American Journal of AgriculturalEconomics, vol.59, no. I, pp.88-98.

Taxes and subsidies in a polluting andpolitically powerful industry
Israel Finkelshtain, Yoav Kislev*
Department of Agricultural Economics and Management, The Hebrew University,
P.O. Box 12, Rehovot 76100, Israel
Received 9 June 2003; accepted 1 May 2004
In memory of Professor D. Gale Johnson
Abstract
This paper analyzes the effect of political pressure on taxes and subsidies in a polluting industry.
Two innovations are offered: (a) The model of the analysis is simple; it is based on profit
maximization, the participation constraint, and that politicians are willingly influenced. No additional
structure is assumed. (b) It is shown that the conventional conclusion that, as pollution controls, taxes
and subsidies are equivalent, does not hold in the presence of political pressure—both in short-run
and in the long-run. In addition, production is generally not efficient in a political equilibrium and
costs are not minimized.
# 2004 Elsevier Inc. All rights reserved.
JEL classification: D78; H23
Keywords: Pigovian taxes; Subsidies; Lobbies; Political equilibrium
A great believer in free markets, D. Gale Johnson devoted his long professional career to
the study of the effect of public policies on prices, production and welfare in agriculture.
World Agriculture in Disarray (1991) is still a must reading for anyone interested in farm
policies and their intended and unintended effects on farmers, consumers, and taxpayers—
in industrial as well in developing countries. We hope that the analysis of policy formation
in the presence of politically powerful groups, offered in this paper, contributes to the
clarification of issues that were in the center of Professor Johnson’s interest.
Journal of Asian Economics 15 (2004) 481–492
* Corresponding author. Tel.: þ972 8 9489229; fax: þ972 8 9466267.
E-mail address: [email protected] (Y. Kislev).
1049-0078/$ – see front matter # 2004 Elsevier Inc. All rights reserved.
doi:10.1016/j.asieco.2004.05.005

1. Introduction and summary
In this paper we examine regulations implemented to reduce pollution in a competitive
but politically powerful industry. Agriculture can serve as an immediate example. The
paper has three messages. The first two deal with contents: (a) the symmetry of the effects
of taxes and subsidies breaks down, even in the short-run, in the presence of political
pressure; (b) production is inefficient (it is not at minimum AC) both in the short- and long-
run. The third message concerns method: an analysis of the political economy can rely
solely on general assumptions of individual rationality; in particular, on what game
theorists term the participation constraint. It is not necessary to formulate a detailed
model with stronger assumptions in order to reach our conclusions.1
It is an established finding of analysis, relying on marginal economic principles, that a
socially optimal level of pollution can be achieved by either a tax per unit of discharge or a
subsidy per unit of reduced emission (for a survey and references, see Cropper & Oats,
1992). The symmetry of the two control instruments was, however, criticized on several
grounds, the most common being the marked difference in their long-run effects.
A series of studies focused on endogenous (long-run) entry (e.g., Kamien, Schwartz, &
Dolbear, 1966; Kohn, 1985; Polinsky, 1979). The general conclusion that emerged was that
a tax regime is more efficient than a subsidy, since it yields fewer active firms, smaller
pollution levels and lower production costs. Moreover, several studies have shown that,
with subsidies and in the long-run, pollution may be greater than its free market, non-
intervention level. Fisher (1981) pointed out incentives of strategic behavior: firms could
increase pollution in anticipation of future subsidies.
Although the main criticism of the symmetric effects of taxes and subsidies focused on
the long-run, some authors questioned its short-run validity. For example, Just and
Zilberman (1979) showed that, with uncertain externalities, subsidies decrease risk of
pollution, while under a tax regime, pollution reduction depends on additional restrictions
on the structure of risk preference. Differences in income and profits were the principal
sources of asymmetry in the effects of the alternative regimes in the last study as well as in
those quoted earlier.
More often than not, government intervention, even if well intended, induces lobbying
and political pressure. Interest groups organize in order to modify policies: either to fend-
off threats or to exploit opportunities. This paper shows that—even with full information,
no strategic behavior, and predetermined industry size—the political equilibrium with
taxes and subsidies is asymmetric. In the short-run, a tax regime leads to over-production of
the polluting good, while with subsidies, too little is produced.
Our analysis of the political economy shows, further, that asymmetry of controls also
prevails in the long-run. Taxation reduces output and pollution, while subsidization
increases them. Except for one special case, production is not efficient under both regimes:
with taxes, firms produce more than the cost minimizing quantity, while with subsidies,
they produce less than this amount. The upshot is that, contrary to the professional
1 Elsewhere (Finkelshtain & Kislev, 1997) we demonstrate asymmetry in a general equilibrium analysis
conducted in a more structured model.
482 I. Finkelshtain, Y. Kislev / Journal of Asian Economics 15 (2004) 481–492

conventional wisdom, in the presence of political pressure, a tax regime may be inferior
both to a non-intervention, free market equilibrium and to a subsidy regime.
2. The economy and the environment
There are N identical polluting firms in a competitive industry. The producers disregard
negative externalities associated with their activities. We study the consequences of
regulation in this industry in the short-run, when N is given, and in the long-run, when
N is endogenous and determined as part of the political-economic equilibrium. Several
simplifying assumptions are adopted: (1) the analysis is of partial equilibrium, focusing on
the industry and its regulation; (2) firms are identical; (3) pollution is proportional to
output, q, with a proportionality coefficient e; (4) the polluting sector, assumed to be small
and competitive in the input market, faces constant input prices; (5) the cost function, c(q),
increases and the long-run average cost is U-shaped; (6) all functions are second-order
differentiable and interior solutions are assumed throughout.
Social welfare is measured as total economic surplus
VðQ;NÞ ¼Z Q
0
pðzÞdz � NcQ
N
� �� eQ; (1)
where p( ) is the decreasing inverse demand function for the product, defined over total
industry output, Q ¼ Nq.
3. The political economy
The government, aiming at pollution control, chooses a regulation instrument, either a
tax or a subsidy. Once an instrument was chosen, producers endeavor to affect the ensuing
policy but, by assumption, the choice itself is not subject to political debate and influence.
3.1. The polity
Each producer in the regulated industry contributes the sum r (dollars per year) as a
political reward. The rewards may take the form of aid in campaigns, demonstrations, letter
writing, or even outright bribes. We assume that the producers understand the significance
of the political activity; free riding is not practiced. The politicians, accepting the rewards,
are ready to modify regulation policies. Accordingly, the politicians are seen as max-
imizing W in
W ¼ WðV ;RÞ; (2)
where V is defined in (1) and R ¼P
r ¼ Nr is the sum of the political contributions in the
regulated industry.
By (2), the politicians are interested only in the total sum, R, contributed by the industry;
its distribution among the producers makes no difference. However, as indicated, we
assume that firms are identical and each producer contributes the same r. One special case
I. Finkelshtain, Y. Kislev / Journal of Asian Economics 15 (2004) 481–492 483
deserves attention: sometimes industries, collecting political contributions, impose levies
in proportion to output, r ¼ rq. It will be shown in the following that this proportionality
modifies one of the conditions of the long-run political equilibrium.2
Long-run equilibrium in a competitive industry is characterized by zero profits.
However, at any point in time, firms own tangible and intangible productive assets the
returns to which they maximize. As part of their activities, producers are ready to
contribute to political causes—whether they realize or do not realize the long-run zero
profit destiny of the industry.
The producers in the industry attempt to maximize profits while the politicians (the
government) strive to maximize their own welfare W. The parties are seen as striking a deal,
trading regulation reforms against political rewards. The details of the deal are not
specified, but it is assumed that the social optimum [the set of policies maximizing
(1)] is the threat-point of the political game: if the producers do not keep their part of the
bargain, the government is powerful enough to force a tax or subsidy maximizing social
welfare. The producers may also threaten to accept the welfare-maximizing instrument and
deprive the politicians of the desired reward R.
3.2. Rational participation
Two groups of models have been applied to the study of policy formation in the presence
of political activity. The first employs explicit game formulation; examples are Zusman
(1976) using a Nash (1950) cooperative bargaining game and Grossman and Helpman
(1994) who model the political process as a non-cooperative auction game. Fredrikson
(1997) applies Grossman and Helpman’s model to study pollution taxes in an open
economy. Peltzman (1976) and Hillman (1989) belong to the second group. In their work,
the government is viewed as setting policy parameters in order to maximize a political
support function that trades the welfare of voters with divergent interests.
Individual rationality is an integral part of all game-theoretic models, both cooperative
and non-cooperative. Actors will not take part in a game unless their reservation utility is
maintained. This axiomatic prerequisite, that the utility of joining a game must be at least
as great as the opportunity foregone, is incorporated in formal models as the participation
constraint. A similar rationality assumption can also be attributed to models in the second
group of studies, although generally individual behavior is not part of their explicit
formulation.
In the analysis to follow, individuals or firms may form lobbies and invest financial or
other resources to influence political decisions. Apart from profit maximization, the only
behavioral assumption is that the producers are politically active only if the participation
constraint is satisfied; a more detailed behavioral structure is not assumed. Consequently,
the conclusions do not rely on any particular form of the political process. Simplicity and
generality are convenient and powerful attributes of a theoretical analysis but, needless to
say, they limit the scope of the issues considered. We shall comment on limitations in the
conclusion of the paper.
2 We are indebted to Ayal Kimhi for this insight.
484 I. Finkelshtain, Y. Kislev / Journal of Asian Economics 15 (2004) 481–492

4. Short-run equilibrium
This section is devoted to a description of short-run industrial equilibrium, where the
number of firms is given, �N. Denote the profit of the typical firm by p ¼ pq � cðqÞ, and
mark by a superscript pr free market, non-intervention variables. Accordingly, in the
absence of intervention, the profit maximizing output of a single firm is
qpr ¼ arg maxq�0
½pq � cðqÞ�; (3)
yielding the short-run equilibrium condition:
pprð�NqprÞ � c0ðqprÞ ¼ 0: (4)
With pollution, the equilibrium defined by (3) and (4), though profit maximizing, is socially
not optimal. We turn therefore to welfare maximization and continue with the incorpora-
tion of political pressure and the demonstration of the asymmetric effects of the control
instruments.
4.1. Welfare maximization
In the short-run, socially optimal, welfare maximizing output, Qw, is
Qw ¼ arg maxQ�0
½VðQ; �NÞ�; (5)
with the first-order condition:
pðQwÞ ¼ c0Qw
�N
� �þ e: (6)
Production by (6) is lower than by (4); namely, for the industry Qw Qpr ¼ �Nqpr and at the
firm qw qpr. This motivates government intervention.
The government may use either of two alternative instruments of intervention. First, it
may levy a per-unit tax, t, on production; namely, a firm producing under a tax regime qt
units of output, pays taxes to the amount tqt. Second, the government may subsidize a
reduction in the production of each firm below some predetermined level, �q. In this case,
the typical firm is paid a subsidy of sð�q � qsÞ.3The implementation of the control regimes modifies the private first-order conditions
and it becomes
pð�NqtÞ � c0ðqtÞ ¼ t and pð�NqsÞ � c0ðqsÞ ¼ s: (7)
In the absence of political pressure, the government takes into consideration condition (7)
and sets per unit tax or subsidy to maximize V. The first-order conditions for the choice of t
and s are, respectively,
@V
@t¼ �Nðpð�NqtÞ � c0ðqtÞ � eÞ @qt
@t¼ 0; (8)
3 If �q is too small, firms may give up the subsidy rather than lose income. We shall therefore assume, for
simplicity, that �q is set at minimum AC.
I. Finkelshtain, Y. Kislev / Journal of Asian Economics 15 (2004) 481–492 485

and
@V
@s¼ �Nðpð�NqsÞ � c0ðqsÞ � eÞ @qs
@s¼ 0: (9)
Since @qt=@t < 0 and @qs=@s < 0, the expressions ðp � c0ðqtÞ � eÞ and ðp � c0ðqsÞ � eÞmust vanish and, comparing with (7), it is seen that the control measures are set at
t ¼ s ¼ e, yielding qt ¼ qs ¼ qw. At these levels of production, pollution will be socially
optimal in the short-run—with a given number of producers—although production may be
inefficient: if, before the imposition of the control, firms were at minimum AC, they
produce with government intervention at lower q levels.
4.2. Asymmetry of political effects
Proposition 1 characterizes short-run political equilibrium.
Proposition 1. Consider the regulation of a polluting and politically powerful industry
with a predetermined number of firms. Then:
(i) Under a tax regime, 0 < t < e and, therefore, equilibrium production and pollution
exceed the socially optimal levels but fall short of the free market, non-intervention
levels;
(ii) Under a subsidy regime, 0 e < s and, therefore, equilibrium production and
pollution fall short of both the free market, non-intervention levels and the social
optimum.
Proof. In a political equilibrium, under a tax regime, satisfaction of the participation
constraint implies
ptqt � cðqtÞ � tqt � r > ptq̂ � cðq̂tÞ � eq̂t; (10)
where q̂t ¼ c0�1ðpt � eÞ and the right hand side of (10) is the threat-point of the political
game. Note that q̂ maximizes profits when the market price is pt and the tax is e and, also, at
the threat-point the reward r ¼ 0. By (10), the perceived net profit at the threat-point should
not exceed profits at the political equilibrium.4 The calculation, at the threat-point, of
profits for the price prevailing when the instrument t is implemented, is a reflection of the
myopic outlook of the producers who do not comprehend fully the market equilibrium
that will prevail if their threat ever materializes.5From q̂t being profit maximizing, it
follows that
ptqt � cðqtÞ � eqt < ptq̂t � cðq̂tÞ � eq̂t: (11)
4 Formally, (10) could be written as a weak inequality; however, if equality prevails, the participation
constraint is barely satisfied but producers still have to invest in lobbying activity. In most cases, they will prefer
the threat point, t ¼ e and r ¼ 0. We therefore wrote (10) as a strict inequality.5 Note that if the producers do comprehend the equilibrium condition, then they understand that the realization
of the treat-point (t ¼ e) will raise prices above pt . However, the inequality in (10) will remain valid.
486 I. Finkelshtain, Y. Kislev / Journal of Asian Economics 15 (2004) 481–492

Combining Eqs. (10) and (11) we find ðe � tÞqt � r > 0 and, as r � 0; and t � 0, 0 t < e,
as proposed. With t between 0 and e, Qw < Qt Qpr.Similarly for subsidies, the
participation condition is
psqs � cðqsÞ þ sð�q � qsÞ � r > psq̂s � cðq̂sÞ þ eð�q � qsÞ; (12)
here q̂s ¼ c0�1ðps � eÞ. Now, replacing the right hand side of (12) by psqs � cðqsÞþeð�q � qsÞ it is seen that ðs � eÞð�q � qsÞ � r > 0: Since ð�q � qsÞ � 0; it follows that
s > e � 0; as proposed.
By Proposition 1, under a tax control, the political equilibrium is a compromise, with
production between free market and the socially desired level. A subsidy regime, on the
other hand, induces too little production and ‘‘too little’’ pollution. The intuitive explana-
tion is simple. Under taxes, the political pressure is to reduce the tax; while with subsidies,
it is to increase the subsidy, up to and above the social optimum. (Political pressure may
eliminate a tax altogether or even turn it into a subsidy. We are not considering these
possibilities here.)
A Pigovian tax, being a compromise, even if modified by interest groups, is welfare
enhancing. Not always so under a subsidy; with political pressure, a subsidy—being too
high—may reduce welfare relative to non-intervention equilibrium. The situation is even
more ambiguous, since both taxes and subsidies are not optimal and they operate in
opposite directions, welfare loss under a subsidy regime may be smaller than under a tax.
5. The long-run
In the long-run, the number of firms in the industry, N, as well as the tax or the subsidy,
are endogenously determined, affecting both pollution and intra-firm production effi-
ciency. As indicated in the Section 1 of the paper, it has already been established that, in the
long-run, pollution reducing subsidies cannot improve welfare. For completion, we repeat
this finding and then show what equilibrium is reached if the government—despite the
theoretical admonitions—opts for subsidies and the regulated industry is politically
powerful.
5.1. Welfare maximization in the long-run
Optimal, welfare maximizing, industrial output and number of firms are
ðQw;NwÞ ¼ arg maxQ;N�0
½VðQ;NÞ�; (13)
maintaining the first-order conditions:
pðNqÞ ¼ c0ðqÞ þ e; (14)
cðqÞq
¼ c0ðqÞ: (15)
Eq. (15) is the familiar long-run condition of minimum average cost. The competitive
non-intervention equilibrium is characterized by (15) and p(Q) ¼ c0(q), which leads to
I. Finkelshtain, Y. Kislev / Journal of Asian Economics 15 (2004) 481–492 487

over-production of the polluting good. The government may then levy a tax or offer a
subsidy. The conditions of the ensuing long-run equilibrium at the firm level are now
presented in pairs, for taxes and subsidies,
p ¼ c0ðqtÞ þ t p ¼ c0ðqsÞ þ s; (16)
p ¼ cðqtÞqt
þ t p ¼ cðqsÞ � s�q
qsþ s; (17)
from which we get
cðqtÞqt
¼ c0ðqtÞ cðqsÞ � s�q
qs¼ c0ðqsÞ: (18)
A comparative static analysis of the effect of a tax and a subsidy on output and the number
of firms is detailed in the Appendix A. It yields the following signed derivatives
dq
dt¼ 0;
dq
ds< 0; (19)
dN
dt< 0;
dN
ds> 0; (20)
and
dQ
dt< 0;
dQ
ds> 0: (21)
As Eqs. (19)–(21) exhibit, with subsidies and in the long-run, firm production is less than
non-intervention output, the number of firms is greater and total production of the industry
also increases. Thus, efficiency is impaired and pollution increases. A rational government
will not choose subsidy as a pollution-regulating instrument (an optimum subsidy cannot
be found mathematically). Under a tax regime, as the signs indicate, intervention does not
impair intra-firm efficiency and it reduces total output and pollution.
Fig. 1 depicts average and marginal cost. AC and MC are for a free market situation. ACe
and MCe in the tax panel are the graphs of the cost functions when a tax t ¼ e is imposed.
Production stays at q0 (min AC). Parallel graphs are not shown in the subsidy panel since,
as indicated, equating s ¼ e does not set an optimum subsidy for the long-run. The graphs
MCt and MCs and the corresponding average cost curves represent political equilibrium
and are introduced in the following.
We show now that under a tax regime, the optimal policy is, as in the short-run, to set
t ¼ e. Maximizing (13), the first-order condition can be written as
VQ@Q
@tþ VN
@N
@t¼ 0: (22)
Inserting the comparative static derivatives from the Appendix A and recalling (15), one
gets
VQ
1
p0þVN
1
qp0 ¼1
p0 pðQÞ�c0Q
N
� ��e � 1
qc
Q
N
� �þ qc0
Q
N
� �� �� �¼ 0) p¼ c0 þ e:
(23)
That is, t ¼ e maximizes welfare. We turn now to the political equilibria.
488 I. Finkelshtain, Y. Kislev / Journal of Asian Economics 15 (2004) 481–492

5.2. Asymmetry of political equilibria in the long-run
Proposition 2 characterizes the long-run political equilibrium for both a tax and a
subsidy regime. Before presenting the proposition, we introduce the notations:
Qw ¼ N arg minq
cðqÞ þ eq
q
� �; (24)
q0 ¼ arg mincðqÞ
q
� �q
: (25)
to mark the socially optimal and efficient, long-run output of the regulated industry and the
firms in the industry.
Proposition 2. Consider the regulation of a polluting and politically powerful industry.
The political long-run equilibrium is characterized by:
(i) Under a tax regime, production and pollution form a compromise between the
corresponding socially optimal and the free market, non-intervention level; that is,
Qw < Qt < Qpr:(ii) Under a subsidy regime, production and pollution exceed the free market, non-
intervention level; namely, Qs > Qpr > Qw:(iii) Except for the special case of proportional contributions (r ¼ rq), under both
regimes, cost of production is not minimized. With taxes, qt > q0, under a subsidy
regime, qs < q0:
Fig. 1. Long-run equilibrium.
I. Finkelshtain, Y. Kislev / Journal of Asian Economics 15 (2004) 481–492 489

(iv) When r ¼ rq, then under a tax regime, q is optimal, qt ¼ q0:(v) Under a tax (subsidy) regime, the per-unit tax (subsidy) is smaller (larger) than the
per-unit pollution coefficient, t < e ðs > eÞ:
Proof. To prove that Qt < Qpr; we show that pt > ppr: From the long-run and zero profit
condition, we have
pt ¼ minq
cðqÞ þ r þ tq
q(26)
and
ppr ¼ minq
cðqÞq
(27)
Recall now that at the threat-point t ¼ e and r ¼ 0, in a political equilibrium, t < e, r > 0 (the
last inequality may be termed the participation constraint of the politicians). In both cases r
þ tq > 0, yielding pt > ppr; as required.
To prove that Qt > Qw, we show that pt < pw ¼ pðQwÞ: Write
pw ¼ minq
cðqÞ þ eq
q¼ cðqwÞ þ eqw
qw; (28)
where qw minimizes ðcðqÞ þ eÞ=q. Turn now to the participation constraint. By (26), the
left-hand-side of (10) is zero and, therefore, the right-hand-side is negative. So also, if q̂ is
replaced by qw; ptqw � cðqwÞ � eqw < 0: Rewriting,
pt <cðqwÞ þ eqw
qw¼ pw: (29)
This completes the proof of (i).
To prove (ii), we show that ps < ppr. Write
ps ¼ minq
cðqÞ � sð�q � qÞ þ r
q
� � min
q
cðqÞq
� �þ min
q
r � sð�q � qÞq
� �
¼ ppr þ minq
r � sð�q � qÞq
� �: (30)
It was shown following (12) thatsð�q � qsÞ � r > eð�q � qsÞ > 0: Hence
minq
r � sð�q � qÞq
� �< 0: (31)
Substituting into (30), the proof of (ii) is completed.
To prove (iii) for a tax regime where r is not proportional to output, note in Fig. 1, the
marginal cost that the firm faces, MCt, is higher than MC; that is for every q,
MCt ¼ MC þ t: The difference in average cost is larger, ACt ¼ AC þ t þ r=q: Conse-
quently, production is to the right of min AC.
Under a subsidy, MCs ¼ MC � s; MCs is lower than MC. For average cost, ACs ¼ ACþ½r � sð�q � qÞ�=q ¼ AC � s þ ðr � s�qÞ=q: We have already seen that r � sð�q � qÞ� < 0:
490 I. Finkelshtain, Y. Kislev / Journal of Asian Economics 15 (2004) 481–492

Hence ACs is also lower that AC, but the difference is larger than for marginal cost.
Production, in Fig. 1, is to the left of min AC.For (iv), note that if r ¼ rq, in Fig. 1,
ACt ¼ AC þ t þ r and also MCt ¼ MC þ t þ r: Hence average and marginal cost rise
equally and qt ¼ q0:Finally, (v) was proved to hold for the short-run and similarly, it can be shown to hold for
the long-run.
Several aspects of the proposition deserve attention. First, in the presence of political
pressure, government intervention, in an economy with external effects, may reduce
welfare. This is true both for a tax and a subsidy regime. Second, unlike intervention in a
non-political world, production under a tax regime is inefficient, taxes may reduce welfare,
and may even be dominated by a subsidy control. Third, as in a non-political world, in the
long-run, a subsidy regime always increases pollution and production costs and reduces
welfare in comparison with free market equilibrium.
6. Concluding remarks
It was shown in the paper that political pressure affects the efficiency of regulation
and production, both in the short-run and the long-run. Considering the reality of
political influence, the only surviving conclusions of the normative, politically free
analysis is that taxes improve welfare in the short-run and subsidies reduce it in the long-
run. Neither control assures socially optimal production and pollution when producers
are politically active and politicians are willingly influenced. Moreover, the alternative
controls, taxes or subsidies, can only be ranked if specific behavioral functions and
magnitudes are known. Relying on the elementary assumption, that the participation
constraint is satisfied in the political equilibrium, we could complete the qualitative
analysis and show the directions by which political pressure modifies welfare enhancing
policies. Nevertheless, weak assumptions limit the scope of the analysis. As an example,
the analysis in the paper could not determine the magnitude of the political contributions
in equilibrium, not even the relative magnitude of the contributions associated with
taxes compared with the rewards agreed upon under subsidies. More detailed and
explicit formulation is required to answer such questions. Similarly, a complete analysis
of the effect of the sometime suggested policy that taxes be imposed only on incremental
production, on output above a certain preset threshold, could not be conducted with the
structural assumptions in this paper. These shortcomings are the costs of simplicity,
generality and robustness.
Appendix A. Comparative statics
Rewrite (16) and (17)
pðNqtÞ � c0ðqtÞ ¼ t pðNqsÞ � c0ðqsÞ ¼ s (A.1)
pðNqtÞ � cðqtÞqt
¼ t pðNqsÞ � cðqsÞqs
¼ s 1 � �q
qs
� �: (A.2)
I. Finkelshtain, Y. Kislev / Journal of Asian Economics 15 (2004) 481–492 491

In the analysis, the variables q, N and Q are taken as endogenous while t and s are
considered exogenous parameter. For the tax and subsidy cases, and t ¼ s ¼ 0, where
Eq. (15) holds:
Np0 � c00 qp0
Np0 qp0
� � dq
dtdN
dt
264
375 ¼ 1
1
� �(A.3)
Np0 � c00 qp0
Np0 qp0
� � dq
dsdN
ds
264
375 ¼
1
1 � �q
qs
" #(A.4)
Employing Cramer’s rule, condition (A.3) and (A.4) yield:
dq
dt¼ 0;
dq
ds¼ � �q
qc00< 0; (A.5)
dN
dt¼ 1
qp0 < 0;dN
ds¼ 1
q2
N�q
c00� �q � q
p0
� �> 0; (A.6)
and
dQ
dt¼ 1
p0 < 0;dQ
ds¼ q � �q
qp0 > 0: (A.7)
References
Cropper, M. L., & Oates, W. E. (1992). Environmental economics: a survey. Journal of Economic Literature, 30,
675–740.
Finkelshtain, I., & Kislev, Y. (1997). Political lobbying and asymmetry of Pigovian taxes and subsidies.
(Working Paper 9703). Rehovot, Israel: The Center for Agricultural Economic Research.
Fisher, A. C. (1981). Resource and environmental economics. Cambridge: Cambridge University Press.
Fredrikson, P. G. (1997). The political economy of pollution taxes in a small open economy. Journal of
Environmental Economics and Management, 33, 44–58.
Grossman, G. M., & Helpman, E. (1994). Protection for sale. The American Economic Review, 84, 833–850.
Hillman, A. L. (1989). The political economy of protection. Switzerland: Harwood.
Johnson, D. G. (1991). World agriculture in disarray (2nd ed.). Macmillan.
Just, R. E., & Zilberman, D. (1979). Asymmetry of taxes and subsidies in regulating stochastic mishaps.
Quarterly Journal of economics, 93, 139–148.
Kamien, M. I., Schwartz, N. L., & Dolbear, F. T. (1966). Asymmetry between bribes and charges. Water
Resources Research, 2, 147–157.
Kohn, R. E. (1985). A general equilibrium analysis of the optimal number of firms in a polluting industry.
Canadian Journal of Economics, 18, 347–354.
Nash, J. (1950). The bargaining problem. Econometrica, 18, 155–162.
Peltzman, S. (1976). Toward a more general theory of regulation. Journal of Law and Economics, 19, 211–240.
Polinsky, M. A. (1979). Note on the symmetry of taxes and subsidies in pollution control. Canadian Journal of
Economics, 12, 75–83.
Zusman, P. (1976). The incorporation and measurement of social power in economic models. International
Economic Review, 17, 477–562.
492 I. Finkelshtain, Y. Kislev / Journal of Asian Economics 15 (2004) 481–492

0
A Two-Pronged Control of Natural Resources:
Prices and Quantities with Lobbying
by
Iddo Kan Department of Agricultural Economics and Management, The Hebrew University of Jerusalem; Israel; [email protected] (corresponding author);
Israel Finkelshtain Department of Agricultural Economics and Management, The Hebrew University of Jerusalem, [email protected];
Yoav Kislev Department of Agricultural Economics and Management, The Hebrew University of Jerusalem, [email protected].
September 2011

1
A Two-Pronged Control of Natural Resources:
Prices and Quantities with Lobbying
ABSTRACT
This study offers a political-economic model of an
industry regulated by an integrated system of both
direct and market-based policies. The model is
incorporated into a normative theoretical analysis and
serves as a basis for structural econometric
estimations. Exploiting disaggregated data on
agriculture and irrigation in Israel in the mid-1980s,
when water was regulated by both quotas and prices,
the model’s political and technological parameters are
structurally estimated and used to assess the relative
efficiencies of quotas, prices, and an integrated
regulation regime.
I. Introduction
Recent decades have seen population and income growth and alongside them, over-
utilization of natural resources and aggravated environmental problems in many parts
of the world. These developments — often augmented by awareness of the need to
cover costs — are increasingly leading policymakers to reinforce the traditional
arsenal of quantity instruments with market-based policies such as user and polluter
charges (OECD 2010). As a result, the prevailing regulations in many countries are
mixtures of direct and market-based instruments. Examples include the 1990 Clean
Air Act in the U.S. that involves polluting standards and charges (EPA 2001) and the
regulation of environmental externalities in many countries by means of both quotas
and user taxes (EPA 2004). An additional important case is irrigation water—70% of
freshwater used around the world—that in many locales is managed by a combination
of charges and quotas; examples can be found in Australia, California, China, Iran,
Israel, Peru, and Spain (Molle 2009).
2
Government intervention, whatever its nature, most often encounters political
lobbying and pressure and, beginning with the seminal work of Buchanan and Tullock
(1975) on taxes and quotas, there has been a long succession of studies of
environmental and resource regulation under political lobbying. More recently,
Fredriksson (1997) compared taxes with subsidies in pollution control; Finkelshtain
and Kislev (1997) examined the relative robustness to political influence of quantity
versus price regulations; Finkelshtain and Kislev (2004) analyzed alternative subsidy
and tax regimes facing politically powerful interest groups; Yu (2005) studied
environmental protection and direct and indirect political influence; and Roelfsema
(2007) investigated strategic delegation of environmental policymaking. However, to
the best of our knowledge, political equilibrium under a mixed policy regime of direct
and indirect controls is an as-yet unexplored topic. This is the subject of the present
study, wherein we offer a political-economic model of an industry regulated by an
integrated system of both direct and market-based policies.
Political influence has also been studied empirically. A noticeable earlier effort
was the pioneering work of Zusman and Amiad (1977) who analyzed agricultural
support policies. More recent estimates of structural political parameters have been
based on application of the Protection for Sale theory of Grossman and Helpman
(1994) to trade policies. A common feature of the estimations in the trade context was
that policymakers were found valuing social welfare highly relative to political
contributions. This finding is puzzling, particularly in light of reports on extensive
investments in lobbying. Many extensions of the model were suggested in attempts to
reconcile the apparent contradiction of broad support for lobbying and political
contributions on the one hand, and irresponsive governments on the other. However,
as Gawande and Magee (2010) demonstrated, despite these efforts, the puzzle has not
been solved.
In their own attempt to solve the puzzle, Gawande and Magee distinguish between
cooperative lobbying, wherein all firms take part in the political activity; and non-
cooperative lobbying, wherein some firms lobby and contribute politically while
others are free-riders. Inter-industrial differences in protection may be explained by
variations in the level of free-riding. In this paper, we study water regulation in Israel
and show that free-riding in lobbying may play an important role in explaining the
differences in effectiveness of firms’ specific controls (quotas) in contrast to uniform

3
regulation (economy-wide tax or price). Accounting for these differences, we found
that policymakers in Israel valued highly the interests of the agricultural lobby.
When an industry is regulated by a system of two integrated controls, the
intensities of lobbying associated with any of the economic instruments are mutually
interdependent. For instance, lobbying for higher quotas will not be observed where
both taxes and quotas are comparatively high and the quotas are not effectively
constraining. In another situation, with a combination of a low tax and small quotas,
the tax will be irrelevant. Borrowing from the terminology of information economics,
we term these specific cases, respectively, pooling price and pooling quota
equilibrium. When both controls are effective, a separating equilibrium emerges
wherein the population is divided into two interest groups, each bounded by a
different instrument and acting accordingly in the political arena. In the proposed
terminology, the situation in Israeli agriculture forms a separating equilibrium.
The political process we are studying is embedded in a predetermined
“constitution,” wherein the control regime may be quotas, a price, or an integrated
regime. By its choice of the control regime, and the initial quotas, the government
determines which type of equilibrium will emerge in the economy. Thus, an
interesting policy question is: Which of the above equilibria is more efficient? This
question is examined empirically in the paper via simulations of the various
equilibria, based on estimated technological and political parameters. An important
finding of the paper, at least for the conditions prevailing in Israel, is that pooling
price equilibrium, inducing more free-riding than the alternative regimes, is welfare
dominating.
The next section of the paper presents a political-economic model of a mixed
regime in a sector with heterogeneous producers. We then develop the necessary
conditions for the existence of the three cases: pooling price, pooling quota, and
separating equilibrium. These conditions are employed in Section III to construct a
structural empirical model used to estimate the technological and political parameters
of the model. Section IV presents simulations of alternative equilibria, and Section V
is a concluding comment.

4
II. Theory
Consider an agricultural sector in a small, open economy. Water suppliers allocate
water to farmers using both prices and quotas as dictated by a government regulator.
The quotas are individual and non-transferable.1 Technologies and markets are ever
changing; the regulation instruments are therefore examined periodically and
modified as needed. This modification and the resetting of prices and the quotas is the
subject of the political process modeled below.
Farming conditions are heterogeneous and farmers vary in their abilities. Let γ,
with the distribution function ( )z γ , represent the farming unit’s technological level,
and for convenience, treat this variable as continuous. The profit per farm is given by
( ),w pwπ γ − , where w is the farm’s water use and p is an administratively
determined agricultural water price. The function ( ),wπ γ subsumes the prices of all
variable outputs and inputs, excluding p, and is assumed continuous, increasing, twice
differentiable, and strictly concave in w. The derivative of ( ),wπ γ with respect to
water consumption, ( ),w wπ γ , is the water’s value of marginal product (VMP), which
we assume is increasing in γ. The inverse of this function, ( ) ( )1, ,wD p pγ π γ−= , is the
farm‘s water demand. The slope of the demand function is 1/p wwD π= . In the section
on comparative statics, it will be assumed that 0pD γ = .
The allocation of water quotas, q, to the farms (all of them) is represented by the
distribution function ( )qk . The farm’s water consumption is then given by
( ) ( )( ), min , ,w p D p qγ γ= . The price p and the distribution of quotas ( )k q are the
instruments used by the government to control water consumption in agriculture.
These controls are set through a political process wherein politicians may bend
policies in favor of interest groups who, in return, provide political rewards. We omit
the explicit formulation of the political game and instead rely on Peltzman (1976),
Zusman (1976), Hillman (1982), Grossman and Helpman (1994), Damania,
Fredriksson, and List (2003), and others who have shown that policies constituting
1 The quotas are here a regulation instrument; there are no private property rights in
the utilization of water.

5
equilibrium in a political system with rewards can be viewed as maximizing the
following governmental objective function.
( )( ) ( )( ), ,G S p k q U p k qβ= + (1)
In (1), ( )( ),S p k q and ( )( ),U p k q are social welfare and the organized interest
groups’ profits respectively, and , 0β β≤ is the extra weight attached by the
politicians to the welfare of politically organized groups [in the political models,
suggested by Zusman (1976) and Grossman and Helpman (1994), β is the weight
attached to political rewards]. In our context, β may also reflect weight attached by
decision-makers to social objectives such as food security, viability of family farms,
and the development of rural areas.
Consistently with the practice in Israel, we visualize prices as modified and set
before the rainy season, while the quotas are announced only after the winter rains
have been observed. We are therefore considering a two-stage political game, wherein
quotas are set subsequent to price determination. Political activities differ as per the
stage of the game. Lowering the price is in the entire farming sector’s interest, and
hence is in the nature of a public good. Partial participation in the political struggle for
price cuts can therefore be expected. In contrast, since quotas are farm-specific assets,
free-riding in lobbying for higher quotas is less probable; however, only farmers
whose quotas are binding can be expected to negotiate quota raises. The separation
into the two interest groups — the entire sector, and the operators constrained by the
quotas — yields the political separating equilibrium.
Given the price of water, whether a farm is constrained by the quota depends both
on its technological level and the size of its specific water allotment. We wish to order
the farms and consequently divide them into two groups so that water use in one
group is dictated by the price, while those in the second group utilize their allotments
fully. Formally, let 0q denote the farm’s historical, pre-modification quota (the unit
index is omitted) and ( )0 0k q , the associated continuous distribution function with the
support ,l hq q⎡ ⎤⎣ ⎦ . Define ( )0,w qν π γ≡ , ,l hν ν ν⎡ ⎤∈ ⎣ ⎦ , as the VMP of water measured
at the historical quota. The joint distribution of ( )z γ and ( )0 0k q induces the

6
continuous distribution function ( )f ν on the support ,l hν ν⎡ ⎤⎣ ⎦ . Given p and ( )f ν ,
the water consumption of the farms with pl ≤≤νν is dictated by the price, while
those with hp νν ≤< consume water quantities equal to their quotas. In other words,
for the historical regulation parameters,
( )( ) ( )
( ) (
1, , , ,,
, ,
lw
h
D p p pw p
q p
ν π ν ν νν
ν ν ν
−⎧ ⎡ ⎤= ∈ ⎣ ⎦⎪= ⎨⎤∈⎪ ⎦⎩
where ( )νq is the quota associated with ν . The controls are examined and modified
annually. Our interest is in the emerging political equilibrium price *p and quota
allocation rule ( )ν*q . The economic value of a quota is a decreasing function of the
price paid for water; hence, the higher the price, the less intense the political struggle
for quotas (this assertion is proven formally in subsection II.C). The politicians may
take this effect into account when setting the price in the first stage of the political
game (this conjecture is tested in the empirical sections). Accordingly, the game is
solved recursively, starting with the second stage.
A. The Second Stage: Allocating Quotas
Using the above notations and definitions, total water consumption in the economy is
given by:
( )( ) ( ) ( ) ( ) ( ) ( ) ( ), , ,h h
l l
p
p
W p f w p f d D p f d q f dν ν
ν ν
ν ν ν ν ν ν ν ν ν ν= = +∫ ∫ ∫ (2)
Given *p and ( )f ν , quotas are reallocated to farmers whose quotas are binding, i.e.,
having ( *, hpν ν ⎤∈ ⎦ . Denoting by c the constant per-unit water supply cost, and
recalling (1), the equilibrium quota allocation is solved as an optimal control problem
with the objective
( )( )( ) ( )( )( ) ( ) ( ) ( )
( ) ( )*
*max , 1 , ( )
. .
hv
qp
G q q p q f v d cW p f
s t W q f
νν π ν ν β β ν ν ν
ν ν
⎡ ⎤= + − −⎣ ⎦
=
∫ (3)

7
The solution of (3) yields the equilibrium rule with respect to ( )νq :
( )( ) ( *
**
,,
1 hh
w wp
c p qν ν
β π ν ν πβ ⎤∈ ⎦
+= ≡
+ (4)
Or, writing explicitly, the inversion of (4) yields
( ) ( ( )** 1 *
,, , , ,h wp
q p p cν ν
ν π β ν−⎤∈ ⎦
= (4’)
Eq. (4’) will be used in the empirical analysis below. As 0hwπ > in Eq. (4) is a
constant with respect to ν, the political process yields efficient intra-group water use
equating the VMPs of all farms with ( *, hpν ν ⎤∈ ⎦ . However, it will be shown below
that as long as 0>β , *hwc pπ> > ; this inequality implies a welfare loss. Finally,
we note that in the special case of * 0p = , Eq. (4) becomes
( )( )* , ,1
l hw
c qπ ν ν ν ν νβ
⎡ ⎤= ∀ ∈ ⎣ ⎦+, (4’’)
characterizing a pooling quota equilibrium.
Note that the lower bound of the integral in (3) is the equilibrium price reached in
the first stage of the political game. Farmers with ( )( )0 *,w q pπ ν ν > are bound by
their historical quotas (they belong to the group ( *, hpν ν ⎤∈ ⎦ ) and they all participate
in lobbying activity in the second stage. Since, as shown above, *hw pπ > , they will all
belong to the same group in the equilibrium reached after the second stage.
B. The First Stage: Setting the Price
Again rewriting (1), the equilibrium price p* is the solution to the following problem:
( ) ( )( ) ( ) ( )( )
( )( ) ( ) ( )
max , , ,
+ , , ,
h
l
h
l
pG p w p f d cW p f
w p pw p f d
ν
ν
ν
ν
π ν ν ν ν ν
βθ π ν ν ν ν ν
= −
⎡ ⎤−⎣ ⎦
∫
∫ (5)
In (5), 0 1θ≤ ≤ represents the portion of the farming population supporting the lobby
in its struggle for price reduction. The necessary condition for the maximum in (5) is:
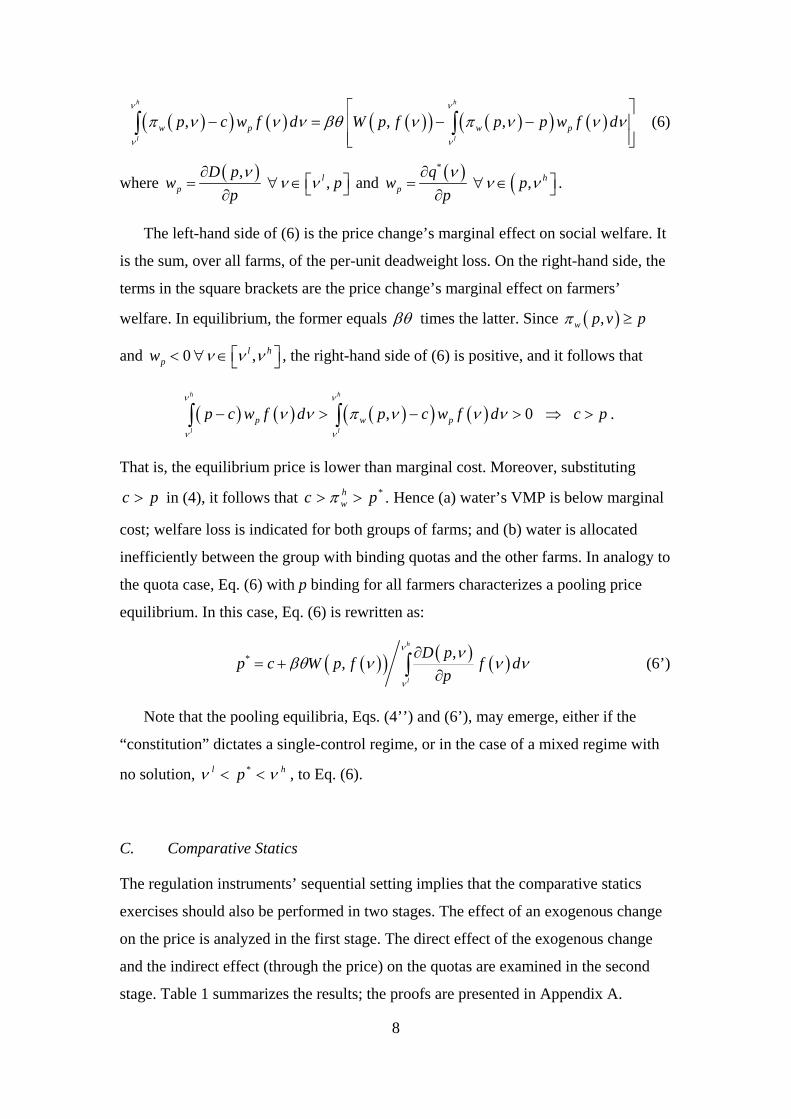
8
( )( ) ( ) ( )( ) ( )( ) ( ), , ,h h
l lw p w pp c w f d W p f p p w f d
ν ν
ν ν
π ν ν ν βθ ν π ν ν ν⎡ ⎤
− = − −⎢ ⎥⎢ ⎥⎣ ⎦
∫ ∫ (6)
where ( ), ,l
p
D pw p
pν
ν ν∂
⎡ ⎤= ∀ ∈ ⎣ ⎦∂ and ( ) (
*
, hp
qw p
pν
ν ν∂
⎤= ∀ ∈ ⎦∂.
The left-hand side of (6) is the price change’s marginal effect on social welfare. It
is the sum, over all farms, of the per-unit deadweight loss. On the right-hand side, the
terms in the square brackets are the price change’s marginal effect on farmers’
welfare. In equilibrium, the former equals βθ times the latter. Since ( ),w p v pπ ≥
and 0 ,l hpw ν ν ν⎡ ⎤< ∀ ∈ ⎣ ⎦ , the right-hand side of (6) is positive, and it follows that
( ) ( ) ( )( ) ( ), 0 h h
l lp w pp c w f d p c w f d c p
ν ν
ν ν
ν ν π ν ν ν− > − > ⇒ >∫ ∫ .
That is, the equilibrium price is lower than marginal cost. Moreover, substituting
c p> in (4), it follows that *hwc pπ> > . Hence (a) water’s VMP is below marginal
cost; welfare loss is indicated for both groups of farms; and (b) water is allocated
inefficiently between the group with binding quotas and the other farms. In analogy to
the quota case, Eq. (6) with p binding for all farmers characterizes a pooling price
equilibrium. In this case, Eq. (6) is rewritten as:
( )( ) ( ) ( )* ,,
h
l
D pp c W p f f d
p
ν
ν
νβθ ν ν ν
∂= +
∂∫ (6’)
Note that the pooling equilibria, Eqs. (4’’) and (6’), may emerge, either if the
“constitution” dictates a single-control regime, or in the case of a mixed regime with
no solution, *l hpν ν< < , to Eq. (6).
C. Comparative Statics
The regulation instruments’ sequential setting implies that the comparative statics
exercises should also be performed in two stages. The effect of an exogenous change
on the price is analyzed in the first stage. The direct effect of the exogenous change
and the indirect effect (through the price) on the quotas are examined in the second
stage. Table 1 summarizes the results; the proofs are presented in Appendix A.

9
The effects on the price of marginal shifts in political parameters β and θ and of
the supply cost c can be recognized intuitively; i.e., the larger the power or
representation of the farming sector in the political arena, the lower the price, whereas
higher supply costs increase the price. The impacts on the quotas are also expected;
i.e., allotments increase with β and θ and shrink with c. Note that θ, the parameter
measuring participation in the political struggle, has no direct effect on the quotas; its
indirect impact is lowering the price and thereby increasing the quotas.
Technological improvements and alternative schemes of quotas’ historical
allocations are modeled as variations in the distribution functions ( )z γ and ( )0 0k q ,
both of which affect the ( )f ν distribution. In particular, technological improvement
or a rise in the agricultural terms of trade are modeled as a first-order stochastic
dominant (FSD) shift of ( )0| qz γ , the conditional distribution of γ, given q0. Recalling
our assumption that the demand function’s slope is invariant to changes in γ, such a
change leads to a price reduction and indirectly increases the quotas and total water
usage and hence enlarges the deadweight losses (the last effect is not reported
explicitly in the table). Intuitively, for a given p, technological improvement (or an
improvement in terms of trade) increases the number of farmers with binding quotas
(Nh) and shifts the entire farmers' population towards larger water consumption.
These effects lead to an increase in the farmers' marginal gain from a price decrease,
the right-hand side of Eq. (6), and hence augments the pressure on the price.
Moreover, the increase in Nh reduces the social gain from price increase. This follows
from two reasons. First, for the farmers with binding quotas, water consumption is
less responsive to a price hike. Secondly, the per cubic meter dead weight losses of
the "high" v group is smaller than that of "low" v group farmers. This means that
technological improvement makes it "cheaper" for the politicians to discount the
water price. Therefore, the equilibrium is restored at a lower price, higher quotas, and
higher level of the marginal deadweight loss; i.e., the left-hand side of Eq. (6).
Ceteris paribus, an economy with higher initial quotas will have a higher
equilibrium price, and paradoxically, smaller quotas and less water use. The
explanation is that when historical quotas are comparatively high, more farmers who
would otherwise be in the “high” v group find themselves in the “low” range. This
means an increase in the share of the water controlled by the price and more farmers

10
with larger per-unit dead weight loss, which increases government resistance to
pressure on the price. While the change has no direct effect on the equilibrium quotas,
the indirect effect through the price reduces quotas’ allocation, aggregate water use
and the deadweight losses.
In Section IV, the above comparative statics effects are quantified for the Israeli
case in simulations based on the estimated parameters. In addition, the comparative
statics results suggest several testable implications of the model, such as an increase
in the administrative water price in periods of declining terms of trade. Below, we
indicate that the Israeli data are consistent with this prediction of the model.
III. Empirical Analysis
All water sources in Israel are publicly owned, and their use is regulated by the state.
In the period covered by our analysis, the regulator was the Water Commissioner, but
other government agencies and politicians were deeply involved in the decisions on
prices and quantity allocation (Zusman 1997; Mizrahi 2004; Kislev 2006; and
Margoninsky 2006). Our data set covers prices and quotas for cooperative and
communal villages (moshavim and kibbutzim respectively) that received their water
from the national company, Mekorot, the provider of most of the water in the country.
The village, not the individual farmer, is the consuming unit in the sample, receiving
water up to its specific quota and paying for the quantity used.
The data in the study cover the period 1985-88, when prices were linear and
region-specific (today farmers pay increasing block rate prices, and the same tariff
structure applies nationwide). The prices’ variation across regions and over time
allows econometric estimates. Strictly speaking, this means that lobbying is conducted
in each region separately; however, since regional prices were correlated, political
activity at the nationwide level was also observed. During the study period, the
agricultural sector utilized less water than allowed by the aggregate quota; while some
farmers were constrained by their quantitative allocations, others did not fully use the
water they were allotted (a separating equilibrium, in the proposed terminology). The
empirical analysis is conducted at two levels: The parameters of demand function and
the quota allocation rules, including the magnitude β , are estimated at the village

11
level, while price setting is estimated at the regional level. Obtaining the size of the
parameter θ is based on these estimations’ output.
A. The Demand Function and the Quota-Allocation Rule
The challenge of the econometric analysis is to “explain” two observed magnitudes:
per-village water use, and its quota. Recall that (a) water use is determined either by
price or by quota; and (b) quotas are endogenously set in the political process.
Consequently, our task is to estimate two structural equations: water demand, and the
quota-setting function.
For convenience, write water‘s VMP for village i and year t as the linear function
w it it itwπ ω ψ= + (7)
In (7), itw and itω are respectively, the village-year-specific water consumption and
the function‘s intercept, and ψ is its slope, assumed identical for all i and t. The
derived water demand function is ( ) itititit ppD 1, δ+= μzz , where itp is the price
(villages in the same region may have identical prices), itz is a vector of village-year-
specific variables, μ is the vector of corresponding coefficients, and 11
−≡ψδ . Let itq
be the village annual water quota. By substituting the linear VMP specification into
Eq. (4’), it itw it w q it itqπ ω ψ= = + , and rearranging, we get a linear political equilibrium
quota allocation rule: ( ) itititit ppQ 2, δ+= ξxx , where itx is a vector of village-year-
specific variables, ξ is the associated vector of coefficients, and ( )12 / 1δ ψ β β−≡ + .
The political parameter β is identifiable through ( ) 2 1/ 1β β δ δ+ = .
Following Burtless and Hausman (1978) and Mofitt (1986), we add to the
structural equations three random components. The first is heterogeneity across
villages and along time, not explained by itp and itz ; it is represented by the random
variable itα , which stands for managerial skills and other factors not observed by the
modeler, yet known to the farmers and therefore affecting their individual demand for
water. Two additional sources of randomness are those associated with measurement
errors and optimization mistakes that may emerge in both the farmer’s decision on
water usage and the allocation of quotas by the government, which are represented

12
respectively by the terms itε and itu . A linear additive formulation is adopted, with
two interrelated equations of water demand and quota allocation:
( ) ( )
( )⎩⎨⎧
>++≤+++
= z
z z
itititititit
ititititititititit qpDq
qpDpDw
αεαεα
,if ,if ,
(8)
( )
( ) ( )1 1
1
if ,
, if ,
z
x z it it it it it it
itit it it it it it it
q u D p qq
Q p u D p q
α
α− −
−
⎧ + + ≤⎪= ⎨+ + >⎪⎩
(9)
By Eq. (8), wherever the quantity demanded at the given price is less than the
quota, consumption equals the demand function ( ) itititpD α+z, plus a stochastic
error term. If water demand exceeds the quota, then the observed water consumption
equals the quota itq plus the stochastic error term. The quota’s endogenous setting is
formulated in Eq. (9): If the historical quota 1itq − exceeds demand, and is therefore
unbinding, then, 1−= itit qq plus an error term. An effective historical quota, on the
other hand, would lead to bargaining and to a political equilibrium characterized by
the equilibrium quota allocation rule ( )ititpQ x, .
Our estimation strategy is based on maximization of the sample likelihood. Let
( )θxz ,,,,,Pr 1 ititititititit qpqw − be the probability of observing a pair of water
consumption itw and quota itq , where θ is the set of parameters of the functions
( )ititpD z, and ( )ititpQ x, and the joint density distribution functions of α, ε, and u.
This probability encompasses all the combinations associated with the options in (8)
and (9), as elaborated below.
( )( ) ( ) ( )( ) ( ) ( )
( )
1
1 1
1
Pr , , , , ,
Pr , , min , , ,
Pr , , , , ,
Pr , ,
z x θ
z z
z z x
z
it it it it it it it
it it it it it it it it it it it it it
it it it it it it it it it it it it it it
it it it it it it it i
w q p q
w D p q q D p u q q
w D p q D p q u q Q p
w q q D p q
α ε α
α ε α
ε α
−
− −
−
=
+ = − ≤ − = −⎡ ⎤⎣ ⎦+ + = − < + ≤ = −⎡ ⎤⎣ ⎦+ = − < + ≤
( ) ( ) ( )1 1
1
,
Pr , max , , , ,z xt it it it
it it it it it it it it it it it it
u q q
w q q q D p u q Q pε α− −
−
= −⎡ ⎤⎣ ⎦+ = − > − = −⎡ ⎤⎣ ⎦
(10)
The sample likelihood function is
( )∏ ∏ −=i t ititititititit qpqwL θxz ,,,,,Pr 1 (11)
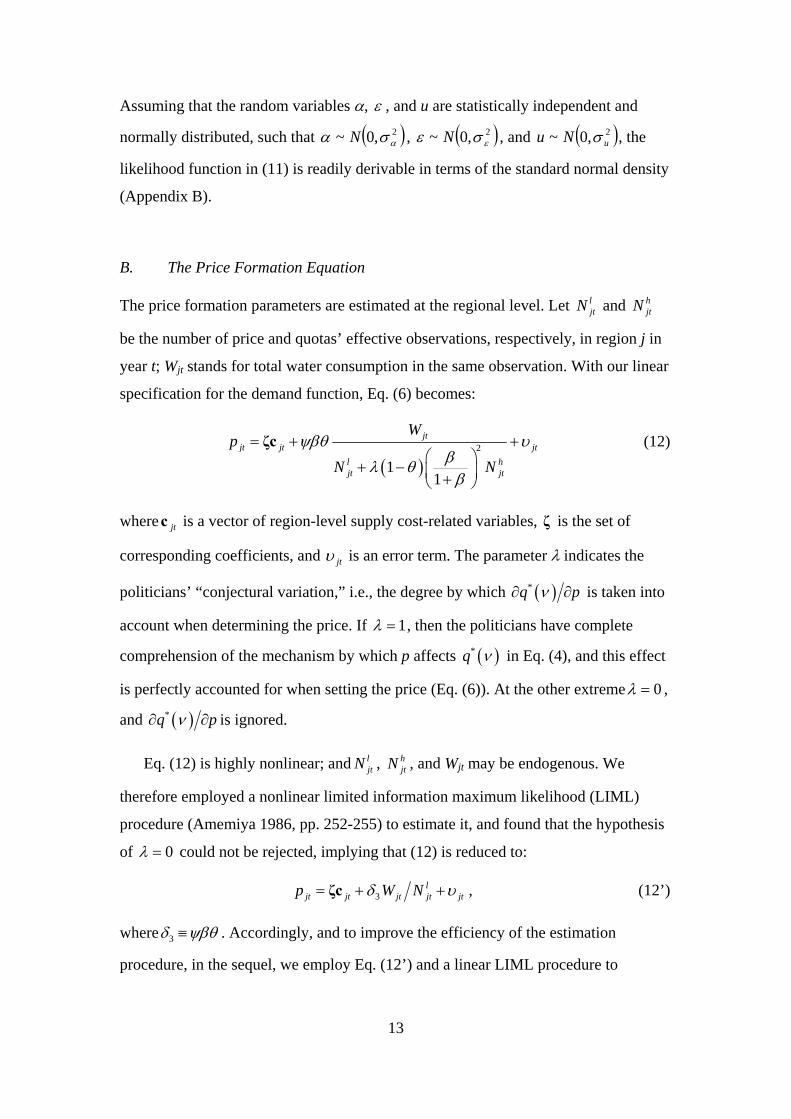
13
Assuming that the random variables α, ε , and u are statistically independent and
normally distributed, such that ( )2,0~ ασα N , ( )2,0~ εσε N , and ( )2,0~ uNu σ , the
likelihood function in (11) is readily derivable in terms of the standard normal density
(Appendix B).
B. The Price Formation Equation
The price formation parameters are estimated at the regional level. Let ljtN and h
jtN
be the number of price and quotas’ effective observations, respectively, in region j in
year t; Wjt stands for total water consumption in the same observation. With our linear
specification for the demand function, Eq. (6) becomes:
( )2
11
ζc jtjt jt jt
l hjt jt
Wp
N Nψβθ υ
βλ θβ
= + +⎛ ⎞
+ − ⎜ ⎟+⎝ ⎠
(12)
where jtc is a vector of region-level supply cost-related variables, ζ is the set of
corresponding coefficients, and jtυ is an error term. The parameter λ indicates the
politicians’ “conjectural variation,” i.e., the degree by which ( )*q pν∂ ∂ is taken into
account when determining the price. If 1λ = , then the politicians have complete
comprehension of the mechanism by which p affects ( )*q ν in Eq. (4), and this effect
is perfectly accounted for when setting the price (Eq. (6)). At the other extreme 0λ = ,
and ( )*q pν∂ ∂ is ignored.
Eq. (12) is highly nonlinear; and ljtN , h
jtN , and Wjt may be endogenous. We
therefore employed a nonlinear limited information maximum likelihood (LIML)
procedure (Amemiya 1986, pp. 252-255) to estimate it, and found that the hypothesis
of 0λ = could not be rejected, implying that (12) is reduced to:
3 ,ζc ljt jt jt jt jtp W Nδ υ= + + (12’)
where 3δ ψβθ≡ . Accordingly, and to improve the efficiency of the estimation
procedure, in the sequel, we employ Eq. (12’) and a linear LIML procedure to

14
estimate the model parameters. In particular, we note that using Eqs. (7) and (12’), θ
is identifiable through ( )3 1 1 2 2θ δ δ δ δ δ= − .
C. Data and Variables
The estimation is based on a panel of 1,051 observations of freshwater use in
agriculture. The information covered prices and quotas for the years 1985-88,
encompassing 303 villages located in 23 water-price regions. The observations in the
panel were selected according to three criteria: (a) the villages included used only
fresh water; they did not apply brackish or recycled water; (b) the included villages
received their water from Mekorot only, whose prices were, and still are, set by the
government; (c) villages with cultivated areas of less than 50ha or water quotas of less
then 200,000 m3 / year were excluded from the sample. In the period of the study,
water use in the sample villages accounted for 20% of agricultural freshwater
consumption in the country.
Table 2 provides descriptive statistics of the variables in the dataset and their
sources. Water use, quota, price, and cost were explicitly incorporated into the
theoretical formulation presented above. The other variables in the table are the
components of the vectors itz and itx in Eqs. (8) and (9). Note that on average, water
consumption was lower than village quota. In fact, the consumption of water was less
than the quota in 56% of the observations (not in the table). As suggested earlier, this
is an indication of a separating equilibrium.
Delivery costs, in 1987 US dollars, were available by Enterprise, a part of
Mekorot's network covering a delivery area, mostly to points of similar altitudes
(Shaham 2007) and assigned to villages as per their water utilization. As indicated,
prices in the study period (1985-88) were region specific. For the region-level
analysis, village costs were aggregated to 23 regional averages.
Capital and operating outlays form the fixed part of water supply’s cost; unlike
energy, they do not vary with the quantity delivered. Capital costs were often
neglected when prices were determined because a large portion of Mekorot's
investment was covered by public budgets. Moreover, in 17 of the 23 regions, average
price was lower even than energy cost, and in all regions it was lower than total cost.

15
Farmers did not face the full cost of the input they used; apparently they succeeded in
lobbying for lower prices.
The last two variables in Table 2 are at the nationwide, not village, level.
Enrichment is the annual recharge of rainwater added to the reservoirs — the aquifers
and the Sea of Galilee — and terms of trade is an index of the ratio of the price of
agricultural products (field crops and orchards) to the price of farm inputs.
D. Estimation Results
We begin with the estimation of Eqs. (8) and (9). The goodness of fit is evaluated by
comparing the predicted to the actual distribution of the variables, in our case water
use and quotas. The scatter diagrams in Figure 1 present the predicted (expected)
values versus the observed magnitudes for both consumption and quotas.2 The
correlation between the predicted and observed series is 0.91 for quotas and 0.63 for
water consumption, both indicating reasonable fit. We also compare the distributions
of the actual and the predicted quantities. While the distribution of predicted
consumption is less dispersed than the one corresponding to the actual quantities, all
other moments are quite similar. In particular, note that the average water use and
quota predicted by the model are 958 and 1,028 (1,000 m3), compared with the actual
average use and quota of 940 and 1,033 respectively.
The estimation results are summarized in Tables 3a for Eqs. (8) and (9) at the
village level, and 3b for the setting of prices. In Eq. (8), based on the estimated values
of σα and σε of the error terms in the demand function, 61% [383/(383+241)] of the
unexplained variation in water consumption is associated with the heterogeneity
among villages. As expected, the price coefficient (δ1) is negative and significant; the
elasticity of demand will be discussed below.
Only a few of the village-specific variables seem to significantly affect annual
water demand, among them elevation, indicating cooler, hilly areas; and cultivatable
land in the village, particularly areas of orchards. Water consumption is relatively
2 The expected values were calculated in the simulations presented in Section IV
below.

16
higher in the drier south; cooperative villages use less water than communal entities;
and improved terms of trade encourage intensification of water utilization.
The estimated parameters of the quota allocation function, presented in the second
column of Table 3a, are consistent with the theory. The price coefficient (δ2) is
negative; i.e., higher prices reduce the intensity of the political activity. The two
components of the delivery cost operate in opposite directions: On the one hand,
higher energy cost, which indicates an increased marginal cost, increases the
equilibrium VMP in Eq. (4), and hence adversely affects the allotted quotas in the
political equilibrium. On the other hand, capital and operational costs serve as
indicators of installed capacity and lower marginal cost, and therefore, villages
connected to capital-intensive enterprises enjoy comparatively higher quotas.
As indicated, the political determination of the quotas is a reallocation process,
modifying historical distribution; hence the significant effect of 1tq − , which is
introduced in the empirical estimation to control for quota-adjustment constraints and
farm characteristics. The interpretation of most other parameters in the quota equation
is straightforward; we comment only on April rainfall and annual recharge. While
spring rainfall’s effect on demand is not significant, a good rain may reduce farmers’
pressure for higher quotas, hence the negative sign in the second column.
As for natural enrichment, reservoirs enable smoothing of supply by carrying
water from rainy to drier years. In light of this possibility, the withdrawal policy often
recommended is to limit extraction to “safe yield,” a stable quantity that may
constitute an essentially constant yearly supply. The disadvantage of this policy is that
it allows some water to drain into the ocean (or in our case the Dead Sea). A positive
effect of annual recharge on quota allocation, as shown in Table 3a, is an indication of
political pressure to “make use of every drop of water” and extract yearly the entire
recharged quantity. Such a policy increases the risk of shortages and severe crises in
drought years, and may even damage the reservoirs. As Zusman and Amiad (1977)
showed, the agricultural lobby in Israel and the politicians it influenced tended to be
shortsighted.
The ratio ( )1β β+ is estimated at 0.48, where the equality to both zero and one
is rejected in the 5% confidence level. Again, Zusman and Amiad (1977) reported
17
( )1β β+ values of similar magnitudes, considerably higher than those obtained in
studies of the influence of lobbying on trade policies (Gawande and Magee 2010).
The price formation equation, estimated at the regional level, is reported in Table
3b. There are 72 region-year observations and they were weighted by the number of
villages in the region (weighting did not affect the estimates markedly). Based on the
estimates, higher capital and operating costs increase equilibrium prices, whereas
energy costs do not exhibit a significant impact. The 3δ (=ψβθ ) coefficient is
negative and statistically significant, thereby rejecting the hypothesis of no political
pressure.
The point estimation for the lobbying participation rate, θ, is 0.23, indicating
considerable free-riding. Moreover, the latter conclusion is strengthened by noting
that θ is significantly less than 1 (no free-riding). Finally, we could not rule out the
possibility that 0θ = , indicating zero organization for price lobbying.
IV. Simulations
The parameters estimated in the previous section are employed here for simulations.
The simulations are of expected village water use and quotas conditional on prices,
village characteristics, and the estimated political and technological parameters.
Expected values were calculated by numerical integration of the estimated bivariate
likelihood function:
( ) ( )1ˆPr , , , , ,z x θit it it it itE w w w q p q dwdq−= ∫∫ (13)
( ) ( )1ˆPr , , , , ,z x θit it it it itE q q w q p q dwdq−= ∫∫ (14)
The range for the numerical integration was the observed quantities ± 10 millions m3,
with 100 partitions. We begin with the demand elasticity.

18
A. Price Elasticity
Prices are endogenous in our model. Still, the question may be asked, how does water
consumption change with its price? Three concepts of elasticity emerge. The first is
the calculated individual village demand elasticity, computed utilizing the regression
coefficient at the sample mean (Tables 2, 3a); this elasticity value is -0.87 (-
7,619*0.11 / 958). The second concept is the “constrained market elasticity,”
corresponding to a market experiment wherein villages constrained by their quota do
not respond to a change in the prices, and the quotas are assumed irresponsive to price
changes. The calculation is conducted by a simulation of Eq. (13) for prices 5% above
and below the observed sample levels, holding the sample quotas constant. The value
of the elasticity thus computed is -0.19, or slightly higher than the short-run elasticity
value of -0.13 estimated by Bar-Shira et al. (2006).
To obtain the third elasticity concept, recall that the quotas may change when
prices change. Simulation of Eq. (14) with 5% price changes yields “elasticity” of
quota with respect to price of -0.27. The third concept is accordingly the
“unconstrained market elasticity,” reached by simulation of Eq. (13) with price
changes of 5%, this time allowing quotas to change. The computed elasticity is now -
0.50.
Quantitative controls for irrigation water are employed in many countries. The
above findings imply that, at least for conditions in Israel, assertive price policy may
greatly enhance the effectiveness of direct control instruments.
B. Exogenous Changes
In this subsection, we investigate the impact of exogenous shocks on the separating
equilibrium, quantifying the comparative statics effects. Table 4 reports the results,
expressed in terms of elasticities. The first two rows show variations associated with
the first stage, i.e., the price formation and the allocation of users between the two
interest groups, indicated by the probability ( )*Pr p≤ν . The price change was
calculated using Eq. (12’), wherein jtW equals the regional sum of village-level
expected value of consumption, ( )itwE , as computed by Eq. (13), and
( )*Pr pNN jtjljt ≤= ν , where jN is the number of villages in region j and ( )*Pr pjt ≤ν

19
is the region’s average probability of ( ) itititit qpD ≤+ αz,* ; the latter was calculated
by a variant of Eq. (10) that includes the terms corresponding to this condition only.
Recalling 0=λ , the price, ( )itwE and ( )*Pr pjt ≤ν were all calculated while holding
the quotas at their observed levels. The equilibrium values’ responses shown in the
last four rows of Table 4 incorporate the second-stage effect; they were computed by
introducing the exogenous change as well as the updated price from the first stage into
Eqs. (13) and (14), while allowing the quotas to change according to the estimated
function ( )ititpQ x,* .
From the theory (subsection II.C), we already know that a rise in the terms of
trade and the technology level would lead to a price reduction, increased quotas, and
deadweight losses. The simulation results (first column of Table 4) demonstrate that
these effects are sizeable. In particular, note that the water price elasticity with respect
to the terms of trade is -2.73. In the five decades 1952-2002, crops’ terms of trade in
Israel declined by more than 50%, while the water price tripled (Kislev and Vaksin
2003). Political scientists (e.g., Menahem 1998) tend to attribute those changes to
erosion in the farmers’ lobbying or a shift in society’s and politicians’ attitudes
toward agriculture. The above political-economic model with steady political
organization (θ) and government attitudes (β), provides an alternative explanation for
the water-price hike; namely, an exogenous decline in the terms of trade.
The effect of a change in the historical quotas, as indicated by the elasticities in
Table 4, is opposite in sign and an order of magnitude smaller than the effect of the
terms of trade.
The equilibrium values’ elasticities in Table 4, with respect both to β and θ , are
less than 1, yet significant and tend to be similar in their magnitudes. While lower
communication costs in the future may lead to increased transparency of
governmental policies and higher politicians’ ethical norms (lower β), they may also
strengthen farmers’ organization and lobbying (larger θ). The simulations results
suggest that such changes may offset each other, thereby perpetuating overutilization
of water resources.
20
C. Political Equilibria
If, as in agriculture in Israel, both prices and quotas are effective, the sector can be
characterized as being, in our terms, in a separating political equilibrium. If prices are
low and the quantity demanded exceeds the quota in every water-consuming unit, a
pooling quota equilibrium emerges; a pooling price equilibrium appears where prices
are set high and the quotas also high enough. In this subsection, we simulate the two
pooling equlibria and compare them to the observed separating equilibrium. Before
proceeding with the simulation, it will be useful to review the implications of the
theory concerning the normative ranking of the three equilibria.
Finkelshtain and Kislev (1997) examined the relative efficiency of pooling price
and pooling quota equilibrium in a regulated sector with homogeneous users. It was
shown that if the demand elasticity is higher than the share of the resource utilized by
the politically organized users, pooling price equilibrium dominates quotas
equilibrium. Considering the estimated parameters in our study (demand elasticity -
0.87, lobbying participation rate 0.23), one would accept the supremacy of the price
regime.
However, this need not always be the case. In principle, where delivery costs vary
between water users, the individually tailored quotas could potentially perform better
than a uniform price regime that does not account for cost differences. In such a case,
a two-pronged instrument may be superior. The conclusion drawn from this
discussion is that normative ranking of the various equilibria is an empirical question.
Turing to the simulations, water consumption and quotas for the pooling quota
equilibrium were simulated for each village separately, by Equations (13) and (14),
setting 0itp = for all i and t. For the pooling price equilibrium, we used Eq. (6’), and
it becomes:
*
1jt jt
it
cp
βθωβθ
−=
− (15)
where jtc and jtω are the regional average costs and the estimated intercept of the
linear VMP function respectively. Village-level water consumption for the pooling-
price equilibrium was simulated by Eq. (13) using the regional prices calculated in
(15). Village magnitudes were then averaged.

21
As indicated earlier, the political equilibrium is not welfare maximizing.
Deadweight losses for the equilibrium values were calculated by
( )21 *2 /it it witW c π ψΔ = − (16)
and averaged over the sample.
The results are reported in Table 5 in terms of expected per-village values,
averaged over the sample. For the circumstances in Israel and for the period of the
study, the pooling price equilibrium was dominant in terms of welfare (recall that
prices were set regionally). The average price under the pooling-price regime is, as
shown in Table 5, twice the observed average, and closer to the marginal cost, thereby
yielding higher welfare. The VMP under the pooling-quotas equilibrium is lower than
the observed value, implying that pooling-quotas equilibrium is inferior to the other
possibilities. Thus, despite the cost and technological heterogeneity that may lead to
superiority of quotas or of an integrated regime, pooling price equilibrium dominates.
The principal factor leading to this result is free-riding in lobbying. The uniform price
regime in each region allows, or even encourages, considerable free-riding in farmers’
organization relative to the individual quota regimes, and therefore yields a welfare-
superior equilibrium. To show this, we simulate the pooling price regime in the
extreme case of perfect lobbying, 1θ = . As can be seen in the last column of Table 5,
the normative ranking is reversed in this case, and both the separating and pooling
quota equlibria are better.3 One can only speculate that a nationwide uniform price
could lead to even less effective lobbying and higher welfare.
V. Concluding Comment
Realizing that political involvement tends to distort resource allocation and reduce
social welfare, several years ago the Knesset (Israeli parliament) established an
independent Water Authority with the power to determine water allotments and
3 We have also tried to simulate a separating equilibrium with 1θ = but could not
find positive prices associated with this equilibrium. The implication is that for the circumstance of the study, if all farmers were to participate in the lobbying activity for lower price, the regulation regime would have become a pooling quota equilibrium with water utilization determined solely by quantitative allocation.

22
prices. The law specifically and explicitly prevented the minister (Cabinet member)
responsible for the water sector from involvement in the areas of responsibility
assigned to the Water Authority.
While the intent was laudable, the legislators could not adhere to the law they
themselves approved and could not resist the temptation to influence prices. During
2009, when the Authority was deliberating a new price structure, its Director-General
was summoned six times to parliamentary committees and was even threatened with
the law being amended unless prices were structured consistently with political
desires, reflecting public outcry and goals of interest groups. Indeed, as of this writing
(July 2011), the Knesset is considering a proposal to reverse the law: ‘‘The power to
regulate prices must be restored to the members of the parliament, the reality being
that the bureaucracy has been raising prices at will …” This time, the prices to be set
are for urban water, however the same attitude can be expected to emerge when
agricultural tariffs and allocations are considered. It appears impossible to “sanitize”
the political process from involvement — even in the details — of administrative
functions.
References
Amemiya, Takeshi. 1986. Advanced Econometrics. Cambridge, MA: Harvard Univ.
Press.
Bar-Shira Ziv, Israel Finkelshtain, and Avi Simhon. 2006. “The Econometrics of
Block Rate Pricing in Agriculture.” Am. J. Agr. Econ. 88 (November): 986-999.
Buchanan, James M. and Gordon Tullock. 1975. “Polluters‘ Profits and Political
Response: Direct Controls Versus Taxes.” Am. Econ. Rev. 65(1): 139-147.
Burtless, Gary and Jerry A. Hausman. 1978. “The Effect of Taxation on Labor
Supply: Evaluating the Gary Negative Income Tax Experiment.” J.P.E. 86
(December): 1103-1130.
Damania, Richard, Per G. Fredriksson, and John A. List. 2003. “Trade Liberalization,
Corruption, and Environmental Policy Formation: Theory and Evidence.” J. Env.
Econ. and Manage. 46 (November): 490-512.

23
EPA. 2001. The United States Experience with Economic Incentives for Protecting
the Environment. EPA-240-R-01-001. Washington, DC: USA.
— 2004. International Experiences with Economic Incentives for Protecting the
Environment. EPA-236-R-04-001. Washington, DC: USA.
Finkelshtain, Israel and Yoav Kislev. 1997. “Prices vs. Quantities: The Political
Perspective.” J.P.E. 105 (February): 83-100.
— 2004. “Taxes and Subsidies in a Polluting and Politically Powerful Industry.” J.
Asian Econ. 15(June): 481-492.
Fredriksson, Per G. 1997. “The Political Economy of Pollution Taxes in a Small Open
Economy.” J. Env. Econ. and Manage. 33(May): 44-58.
Hadar, Josef and Russell William R. 1969 “Rules for Ordering Uncertain Prospects.”
Am. Econ. Rev. 59(Mar): 25-34.
Gawande, Kishore and Christopher Magee, C. 2010. “Free-Riding on Protection for
Sale.” Online, accessed January 15, 2010:
http://www.facStaff.bucknell.edu/cmagee/Free%20Riding%20on%20Protection%
20for%20Sale.pdf.
Grossman, Gene M. and Elhanan Helpman. 1994. “Protection for Sale.” Am. Econ.
Rev. 84 (September): 833-850.
Greene, William H. 2003. Econometric Analysis, 5th ed., Upper Saddle River, NJ:
Pearson Education.
Kislev, Yoav. 2006. “The Water Economy of Israel” in: Water in the Middle East K.
David Hambright, F. Jamil Ragep, and Joseph Ginat (eds.) Norman, OK: U. of
Oklahoma Press.
— and Yevgenia Vaksin. 2003. A Statistical Atlas of Israeli Agriculture [Hebrew].
Research Paper, Rehovot, Israel: Center for Agricultural Economic Research.
Margoninsky, Yossi. 2006. “The Political Economy of Rent Seeking: The Case of
Israel’s Water Sector.” J. Comp. Policy Analysis 8 (January): 259-270.
Menahem, Gila. 1998. “Policy Paradigms, Policy Networks, and Water Policy in
Israel.” J. Pub. Pol. 18(September-December): 283-310.

24
Mizrahi, Shlomo. 2004. “The Political Economy of Water Policy in Israel: Theory
and Practice.” J. Comp. Policy Analysis 6 (September): 275-290.
Moffitt, R. 1986. “The Econometrics of Piecewise-Linear Budget Constraint: A
Survey and Exposition of Maximum Likelihood Method.” J. Business and Econ.
Statistics 4(July): 317-28.
Molle, Francois. 2009. “Water Scarcity, Prices, and Quotas: A Review of Evidence on
Irrigation Volumetric Pricing.” Irrigation and Drainage Systems 23 (February):
43-58.
OECD. 2010, European Environment Agency, OECD/EEA Database on Instruments
Used for Environmental Policy and Natural Resources Management,
http://www2.oecd.org/ecoinst/queries/index.htm.
Ravikovitch, Shlomo. 1992. The Soils of Israel: Formation, Nature, and Properties.
[Hebrew]. Israel: Hakibbutz HaMeuchad Publications.
Roelfsema, Hein. 2007. “Strategic Delegation of Environmental Policymaking.” J.
Env. Econ. and Manage. 53 (March): 270-275.
Rothschild, Michael and Joseph Stiglitz, 1976. “Equilibrium in Competitive Insurance
Markets: An Essay on the Economics of Imperfect Information.” Quart. J. of
Econ. 90(4):629-49.
Shaham, G. 2007. Water Supply Cost by Village [personal communication, Hebrew].
Yu, Zhihao. 2005. “Environmental Protection: A Theory of Direct and Indirect
Competition for Political Influence.” Rev. Econ. Studies 72 (January): 269–286.
Zusman, Pinhas. 1976. “The Incorporation and Measurement of Social Power in
Economic Models.” Inter. Econ. Rev. 17 (June): 447-462.
— 1997. “Informational Imperfections in Water Resource Systems and the Political
Economy of Water Supply and Pricing in Israel” in Decentralization and
Coordination of Water Resource Management, Douglas D. Parker and Yacov Tsur
(eds.) Boston: Kluwer.
— and Amotz Amiad. 1977. “A Quantitative Investigation of a Political Economy:
The Israeli Dairy program.” Am. J. Agr. Econ. 59 (February): 88-98.

25
Appendix A – Comparative Statics
The recursive decision-making process implies that the comparative statics exercises
should be executed in two stages. The effect of an exogenous change on the price is
analyzed in the first stage. In the second stage, the transformation in the quotas due to
the direct effect of the exogenous change and the indirect effect (through the price)
are examined.
A. The Price
Recalling Eq. (6), for any exogenous parameter, a , pp
pa
GG
dadp
−=*
and since 0<ppG ,
it follows that ( ) ( )paGdadp sgnsgn * = . The results regarding β, θ, and c are shown
first:
( )( ) ( )( ) ( ), , 0h
lp w pG W p f p p w f d
ν
βν
θ ν π ν ν ν⎡ ⎤
= − − − <⎢ ⎥⎢ ⎥⎣ ⎦
∫ , (A1)
( )( ) ( )( ) ( ), , 0h
lp w pG W p f p p w f d
ν
θν
β ν π ν ν ν⎡ ⎤
= − − − <⎢ ⎥⎢ ⎥⎣ ⎦
∫ , (A2)
( ) 0h
lpc pG c w f d
ν
ν
ν ν= − >∫ (A3)
We shell now examine the impact of a technological improvement or an increase
in the terms of trade. We model such changes by a shift in the distribution of 0( , )qγ ,
such that the ex-post conditional distribution of γ, conditioned on any q0, FSD the ex-
ante one. For the comparative statics exercises, we examine the effect of small
changes in the distribution. An increase in a parameter, a , represents FSD shift of the
conditional distribution of γ, conditioned on q0, if and only if:
0 0( , | ) 0 ( , ),l
l haZ x a q dx q
γ
γ
γ γ γ≤ ∀ ∈∫

26
Define 0( , )p q pγ by 0( , )pw q pπ γ = . That is, for any price and quota level,
0( , )p q pγ is the level of technology for which the VMP of water equals its price.
Using this notation, water consumption can be rewritten in terms of γ:
00
( , ) [ , ]( , , )
( , ]
l p
p h
D pw q p
qγ γ γ γ
γγ γ γ
⎧ ∈= ⎨
∈⎩
We can now rewrite Eq. (6) in terms of the quota distribution and the conditional
distribution of γ, given q0:
( )( ) ( )
( )( )( ) ( )
0 0 0
0 0 0 0
, , | ( )
( , , ) , , | ( )
h h
l l
h h
l l
q
w pq
q
w pq
p c w Z a q d k q dq
w p q p p w Z a q d k q dq
γ
γ
γ
γ
π γ γ γ
βθ γ π γ γ γ
⎡ ⎤−⎢ ⎥
⎢ ⎥⎣ ⎦⎡ ⎤
= − −⎢ ⎥⎢ ⎥⎣ ⎦
∫ ∫
∫ ∫
Examining the effect on p:
( )( ) ( )
( )( )( ) ( )
0 0 0
0 0 0
, , | ( )
( , ) , , | ( )
h h
l l
h h
l l
q
pa w p aq
q
w p aq
G p c w Z a q d k q dq
w p p p w Z a q d k q dq
γ
γ
γ
γ
π γ γ γ
βθ γ π γ γ γ
⎡ ⎤= −⎢ ⎥
⎢ ⎥⎣ ⎦⎡ ⎤
− − −⎢ ⎥⎢ ⎥⎣ ⎦
∫ ∫
∫ ∫ (A4)
Assuming that 0pw γ = , all three: ( )( ),w pp c wπ γ − , ( )( ),w pp p wπ γ − and ( ),w p γ−
are decreasing functions of γ and hence their expected value is decreasing in a
(Hadar and Russel (1969)). Therefore, 0paG < , proving that the price decreases with
FSD shift in ( )0, |Z a qγ . An increase in the historical quotas is modeled by a shift in
the distribution of 0( , )qγ , such that the ex-post conditional distribution of q0,
conditioned on any γ, FSD the ex-ante one. Following the same line of proof as of the
technological improvement, it can be shown that 0paG > , proving that the price
increases with FSD shift in ( )0, |k q a γ .

27
B. The Quotas Allocation
Recalling Eq. (4), for any exogenous parameter, a , *
qa
Gdqda G
= − and since
( )( )* , 0qq wwG qπ ν ν= < , it follows that ( ) ( )*sgn sgn qadq da G= . Employing Eq.
(4) it can easily verified that 0qG θ = , *
01qc
pG ββ
= − <+
and
2 0(1 )q
p cG β β−
= − >+
. Moreover, the changes in the initial quota distributions and
technological level have no direct effects on the quota allocation rule.
Appendix B - Likelihood Function
Let εαϕ += and let ( )αϕϕα ,g denote the joint density of ϕ and ε , where the
density ϕαg is bivariate normal with parameters 222εαϕ σσσ += , 2
ασ , and
( )( ) ϕ
α
αεα
α
αϕ σσ
σσσ
σσσ
εααρ =+
=+
=222
2,Cov . In the same manner, ugϕα and ugαε are
the joint densities of ϕ , α, and u; and α, ε, and u respectively. The distribution of α
conditional on ϕ implies ( ) ( ) ( )ϕϕααϕ ϕϕαϕα ggg =, , and due to the independence of
α, ε, and u there are uu gggg ϕϕαϕα = and uu gggg εααε = . Omitting nonessential
indices and functions’ operators, the probability of observing a certain pair of w and qt
can be expressed in terms of g:
( )
( ) ( ) ( )( )
( ) ( ) ( )
( ) ( ) ( ) ( ) ( ) ( )( )
1
1
1
1
ˆ ˆmin , ˆ
1ˆ
ˆ
1ˆ ˆ ˆmax ,
, ,θ
t t t
t
t
t t t
t
u t t u t
t u t t t u t
L w q
g w D g q q g d g w D g q Q g d
g w q g q q g d g w q g q Q g d
α α α
φ φα φ α φα
α
ε α ε αα α α
α α α α
α α α α
−
−
−
−
−−∞
∞
−
=
− − + − − +
− − + − −
∫ ∫
∫ ∫
where Dqtt −=α̂ and Dqt
t −= −−
11α̂ . The distribution ϕαg is bivariate normal,
hence ( )ϕαϕαg is distributed ( )( )222 1, ρσϕρ α −N . Using φ and Φ to denote the

28
density and the cumulative distribution functions of a standard normal random
variable respectively, the probability function can be written:
( )
( ) ( ) ( )( ) ( ) ( ) ( ) ( )
( ) ( ) ( ) ( ) ( ) ( ) ( )( )
1 1
1 1
, ,1 1 1 1min ,
1 1 1 1 1 max ,
θ
t
t t t t
u u
t t t t
u u
L w q
h o r r h y r r
s o k k s y k k
φ φ
ε ε
φ φ φ φσ σ σ σ
φ φ φ φσ σ σ σ
− −
− −
=
Φ + Φ − Φ +
⎡ ⎤Φ − Φ + − Φ⎣ ⎦
where u
tt qqo
σ1−−
= , ϕσDwh −
= , ( )2
2
1ˆ
ρσρα
α −
−−=
Dwrt
t , ( )2
211
1
ˆ
ρσρα
α −
−−=
−− Dwr
tt ,
u
t Qqyσ−
= , εσ
tqws
−= ,
ασα t
tkˆ
= , and ασ
α 11 ˆ −
− =t
tk .

29
Table 1 – Comparative statics of separating equilibrium
Parameter Impact on *p Impact on ( )ν*q
β - +
θ - +
c + -
( )z γ a - +
( )0 0k q a + -
a. Analyzed based on a linear water’s VMP function

30
Table 2 – Description of variables
Variable Spatial unit Units Mean /
Frequency Std. Dev.
Freshwater usea Village [103 m3 year-1] 958 472
Freshwater quotaa Village [103 m3 year-1] 1,028 408
Freshwater pricea,b Region [$ (m3)-1 ] 0.11 0.02
Energy delivery costsc,b Village [$ (m3)-1 ] 0.23 0.10
Capital & operation costsc,b Village [$ (m3)-1 ] 0.14 0.08
October rainfalld Village [mm month-1] 35.9 26.2
April rainfalld Village [mm month-1] 22.3 22.5
Annual rainfalld Village [mm year-1] 526 183
Elevation above sea levela Village [m] 183 223
Agricultural landa Village [103 m2] 2,745 2,201
Orchards, areaa Village [103 m2] 738 578
Light soild Village Dummy 2% -
Medium-light soile Village Dummy 44% -
Heavy-medium soile Village Dummy 6% -
Heavy soile Village Dummy 48% -
Northa Village Dummy 37% -
Centera Village Dummy 43% -
Southa Village Dummy 20% -
Cooperative (moshavim)a Village Dummy 78% -
Communal (kibbutzim)a Village Dummy 22% -
Natural enrichmentf Nationwide [106 m3 year-1] 1,280 313
Terms of tradeg Nationwide Index (1952=100) 65.2 1.30
a. Obtained from the Agriculture and Rural Development Ministry
b. Monetary terms are in 1987 US dollars
c. Calculated using data obtained from engineer Gabriel Shaham [personal communication]
d. Obtained from the Israeli Meteorological Service
e. Based on Ravikovitch (1992)
f. Enrichment of natural storages in the previous year as calculated by the Israeli Water Commission
g. From the dataset of Kislev and Vaksin (2003)

31
Table 3a – Demand and quota allocation functions
Observations 1,051
Wald χ2(14) 159.6
σα 383**
σε 241**
σyou 144**
Demand (D) Quota (Q)
Price -7,619** (δ1) -3,686** (δ2)
Energy costs - -311.8**
Capital & operation costs - 321.0**
Natural enrichment - 0.117**
qt-1 - 0.757**
Elevation -0.858** -
October rainfall -0.994 -
April rainfall 1.761 -3.098**
Annual rainfall 0.273 -0.004
Agricultural land 0.049** 0.013**
Orchard area 0.352** 0.078**
Light soil -75.39 128.7**
Medium-light soil 94.08 -29.33**
Heavy-medium soil 2,645 139.6**
Terms of trade 72.48* 29.55**
Center -6.96 57.66**
South 258.6* 30.35
Cooperative -164.27* -4.41
Constant -2,849 -1,452**
2 11β δ δ
β=
+a
0.48**
(95% Conf.: 0.06 to 0.91)
* = significant at 10%; ** = significant at 5%
a. Calculated using the delta method for computing standard deviations (Green 2003)

32
Table 3b – Price formation equation
Observations 1,039
Wald χ2(4) 202.4
W/Nl (instrumented)a -2.81×10⁻⁵** (δ3)
Energy costs 7.64×10⁻²**
Capital & operational costs -0.19**
Natural enrichment -1.21×10⁻⁵**
Constant 0.193**
( )3 1 1 2 2θ δ δ δ δ δ= − b 0.23
(95% Conf.: -0.30 to 0.75)
* = significant at 10%’ ** = significant at 5%
a. Instruments include rainfall during October and April, elevation, and dummies for
years and location in the central and southern areas of the country
b. Calculated using the delta method for computing standard deviations
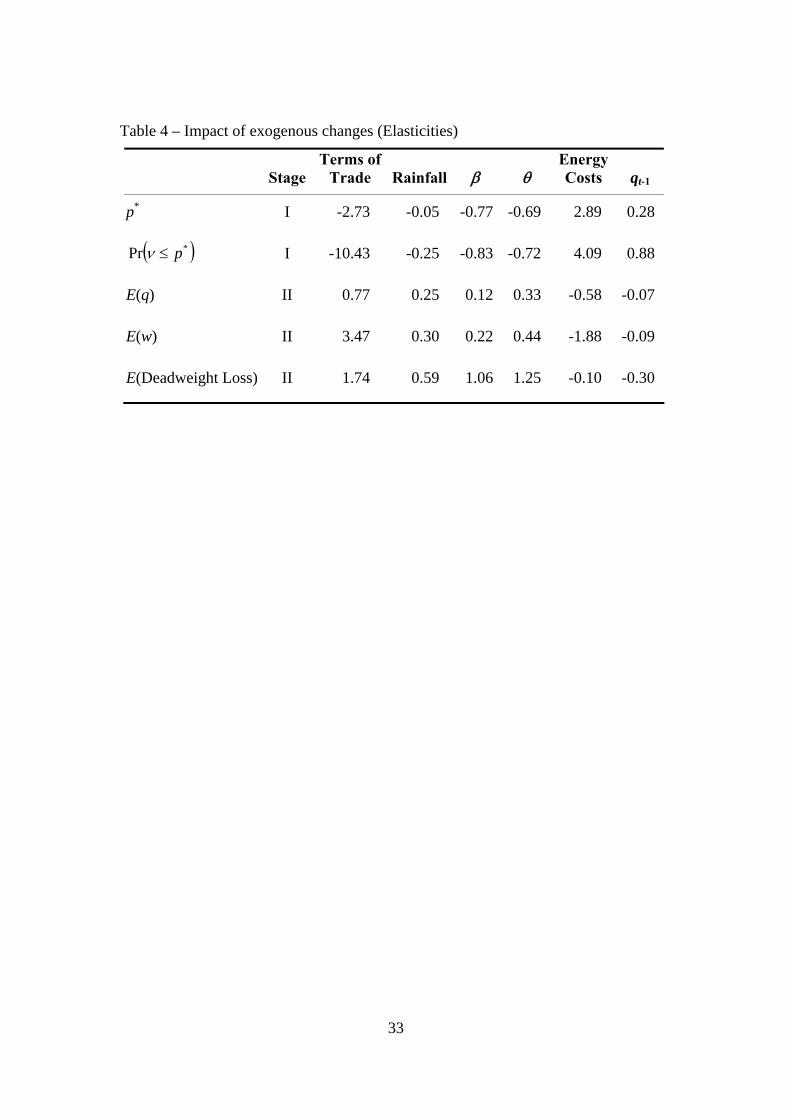
33
Table 4 – Impact of exogenous changes (Elasticities)
Stage Terms of
Trade Rainfall β θ Energy Costs qt-1
p* I -2.73 -0.05 -0.77 -0.69 2.89 0.28
( )*Pr p≤ν I -10.43 -0.25 -0.83 -0.72 4.09 0.88
E(q) II 0.77 0.25 0.12 0.33 -0.58 -0.07
E(w) II 3.47 0.30 0.22 0.44 -1.88 -0.09
E(Deadweight Loss) II 1.74 0.59 1.06 1.25 -0.10 -0.30

34
Table 5 – Simulated control regimes (per-village average)
Separating
(observed)
Pooling
quota
Pooling
price
Pooling
price ( 1θ = )
Average cost ($ / m3) 0.37 0.37 0.37 0.37
Average price ($ / m3) 0.11 - 0.18 0.09
E(πw(q)) ($ / m3) 0.19 0.13 - -
E(w) (103 m3 / year-village) 940 1,403 835 1,543
E(q) (103 m3 / year-village) 1,033 1,412 - -
E(DWL) (103 $ / year-village) 60 94 5 115

35
Consumption
0
500
1,000
1,500
2,000
2,500
3,000
3,500
0 500 1,000 1,500 2,000 2,500 3,000 3,500
w observed (103 m3/year-village)
(a)E
( w) (
103 m
3 /yea
r-vi
llage
)
Quota
0
500
1,000
1,500
2,000
2,500
3,000
3,500
0 1,000 2,000 3,000
q observed (103 m3/year-village)
(b)
E( q
) (10
3 m3 /y
ear-
villa
ge)
00.10.20.30.40.50.60.70.80.9
1
0 1,000 2,000 3,000w (103 m3/year-village)
ObservedPredicted
(c)
Prob
abili
t
00.10.20.30.40.50.60.70.80.9
1
0 1,000 2,000 3,000
q (103 m3/year-village)
(d)
Prob
abili
t Observed Predicted Average 958 940 Median 913 929 Std. Dev. 472 313 Pseudo R2* 0.63
Observed Predicted Average 1,028 1,033 Median 995 997 Std. Dev. 408 393 Pseudo R2* 0.91
* Pseudo R2 refers here to the square of the correlation between predicted and observed values.
Figure 1 – Predicted versus observed distributions of water consumption ((a) and (c)) and quota ((b) and (d))