1-pankaj desai-pk etc.ppt
DESCRIPTION
thank uTRANSCRIPT

Key Pharmacokinetic Concepts – Single Dose and Steady State Drug
AdministrationPankaj B. Desai. Ph.D.
Professor of Pharmacokinetics and Biopharmaceutics
Director, Drug Development Graduate Program

Morning Agenda: Wake Up and Smell the Coffee (Cytochrome P450 1A2 Substrate)
Overview of ADME principles Important PK Parameters First Pass Metabolism Compartmental & Non-Compartmental Analyses Single Dose Kinetics Multiple Dose Kinetics Drug-Drug Interactions Inter-Subject Variability
CYP1A2 Substrate
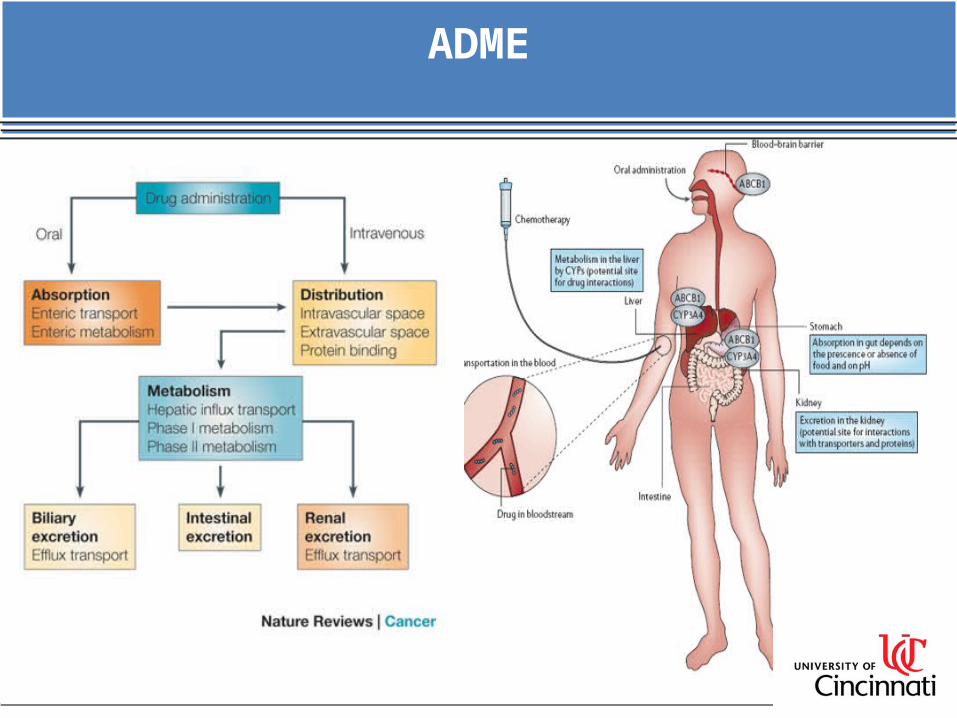
ADME ISSUES IN ANTIssues I-CANCER DRUG DEVELOPMENTADMEADMEADMEADME
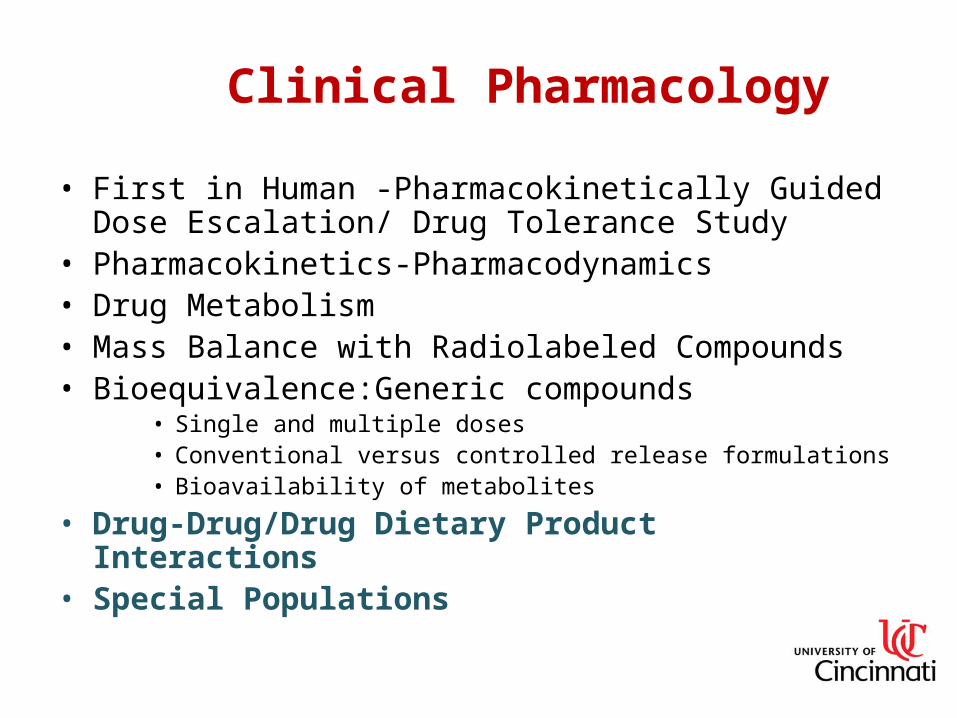
Clinical Pharmacology
• First in Human -Pharmacokinetically Guided Dose Escalation/ Drug Tolerance Study
• Pharmacokinetics-Pharmacodynamics• Drug Metabolism• Mass Balance with Radiolabeled Compounds• Bioequivalence:Generic compounds
• Single and multiple doses• Conventional versus controlled release formulations• Bioavailability of metabolites
• Drug-Drug/Drug Dietary Product Interactions• Special Populations

Drug Input & Different Routes of Administration1. I.V. and I.A. injections:
• Bolus dosing
• Zero-Order Input (Infusions)
2. Extravascular Administration
• First Order (mostly passive diffusion)
• Zero Order (active transport and controlled release systems)
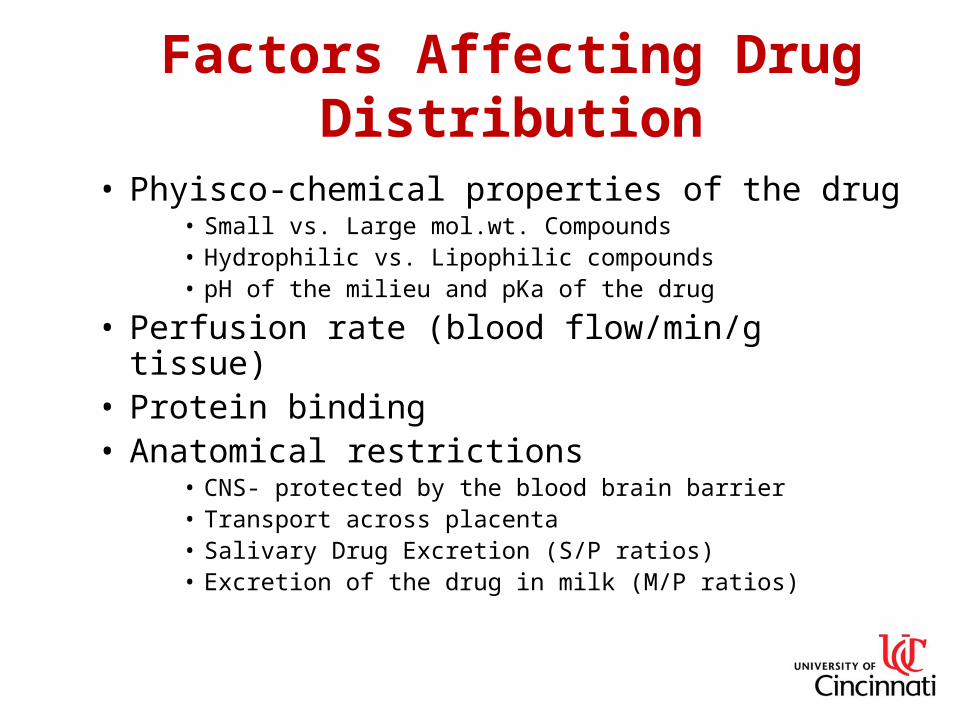
Factors Affecting Drug Distribution
• Phyisco-chemical properties of the drug• Small vs. Large mol.wt. Compounds• Hydrophilic vs. Lipophilic compounds• pH of the milieu and pKa of the drug
• Perfusion rate (blood flow/min/g tissue)• Protein binding• Anatomical restrictions
• CNS- protected by the blood brain barrier• Transport across placenta• Salivary Drug Excretion (S/P ratios)• Excretion of the drug in milk (M/P ratios)
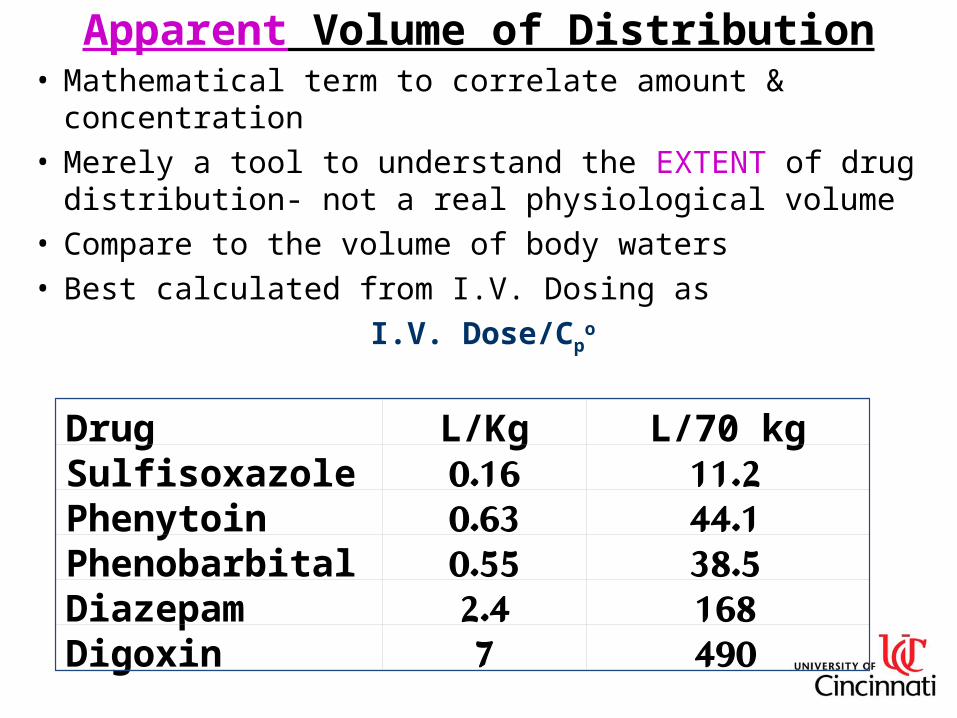
Apparent Volume of Distribution• Mathematical term to correlate amount & concentration• Merely a tool to understand the EXTENT of drug
distribution- not a real physiological volume• Compare to the volume of body waters• Best calculated from I.V. Dosing as
I.V. Dose/Cpo
Drug L/Kg L/70 kgSulfisoxazole 0.16 11.2 Phenytoin 0.63 44.1 Phenobarbital 0.55 38.5 Diazepam 2.4 168 Digoxin 7 490
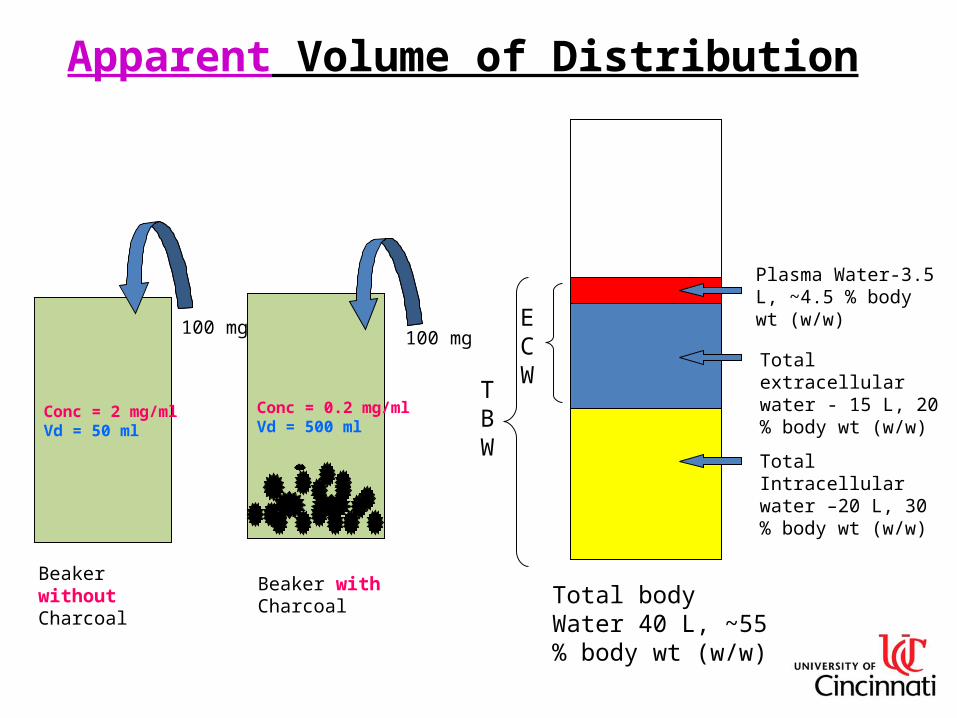
Apparent Volume of Distribution
Conc = 2 mg/mlVd = 50 ml
Beaker without Charcoal
100 mg
Conc = 0.2 mg/mlVd = 500 ml
Beaker with Charcoal
100 mg
Total body Water 40 L, ~55 % body wt (w/w)
TBW
Plasma Water-3.5 L, ~4.5 % body wt (w/w)
Total extracellular water - 15 L, 20 % body wt (w/w)
ECW
Total Intracellular water –20 L, 30 % body wt (w/w)

Major Drug Elimination Pathways (Coordinated defense mechanism)
Renal Biliary
Biotransformation Excretion
HEPATIC Extra-Hepatic
Phase I Phase II


Glomerular Filtration• Kidney receives 1.1 L of blood (20 – 25%) of
cardiac output• 10 % is filtered at the glomerulus• Compounds with Mol.wt < 20,000 filtered• GFR = 120 ml/min• CLR of Inulin - a measure of GFR
• Filtered freely into the tubule • Not influenced by protein binding and neither secreted nor
reabsorbed
• Rate of filtration = Fu. Cp.GFR• Not a very effective drug extraction process
(maximal ~ 0.11 or 10 %)

Active Secretion• Detected when the overall rate of urinary drug
excretion exceeds the rate of filtration• Secretory processes (proteins) located
predominantly within the proximal tubules• Mechanisms exist for secreting acids (anions)
and bases (cations) from plasma into the tubular lumen
• Energy-dependent• Saturable processes• Subject to competitive inhibition
• Effect of Protein-Binding• Depends upon secretion efficiency
and contact time at the secretory sites• Restrictive (dependent on the Fub) vs.
Non-Restrictive (perfusion-rate limited)

Reabsorption• Must occur when CLR < fu.GFR• Reabsorption occurs all long the nephron, associated with
reabsorption of water; majority however occurring from the proximal tubules
• Predominantly a passive diffusion process• Driven by concentration-gradient across the tubular
lumen• Active secretion occurs for many endogenous
compounds such as vitamins, electrolytes, glucose and amino acids
• Urine-Plasma Ratio (U/P) based on Henderson-Hasselbalch equation
• Influence of pKa and pH of urine
Major Tissues Involved in Drug Metabolism
• Liver• Small intestines• Kidney• Lung• Other portals of entry into the body and
protected organs.-e.g. nasal mucosa
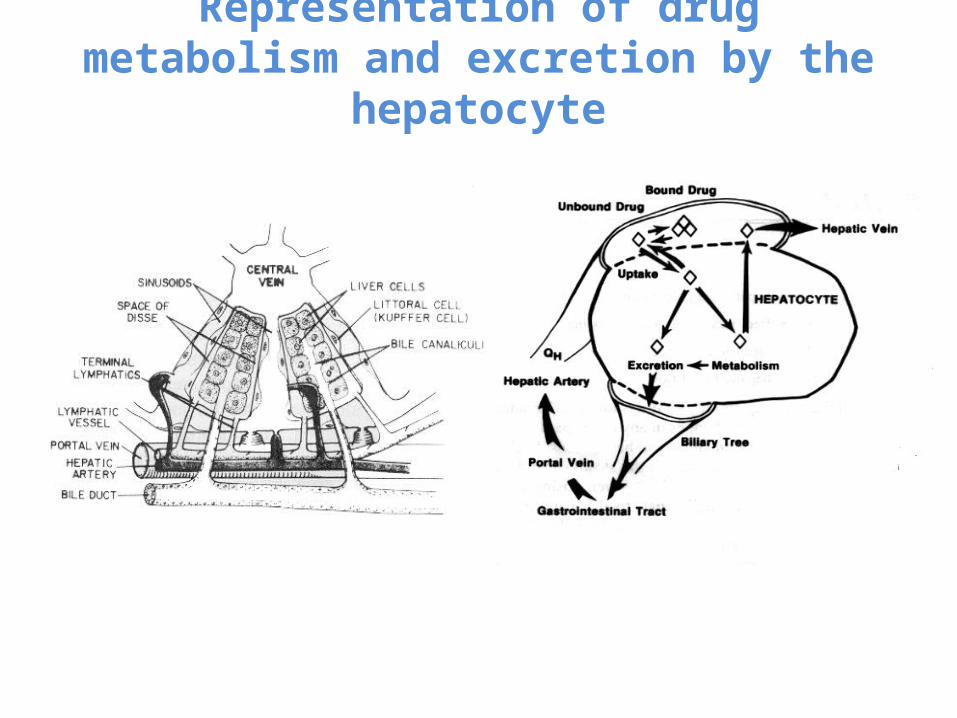
Representation of drug metabolism and excretion by the hepatocyte

Biliary Excretion is Transporter Mediated


Phase I and Phase II Drug Metabolizing Enzymes
Phase I enzymes: Predominantly cytochrome P450 (CYP)

Drug Metabolism by CYPs
CYP2D6 (25%)Includes: Tricyclic antidepressants,SSRI's, haliperidol, propanolol, atomoxetineDetxromethorphan,
CYP3A (50%)
CYP2E1(Chlorzoxazone)CYP1A2
5%
CYP2A6 (Coumarin)
Includes:lovastatincyclosporinnifedipinemidazolamethinylestradiolRitonavirMidazolamtestosterone
CYP2C9(15%)Includes:warfarinphenytointolbutamideLosartan
Theophylline, caffeine, Olanzapine
CYP2C8PaclitaxelRosiglitazonecerivastatin
CYP2B6 bupropion, tamoxifen, efavirenz

Phase II Reactions
• Also known as Synthetic (conjugation) reactions• Major reaction: Transfer of the conjugating
moiety to the drug • Enzymes involved are “transferase”
• Glucuronosyl transferase• Sulfotransferases• N-acetyltransferase• Methyltransferase• Glycine transferase• Glutathione-S-transferase

Drug Biotransformation Reactions• Active Drug to Inactive Metabolite
• Amphetamine Phenylacetone• Phenobarbital Hydroxyphenobarbital• Taxol 6-hydroxytaxol
• Active Drug to Active Metabolite• Codeine Morphine• Procainamide N-acetylprocainamide• tamoxifen 4-hydroxytamoxifen

Drug Biotransformation Reactions• Inactive Drug to Active Metabolite
• Hetacillin Ampicillin• Sulfasalazine Sulfapyridine + 5 ASA• Cyclophosphamide Nitrogen mustard
• Active Drug to Reactive Intermediates• Acetaminophen Reactive metabolites
(hepatic necrosis)
• Benzo(a)pyrene Reactive metabolite (carcinogenic)


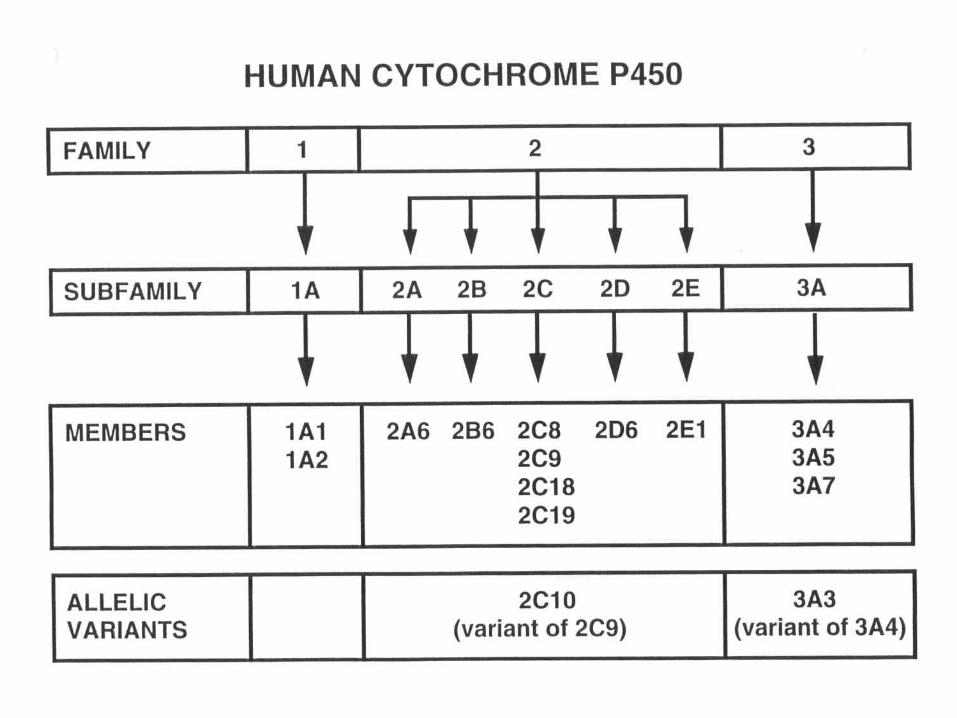
Nomenclature
• Basis: Amino acid sequence• Families: Less than 40 % a.a. sequence
assigned to different gene families (gene families 1, 2, 3, 4 etc.)
• Subfamilies: 40 – 55 % identical sequence (2A, 2B, 2C, 3A etc.)
CYP3A4
Family Subfamily Isoform

CYP Nomenclature (Contd.)
• Cytochrome P450 Nomenclature, e.g. for CYP2D6• CYP = cytochrome P450 • 2 = genetic family • D = genetic sub-family • 6 = specific gene • NOTE that this nomenclature is genetically based: it
has NO functional implication

Examples of reactions catalyzed by cytochrome P450:
Hydroxylation of aliphatic carbon
Examples of CYP mediated Oxidative Metabolism
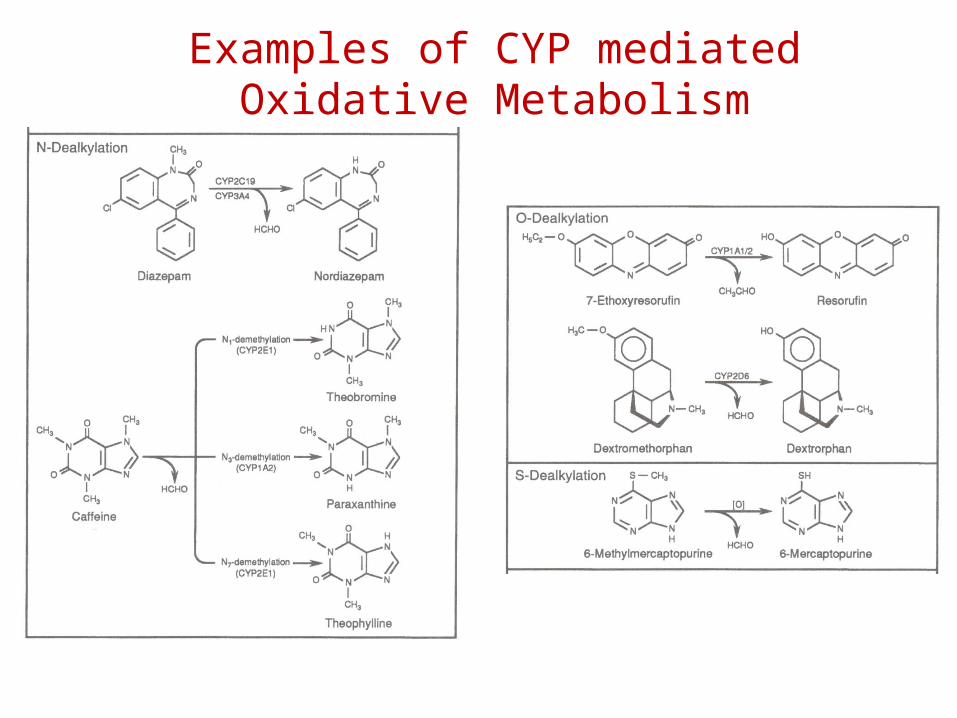
Examples of reactions catalyzed by cytochrome P450:
Heteroatom dealkylationExamples of CYP mediated Oxidative
Metabolism

Clearance Concepts


Compartmental Modeling
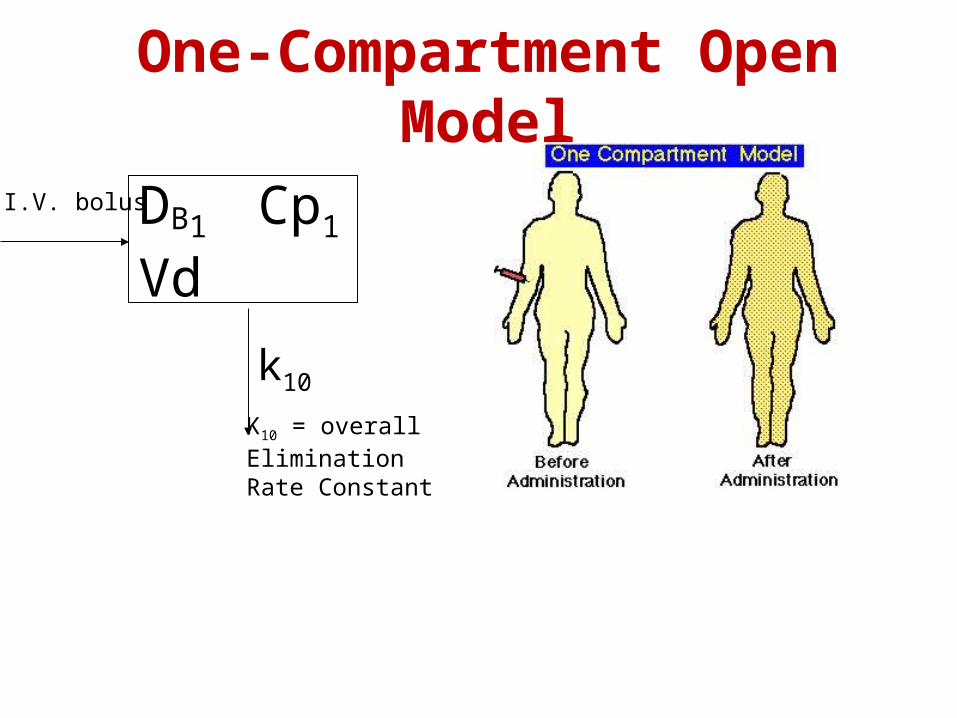
One-Compartment Open Model
I.V. bolus DB1 Cp1 Vd
k10
K10 = overall EliminationRate Constant

I.V. Bolus
tp
10p
keCC
Vd
DpC

Two-compartment Open model
tλCtλCCp Z1z1
1- hybrid rate constant (distribution)
z- hybrid rate constant (terminal)
Cp1 VC
Dp
I.V. bolus Dt
Ct
Vt
k12
k21
TissueCentral or Plasma

Two-compartment Open Model
Elimination only

Blood flow to human tissuesTissue Percent Body
WeightPercent Cardiac
OutputBlood Flow
(ml/100 g tissue/min)
Adrenals 0.02 1 550
Kidney 0.4 24 450
Liver 2.0 25
Hepatic
Portal
5 20
20 75
Brain 2.0 15 55
Skin 7.0 5 5
Muscle (basal)
40.0 15 3
Connective Tissue
7.0 1 1
Fat 15.0 2 1

Extravascular dose
DpCpVd
k10
kaSite of absorption
e.v. dose
0
4
8
12
16
0 5 10 15Time(hrs)
Co
nc
(ug
/ml)
Cp
Cp'
Cp'-Cp
F.Dose.Ka Cp=
V(ka-k) (e-k.t- e-ka.t)

NCA
Used to estimate• AUC• Bioavailability• Clearance• Volume of Distribution• Average Steady State
Concentration
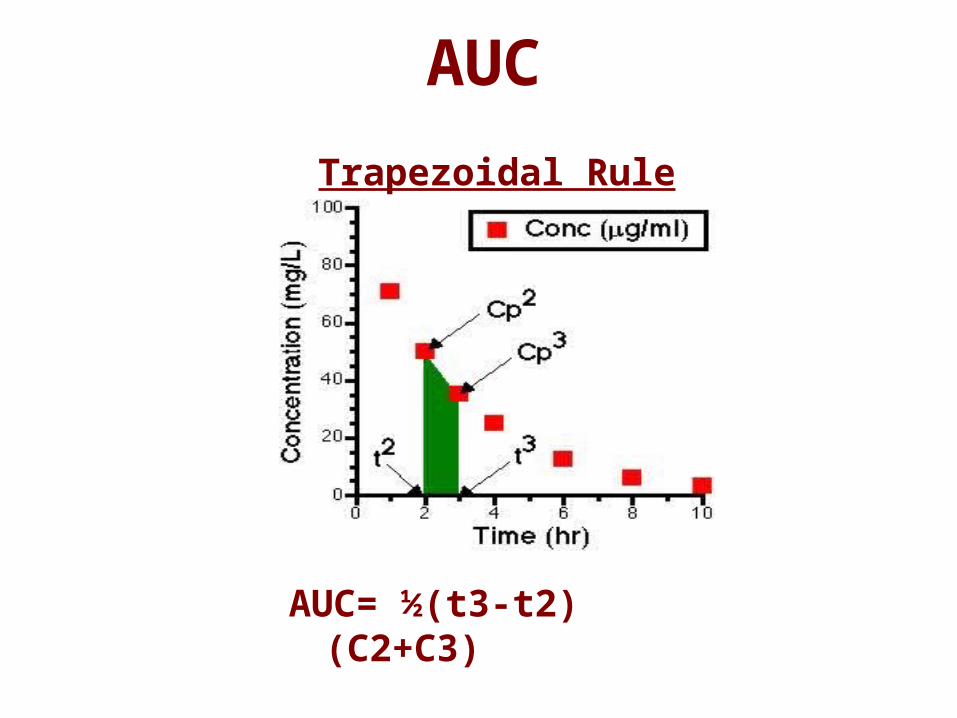
AUC
Trapezoidal Rule
AUC= ½(t3-t2)(C2+C3)

AUC
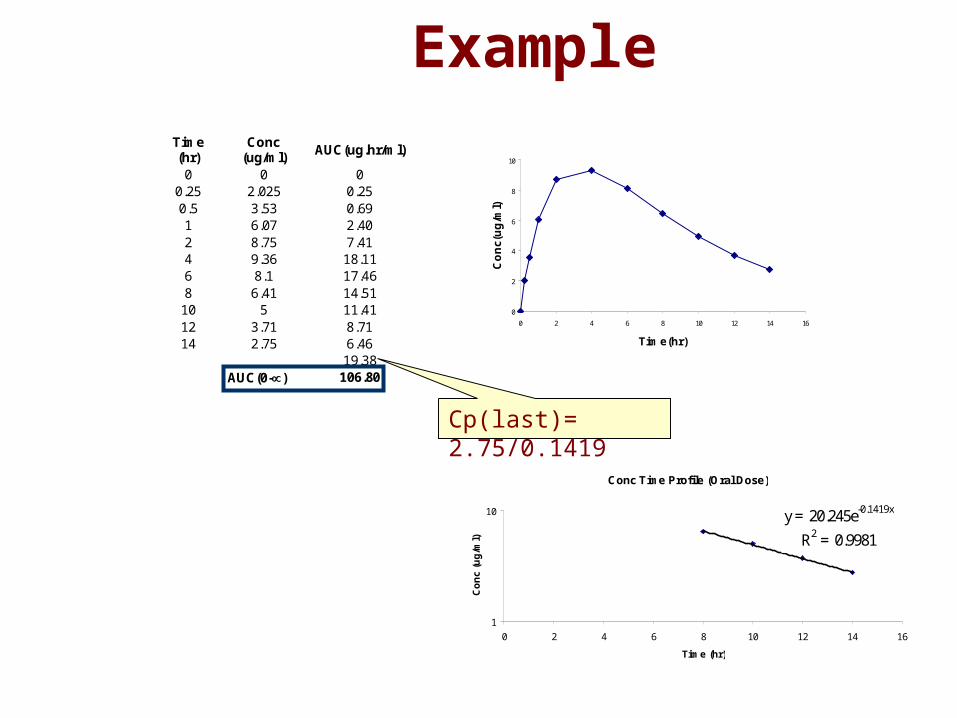
ExampleTime (hr)
Conc (ug/ml)
AUC(ug.hr/ml)
0 0 0 0.25 2.025 0.25 0.5 3.53 0.69 1 6.07 2.40 2 8.75 7.41 4 9.36 18.11 6 8.1 17.46 8 6.41 14.51
10 5 11.41 12 3.71 8.71 14 2.75 6.46
19.38 AUC(0-) 106.80
Conc Time Profile (Oral Dose)
y = 20.245e-0.1419x
R2 = 0.9981
1
10
0 2 4 6 8 10 12 14 16
Time (hr)
Co
nc
(ug
/ml)
Cp(last)= 2.75/0.1419
0
2
4
6
8
10
0 2 4 6 8 10 12 14 16
Time(hr)
Co
nc(
ug
/ml)
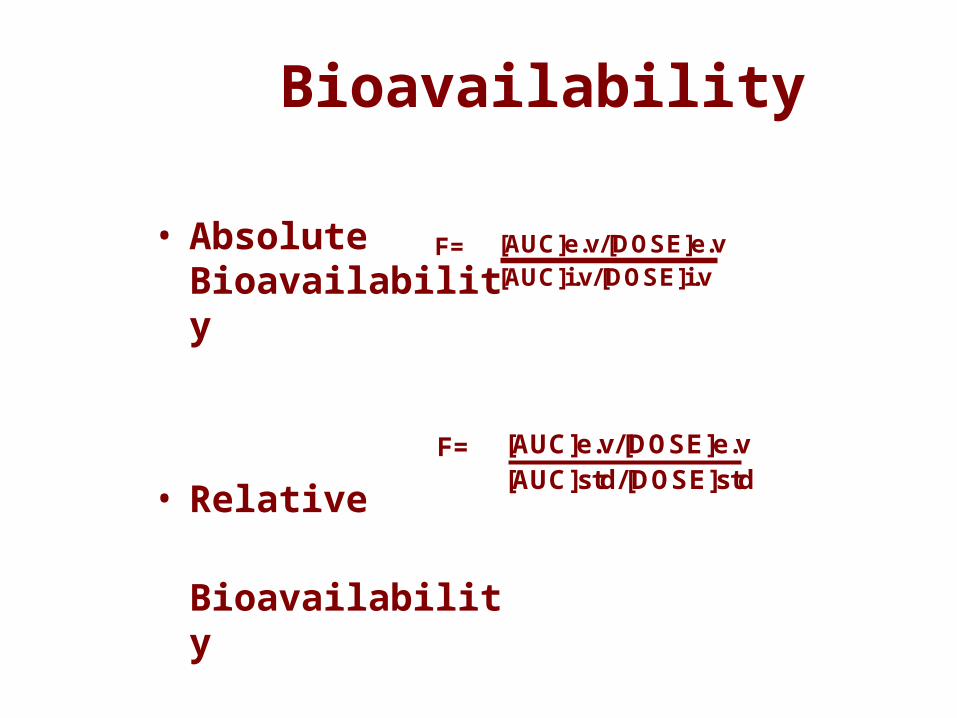
Bioavailability
• Absolute Bioavailability
• Relative Bioavailability
F= [AUC]e.v/[DOSE]e.v [AUC]i.v/[DOSE]i.v
F= [AUC]e.v/[DOSE]e.v [AUC]std/[DOSE]std

Bioequivalence
• Two products are considered to be bioequivalent if the concentration time profiles are so similar that they are likely to produce clinically relevant differences in either efficacy or toxicity.
• Common measures used to assess differences are
Tmax, Cmax and AUC.
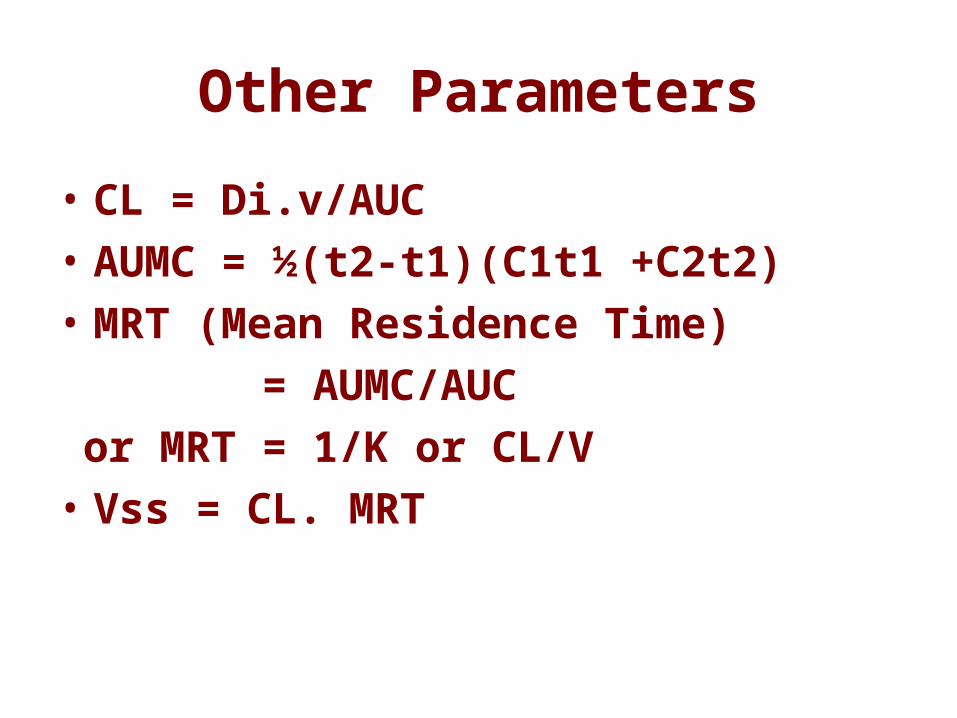
Other Parameters
• CL = Di.v/AUC• AUMC = ½(t2-t1)(C1t1 +C2t2)• MRT (Mean Residence Time) = AUMC/AUC or MRT = 1/K or CL/V• Vss = CL. MRT

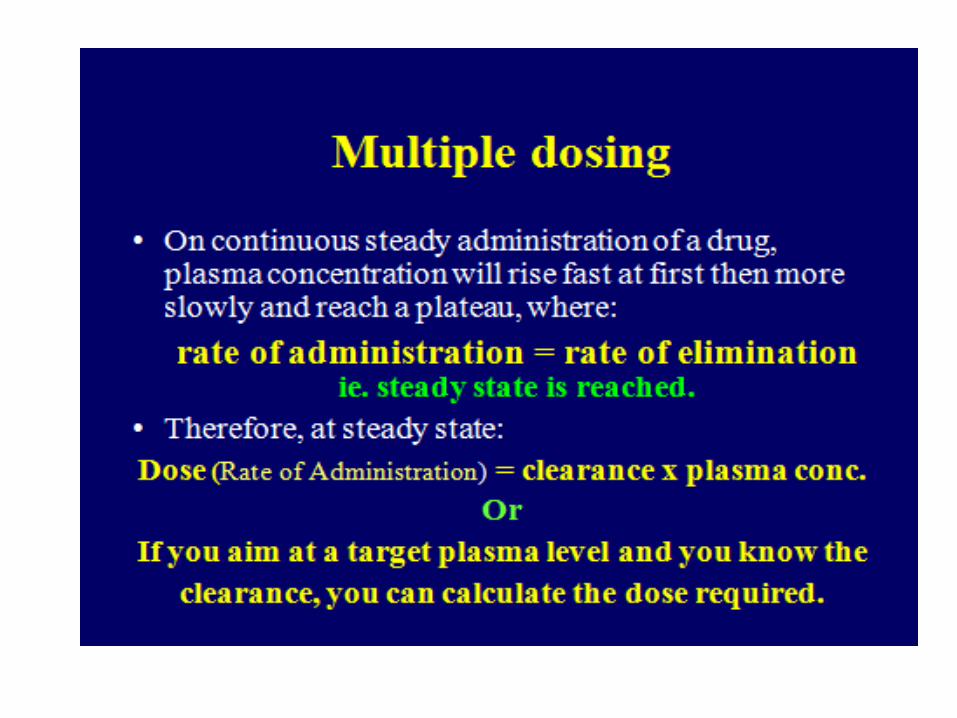
Multiple Dosing –Overall Aims
• Key Concepts• Principle of Superposition
• Drug Accumulation and Steady State• Persistence Factor and Accumulation Factor
• Peak, Trough and Steady State Average Levels
• Applications• Determination of drug concentrations and amounts following
multiple i.v. and e.v. doses (Ka > > K10)» max, min and during a dosing interval
• Determination of dosing regimens– Doses (Maintenance and Loading) and Dosing Interval
» Cpmax consideration
» Cpmin consideration
» Cpmax and Cp
min consideration
• Practical Considerations in Decision Making

Drug Accumulation Depends on Frequency of Administration

Multiple I.V. Dosing
The AUC within a dosing interval at steady state is equal to the total AUC of a single dose.
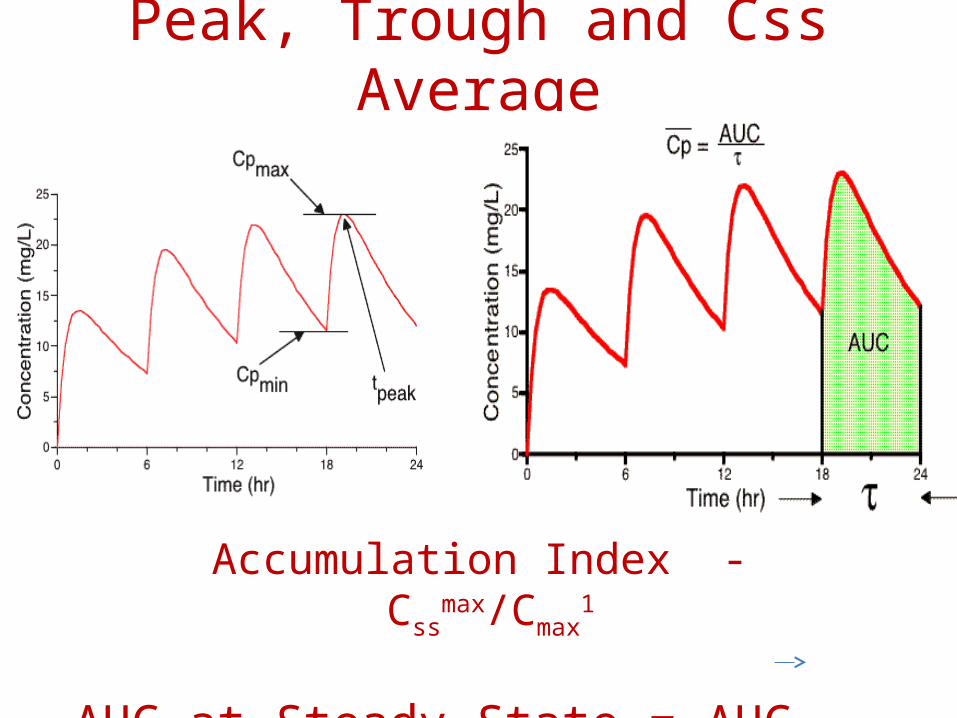
Peak, Trough and Css Average
Accumulation Index - Cssmax/Cmax
1
AUC at Steady State = AUC0 ∞

Impact of Half-life and dosing interval Half-Life on
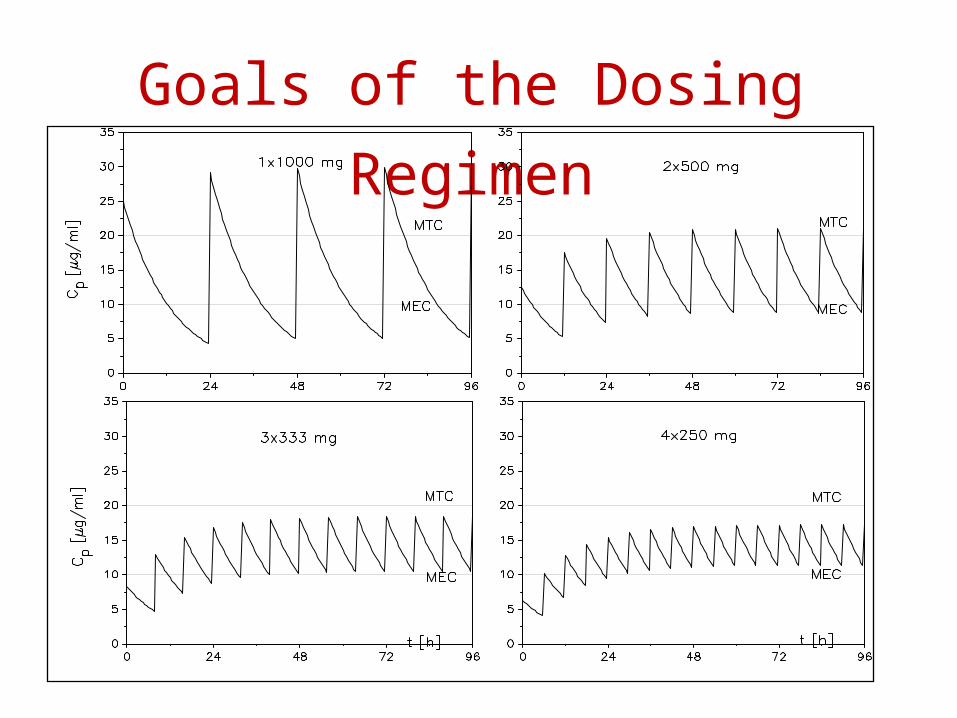
Goals of the Dosing Regimen

Dosing Regimen: Loading and Maintenance Doses
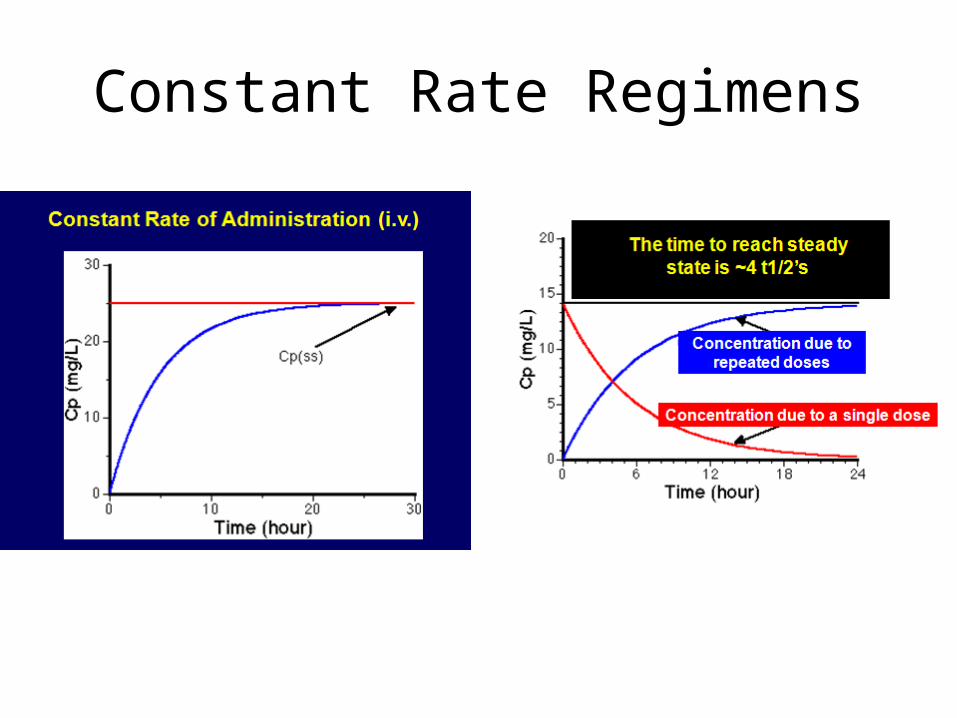
Constant Rate Regimens


Sources of Variability
• Genetic factors• Genetic differences within
population• Racial differences among
different populations• Environmental factors and drug
interactions• Enzyme induction• Enzyme inhibition
• Physiologic considerations• Age• Gender• Diet/nutrition• Pathophysiology
• Drug dosage regimen• Route of drug administration
• Dose dependent (nonlinear) pharmacokinetics
Sources of VariabilitySources of Variability

Therapeutic Class
Anti-epileptic Drugs
Anti-InfectiveAgents
Anti-Cancer Drugs
Miscellaneous
CarbamazepinePhenobarbital
PhenytoinTopiramateFelbamate
RifampicinRifabutin
RifapentineClotrimazoleSulfadimidine
SuflinpyrazoneEfavirenz
AmprenavirNelfinavir Ritonavir
Capravirine
PaclitaxelDocetaxel
CyclophosphamideIfophosphamide
Tamoxifen4-hydroxy-tamoxifen
SU5416
LovastatinTroglitazone OmeprazolePrednisolone
ProbencidPhenylbutazone
Diazepamfexofenadine
Hyperforin
Examples of CYP3A InducersExamples of CYP3A Inducers
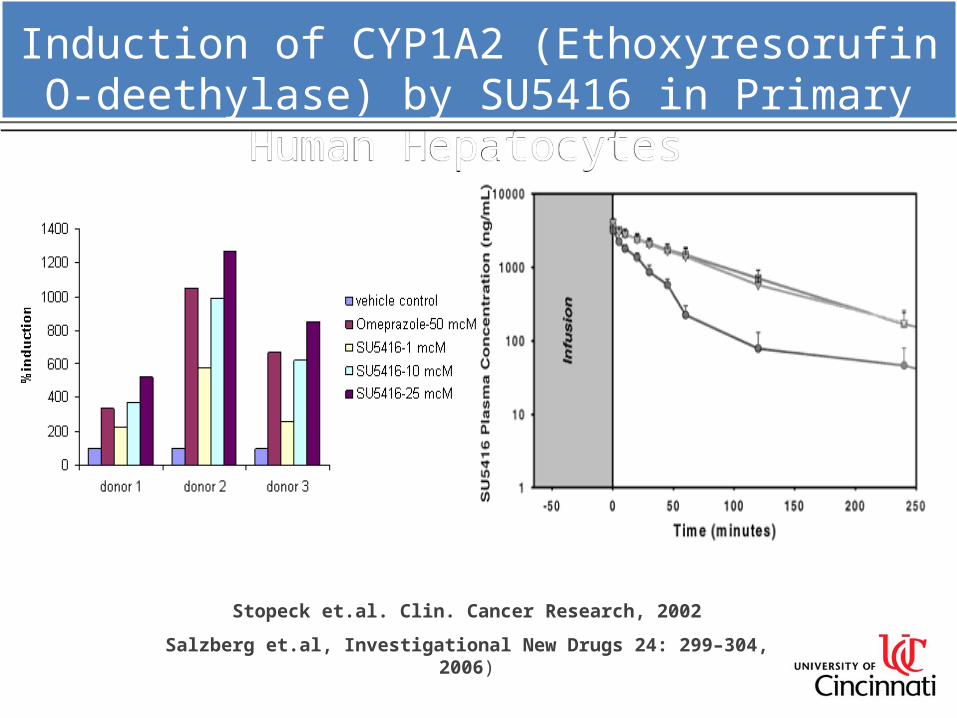
Induction of CYP1A2 (Ethoxyresorufin O-deethylase) by SU5416 in Primary Human Hepatocytes
Induction of CYP1A2 (Ethoxyresorufin O-deethylase) by SU5416 in Primary Human Hepatocytes
Stopeck et.al. Clin. Cancer Research, 2002
Salzberg et.al, Investigational New Drugs 24: 299–304, 2006)

Example of Auto-Induction – SU5416 Example of Auto-Induction – SU5416
Oral Treatment AUC Day 8 AUC Day 15 AUC Day
21/22Induction of
clearance
Once weekly (n=3) 156 ± 117 131 ± 140 141 ± 90 10%
Twice weekly (n=3) 329 ± 187 117 ± 92 198 ± 321 40%
Daily dosing (n=3) 412 ± 111 21 ± 36 9 ± 16 98%
Stopeck et.al. Clin. Cancer Research, 2002
Salzberg et.al, Investigational New Drugs 24: 299–304, 2006)

Letrozole Alone
Letrozole + Tamoxifen ( 6 weeks & > 4 months)
Dowsett, M. et al. Clin Cancer Res 1999;5:2338-2343
Effect of Tamoxifen (TAM) Mediated CYP3A4 Induction
Effect of Tamoxifen (TAM) Mediated CYP3A4 Induction
62

Pharmacogenomics. 2008 November; 9(11): 1695–1709.
PXRPXR
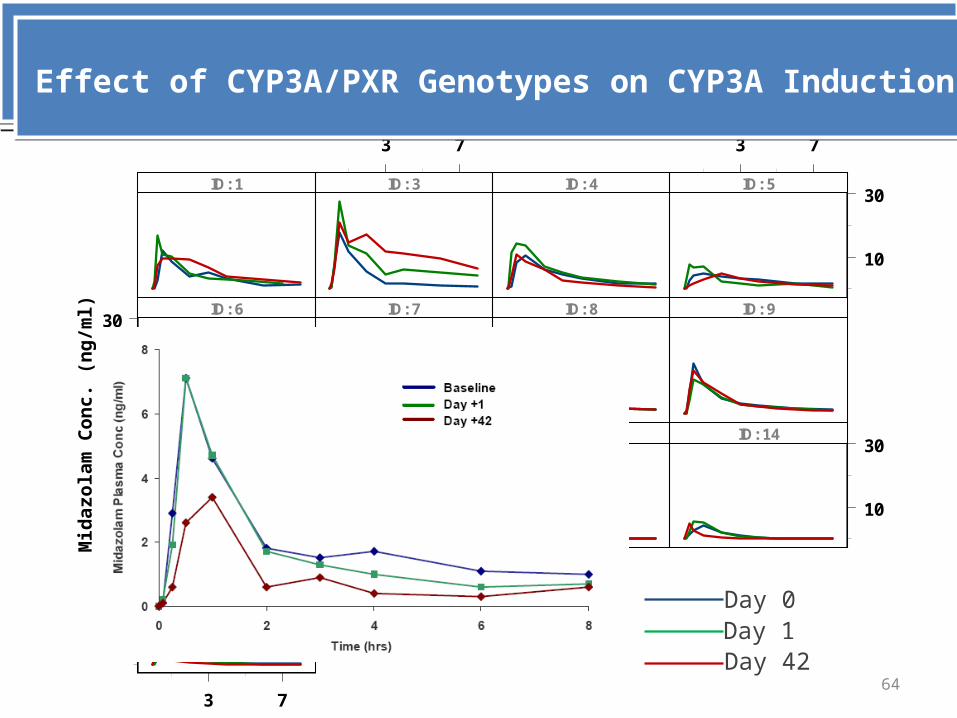
Midazolam Plasma Conc. ProfileMidazolam Plasma Conc. Profile
3 7 3 7
3 7
10
30
10
30
10
30
10
30
ID: 1 ID: 3 ID: 4 ID: 5
ID: 6 ID: 7 ID: 8 ID: 9
ID: 10 ID: 11 ID: 12 ID: 14
ID: 15
Time(hrs)
Mid
azo
lam
Co
nc.
(n
g/m
l)
Day 0Day 1Day 42
64
Effect of CYP3A/PXR Genotypes on CYP3A InductionEffect of CYP3A/PXR Genotypes on CYP3A Induction

Inhibition of Drug Metabolizing
EnzymesInhibitor absent
Active drug
CYP3A
Inactive drug
Inhibitor present
Active drug
CYP3A
Inactive drug
Inhibitor
Saquinavir +
Ritonavir
SaquinavirAIDS. 1997 Mar
15;11(4):F29-33

Plasma Rosuvastatin concentration-time profile in the absence and presence of
Darunavir/Ritonavir
Before DRV/RTV After DRV/RTV
• Graduate Students- Rucha Sane
– Niresh Hariparsad– Fang Li
– Ganesh Mugundu
• Collaborators– Arthur Buckley, Ph.D., College of
Pharmacy– Julie Nelson, Ph.D., Department of
Molecular Genetics, Biochemistry and Microbiology
- Elizabeth Shaughnessy, MD- Judith Feinberg, MD Brian Goodwin,
Ph.D., GlaxoSmithKline– Stephen Storm, Ph.D. University of
Pittsburgh
-
• Funding Sources- Aventis Pharmaceutical, Eli Lily & Co, Bristol Myers Squibb
- Womens Health (UC), American Cancer Society
- NIH, Susan G. Komen Breast Cancer Foundation
•Former Student/Post-Doc Srikanth Nallani, Ph.D., FDA
Desai Lab with the UC PresidentDesai Lab with the UC President