1 part iii. exhaustible resources a.ozone b.energy
Post on 20-Dec-2015
221 views
TRANSCRIPT
1
Part III. Exhaustible Resources
A. Ozone
B. Energy

2
B. Energy
Part 2 –Chapter 9

3
Introduction
• The focus of Chapter 9 is on the impact of energy use on the environment, with a particular focus on air pollution and acid rain.
• Although all types of energy have some type of environmental impact, fossil fuels are responsible for the majority of the negative impacts of energy use.
4
Air pollution
• Perhaps the greatest negative interaction between energy and the environment occurs with air pollution, where the combustion of fossil fuels is the major source of the air pollutants that were initially regulated by the 1972 Clean Air Act, with amendments in 1977 and 1990.
• These pollutants include particulates, sulfur oxides (SOx), nitrogen oxides (NOx), carbon monoxide (CO), volatile organic compounds (VOCs), and lead (Pb).

5
6
Air pollution
• Most of these pollutants have ↓ since the passage of the Clean Air Act, except for nitrogen oxides.
• Nitrogen oxides have ↑ because of the ↑emissions from on-road (cars, trucks) and off-road vehicles (bulldozers, cranes) and off-road engines (boat engines, lawnmowers).

7
Air pollution• In addition to fuel consumption, the use of energy
is responsible for virtually all the pollutants in the transportation sector and a good portion of the emissions in industrial processes.
• Despite ↓ in overall emission levels in the US, approximately 98 million people live in “nonattainment areas” (locations which persistently fail to meet national ambient air quality standards).
• See Box 9.1 for benefits and costs of Clean Air Act
8
Stationary sources – Clean Air Act
• Stationary sources of criteria air pollutants (smokestacks from factories and buildings) are regulated under the Clean Air Act of 1972 and its amendments (1977 and 1990).
• Using federal gov’t established national ambient standards on concentration of each pollutant, states implemented C & C policies to reduce emissions.
• These C & C policies did not allow firms to seek cost-minimizing alternatives in production.

9
Command and control
• Smokestack by smokestack control• A firm that could reduce its abatement costs
by switching production from 1 facility to another could not do so if pollution from 1 smokestack ↑ (even if total pollution from firm ↓)
• Regulations did not allow firms to meet environmental goals within own facilities
10
Bubbles
• The “Pollution Bubble” concept was a modification of the C & C regulations which treated each firm as if a glass bubble encased the entire firm's operations.
• Firms could make adjustments within the bubble as long as the pollution that left the bubble conformed to emissions limitations.
• While allowing some flexibility to respond to pollution standards, even modified the policy was not effective in reducing pollution.
11
Offsets
• Modification to the Clean Air Act allowed new emission sources if they induced existing polluters to reduce pollution by 150% of the amount generated by the new source.
• This “offset” system allowed development but limited trade to new firms and was not as efficient a policy as marketable permits.
• Efficiency calls for trade among all polluters.
12
Acid Rain• Acid deposition – process by which certain types
of pollutants chemically transform into acidic substances in the atmosphere and then fall to the earth.
• Forms of precipitation include acid rain, acid snow, and acid fog.
• While acid rain has received a lot of press, there is considerable uncertainty about the actual damages generated by the emissions of acid deposition precursors.
• Precursor pollutants are those pollutants that are chemically transformed to generate the substances that actually cause the environmental damage.

13
Acid Rain
• Acid rain belongs to a category of pollutants referred to as regional pollutants, which have effects over more than just the vicinity of their emission.
• Unlike global pollutants, location of emissions is important with regional pollutants. Effects felt primarily downwind of emissions.
• Acid deposition problems often manifest as transboundary (transfrontier) pollutants.
14
Transboundary pollutants
• Emitted in 1 country then transported to another country
• 2 examples include:1. Sulfur dioxide emissions in the United
States which affect environmental quality in Canada and vice versa.
2. Pollution generated in Great Britain and German which causes acid deposition in Scandinavia.

15
What Causes Acid Deposition?• The most important precursor pollutants in the acid
deposition problem are sulfur dioxide (SO2) and nitrous oxides (NOx).
• SO2 – burning of coal and oil as boiler fuel. • NOx – automobile emissions.
• Acid rain, other forms of acid deposition are caused when SO2 and NOx form sulfate and nitrate in the atmosphere, which then combines with hydrogen ions to form acids.
• Sulfate and nitrate molecules are formed when SO2 and NOx combine with oxidants in the atmosphere.
16
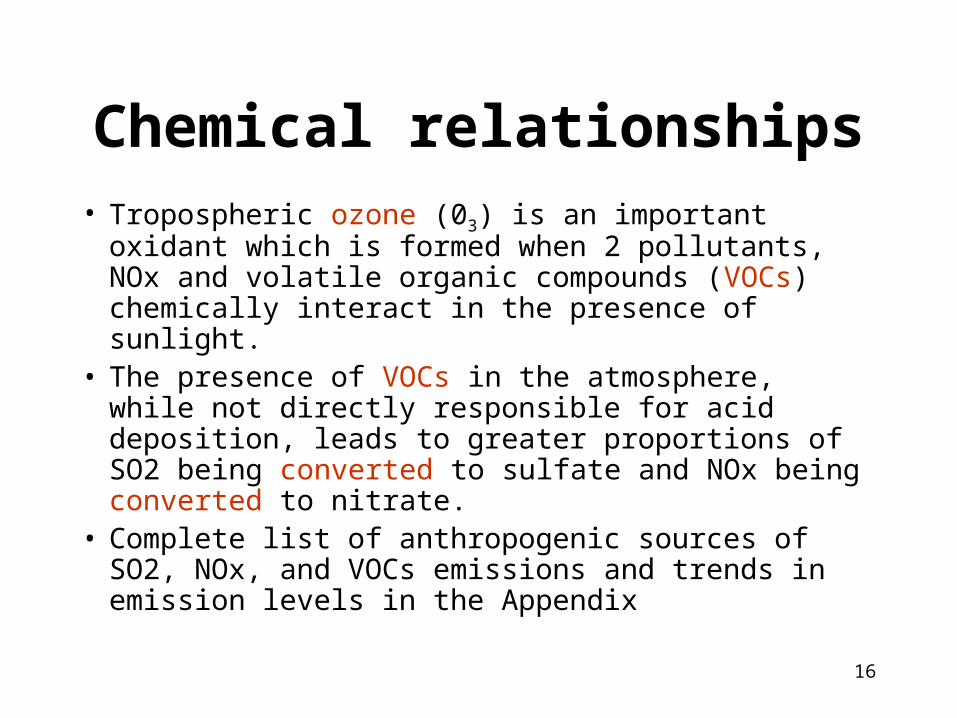
Chemical relationships• Tropospheric ozone (03) is an important oxidant which
is formed when 2 pollutants, NOx and volatile organic compounds (VOCs) chemically interact in the presence of sunlight.
• The presence of VOCs in the atmosphere, while not directly responsible for acid deposition, leads to greater proportions of SO2 being converted to sulfate and NOx being converted to nitrate.
• Complete list of anthropogenic sources of SO2, NOx, and VOCs emissions and trends in emission levels in the Appendix
17
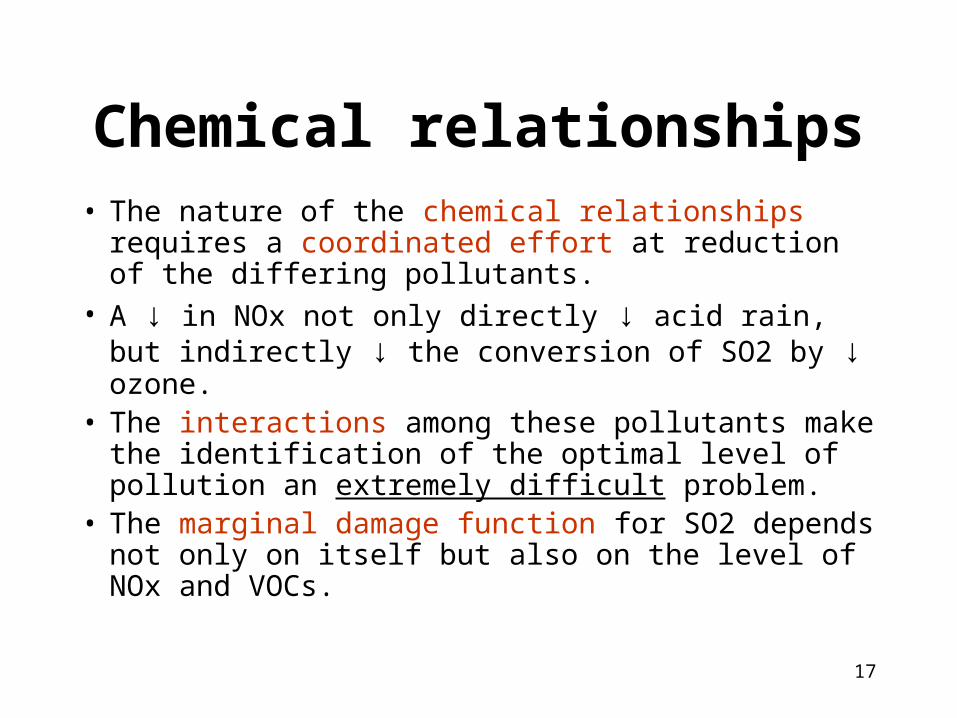
Chemical relationships• The nature of the chemical relationships requires a
coordinated effort at reduction of the differing pollutants.
• A ↓ in NOx not only directly ↓ acid rain, but indirectly ↓ the conversion of SO2 by ↓ ozone.
• The interactions among these pollutants make the identification of the optimal level of pollution an extremely difficult problem.
• The marginal damage function for SO2 depends not only on itself but also on the level of NOx and VOCs.
18
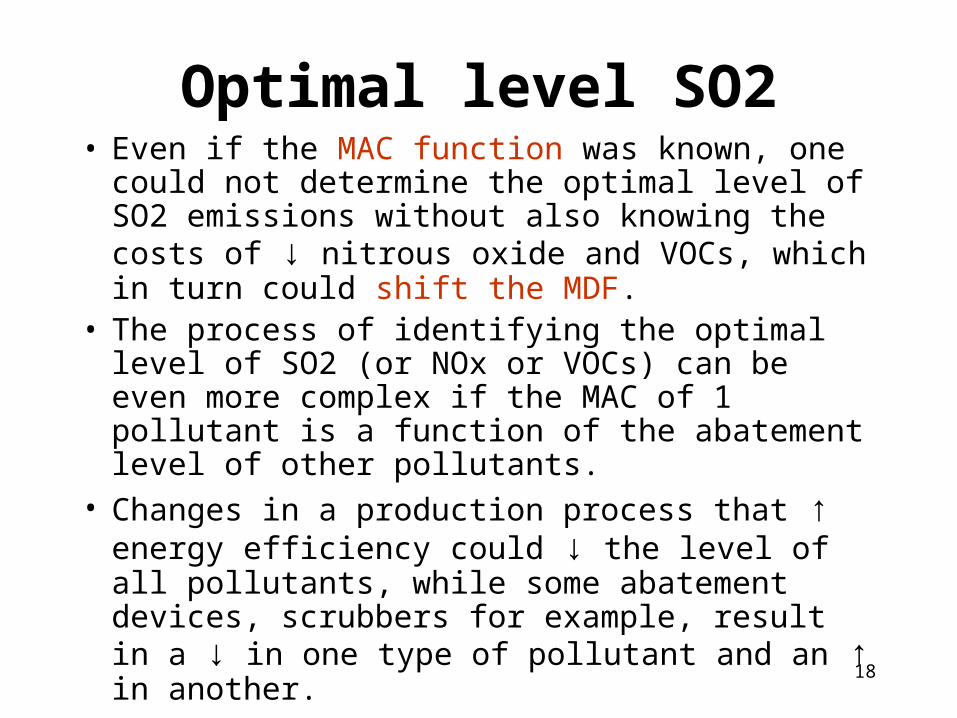
Optimal level SO2• Even if the MAC function was known, one could
not determine the optimal level of SO2 emissions without also knowing the costs of ↓ nitrous oxide and VOCs, which in turn could shift the MDF.
• The process of identifying the optimal level of SO2 (or NOx or VOCs) can be even more complex if the MAC of 1 pollutant is a function of the abatement level of other pollutants.
• Changes in a production process that ↑ energy efficiency could ↓ the level of all pollutants, while some abatement devices, scrubbers for example, result in a ↓ in one type of pollutant and an ↑ in another.
19
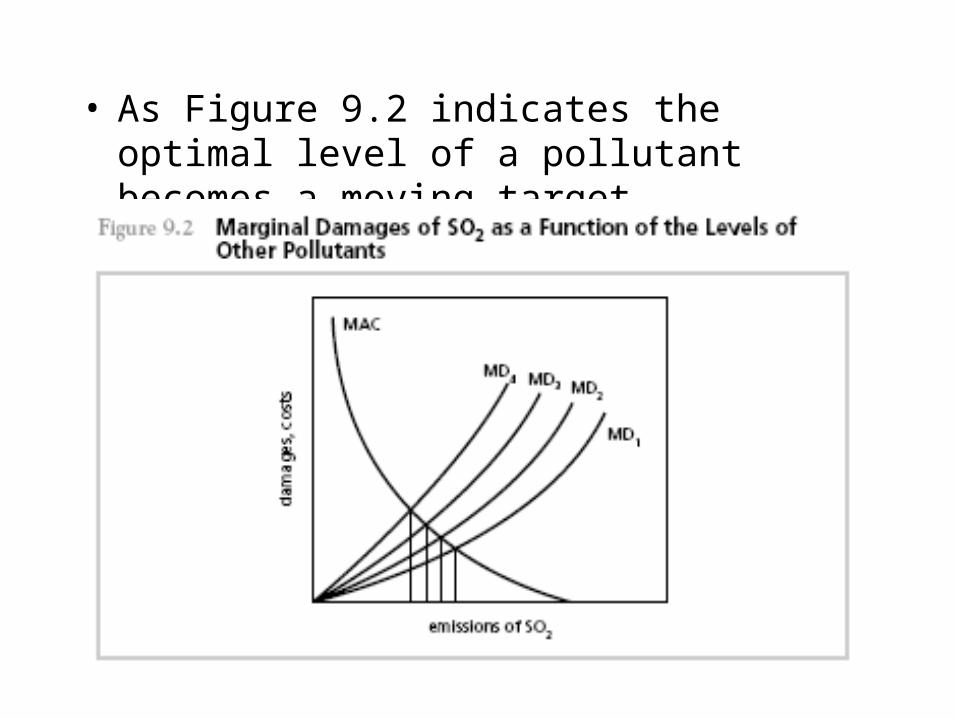
• As Figure 9.2 indicates the optimal level of a pollutant becomes a moving target.
20
Optimal level SO2, NOx, VOCs
• Since the optimal level of each of the 3 pollutants cannot be determined independently of each other, the level of emissions of each must be chosen to minimize the sum of the total abatement costs + total damages associated with all 3 pollutants.
• Requires what? • That the marginal damages of each pollutant =
marginal abatement costs of each pollutant.
21
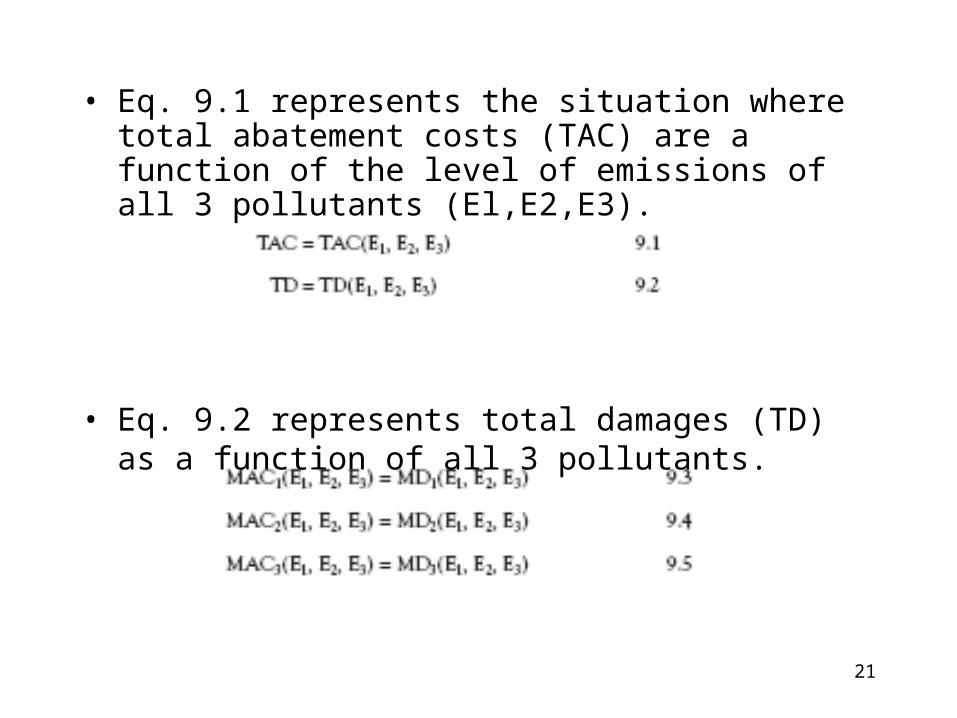
• Eq. 9.1 represents the situation where total abatement costs (TAC) are a function of the level of emissions of all 3 pollutants (El,E2,E3).
• Eq. 9.2 represents total damages (TD) as a function of all 3 pollutants.
• Equations 9.3 – 9.5 must be solved simultaneously to determine the optimal output level of each pollutant.
22
Consequences of Acid Deposition• Acid deposition and related pollutants have many
significant impacts on natural systems and human systems.
• These include acidification of surface water and detrimental effects on high elevation coniferous forests.
• SO2, sulfate particles, and acid aerosols are all suspected of having detrimental effects on human health.
23
Consequences of Acid Deposition
• Ozone, caused by the emission of NOx, has harmful effects on both vegetation and humans.
• The particles that generate acid deposition also serve to scatter light, creating a “pollution haze” and reducing visibility.
• Leads to the premature weathering and degradation of materials used in buildings, monuments, fences, and other structures.
24
Pre-1990 Acid Deposition Policy
• The pre-1990 Acid Deposition Policy focused primarily on the establishment of cause and effect relationships.
• Because of large scientific uncertainty assoc. with acid dep., Reagan administration's policy required that more information be developed before implementing any reductions in emissions of SO2 and NOx.
• Insufficient evidence of cause and effect• But, SO2 and NOx are “criteria pollutants” that are
regulated under the 1972 Clean Air Act and the 1977 Clean Air Act Amendments.
25
Local effects
• Only focused on local effects of SO2 and NOx • The fact that these regulations focus on local
effects of emissions may have exacerbated the problem.
• One way in which a local polluter can minimize the local effect of pollution emissions is to build a tall smokestack which injects pollutants into higher wind currents which carry these pollutants into other areas.
• These tall smokestacks were, to a large extent, responsible for the sulfur component of the acid deposition problem.
26
Who should pay?
• Important component to acid deposition policy – who pays for environmental improvement (regional nature)
• Political problems associated with developing legislation benefiting 1 region at expense of another
• Creation of the 1990 Clean Air Act Amendments (CAAA) – packaged several environmental problems within the same pieces of legislation – address the acid rain, ozone and carbon monoxide, pollution from cars and trucks, air toxins, and stratospheric and global climate protection.
27
Acid Deposition Policy and the 1990 Clean Air Act
• Acid deposition is dealt with in Title IV of the 1990 CAAA, which specifies a 10 million ton ↓ in annual SO2 emissions to be achieved by the year 2000.
• An interesting aspect of Title IV of the 1990 CAAA is that it represents the first attempt by the federal government to implement a system of marketable pollution permits.
28
MPPs & the 1990 Clean Air Act
• Economists applauded the incorporation of marketable permits as an important step in improving the efficiency of environmental regulations.
• The primary criticism against the permits was that there is no attempt to make geographic distinctions associated with the location of emission of SO2.
• The 1st trade to occur was between a Wisconsin utility and the Tennessee Valley Authority (TVA).
29
MPPs & the 1990 Clean Air Act
• The sale of allowances from Wisconsin to Tennessee resulted in less pollution by the Wisconsin utility and more by TVA.
• The cost of ↓ pollution by the amount of the traded allowances must be < the price of the allowances, or the Wisconsin utility would not have agreed to the sale.
• Similarly, the savings in the abatement costs for TVA must be > the cost of the permits.
• Both companies gained, and total cost ↓
30
Regulations on Mobile Sources of Pollution
• The primary regulation on mobile sources of pollution is specifying abatement control devices for vehicles.
• All automobiles are required to employ a catalytic converter.
• Platinum in the converter serves as a catalyst that lowers the ignition temperature of many of the unburned hydrocarbons and other pollutants in gasoline.

31
Regulations on Mobile Sources of Pollution
• Problem with this C & C regulation is that it controls all areas of the country in the same fashion, regardless of impact of an additional units of emission.
• Additionally, it does not provide incentives to reduce pollution by driving less, maintaining their cars, or choosing an alternative vehicle or mode of transportation.
32
Regulations on Mobile Sources of Pollution
• Air pollution from automobiles is also indirectly controlled by Corporate Automobile Fuel Efficiency (CAFE) standards, which specify the average miles per gallon that must be achieved by each automobile manufactured, where a higher MPG means less gasoline burned per mile which means less emission.
• This standard does not reduce the number of miles driven and may actually induce greater mileage (more efficient cars cheaper to drive).
33
Regulations on Mobile Sources of Pollution
• Mills and White (1978) suggest alternative policy which would tax cars based on the total amount of pollution that they generate each year.
• An annual diagnostic test would determine the emissions/mile and this multiplied by the odometer reading would give annual emissions.
• A combination of federal, state taxes could be used to account for regional difference in ambient air quality.
• This would create incentives to drive less, live closer to work, and develop lower polluting automobiles.
34
Energy Policy and the Environment
• US Presidential Administrations have integrated environmental policy and energy policies usually with 2 major goals:
1. Increase domestic supplies of energy and reduce dependence on foreign oil.
2. Promote a cleaner environment by requiring energy users to utilize cleaner technologies.
• These policies have had a mixed record of success.
35
True social cost of energy
• One dominant factor in the failure of US energy/environmental policy is that it fails to allow the cost of energy, particularly imported petroleum, to reflect its true social cost.
• This cost has 2 components:
1. The social cost of dependence on insecure imports of petroleum.
2. The environmental cost of energy use.
36
True social cost of energy
• Energy policy has traditionally been designed to keep energy costs low.
• A higher cost associated with energy use would result in – the development of alternatives to fossil fuels– ↓ in the amount of pollution per unit of energy
used– ↓ in energy use– the development of more energy efficient
technologies – ↓ in oil imports
37
True social cost of energy
• There is a fundamental disparity between the private cost of energy use and the social costs associated with its use.
• There are a variety of ways to eliminate this disparity.
• The least costly would be a comprehensive series of MPPs or a system of per unit pollution taxes (incentives)
38
To eliminate disparity
• A combination of both permits for large stationary polluters; taxes for mobile/small stationary sources may be best (transactions costs too high for small sources to enter permit system).
• Externalities in the production of energy could be addressed with liability and bonding systems (oil spills, risky projects)
39
Fuel taxes
• To implement MPP or emission tax system, need good monitoring – often difficult
• Fuel taxes may be a 2nd best solution to pollution taxes or permits.
• A tax added to the price of fuel based on the average amount of pollution of the fuel would provide an incentive to burn less fuel and encourage energy efficiency.
• For example, the per BTU unit tax on coal > oil > natural gas
40
Lack of progress
• The importance of increasing the price of fuel can be seen both in pollution problems arising from energy use and the lack of progress in developing alternative energy sources.
• Alternative sources of energy include solar power, geothermal power, wind power, and liquid fuel from renewable sources such as ethanol and methanol from a variety of plant sources.
41
Lack of progress
• While alternative sources of energy are generally less polluting than fossil fuels, alternative energy technologies are more expensive for energy users than coal or oil, so they have not become established as important sources of energy.
• Alternative fuels and energy technologies would be significantly advanced if the price of fossil fuels rose to incorporate the full social cost of these fuels as illustrated in Figure 9.6.

42
43
Market solution vs. social optimum
• The MPC curve for all fuels is constructed by horizontally summing the MPC curve for alternative fuels and the MPC curve for oil.
• The market equilibrium is tl where total fuel MPC = market demand curve.
• The social optimum, t2 occurs at a lower output where total MSC = market demand.
44
Market solution vs. social optimum
• If MPC oil was ↑ through tax, then MPC for oil could ↑ to be = MSC oil, generating market equilibrium t2
• This solution associated with higher price (p2), and oil use declines from o1 to o2, alternatives increase from a1 to a2.
• At this lower output level, oil usage ↓ and alternative fuel use ↑.
45
The Macroeconomic Impact of Fuel Taxes
• Are low energy prices a requirement for U.S. economic success?
• Table 9.3 lists gasoline prices in US dollars (current, not inflation adjusted) per liter for selected developed countries.
• It is clear that other economies with higher energy prices (based on higher taxes) have strong and growing economies.

46
47
The Macroeconomic Impact of Fuel Taxes
• One of the reasons for the undesirable macroeconomic impact of high prices in the 1970s was the fact that the price change was so sudden.
• This suggests that implementing increased gas taxes over time will not hurt the economy and will allow consumers and producers to incorporate the higher prices into their future plans.
48
The Macroeconomic Impact of Fuel Taxes
• If taxes are efficiently utilized, the tax revenue generated could be used to reduce taxes in other areas of the economy, for example, income taxes.
• This reduction in income taxes could lead to greater productivity which would offset, at least partially, the negative impact of fuel taxes.
• A pollution tax, system of MPPs, or fuel taxes will cause less of a negative impact on the macroeconomy than a corresponding increase in the prices from OPEC monopoly power.
49
Transition Fuels and the Future of Fuels
• Many people believe that sometime in the future there will be radically different sources of energy.
• The question is “How do we get from the present time to the time when these innovations in energy are available, or what should be our transition fuel?”
• The mechanism which will move the economy from one fuel to another is rising prices in the market.
50
Transition Fuels and the Future of Fuels
• Assume 3 possible fuels: oil, coal, solar• Oil, coal: ↑ MEC, solar: HIGH constant MEC• Oil used first (cheapest)• As the MEC of oil ↑ relative to the MEC of coal,
the opportunity cost (marginal user cost) of using oil ↓.
• The transition point to a new fuel is when total marginal cost of oil (MEC+MUC) is equal to total marginal cost of coal.

51
Figure. 9.7. - Fuel Transition
52
Transition Fuels and the Future of Fuels
• Policy makers have been concerned with managing the transition from 1 source to another.
• One concern is that the market will not adequately spur research and development into new technologies.
• Another is the continued policy of abundant, cheap energy at a low price.
• A more recent concern is that if environmental externalities are not reflected in the market price, then transition to cleaner fuels will occur later than socially optimal.
53
Transition Fuels
• The Carter administration adopted a policy that defined coal as a transition fuel but concerns about high levels of pollution from burning coal changed this choice.
• Viewed as the cleanest of fossil fuels, another possibility is deep natural gas, which is 1000s of feet deeper and more expensive than conventional gas.
• However, if all fuels included all social costs in their prices, then the market would pick the fuel with the lowest social cost as the transition fuel.
54
Energy and the Third World• The real energy crisis is in the Third World nations,
where the economies are much less capable of adjusting to price shocks associated with oil price increases.
• Often Third World countries have to use much needed foreign reserves to purchase oil which leads to borrowing for development projects.
• The ↑ in the price of fossil fuels has forced a greater reliance on fuel wood which has contributed to a growing rate of deforestation.
• Environmental externalities from energy use have also contributed to poor environmental quality.
55
Summary
• Although the Clean Air Act and other legislation in the US has had some impact in reducing the negative consequences of energy use, much progress needs to be made.
• Internalizing the external cost of emissions and national security externalities through permits and taxes will generate a series of reactions which lead to higher social welfare.