1 patterns of international mobility of researchers: evidence from the globsci survey chiara...
TRANSCRIPT

1
Patterns of international mobility of researchers: evidence from the GlobSci survey
Chiara FranzoniPolitecnico di Milano
Giuseppe ScellatoPolitecnico di Torino
Paula StephanGeorgia State University and NBER

2
The GLOBAL SCIENCE PROJECT
Study of the impacts of globalisation of scientific research on the performance of national scientific systems, with a focus on science policies (co-funded by Italian government and the NBER, 2009-2012).
A. Analysis of trends in the relative performance in top-tier research by different countries during the past 10 years and the related impact of national incentive policies.
Franzoni et al. (2011) Science
B. Collection of new comprehensive data on the international mobility of scientific researchers. Analysis of the determinants of migration and related impacts on both source and destination countries.
Franzoni et al. (2012) WP NBER 18067

3
Motivations
US data stress the relevance of the mobility phenomenon:
• 41.6 percent of those with doctorates working in a science and engineering occupation in 2009 were born outside the United States.
• Almost 60 percent of all postdocs working in the United States are on a temporary visa.
However, still limited comparable evidence for European countries and for other countries (e.g. Brasil, India). The brain-drain debate in some countries has been based mostly on anecdotal evidence.
• MORE project (2010) funded by the EU commission
• OECD data (2010)
Most of academic analyses investigate (using different tools: survey, census data, visa data, CV analysis, bibliometric data) only specific groups of scientists / disciplines or countries.
The dynamics of international mobility of scientific researchers might differ from the ones investigated in the field of international economics for high-skilled migration.

4
OBJECTIVES of the paper
Provide updated comparable statistics about the inflows and outflows of scientific researchers for a large sample of countries.
Identify main mobility patterns between countries.
Study whether mobility has an effect on the international openness of the scientific systems of the destination countries.
• Measured by comparing the propensity to be involved in international collaborations of foreign born, returnees and native non mobile academic researchers.
• Exploiting detailed individual data from the GlobSci survey.

5
THE GLOBSCI SURVEY (I)
4 Fields: Biology, Chemistry, Earth and Environmental sciences, and Materials.
16 Countries: Australia, Belgium, Brazil, Canada, Denmark, France, Germany, Italy, India, Japan, Netherlands, Spain, Sweden, Switzerland, UK, USA
7 option languages (multiple branches web survey using Qualtrics ®)
Selection of panels: based on corresponding authors of articles published in international journals in 2009 (selected by quartile of impact factor in WoS subfields)
Distribution period: march – july 2011
Number of questionnaires collected: 19,183
Aggregated response rate: 40.6% (downward biased due to possible non-delivery)
6
THE GLOBSCI SURVEY (II)
The questionnaire collects 4 layers of data:
A. Data about the respondent background (education, job condition, age etc.)
B. Data about the mobility (country at age 18, current country, international experience in the past, reasons for moving, reason for going back, likelihood to go back in the future)
C. Data on the specific article through which the respondent has been admitted in the sample (type of research, characteristics of the co-authors).
D. Data on the research network of the respondent (e.g. number of collaborating countries, propensity to collaborate).

7
THE GLOBSCI SURVEY (III)
Main advantages:
A. Possibility to track also foreign born researchers that went back to the origin country (if included in 16 core countries).
B. Data on the “entry point” of foreign born (e.g. PhD, post doc, faculty)
C. Numerous individual level controls
Limitations:
A. Problems encountered in fielding the survey in China.
B. The questionnaire provides a snapshot in 2011.
C. Statistics reflect outbound mobility towards the 16 countries

8
THE GLOBSCI SURVEY (IV)
Sample size and response rates by country of residence in 2011.
Country AnswersResp. Rate Country Answers
Resp. Rate
Australia 676 43.00% Japan 1,860 35.40%
Belgium 302 42.80%
Netherlands 391 37.70%
Brazil 762 49.60% Spain 1,228 53.30%
Canada 1,020 41.50% Sweden 353 40.00%
Denmark 227 44.20%
Switzerland 356 38.70%
France 1,618 42.10% UK 1,355 36.70%
Germany 1,326 30.30% U.S. 5,165 36.70%
Italy 1,917 69.00% Total 19,183 40.60%

9
Selected evidence on mobility (I)
Incidence of foreign born researchers by country of residence in 2011
IndiaItaly
JapanBrazilSpain
FranceBelgium
DenmarkGermany
NetherlandsUK
SwedenUSA
AustraliaCanada
Switzerland
0 10 20 30 40 50 60

10
Selected evidence on mobility (II)
Incidence of researchers abroad in 2011 by country of origin
JapanUSA
BrazilSpain
FranceDenmarkSweden
ItalyAustraliaBelgium
GermanyCanada
UKNetherlandsSwitzerland
India
0 5 10 15 20 25 30 35 40 45

11
Selected evidence on mobility (II)
Countries supplying 10% or more of foreign workforce
Destination country Supplying countries (%)
Australia UK (21.1) China (12.5)
Belgium Germany (15.2) France (15.2) Italy (13.0)
Brazil Argentina (16.0) France (14.0) Colombia (12.0) Peru (12.0)
Canada UK (13.5) U.S (13.5) China (10.9)
Denmark Germany (24.4)
France Italy (13.8)
Germany None
Italy France (13.0) Germany (11.1) Spain (11.1)
Japan China (33.7) South Korea (11.6)
Netherlands Germany (14.6) Italy (12.5)
Spain Argentina (12.6) France (10.3) Italy (10.3)
Sweden Germany (11.9) Russian Fed. (10.2)
Switzerland Germany (36.9)
UK Germany (15.2) Italy (10.4)
U.S. China (16.9) India (12.3)

12
THE LINK BETWEEN MOBILITY AND INTERNATIONAL RESEARCH NETWORK
Each respondent has been classified based on his mobility status as:
1. Foreign-born: 24.3% of the full sample
2. Returnee (after a PhD or post-doc or employment abroad): 29.7%
3. Non-mobile: 46.0%
For the sake of homogeneity we focus only on academic researchers.
International network is measured through 2 approaches:
1. Whether the selected article is internationally co-authored.
2. The number of countries in which were located the co-authors of the respondent in the last 2 years (from the survey).

13
THE LINK BETWEEN MOBILITY AND INTERNATIONAL RESEARCH NETWORK
Dependent variables:
International paper
Large network (number of collaborating countries >4 )
Independent variables:
Mobility status
Age, gender, institution type, current country dummies, field dummies
Self-assessed relevance of the paper in the scientific production of the author
Team size

14
THE LINK BETWEEN MOBILITY AND INTERNATIONAL RESEARCH NETWORK
Econometric models:
Probit models on the measures of international openness of research networks
OLS models on the quality of international co-authored papers proxied by the impact factor.
The international collaboration propensity of foreign born and returnees are tested against a baseline represented, in each country, by native non mobile researchers
Robustness checks:
1. Models run for subsets of destination countries (USA, EU, Other)
2. Control for the country in which foreign born received their PhD.

15
THE LINK BETWEEN MOBILITY AND INTERNATIONAL RESEARCH NETWORK
Incidence of internationally co-authored papers by scientific field and mobility status of respondent.
All fields Biology Chemistry Earth Material
Full sample 23.94% 25.30% 23.61% 33.17% 22.82%
Foreign born 33.59% 30.52% 31.66% 42.68% 30.01%
Returnees 29.12% 28.85% 26.38% 43.23% 24.18%
Non mobile 20.26% 20.41% 17.88% 24.74% 18.15%

16
THE LINK BETWEEN MOBILITY AND INTERNATIONAL RESEARCH NETWORK
Incidence of number of countries with which the scientist reported having one or more collaborations in past two years.
Foreign born Returnees Non MobileNo international collaborations 14.06 14.26 24.36
1 country 17.59 17.28 19.91
2 countries 20.98 20.17 18.92
3 countries 15.89 16.45 13.73
4 countries 10.66 10.40 7.37
5 countries 6.90 7.68 5.12
6 to 10 countries 11.23 11.09 8.38
11 or more other countries 2.69 2.68 2.22

17
THE LINK BETWEEN MOBILITY AND INTERNATIONAL RESEARCH NETWORK
The perceived impact of international mobility (1-5 scale)
Returnees Foreign born
Enlarging my research network 4.19 4.35
Establishing a stable research cooperation with teams/scholars located abroad 3.71 4.02
Entering into new fields of research 3.9 4.08
Learning new techniques/ theories 4.12 4.17
Improving my capability to publish in high-tiers journals 3.68 3.93
Improving my wage and earning possibilities 2.72 3.41
Improving my career prospects 3.89 4.08
Establishing better contacts with industrial partners 2.15 2.67Improving my ability to raise research funds 3.16 3.65
18
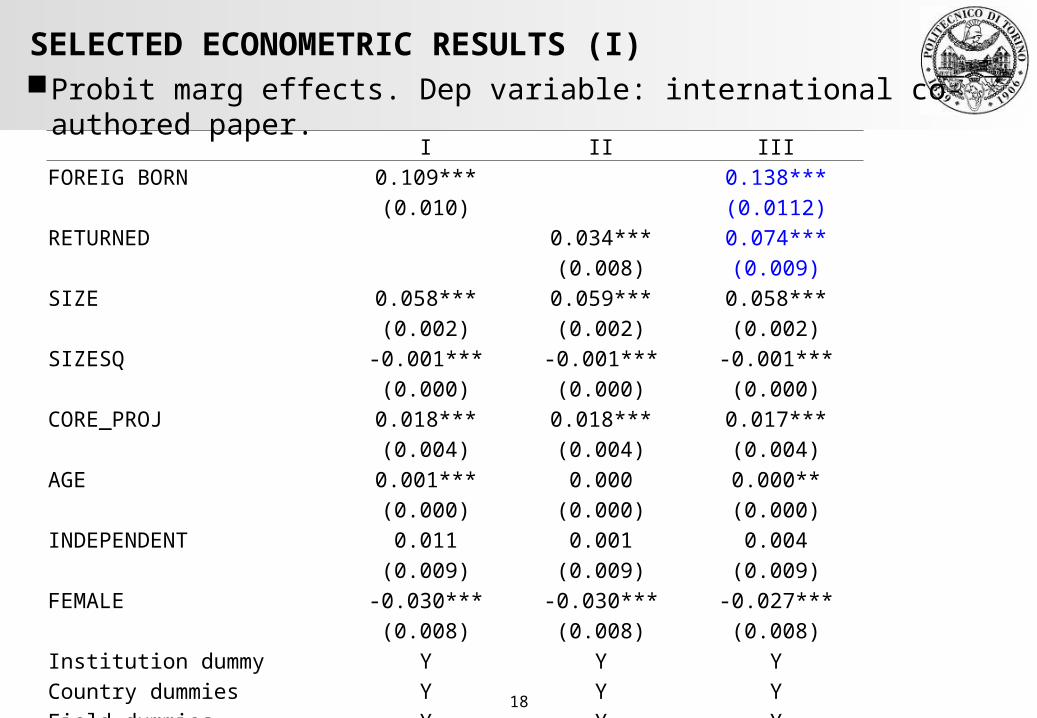
SELECTED ECONOMETRIC RESULTS (I)Probit marg effects. Dep variable: international co-authored paper.
I II IIIFOREIG BORN 0.109*** 0.138***
(0.010) (0.0112)RETURNED 0.034*** 0.074***
(0.008) (0.009)SIZE 0.058*** 0.059*** 0.058***
(0.002) (0.002) (0.002)SIZESQ -0.001*** -0.001*** -0.001***
(0.000) (0.000) (0.000)CORE_PROJ 0.018*** 0.018*** 0.017***
(0.004) (0.004) (0.004)AGE 0.001*** 0.000 0.000**
(0.000) (0.000) (0.000)INDEPENDENT 0.011 0.001 0.004
(0.009) (0.009) (0.009)FEMALE -0.030*** -0.030*** -0.027***
(0.008) (0.008) (0.008)Institution dummy Y Y YCountry dummies Y Y YField dummies Y Y YPseudo Rsq 0.1051 0.0986 0.109

19
SELECTED ECONOMETRIC RESULTS (II)Probit marginal effects. Dep variable: large international network.
I II III
FOREIGN BORN 0.063*** 0.084***
(0.009) (0.010)
RETURNED 0.0291*** 0.054***
(0.008) (0.009)
AGE 0.002*** 0.002*** 0.007***
(0.000) (0.000) (0.000)
INDEPENDENT 0.096*** 0.090*** 0.091***
(0.009) (0.009) (0.009)
FEMALE -0.0651*** -0.0641*** -0.062***
(0.008) (0.008) (0.008)
Institution dummy Y Y Y
Country dummies Y Y Y
Field dummies Y Y Y
Pseudo Rsq 0.106 0.104 0.108

20
SELECTED ECONOMETRIC RESULTS (III)
OLS model. Dep var: impact factor (only intern. co-authored papers)
I II IIIFOREIG BORN 0.280** 0.563***
(0.130) (0.142)RETURNED 0.414*** 0.632***
(0.120) (0.132)SIZE 0.335*** 0.335*** 0.337***
(0.034) (0.033) (0.033)SIZESQ -0.005*** -0.005*** -0.005***
(0.001) (0.001) (0.001)CORE_PROJ 0.408*** 0.414*** 0.402***
(0.062) (0.062) (0.062)AGE 0.107*** 0.101** 0.096**
(0.040) (0.040) (0.040)AGESQ -0.001*** -0.001*** -0.001***
(0.000) (0.000) (0.000)INDEPENDENT 0.683*** 0.622*** 0.630***
(0.146) (0.146) (0.146)FEMALE -0.345*** -0.328** -0.319**
(0.130) (0.130) (0.130)Constant -2.829** -2.819** -2.905**
(1.132) (1.131) (1.129)
Observations 3,670 3,670 3,670Adj. R-sq 0.184 0.186 0.189

21
SELECTED ECONOMETRIC RESULTS (IV)
Testing the moderating effect of PhD in the destination country.
large network international paper impact factorFOREIG BORN 0.086*** 0.120*** 0.413***
(0.012) (0.012) (0.151)Entered as PhD -0.049*** -0.024* -0.359*
(0.014) (0.014) (0.207)SIZE 0.058*** 0.334***
(0.002) (0.034)SIZESQ -0.001*** -0.005***
(0.000) (0.001)CORE_PROJ 0.018*** 0.410***
(0.004) (0.062)AGE 0.002*** 0.001*** 0.106***
(0.000) (0.000) (0.040)AGESQ -0.001***
(0.000)INDEPENDENT 0.095*** 0.011 0.676***
(0.009) (0.009) (0.146)FEMALE -0.065*** -0.031*** -0.347***
(0.008) (0.008) (0.130)Adj. R-squared 0.185Pseudo R-sq 0.107 0.105

22
LINKS WITH THE ORIGIN COUNTRY? (I)
Incidence of foreign born researchers that report collaboration with other researchers based in their country of origin.
Current country (%)
Australia 46.1
Belgium 55.6
Brazil 29.3
Canada 35.8
Denmark 33.3
France 57.7
Germany 39.0

23
LINKS WITH THE ORIGIN COUNTRY? (II)
Incidence of foreign born researchers that report collaboration with other researchers based in their country of origin.
Current country (%)
Italy 56.8
Japan 43.5
Netherlands 53.4
Spain 38.0
Sweden 56.7
Switzerland 50.3
UK 44.0
USA 37.4
TOT 41.7

24
EXPAT COMMUNITY EFFECT? (I)
Incidence of scientific collaboration within the same lab / department between foreign born researchers and other researchers from the same origin country that have emigrated.
Current country Incidence
Australia 34.05%
Belgium 40.00%
Brazil 31.71%
Canada 25.83%
Denmark 43.33%
France 32.34%
Germany 32.86%

25
EXPAT COMMUNITY EFFECT? (II)
Incidence of scientific collaboration within the same lab / department between foreign born researchers and other researchers from the same origin country that have emigrated.
Current country IncidenceItaly 27.27%Japan 37.10%Netherlands 26.03%Spain 45.07%Sweden 24.44%Switzerland 44.17%UK 26.24%USA 23.91%
TOT 28.25%
26
RESULTS (I)
More than 40% of the researchers sampled in the four fields in Switzerland, Canada and Australia are immigrants.
Different patterns across European countries, with a considerable share of foreign born researchers also in Netherlands, Germany and Sweden.
On average about 40% of foreign-born scientists in our sample reports having kept research links with their country of origin.
All else equal, being foreign born increases the likelihood of having an international collaboration by 13.8 percentage and being a native with experience of work or study abroad increases the likelihood by 7.4 percentage points.
On average international co-authored papers with a mobile corresponding author show a higher impact factor.

27
RESULTS (II)
“foreigner premium” on collaboration propensity and research quality is driven mostly by mobile researchers who have training or work experience outside of the destination country where they were surveyed in 2011.
Returnees and foreign born researchers tend to assign the highest reason related to mobility to issues such as “enlarging my research network” and “learning new techniques / theories” high-skilled migration patterns – at least in the specific case of scientific careers - cannot be fully captured by underlying theoretical models that predict mobility primarily on the basis of wage differentials.

28
LIMITATIONS AND WORK AHEAD
Given the structure of the data we can assess correlations and not strict causality.
Qualify the structure of international collaborations (based on the sampled paper).
Qualify the mobility status (e.g. mobility supported by a fellowship).
Develop instruments to controls also for the self-selection of migrating researchers.