1 pharmacokinetics, metabolism and excretion of torcetrapib, a cetp inhibitor, in humans
TRANSCRIPT
DMD # 23176
1
Pharmacokinetics, Metabolism and Excretion of Torcetrapib, a CETP Inhibitor, in
Humans
Deepak Dalvie, Weichao Chen1, Chenghong Zhang2, Alfin D. Vaz, Teresa A. Smolarek,
Loretta M. Cox, Jian Lin and R.Scott Obach
Pharmacokinetics, Dynamics and Metabolism, Pfizer Global Research and
Development, San Diego, CA 92121 (DD) and Eastern Point Road, Groton CT 06340
(WC, CZ, ADV, LMC, JL, TAS and RSO).
DMD Fast Forward. Published on August 11, 2008 as doi:10.1124/dmd.108.023176
Copyright 2008 by the American Society for Pharmacology and Experimental Therapeutics.
This article has not been copyedited and formatted. The final version may differ from this version.DMD Fast Forward. Published on August 11, 2008 as DOI: 10.1124/dmd.108.023176
at ASPE
T Journals on D
ecember 22, 2018
dmd.aspetjournals.org
Dow
nloaded from
DMD # 23176
2
Running Title: Metabolism and Disposition of Torcetrapib in Humans
Correspondence should be addressed to:
Deepak Dalvie Ph. D.
10724, Science Center Drive
San Diego CA. 92121
Tel. (858) 622-8016
E-mail [email protected]
Text pages: 48
Tables: 6
Figures: 6
Schemes: 5
References: 19
Words in Abstract: 227
Words in Introduction: 489
Words in Discussion: 1270
Abbreviations:
CETP, Human cholesteryl ester transfer protein; HDL, high density lipoprotein; VLDL,
Very low density lipoprotein; LDL, Low density lipoprotein; WBAL, whole body
autoradioluminography, MTBE; Methyl-tert butyl ether.
This article has not been copyedited and formatted. The final version may differ from this version.DMD Fast Forward. Published on August 11, 2008 as DOI: 10.1124/dmd.108.023176
at ASPE
T Journals on D
ecember 22, 2018
dmd.aspetjournals.org
Dow
nloaded from
DMD # 23176
3
Abstract
The pharmacokinetics, metabolism and excretion of torcetrapib, a selective inhibitor of
human cholesteryl ester transfer protein (CETP), was investigated in healthy human
male volunteers following oral administration of [14C]torcetrapib (120 mg dose). The
total mean recovery of radiolabeled dose after 21 days was 75.7% and most of the dose
(63%) was excreted in the urine. The total circulating radioactivity and unchanged
torcetrapib plasma concentrations increased over the first six hours then declined slowly
with mean terminal elimination half-lives of 373 and 211 h. Metabolism of torcetrapib
was extensive in humans. Only 5.2% of the total dose constituted unchanged
torcetrapib in the feces while no parent was excreted unchanged in the urine. Similarly,
pharmacokinetic analysis of total radioactivity and unchanged torcetrapib revealed that
the AUC0-∞ of torcetrapib accounted for ~7.0% of the circulating radioactivity.
Torcetrapib was metabolized to numerous metabolites via oxidation. The primary
metabolic pathway involved initial oxidative decarbamoylation followed by extensive
further oxidation resulting in the formation of bistrifluoromethylbenzoic acid (M1) and
quinaldic acid (M4) metabolites. A mean 40% of the total dose was excreted in the
urine as M4 (and its glucuronide and urea conjugates) whereas 7.0% of the total dose
was excreted as M1. In vitro studies using human subcellular fractions suggested that
initial metabolism of torcetrapib proceeds via CYP3A-mediated decarbamoylation.
Subsequent oxidations lead to the major circulating and excretory metabolites M1 and
M4.
This article has not been copyedited and formatted. The final version may differ from this version.DMD Fast Forward. Published on August 11, 2008 as DOI: 10.1124/dmd.108.023176
at ASPE
T Journals on D
ecember 22, 2018
dmd.aspetjournals.org
Dow
nloaded from
DMD # 23176
4
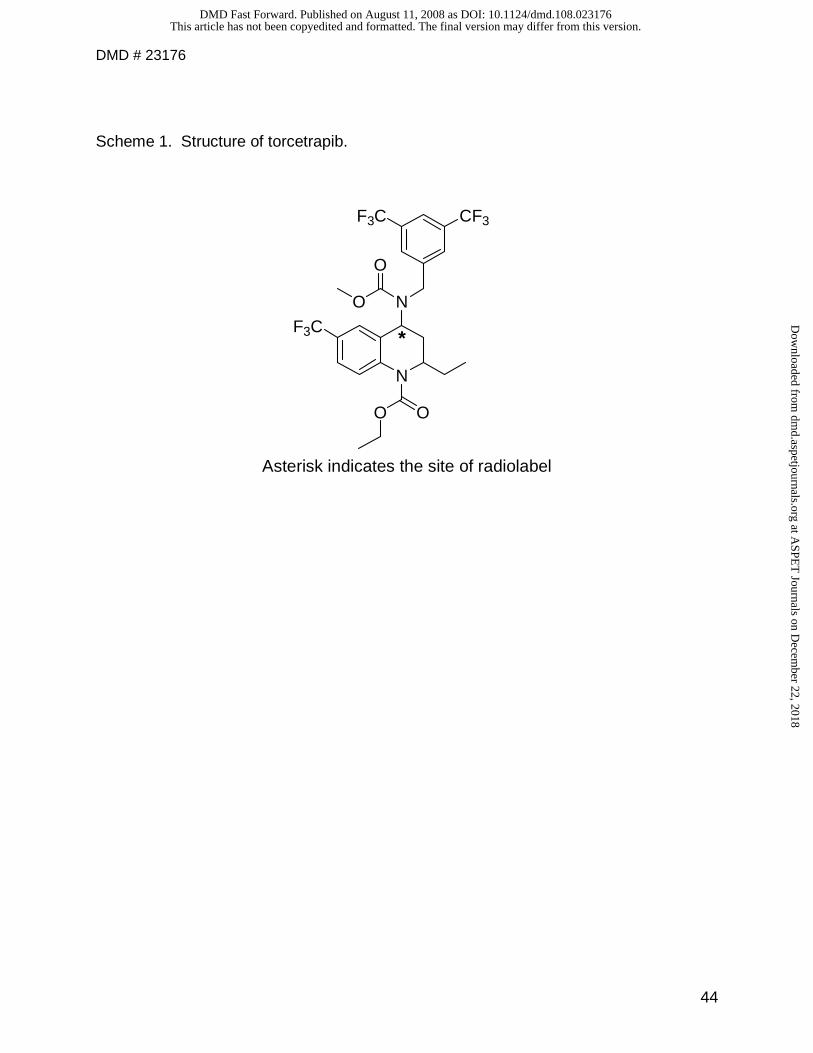
Torcetrapib {(–)-[2R,4S] 4-[(3,5-bis-trifluoromethylbenzyl)-methoxycarbonyl-amino]-2-
ethyl-6-trifluoromethyl-3,4-dihydro-2H-quinoline-1-carboxylic acid ethyl ester}, was being
developed to treat hypercholesterolemia (elevated cholesterol levels) and prevent
cardiovascular disease. It was withdrawn from development in 2006 when phase III
studies showed excessive mortality in the treatment group receiving a combination of
atorvastatin and the study drug (Howes and Kostner, 2007). Torcetrapib acts by
inhibiting human cholesteryl ester transfer protein (CETP), which normally transfers
cholesterol from HDL cholesterol to very low density or low density lipoproteins (VLDL
or LDL). Inhibition of this process results in higher HDL levels (the "good" cholesterol-
containing particle) and reduces LDL levels (the "bad" cholesterol) (Clark et. al. 2006).
Administration of torcetrapib alone or in combination with atorvastatin led to an increase
in HDL and decrease in LDL concentrations (Clark et. al., 2004; Brousseau et. al. ;
Mckenney et. al., 2006).
The pharmacokinetics of torcetrapib has been evaluated in the rat and monkey. The
results from these studies have indicated that the drug was moderately absorbed with a
bioavailability of 33 to 45% and readily distributed throughout the body (volume of
distribution is 1.1 to 2.5 L/kg). The clearance of torcetrapib in both the species was low
ranging from 6 to 12 mL/min/kg. Absorption, distribution, metabolism and excretion
studies with [14C]torcetrapib in the mouse, rat and monkey resulted in good recovery of
the radiolabeled dose in ranging from 74% in the monkey to 94% in the rat. Feces was
the major route of excretion in all species. The percentage of dose excreted as
unchanged torcetrapib in the mouse, rat and monkey is 34, 37 and 40% respectively
suggesting that torcetrapib was extensively metabolized in all three species and
This article has not been copyedited and formatted. The final version may differ from this version.DMD Fast Forward. Published on August 11, 2008 as DOI: 10.1124/dmd.108.023176
at ASPE
T Journals on D
ecember 22, 2018
dmd.aspetjournals.org
Dow
nloaded from
DMD # 23176
5
metabolism was the primary route of clearance. The primary metabolic pathway was
the oxidative cleavage of the drug to 6-trifluoromethylquinoline-2-carboxylic acid (M4)
and 3,5-bistrifluoromethylbenzoic acid (M1) (structures shown in Scheme 2). In vitro
studies in human, rat and monkey liver microsomes resulted in very low turnover of
torcetrapib. The primary metabolite identified in the microsomal incubation is the
decarbamoylated metabolite (M2).
The pharmacokinetics of torcetapib has also been evaluated in several Phase I and
Phase II clinical trials after a single and multiple dose. Administration of 10 to 1000 mg
of torcetrapib as a Miglyol 812 emulsion to groups of fasting, healthy male and healthy
females of non-child bearing potential resulted in a non-linear increase in maximum
plasma torcetrapib concentrations and areas under the concentrations-time curves
(AUC) with increase in dose. The mean terminal half-life of torcetrapib was estimated to
be 25 h in this study. Torcetrapib also showed greater exposure in volunteers that were
given a low or high fat meal compared to that in the fasted state. The objective of the
current study was to investigate the metabolism and excretion of torcetrapib in humans
following single oral administration of the [14C]torcetrapib (Scheme 1). An attempt was
also made to gain some mechanistic insight into the formation of the novel metabolite
M4 using in vitro systems.
This article has not been copyedited and formatted. The final version may differ from this version.DMD Fast Forward. Published on August 11, 2008 as DOI: 10.1124/dmd.108.023176
at ASPE
T Journals on D
ecember 22, 2018
dmd.aspetjournals.org
Dow
nloaded from
DMD # 23176
6
Methods and Materials
Reference Compounds, Radiolabel Torcetrapib and Chemicals. All synthetic
standards for the metabolites were synthesized at Pfizer Global Research and
Development (Groton, CT) using standard procedures (Dalvie and Ruggeri, 2005).
[14C]Torcetrapib was synthesized by the radiochemistry group at Pfizer Global Research
in Groton under GMP conditions and the label was located in the C-4 position of the
tetrahydroquinoline ring (Scheme 1). The purity of the radiolabeled material was >99%.
All reagents and solvents were of highest grade available and were obtained from
commercial sources. Ecolite (+) scintillation cocktail was obtained from ICN (Irvine,
CA). Carbosorb and Permafluor E+ scintillation cocktails were purchased from
PerkinElmer Life and Analytical Sciences (Boston, MA).
Study Design, Dosing and Sample Collection. This was an open-label, single dose
inpatient study conducted with six non-smoking healthy male human volunteers aged
between 18 to 55 years. Before the study started, an institutional review committee
approved the protocol and the informed consent document. All study participants gave
written informed consent prior to initiation of the study.
All volunteers were administered 120 mg of [14C]torcetrapib (92 µCi) in an emulsion of
Miglyol 812 and 0.1% aqueous Polysorbate 80. The specific activity of the dose was
0.77 µCi/mg. Urine was collected into containers surrounded by dry ice at predose (-8-
0), 0-12, 12-24 and at 24 hr intervals during the study through 504 hr post-dose (21
days). Feces was collected prior to dosing and then over 24 hr intervals up to 504 hr
post-dose (21 days). The total weight of the urine and feces was recorded after each
collection. Blood samples (sufficient to provide 6 ml of plasma) were collected for
This article has not been copyedited and formatted. The final version may differ from this version.DMD Fast Forward. Published on August 11, 2008 as DOI: 10.1124/dmd.108.023176
at ASPE
T Journals on D
ecember 22, 2018
dmd.aspetjournals.org
Dow
nloaded from
DMD # 23176
7
pharmacokinetic evaluation of total radioactivity, torcetrapib and metabolite M1 at times
0 (just prior to dosing) 0.5, 1, 2, 3, 4, 6, 8, 12, 24, 36, 48 and 24 h intervals through 504
hr post-dose. Additional blood sufficient to provide a minimum of 20 ml plasma was
collected at 1, 4, 8 and 12 h post dose for metabolite identification. Samples were
stored frozen until the day of analysis
Quantitation of Radioactivity. Radioactivity in the plasma, urine and feces was
determined by liquid scintillation counting. Aliquots of plasma (500 µL) and urine (100-
1000 µL) was counted in triplicate, by mixing with Ecolite (+) scintillation cocktail (6 mL
with 100 µL and 12 mL with 1000 µL) and counted in a Wallac 1409 liquid scintillation
counter (GE Healthcare, Chalfont St. Giles, Buckinghamshire, UK). For determination
of radioactivity in feces, the weight of each fecal sample was determined and the
samples were homogenized in 2 parts of deionized water using a Stomacher blender
400. Following homogenization, triplicate aliquots (250-500 µL) of each sample were
transferred into tared cones and pads, weighed and combusted in an automatic sample
PerkinElmer 308 oxidizer (PerkinElmer, Boston, MA). The resulting 14CO2 was trapped
in Carbo-Sorb (Packard Instruments, MA) and mixed with Perma-Fluor E+ (Packard
Instruments, MA) scintillation fluid and the radioactivity was quantified by liquid
scintillation counting. The combustion efficiency was determined daily, prior to
combustion of the study samples, using a carbon-14 standard. To prevent carry-over
during combustion, one blank cone and pad was placed in between each set of
samples. The measured radioactivity content in combusted samples was adjusted using
the combustion efficiency values. Samples were analyzed for radioactivity for 2 minutes
(5 minutes for plasma). Scintillation counter data were automatically corrected for
This article has not been copyedited and formatted. The final version may differ from this version.DMD Fast Forward. Published on August 11, 2008 as DOI: 10.1124/dmd.108.023176
at ASPE
T Journals on D
ecember 22, 2018
dmd.aspetjournals.org
Dow
nloaded from
DMD # 23176
8
counting efficiency using an external standardization technique and an instrument-
stored quench curve generated from a series of sealed quench standards. Radioactivity
less than twice the background value was considered to be below the limit of
determination. Samples collected prior to dosing were used as controls and counted to
obtain a background count rate.
The radioactivity in the plasma was expressed as ng-equiv. of torcetrapib/mL. The
compound equivalents were determined by dividing the µCi/g sample by the specific
activity of the compound (0.77 µCi/mg). Samples containing radioactivity (dpm) less
than or equal to twice the background were considered to be zero in the calculation of
the means. Radioactivity in the urine and feces was expressed as a percentage of the
administered dose per time interval.
Quantitation of Torcetrapib and Metabolite M1 in Human Plasma. The plasma
concentrations of torcetrapib and M1 were determined by GC/MS/MS method. The
analytical method consisted of a protein precipitation followed by liquid-liquid extraction
and chemical derivatization. Briefly, a 250 µL aliquot of each plasma sample was
treated with 50 µL solution of an internal standard that was structurally similar to
torcetrapib in which the ethyl carbamate was replaced with an isopropyl carbamate and
the 2-ethyl substituent was replaced with a cyclopropyl group) (0.500 µg/mL,
synthesized at Pfizer) and 2,4-bistrifluoromethylbenzoic acid an internal standard for M1
(1 µg/mL, Aldrich, St. Louis MO), vortexed and quenched with acetonitrile (1 mL). The
mixture was then centrifuged at 3500 rpm for approximately 10 min and the supernatant
was poured in a tubes containing 1.0 M potassium phosphate buffer (1 mL, pH 11) and
20 µL of 2,3,4,5,6-pentafluorobenzyl bromide solution in isopropyl alcohol and toluene
This article has not been copyedited and formatted. The final version may differ from this version.DMD Fast Forward. Published on August 11, 2008 as DOI: 10.1124/dmd.108.023176
at ASPE
T Journals on D
ecember 22, 2018
dmd.aspetjournals.org
Dow
nloaded from
DMD # 23176
9
(10:90). The mixture was heated for 30 min at 85 °C in a heat block and water (2 mL)
was added to it. The aqueous mixture was then extracted with methyl tert-butyl
ether(MTBE). The samples were then centrifuged at 3500 rpm for approximately 5 min
and 100 µL of the MTBE layer was transferred to an amber colored gas
chromatography autosampler vial and capped. About 0.5 to 2 µL aliquots were injected
onto the gas chromatograph Varian model 3400 (Varian Chromatography Systems,
Walnut Creek, CA.)/Finnigan MAT TSQ 7000 mass spectrometer (Finnigan MAT, San
Jose, CA.). . The analytes were separated chromatographically using a ZB-5 column
(0.25 x 15 mm x 0.1 µm film thickness, Phenomenex, Torrance, CA). The GC/MS/MS
conditions were as follows: carrier gas, hydrogen; head pressure, 20 psi; injector
temperature, 300 °C; transfer line temperature, 250 °C; initial column temperature 80
°C; initial time, 0.75 min; temperature ramp rate, 25 °C/min; final temperature, 250 °C;
final time 0.1 min. The compounds were detected using negative ion chemical
ionization and the transitions were m/z 373 > 269 and 399 > 324 for torcetrapib and for
the internal standard for torcetrapib, and m/z 257 > 213 for M1 and its internal standard.
The MS conditions were as follows: ionization gas, ammonia; source temperature was
200 °C;, manifold temperature 75 °C; ionizing energy 200 V and emission current 300
µA. Data collection and integration was performed using Finnigan ICIS software
(Thermo Finnigan, San Jose, CA.). Quantitation was based upon quadratic regression
analysis of calibration curves weighted 1/x2 using the area ratio vs. concentration using
Waston DMLIMS (version 5.4.1.02). The dynamic range of the assay was 0.500 to 100
ng/mL for torcetrapib and 12.5 to 2500 ng/mL for M1.
Determination of the Pharmacokinetic Parameters.
This article has not been copyedited and formatted. The final version may differ from this version.DMD Fast Forward. Published on August 11, 2008 as DOI: 10.1124/dmd.108.023176
at ASPE
T Journals on D
ecember 22, 2018
dmd.aspetjournals.org
Dow
nloaded from
DMD # 23176
10
Pharmacokinetic parameters were determined by non-compartmental methods using
WinNonLin version 2.1 (Pharsight, Mountain View, CA). The maximum plasma
concentration (Cmax) and the time at which this concentration was achieved (Tmax) were
directly taken from the concentration data. The area under plasma concentration
versus time curve (AUC0-tlast) was calculated from 0 to the last quantifiable time point
(Tlast), using linear trapezoidal approximation. The plasma terminal elimination rate
constant (kel) was estimated by linear regression analysis of the terminal slope of log
plasma concentration – time curve. The area from Tlast to infinity (∞) was estimated by
Ctlast/kel, where Ctlast represented the estimated plasma concentration at Tlast, based
upon the aforementioned regression analysis. The area under the plasma
concentration – time curve from zero to ∞ (AUC0-∞) was estimated as the sum of AUC0-
Tlast and AUCT-∞.The terminal elimination half-life (t1/2) was estimated as ln2/kel. For
estimation of the means and pharmacokinetic parameters, concentrations at the 0 h and
those <0.500 ng/mL and <12.5 ng/mL, for torcetrapib and M1 respectively, were
assumed to be 0 ng/mL. The means were calculated only if more than 50% of the data
were <LLOQ.
Quantitation of Metabolite Metabolite M1 in Human Urine. Analysis of M1 in urine
samples was conducted with a non-validated LC/MS/MS assay but with inclusion of
quality control samples prepared in human urine and a standard curve. A 100 µL
aliquot of each urine sample containing M1 was treated with 20 µL aliquot of the
solution of internal standard (3,5-dinitrobenzoic acid, 60 µg/mL). Samples above the
upper limit of quantitation were diluted 10 or 20 fold by adding 10 or 5 µL of the sample
to predosed urine. The urine samples were centrifuged at 1400 RPM for 10 minutes
This article has not been copyedited and formatted. The final version may differ from this version.DMD Fast Forward. Published on August 11, 2008 as DOI: 10.1124/dmd.108.023176
at ASPE
T Journals on D
ecember 22, 2018
dmd.aspetjournals.org
Dow
nloaded from
DMD # 23176
11
and 20 µL of the supernatant was injected on to Phenomenex, Luna C-18(2) column (50
x 2.00 mm, 5 µm, Phenomenex, Torrence, CA). The mobile phase consisting of 5 mM
ammonium formate (pH 7.0), solvent A, and acetonitrile solvent B, was used to separate
the internal standard and M1. All HPLC analyses were performed at 0.2 mL/min flow
rate at 35 °C. The analytes were separated using a gradient system as follows: 0 to 3
min, 5% B; 3 to 7 min, 70% B; 7 to 7.01 min, 5% B. The column was reequilibrated at
5% B for the next 3 min prior to next injection. The compounds were detected in a
negative ion electrospray tandem mass spectrometry on a Micromass Quattro Ultima
mass spectrometer (Waters, MA). The retention times of M1 and the internal standard
were 7 and 6 minutes, respectively. The ion monitored were m/z 257.1 and 211.1 for
M1 and internal standard, respectively. The dynamic range of the assay was 20 to 1500
ng/mL. Data collection and integration was done using MassLynx version 3.5 software
(Waters, MA). The ratio of peak area responses of drug relative to internal standard
was used to construct a standard curve using a quadratic regression with a 1/x
weighting.
The percentage of dose excreted over 0 to 504 hrs was then calculated as follows: The
number of moles of M1 in the urine was first determined from the mass of M1 (ng/mL of
M1 x volume of urine per sampling time) which was then normalized by the moles of
torcetrapib dosed as shown.
Total moles of M1 excreted in human urine• 100 Moles of torcetrapib dosed to humans
Metabolic Profiling.
This article has not been copyedited and formatted. The final version may differ from this version.DMD Fast Forward. Published on August 11, 2008 as DOI: 10.1124/dmd.108.023176
at ASPE
T Journals on D
ecember 22, 2018
dmd.aspetjournals.org
Dow
nloaded from
DMD # 23176
12
Urine: Urine was pooled from 0-96 h so that >90% of the excreted dose was accounted
for. The pooling was proportional to the volume of urine collected at each time point.
Pooled urine samples were quenched with acetonitrile (5:1) and then centrifuged (3000
rpm for 10 min). The supernatants were evaporated in a turbo-Vap (Caliper Life
Sciences, Hopkinton, MA) at 35 °C under nitrogen and the residue obtained was
reconstituted in 500 µL of 50% acetonitrile solution. An aliquot was injected onto the
column (100 µL).
Plasma: Plasma samples obtained from 0 to 12 h were pooled according to the method
reported by Hamilton and co-workers, for profiling of circulating metabolites (Hamilton
et. al. 1981). The pooled samples were treated with acetonitrile at a ratio of 5 volumes
of acetonitrile to one volume of plasma. The mixture was then centrifuged and the
supernatant was transferred to another tube. The pellets were washed once more to
ensure that most of the radioactivity was recovered. The supernatants were mixed and
evaporated to dryness in a turbovap at 35 °C under nitrogen. The residues were
reconstituted in 500 µL of 50% acetonitrile solution and an aliquot (100 µl) was injected
onto the column. Aliquots (30 µL) of the reconstituted samples were also counted on
the liquid scintillation counter to determine the radioactivity extraction recovery.
Feces: Fecal homogenates of all the healthy human volunteers were pooled on weight
basis to account for 90% or greater radioactivity. Each pooled fecal sample was diluted
with 30 mL acetonitrile and vortexed. The sample was then centrifuged and the
supernatant was separated. The process was repeated several times until >90% of the
radioactivity was extracted. All supernatants were mixed and evaporated to about 1 mL
in a turbovap at 35 °C under nitrogen. The concentrated residue was extracted with 10
This article has not been copyedited and formatted. The final version may differ from this version.DMD Fast Forward. Published on August 11, 2008 as DOI: 10.1124/dmd.108.023176
at ASPE
T Journals on D
ecember 22, 2018
dmd.aspetjournals.org
Dow
nloaded from
DMD # 23176
13
mL of ethyl acetate until all radioactivity was recovered and the organic layer was
evaporated to dryness in a turbovap at 35 °C under nitrogen. The residue obtained was
reconstituted in ~ 300 µL of 50% acetonitrile solution and an aliquot was injected onto
the column (100 µL) and a small sample was analyzed by liquid scintillation counting for
radioactivity extraction recovery.
Separation, Quantification and Identification of Metabolites.
Metabolic profiling was performed using the HPLC system that consisted of an HP-1100
membrane degasser, HP-1100 autoinjector and a HP-1100 binary gradient pump
(Agilent Technologies, Palo Alto, CA). Chromatography was performed on a Zorbax
C18 column (5 micron, 4.5 x 150 mm) by injecting 100 µL of the reconstituted sample.
The mobile phase was initially composed of acetonitrile (solvent B) and 10 mM
ammonium formate (pH 2.0) (solvent A). The flow rate was 1.0 mL/min and separation
was achieved at ambient temperature. The 60 minute gradient was as follows: 0 to 10
min, 20% B; 10 to 35 min, 24% B; 35 to 37 min, 50% B; 37 to 53 min, 95% B; 53 to 55
min, 20% B. The column was reequilibrated at 20% B for the next 5 min prior to next
injection. The fecal metabolites were detected using a a β-RAM detector fitted with a
liquid scintillation cell (IN/US, Riviera Beach, FL). The β-RAM was operated in the
homogeneous liquid scintillation counting mode with the addition of 3 mL/min of Tru-
Count scintillation cocktail (IN/US, Riviera Beach, FL) to the effluent. The β-RAM
response was recorded as a real time analog signal by the MS data collection system.
The metabolites were quantified by measuring radioactivity in the individually separated
peaks in the radiochromatogram using Winflow software (IN/US, Riviera Beach, FL.).
The β-RAM provided an integrated printout in counts per minute and percentage of the
This article has not been copyedited and formatted. The final version may differ from this version.DMD Fast Forward. Published on August 11, 2008 as DOI: 10.1124/dmd.108.023176
at ASPE
T Journals on D
ecember 22, 2018
dmd.aspetjournals.org
Dow
nloaded from
DMD # 23176
14
radiolabeled material. The urinary and circulating metabolites were detected by a Liquid
Chromatography-Accurate Radioisotope Counting system (LC-ARC, AIM Research
Company, Wilmington, DE). The LC-ARC was operated in the homogeneous liquid
scintillation counting mode with the addition of 2.5 mL/min of Tru-Count scintillation
cocktail (IN/US) to the effluent. The urinary and the circulating metabolites were
quantified by the LC-ARC software (AIM Research Company, Wilmington, DE) by
measuring the radioactivity in the chromatographically separated peaks.
The metabolites were identified using a PE SCIEX API 2000 mass spectrometer
(PerkinElmerSciex Instruments, Boston, MA) or a Finnigan LCQ Ion Trap
(Thermoelectron, Waltham, MA) equipped with an electrospray ion source. All mass
spectrometers were operated in a positive ion mode. The instrument settings and
potentials (e.g. collision energy) adjusted to provide optimal data after tunning the
instrument with a solution of torcetrapib. The Sciex API 2000 was operated at an
ionspray voltage (IS) of 4000 V, orifice voltage (OR) of 36 V. The collision induced
dissociation (CID) studies (precursor ion scan or product ion scan) were performed
using nitrogen gas at collision energy of 30 V and the collision gas thickness of 4 x 10¹⁴
molecules/cm2. The MS data was analyzed by MultiView 1.4 software (PerkinElmer-
Sciex Instruments, Boston, MA).
The operating parameters for the ion trap were as follows: capillary temperature 270
°C; spray voltage 4.0 kV; capillary voltage 4.0 V; sheath gas flow rate 90 and auxillary
gas flow rate 30. The mass spectrometer was operated in a positive ion mode with
data-dependent scanning. The ions were monitored over a full mass range of m/z 125-
1000. For a full scan, the automatic gain control was set at 5.0 x 10⁸, maximum ion
This article has not been copyedited and formatted. The final version may differ from this version.DMD Fast Forward. Published on August 11, 2008 as DOI: 10.1124/dmd.108.023176
at ASPE
T Journals on D
ecember 22, 2018
dmd.aspetjournals.org
Dow
nloaded from
DMD # 23176
15
time was 100 ms and the number of microscans was set at 3. For MSn scanning, the
automatic gain control 1.0 x 10⁸, maximum ion time was 400 ms and the number of
microscans was set at 2. For data dependent scanning, the default charge-state was 1,
default isolation width was 3.0 and the normalized collision energy was 40 V. The MS
data was analyzed using the Xcalibur software version 1.2 (Thermoelectron, Waltham,
MA).
The metabolites were identified using Q1 (full scan), neutral loss, precursor ion scan.
The structures of metabolites were identified using product ion scan of the molecular
ions that were identified in the above scanning modes and multiple reaction monitoring
scanning.
Investigation of the In Vitro Metabolism of Torcetrapib to M2.
An initial incubation study to determine reaction velocity linearity was carried out at 37
°C with pooled human liver microsomes (3 mg/mL) or S9 fraction (3.7 mg/mL) and
torcetrapib (20 µM) in the presence and absence of NADPH (1 mM) in a total volume of
1 mL 0.1 M potassium phosphate buffer, pH 7.4. At 0, 10, 30, and 45 min after initiation
of the reaction, 0.1 mL of sample was removed and added to 0.2 mL of ice-cold
acetonitrile containing 200 ng of internal standard (used previously in the quantitation of
torcetrapib see above). The precipitate was removed by centrifugation at 3000 rpm for
10 min and the supernatant analyzed by HPLC-MS as described below. Subsequent
studies used an incubation time of 5 min and a protein concentration of 0.1 mg/mL. For
the saturation experiment the torcetrapib concentrations ranged from 0.1 to 20 µM. For
chemical inhibition tests, torcetrapib (2 µM) was incubated in the presence and absence
of furafylline (20 µM), sulfaphenazole (10 µM), quinidine (1 µM) ticlopidine (10 µM) and
This article has not been copyedited and formatted. The final version may differ from this version.DMD Fast Forward. Published on August 11, 2008 as DOI: 10.1124/dmd.108.023176
at ASPE
T Journals on D
ecember 22, 2018
dmd.aspetjournals.org
Dow
nloaded from
DMD # 23176
16
ketoconazole (0.01-1 µM). For recombinant P450 enzymes, torcetrapib (2 µM) was
incubated with rCYP (1 mg/mL; 10 pmol/mL of CYP) for 5 min and for the determination
of enzyme kinetic parameters with recombinant CYP3A4 and 3A5 the range of
torcetrapib concentrations was 0.1-20 µM. Analysis of samples for M2 was done by
selected reaction monitoring on a PE Sciex API-3000 LC/MS/MS system using
Advantage ARMOR C8 column (4.6 x 50 mm, 5 µm particle size) and a mobile phase of
80% acetonitrile and 20% 10 mM ammonium acetate at a flow rate of 0.5 mL/min.
Torcetrapib (m/z 618.1�300.1), M2 (m/z 529.2 � 228.0), and IS (m/z 644.1 � 325.9)
had retention times of 2.0, 1.7, and 2.3 min, respectively. M2 was quantitated using a
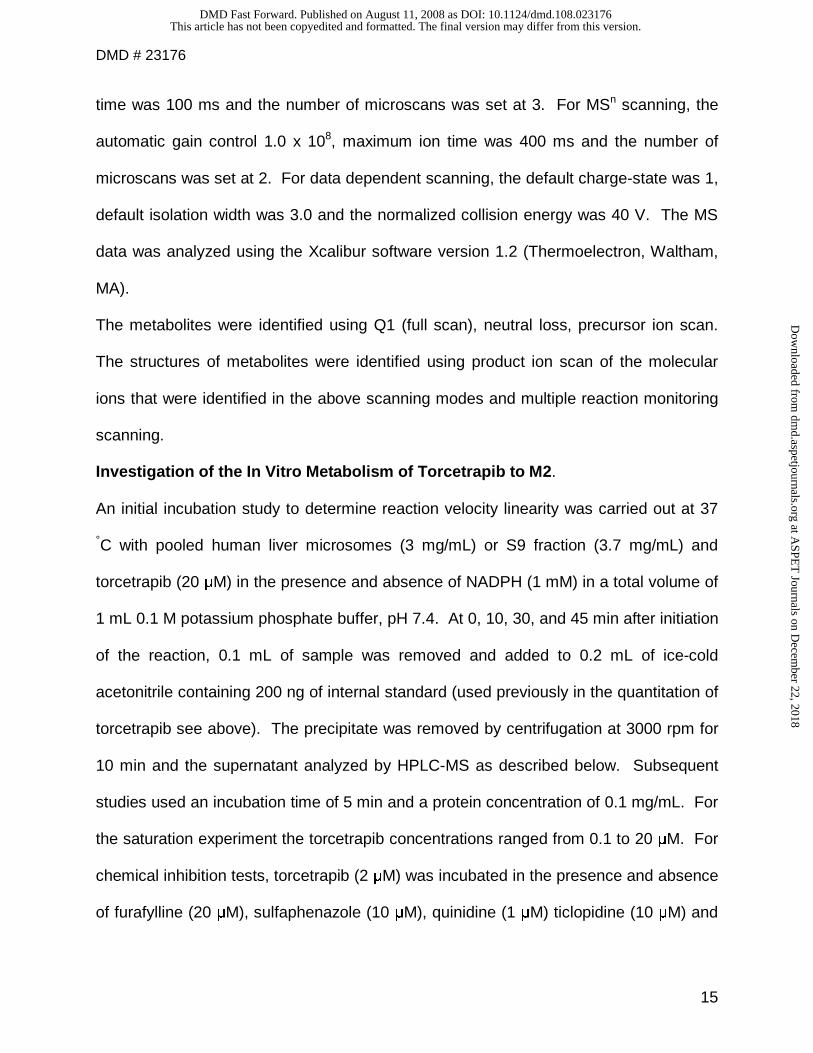
standard curve range of 4.00-500 ng/mL. Enzyme kinetic data were fit to the function
using SigmaPlot v 8 (Systat Software Inc., San Jose CA):
s
2
M
max
K
[S][S]K
[S]Vv
++
•=
Elucidation of the Pathway to Metabolite M4. Four potential substrates: M24, 2-
ethyl-6-trifluoromethylquinoline (1), M3, and M17, were incubated at 10 µM with pooled
human liver microsomes (2 mg/mL), MgCl2 (3.3 mM), and NADPH (1.3 mM) in 2 mL
potassium phosphate buffer (100 mM; pH 7.4). Incubations were commenced with the
addition of NADPH and incubated at 37 °C for 60 min open to the air. The incubations
were terminated by addition of five volumes of acetonitrile, the precipitate was removed
by centrifugation, and the supernatant evaporated under N2. The residue was
reconsitituted in 0.2 mL of 0.1% formic acid containing 20% acetonitrile, and injected
onto a Polaris C18 column (4.6 x 250 mm; 5 µm) equilibrated in 0.1% formic acid in
25% acetonitrile at a flow rate of 0.8 mL/min. The mobile phase was held at this
This article has not been copyedited and formatted. The final version may differ from this version.DMD Fast Forward. Published on August 11, 2008 as DOI: 10.1124/dmd.108.023176
at ASPE
T Journals on D
ecember 22, 2018
dmd.aspetjournals.org
Dow
nloaded from
DMD # 23176
17
composition for 5 min followed by a linear gradient to 60% acetonitrile over the next 45
min. The effluent was monitored at λ = 305 nm, split ~9:1, and introduced into an
electrospray ion source of a Finnigan LTQ ion trap mass spectrometer operated in the
positive ion mode. The source parameters of operation of the LTQ ion trap mass
spectrometer were similar to that of the ion trap described previously. A similarly
analyzed incubation was done for M17 as substrate using pooled human liver S9 (0.5
mg/mL) with addition of NAD+ instead of NADPH.
This article has not been copyedited and formatted. The final version may differ from this version.DMD Fast Forward. Published on August 11, 2008 as DOI: 10.1124/dmd.108.023176
at ASPE
T Journals on D
ecember 22, 2018
dmd.aspetjournals.org
Dow
nloaded from
DMD # 23176
18
Results
Excretion.
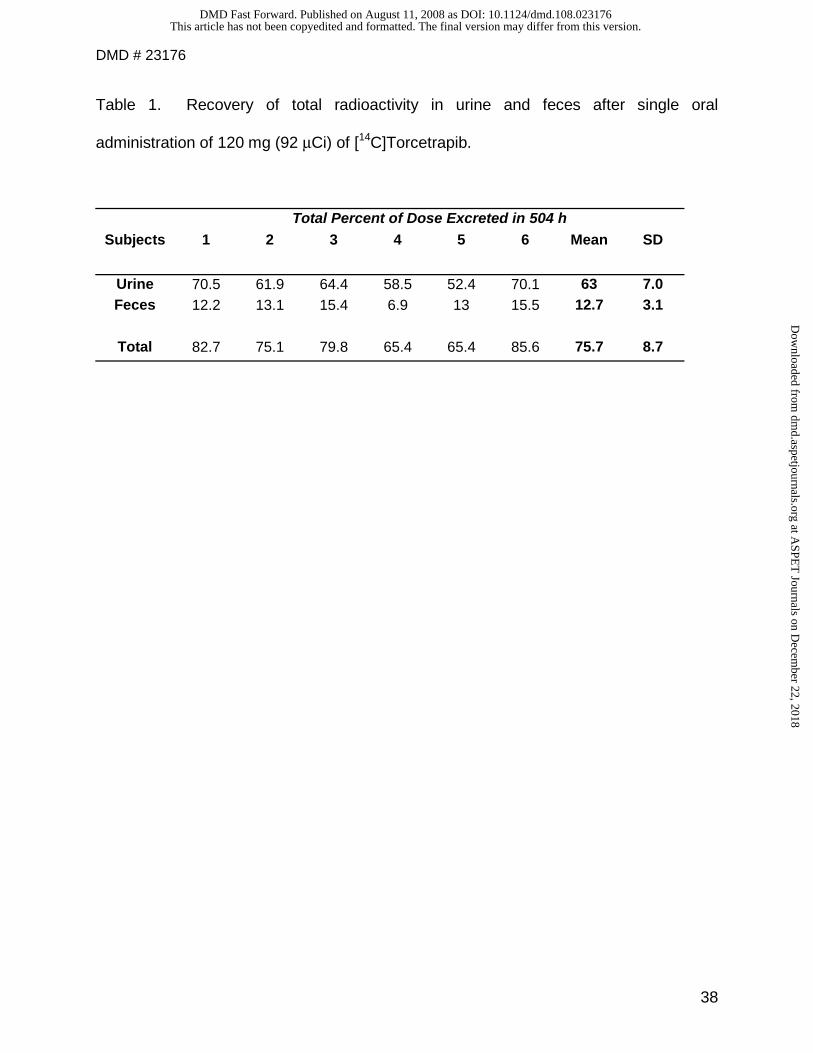
Urine and feces were collected over 504 h (21 days) from six healthy male volunteers
following oral adminstration of 120 mg of [14C]torcetrapib. The percentage of
radioactivity (expressed as % of dose) excreted in the urine and feces of six healthy
male volunteers over 504 h ranged from 65.4 to 85.6% (mean = 75.7 ± 8.7%) (Figure 1).
Table 1 shows the percent recovery of the radiolabel in the urine and feces. The
percent recovery of dose in urine ranged from 52.4 to 70.5% (mean = 63.0 ± 7.0%)
while the percent of dose in feces ranged from 6.90 to 15.5 % (mean = 12.7 ± 3.1%)
over the collection period (Table 1). The majority of recovered radioactivity (>90%) was
excreted within the first 5 days (120 hr) following administration of the dose in all
subjects (Figure 1).
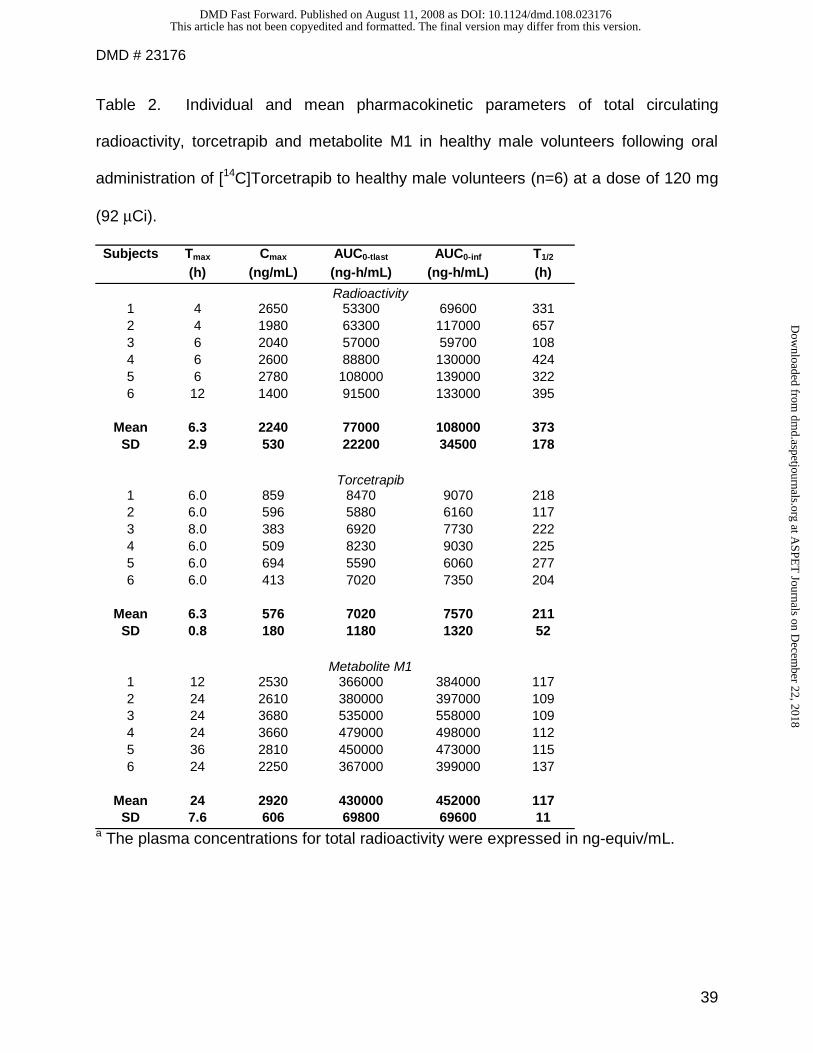
Pharmacokinetics of total radioactivity, torcetrapib and metabolite M1 in healthy
male volunteers.
The mean plasma concentration versus time profiles of total radioactivity and torcetrapib
following single oral administration of [14C]torcetrapib in healthy male volunteers at a
dose of 120 mg are presented in Figure 2. The individual and mean pharmacokinetic
parameters of total radioactivity and torcetrapib determined by non-compartmental
analysis are summarized in Table 2. Since metabolite M1 was a major metabolite in the
preclinical species and was devoid of the radiolabel, its concentrations in the plasma
were also monitored and the pharmacokinetic parameters were determined (Figure 2,
Table 2).
This article has not been copyedited and formatted. The final version may differ from this version.DMD Fast Forward. Published on August 11, 2008 as DOI: 10.1124/dmd.108.023176
at ASPE
T Journals on D
ecember 22, 2018
dmd.aspetjournals.org
Dow
nloaded from
DMD # 23176
19
The mean Cmax of total circulating radioactivity, torcetrapib and M1 was 2240 ng-
equiv./mL, 576 ng/mL and 2920 ng/mL and peaked at 6.3, 6.3 and 24 h, respectively
(Table 2). The mean AUC(0-∞) of total circulating radioactivity, torcetrapib and M1 was
108000 ng-equiv.-h/mL, 7570 ng•h/mL and 452000 ng•h/mL, respectively. The mean
terminal elimination half-life of the total circulating radioactivity, torcetrapib and M1 was
373, 211 and 117 hr, respectively. The exposure of total radioactivity was substantially
higher than that of unchanged torcetrapib. The AUC(0-∞) of torcetrapib accounted for
only 7.0% that of total circulating radioactivity. Similarly the exposure of M1 was 139
fold higher than that of the unchanged torcetrapib.
Metabolism of Torcetrapib.
The metabolism of torcetrapib in humans was investigated by profiling urine, plasma
and feces collected from six healthy male volunteers. As a first step the biological
matrices were pooled to account for >95% of the recovered radioactivity.
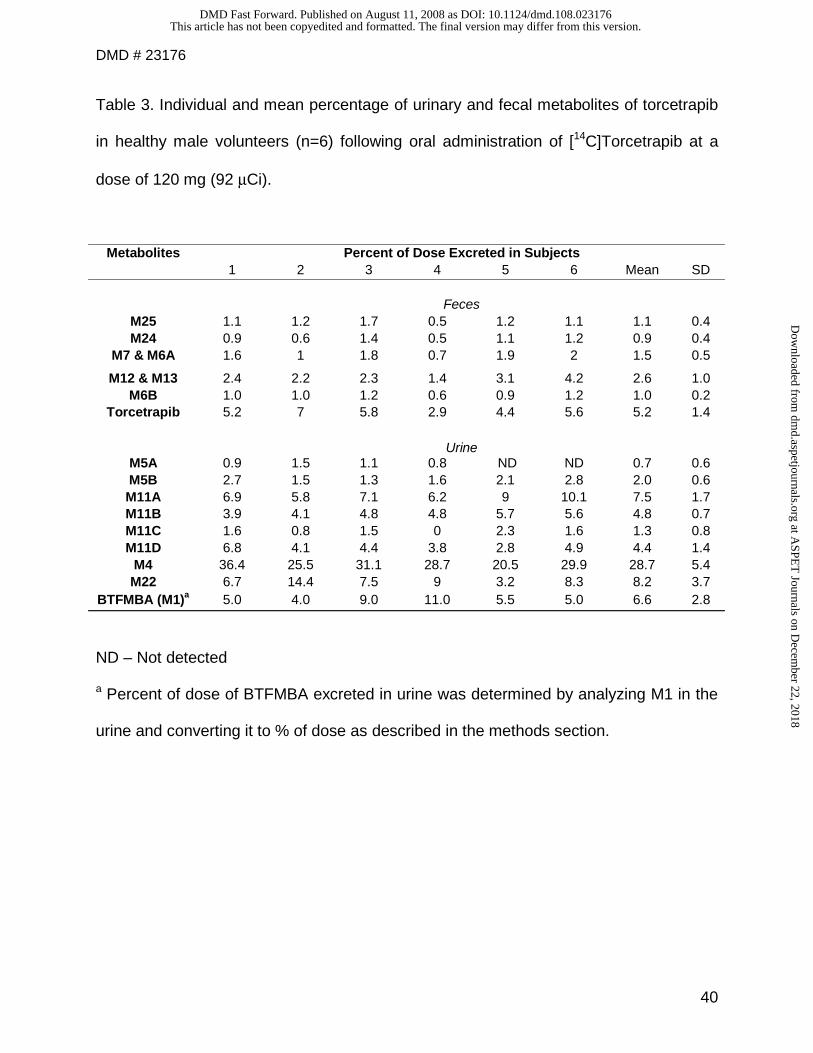
Urine: The representative HPLC radiochromatogram of pooled urine is shown in Figure
3. The individual and mean percentage of urinary metabolites of torcetrapib are shown
in Table 3. A total of 8 radioactive peaks were observed in the urinary profile. The
peaks eluting at ~35 (M4) and 40 (M22) min accounted for majority of the dose excreted
in the urine and represented a mean of 28.7 and 8.2% of the dose, respectively. The
peaks eluting at 16, 19, 21 and 22 min (11A-D) accounted for 18% of the total dose
whereas the peaks at ~14 and 18 min (M5A and M5B) accounted for only 3.5% of the
dose. No unchanged torcetrapib was detected in the urine. Metabolite M1 was also
detected in the pooled urine sample. The percent of M1 excreted in the urine over 0-
504 hr was determined by quantifying the metabolite using a non-validated assay and
This article has not been copyedited and formatted. The final version may differ from this version.DMD Fast Forward. Published on August 11, 2008 as DOI: 10.1124/dmd.108.023176
at ASPE
T Journals on D
ecember 22, 2018
dmd.aspetjournals.org
Dow
nloaded from
DMD # 23176
20
normalizing the mass of M1 in urine to the percent of dose as described in the methods
section. Based on these calculations, M1 accounted for ~7.0% of the total dose in the
urine (Table 3).
Feces: A representative HPLC radio-chromatogram of the extract of pooled human
feces is shown in Figure 4. The individual and mean percentage of metabolites of
torcetrapib in human fecal extracts is shown in Table 3. A total of 7 radioactive peaks
including unmodified torcetrapib were observed in the fecal extracts. The major peak in
the radiochromatogram eluting at ~51 min had a retention time that was similar to
unchanged torcetrapib and accounted for 5.2% of the dose. Other peaks, M2, M6A and
M6B, M7, M12, M13, M24 and M25 represented <2% of the dose. Metabolite M1 was
not detected in the fecal extracts.
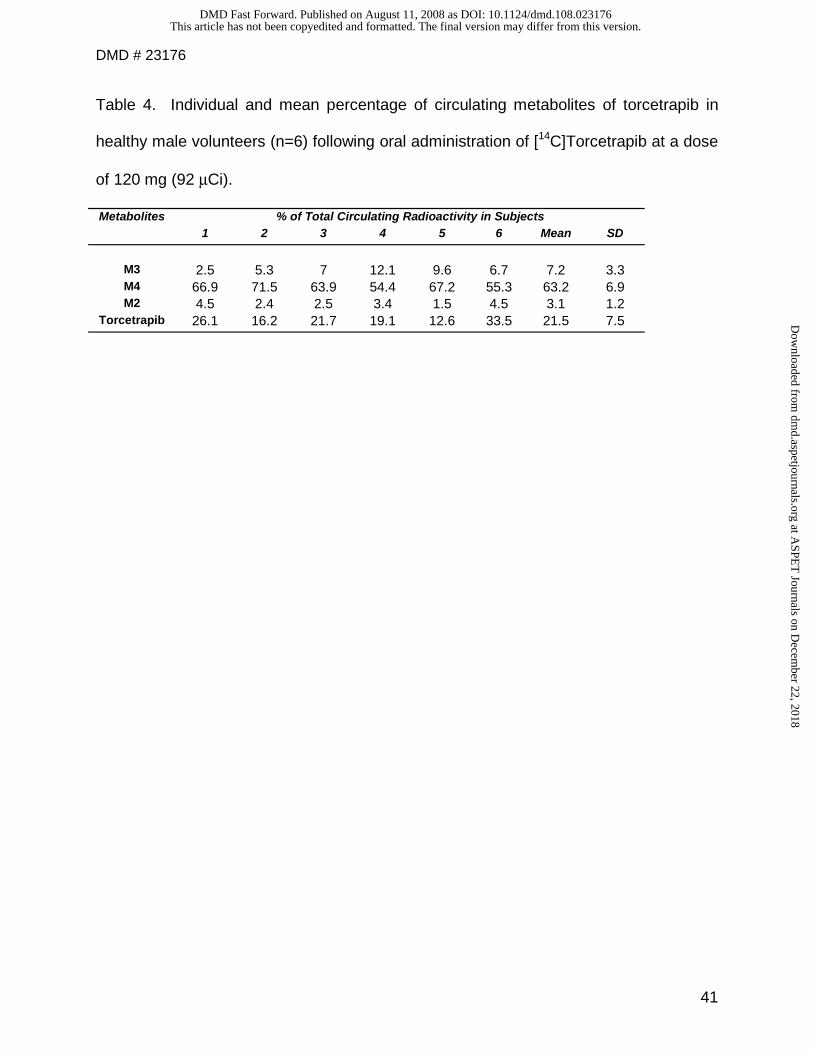
Circulating Metabolites: A representative HPLC radiochromatogram of circulating
metabolites in pooled plasma (0-12 hr) is shown in Figure 5. A mean of 97% of the total
circulating radioactivity could be identified. The plasma was pooled as described by
Hamilton and coworkers (Hamilton, et. al 1981) to get a good assessment of the
exposure of each metabolite over 0-12 hr. Table 4 represents the individual and mean
percentage of each circulating metabolite. Four radioactive peaks were observed in
plasma. The peak eluting at 51 min corresponded to the retention time of unchanged
torcetrapib and accounted for 21.5% of the total radioactivity. The peaks eluting at 18.2
(M3), 31 (M4), 50 (M2) min constituted 7.2, 63.2 and 3.1% of the circulating
radioactivity, respectively.
Identification of Metabolites:
This article has not been copyedited and formatted. The final version may differ from this version.DMD Fast Forward. Published on August 11, 2008 as DOI: 10.1124/dmd.108.023176
at ASPE
T Journals on D
ecember 22, 2018
dmd.aspetjournals.org
Dow
nloaded from
DMD # 23176
21
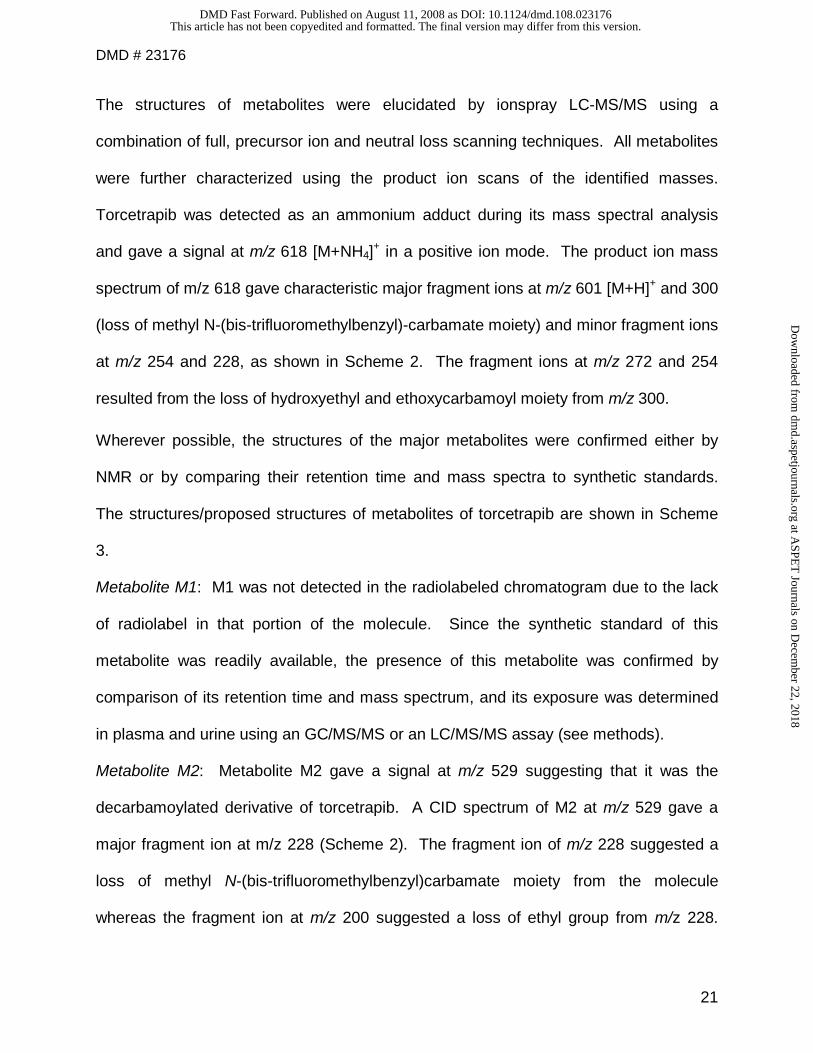
The structures of metabolites were elucidated by ionspray LC-MS/MS using a
combination of full, precursor ion and neutral loss scanning techniques. All metabolites
were further characterized using the product ion scans of the identified masses.
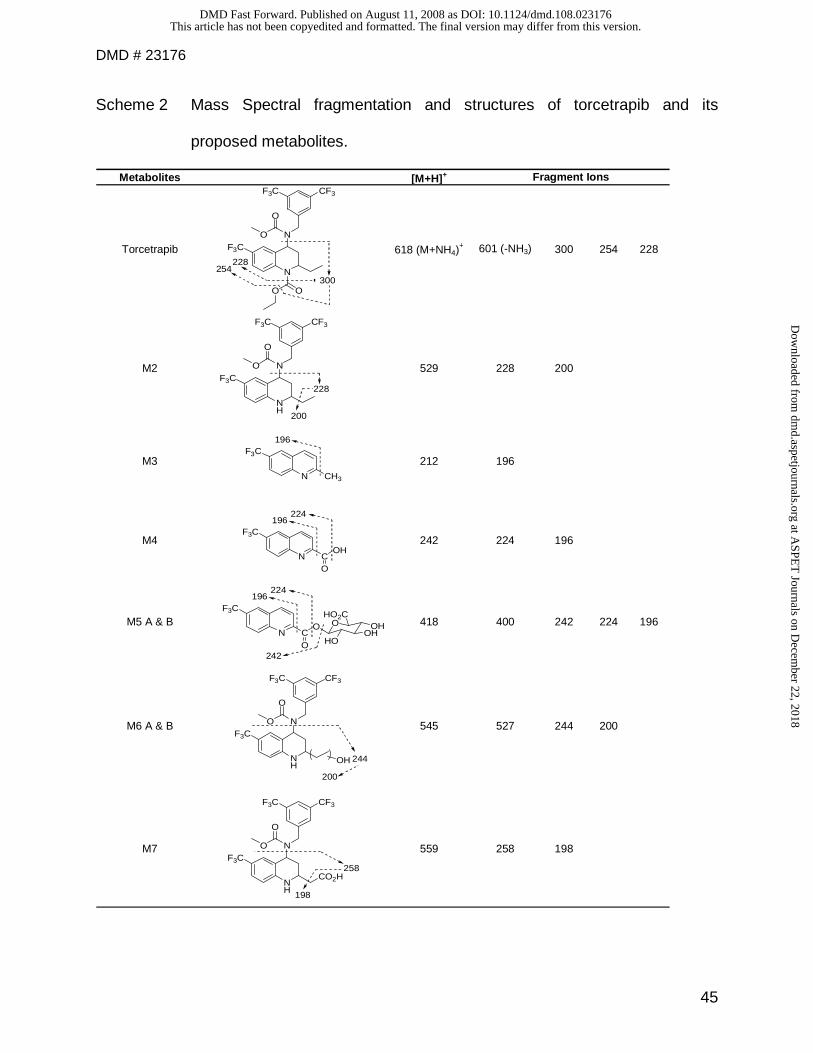
Torcetrapib was detected as an ammonium adduct during its mass spectral analysis
and gave a signal at m/z 618 [M+NH4]+ in a positive ion mode. The product ion mass
spectrum of m/z 618 gave characteristic major fragment ions at m/z 601 [M+H]+ and 300
(loss of methyl N-(bis-trifluoromethylbenzyl)-carbamate moiety) and minor fragment ions
at m/z 254 and 228, as shown in Scheme 2. The fragment ions at m/z 272 and 254
resulted from the loss of hydroxyethyl and ethoxycarbamoyl moiety from m/z 300.
Wherever possible, the structures of the major metabolites were confirmed either by
NMR or by comparing their retention time and mass spectra to synthetic standards.
The structures/proposed structures of metabolites of torcetrapib are shown in Scheme
3.
Metabolite M1: M1 was not detected in the radiolabeled chromatogram due to the lack
of radiolabel in that portion of the molecule. Since the synthetic standard of this
metabolite was readily available, the presence of this metabolite was confirmed by
comparison of its retention time and mass spectrum, and its exposure was determined
in plasma and urine using an GC/MS/MS or an LC/MS/MS assay (see methods).
Metabolite M2: Metabolite M2 gave a signal at m/z 529 suggesting that it was the
decarbamoylated derivative of torcetrapib. A CID spectrum of M2 at m/z 529 gave a
major fragment ion at m/z 228 (Scheme 2). The fragment ion of m/z 228 suggested a
loss of methyl N-(bis-trifluoromethylbenzyl)carbamate moiety from the molecule
whereas the fragment ion at m/z 200 suggested a loss of ethyl group from m/z 228.
This article has not been copyedited and formatted. The final version may differ from this version.DMD Fast Forward. Published on August 11, 2008 as DOI: 10.1124/dmd.108.023176
at ASPE
T Journals on D
ecember 22, 2018
dmd.aspetjournals.org
Dow
nloaded from
DMD # 23176
22
Metabolite M2 was further confirmed by comparing its retention time and its mass
spectrum with that of the authentic standard.
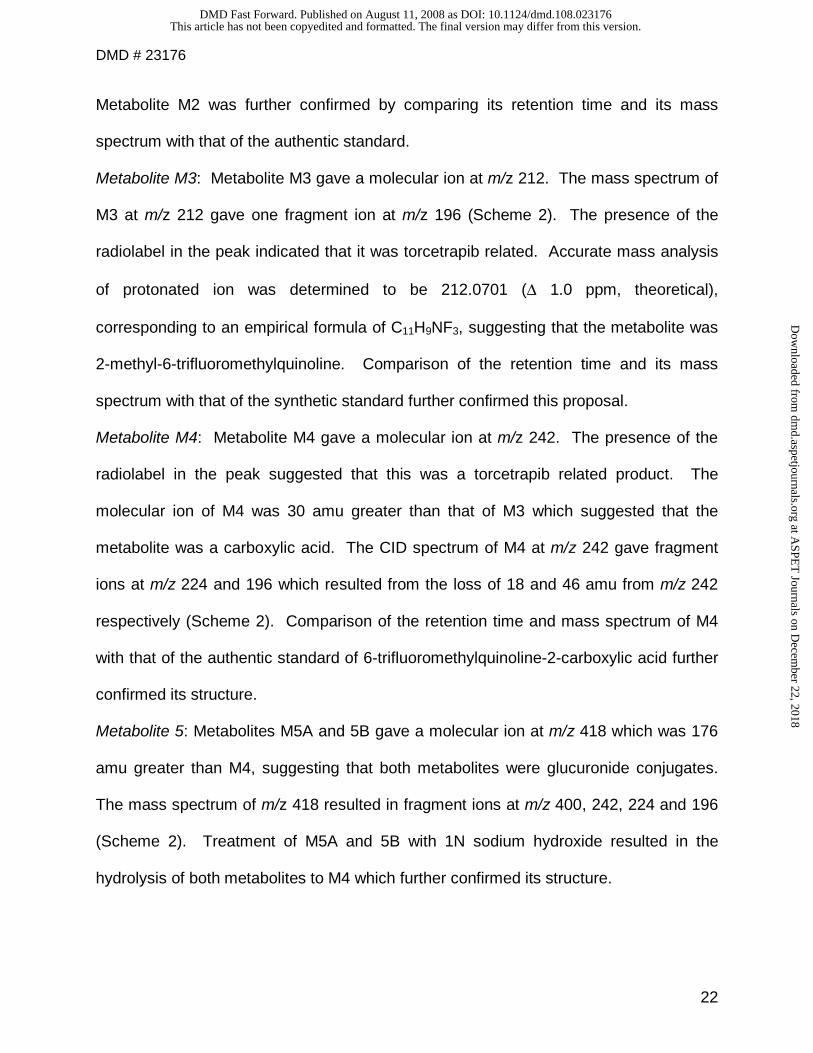
Metabolite M3: Metabolite M3 gave a molecular ion at m/z 212. The mass spectrum of
M3 at m/z 212 gave one fragment ion at m/z 196 (Scheme 2). The presence of the
radiolabel in the peak indicated that it was torcetrapib related. Accurate mass analysis
of protonated ion was determined to be 212.0701 (∆ 1.0 ppm, theoretical),
corresponding to an empirical formula of C11H9NF3, suggesting that the metabolite was
2-methyl-6-trifluoromethylquinoline. Comparison of the retention time and its mass
spectrum with that of the synthetic standard further confirmed this proposal.
Metabolite M4: Metabolite M4 gave a molecular ion at m/z 242. The presence of the
radiolabel in the peak suggested that this was a torcetrapib related product. The
molecular ion of M4 was 30 amu greater than that of M3 which suggested that the
metabolite was a carboxylic acid. The CID spectrum of M4 at m/z 242 gave fragment
ions at m/z 224 and 196 which resulted from the loss of 18 and 46 amu from m/z 242
respectively (Scheme 2). Comparison of the retention time and mass spectrum of M4
with that of the authentic standard of 6-trifluoromethylquinoline-2-carboxylic acid further
confirmed its structure.
Metabolite 5: Metabolites M5A and 5B gave a molecular ion at m/z 418 which was 176
amu greater than M4, suggesting that both metabolites were glucuronide conjugates.
The mass spectrum of m/z 418 resulted in fragment ions at m/z 400, 242, 224 and 196
(Scheme 2). Treatment of M5A and 5B with 1N sodium hydroxide resulted in the
hydrolysis of both metabolites to M4 which further confirmed its structure.
This article has not been copyedited and formatted. The final version may differ from this version.DMD Fast Forward. Published on August 11, 2008 as DOI: 10.1124/dmd.108.023176
at ASPE
T Journals on D
ecember 22, 2018
dmd.aspetjournals.org
Dow
nloaded from
DMD # 23176
23
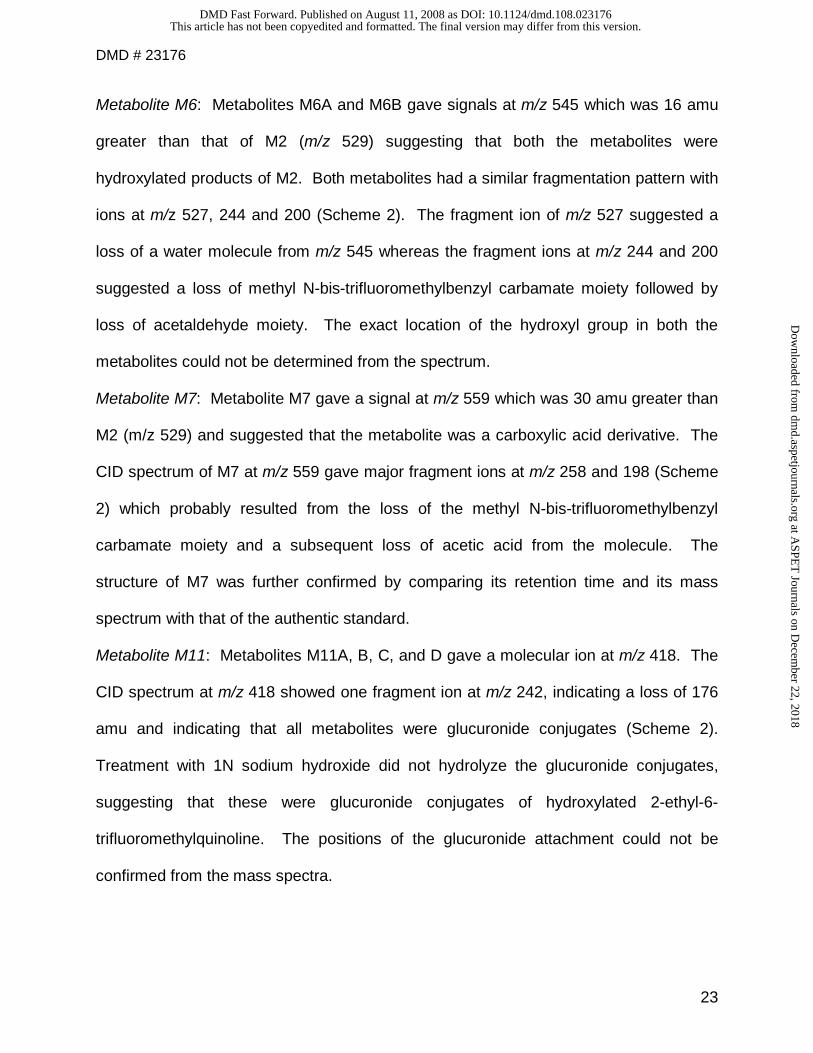
Metabolite M6: Metabolites M6A and M6B gave signals at m/z 545 which was 16 amu
greater than that of M2 (m/z 529) suggesting that both the metabolites were
hydroxylated products of M2. Both metabolites had a similar fragmentation pattern with
ions at m/z 527, 244 and 200 (Scheme 2). The fragment ion of m/z 527 suggested a
loss of a water molecule from m/z 545 whereas the fragment ions at m/z 244 and 200
suggested a loss of methyl N-bis-trifluoromethylbenzyl carbamate moiety followed by
loss of acetaldehyde moiety. The exact location of the hydroxyl group in both the
metabolites could not be determined from the spectrum.
Metabolite M7: Metabolite M7 gave a signal at m/z 559 which was 30 amu greater than
M2 (m/z 529) and suggested that the metabolite was a carboxylic acid derivative. The
CID spectrum of M7 at m/z 559 gave major fragment ions at m/z 258 and 198 (Scheme
2) which probably resulted from the loss of the methyl N-bis-trifluoromethylbenzyl
carbamate moiety and a subsequent loss of acetic acid from the molecule. The
structure of M7 was further confirmed by comparing its retention time and its mass
spectrum with that of the authentic standard.
Metabolite M11: Metabolites M11A, B, C, and D gave a molecular ion at m/z 418. The
CID spectrum at m/z 418 showed one fragment ion at m/z 242, indicating a loss of 176
amu and indicating that all metabolites were glucuronide conjugates (Scheme 2).
Treatment with 1N sodium hydroxide did not hydrolyze the glucuronide conjugates,
suggesting that these were glucuronide conjugates of hydroxylated 2-ethyl-6-
trifluoromethylquinoline. The positions of the glucuronide attachment could not be
confirmed from the mass spectra.
This article has not been copyedited and formatted. The final version may differ from this version.DMD Fast Forward. Published on August 11, 2008 as DOI: 10.1124/dmd.108.023176
at ASPE
T Journals on D
ecember 22, 2018
dmd.aspetjournals.org
Dow
nloaded from
DMD # 23176
24
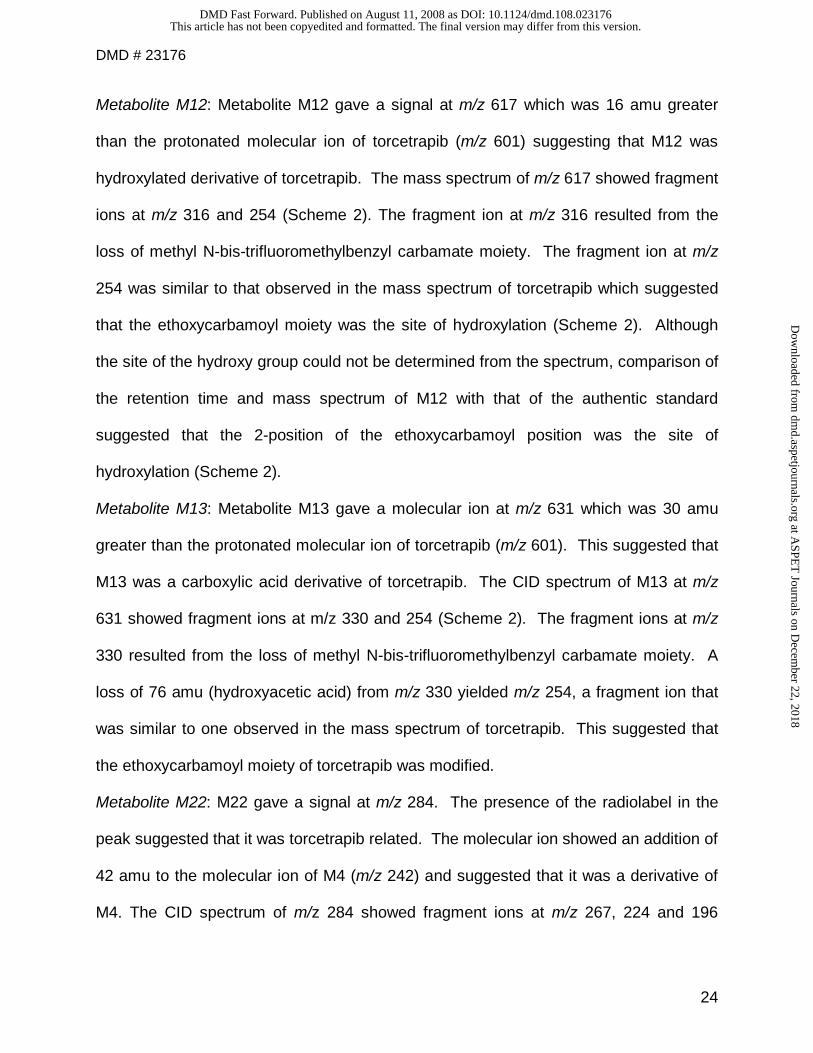
Metabolite M12: Metabolite M12 gave a signal at m/z 617 which was 16 amu greater
than the protonated molecular ion of torcetrapib (m/z 601) suggesting that M12 was
hydroxylated derivative of torcetrapib. The mass spectrum of m/z 617 showed fragment
ions at m/z 316 and 254 (Scheme 2). The fragment ion at m/z 316 resulted from the
loss of methyl N-bis-trifluoromethylbenzyl carbamate moiety. The fragment ion at m/z
254 was similar to that observed in the mass spectrum of torcetrapib which suggested
that the ethoxycarbamoyl moiety was the site of hydroxylation (Scheme 2). Although
the site of the hydroxy group could not be determined from the spectrum, comparison of
the retention time and mass spectrum of M12 with that of the authentic standard
suggested that the 2-position of the ethoxycarbamoyl position was the site of
hydroxylation (Scheme 2).
Metabolite M13: Metabolite M13 gave a molecular ion at m/z 631 which was 30 amu
greater than the protonated molecular ion of torcetrapib (m/z 601). This suggested that
M13 was a carboxylic acid derivative of torcetrapib. The CID spectrum of M13 at m/z
631 showed fragment ions at m/z 330 and 254 (Scheme 2). The fragment ions at m/z
330 resulted from the loss of methyl N-bis-trifluoromethylbenzyl carbamate moiety. A
loss of 76 amu (hydroxyacetic acid) from m/z 330 yielded m/z 254, a fragment ion that
was similar to one observed in the mass spectrum of torcetrapib. This suggested that
the ethoxycarbamoyl moiety of torcetrapib was modified.
Metabolite M22: M22 gave a signal at m/z 284. The presence of the radiolabel in the
peak suggested that it was torcetrapib related. The molecular ion showed an addition of
42 amu to the molecular ion of M4 (m/z 242) and suggested that it was a derivative of
M4. The CID spectrum of m/z 284 showed fragment ions at m/z 267, 224 and 196
This article has not been copyedited and formatted. The final version may differ from this version.DMD Fast Forward. Published on August 11, 2008 as DOI: 10.1124/dmd.108.023176
at ASPE
T Journals on D
ecember 22, 2018
dmd.aspetjournals.org
Dow
nloaded from
DMD # 23176
25
(Scheme 2). The presence of m/z 224 and 196 in the mass spectrum further suggested
that the modification was on the carboxy group. The fragment ion of 267 suggested a
loss of ammonia from the molecule which was characterisitic of an amide or an urea.
The accurate mass of MH+ (284.0652) supports the empirical formula of C12H9N3O2F3 (∆
-0.2 ppm, theoretical), which corresponded to a urea conjugate of M4.
Metabolite M24: Metabolite M24 gave a signal at m/z 471 and suggested a loss of 58
amu from metabolite M2 (m/z 529). A CID spectrum of M24 at m/z 471 gave one
fragment ion at m/z 228 (Scheme 2) which was similar to the one observed in the mass
spectrum of M2. This suggested that M24 was a decarbamoylated derivative of M2.
This was confirmed by comparison of the retention time and mass spectrum of M24 with
that of its authentic standard.
Metabolite M25: Metabolite M25 gave a signal at m/z 487 suggesting addition of 16 amu
to metabolite M24. A CID spectrum of m/z 487 showed a one fragment ion m/z 244
indicating the loss of methyl bis-trifluoromethylcarbamate moiety (Scheme 2). It also
suggested an addition of 16 amu to the fragment ion at m/z 228 observed in the mass
spectrum of M24 suggesting that the tetrahydroquinoline portion of the molecule was
modified. The exact position of the hydroxy group could not be determined from the
spectrum.
In Vitro Metabolism of Torcetrapib to Metabolite M2. Metabolite M2 was the
predominant metabolite identified following incubation of torcetrapib with NADPH-
supplemented pooled human liver microsomes and S9 fractions (data not shown).
Control experiments lacking NADPH in the incubation mixture did not form M2.
Subsequent investigation of this reaction utilized liver microsomes. Enzyme kinetics of
This article has not been copyedited and formatted. The final version may differ from this version.DMD Fast Forward. Published on August 11, 2008 as DOI: 10.1124/dmd.108.023176
at ASPE
T Journals on D
ecember 22, 2018
dmd.aspetjournals.org
Dow
nloaded from
DMD # 23176
26
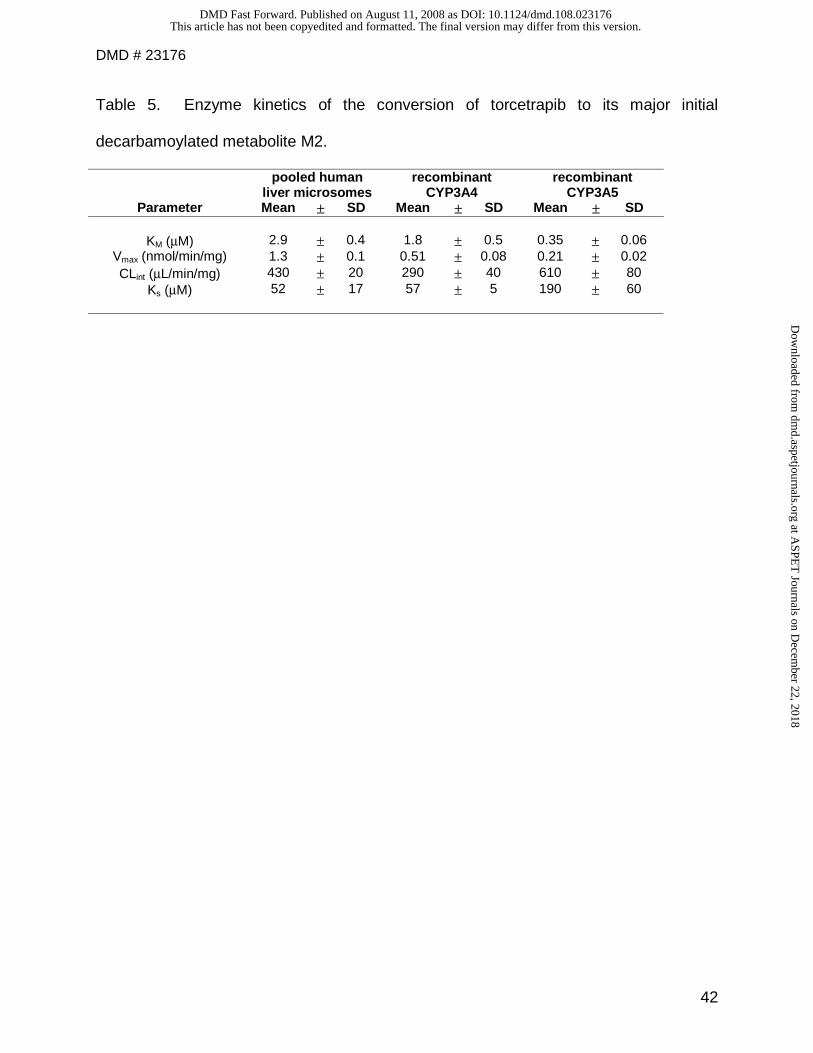
the reaction yielded KM and Vmax values of 2.9 µM and 1.3 nmol/min/mg protein (Table
5), and the shape of the v vs. [S] curve supported possible substrate inhibition at high
substrate concentrations. Incubation in the presence of P450 selective inhibitors
(furafylline, sulfaphenazole, ticlopidine, quinidine, and ketoconazole) demonstrated that
only ketoconazole had an inhibitory effect with an IC50 value of 0.1 µM consistent with
its potency for inhibition of CYP3A enzymes. Incubation of torcetrapib with several
recombinant heterologously expressed human P450 enzymes (CYP1A1, 1A2, 1B1,
2A6, 2B6, 2C8, 2C9, 2C18, 2C19, 2D6, 2E1, 3A4, 3A5, and 4A11) showed that only
CYP3A4 and 3A5 catalyzed conversion to M2. The Michaelis constants for the
recombinant CYP3A enzymes were similar to that measured in liver microsomes.
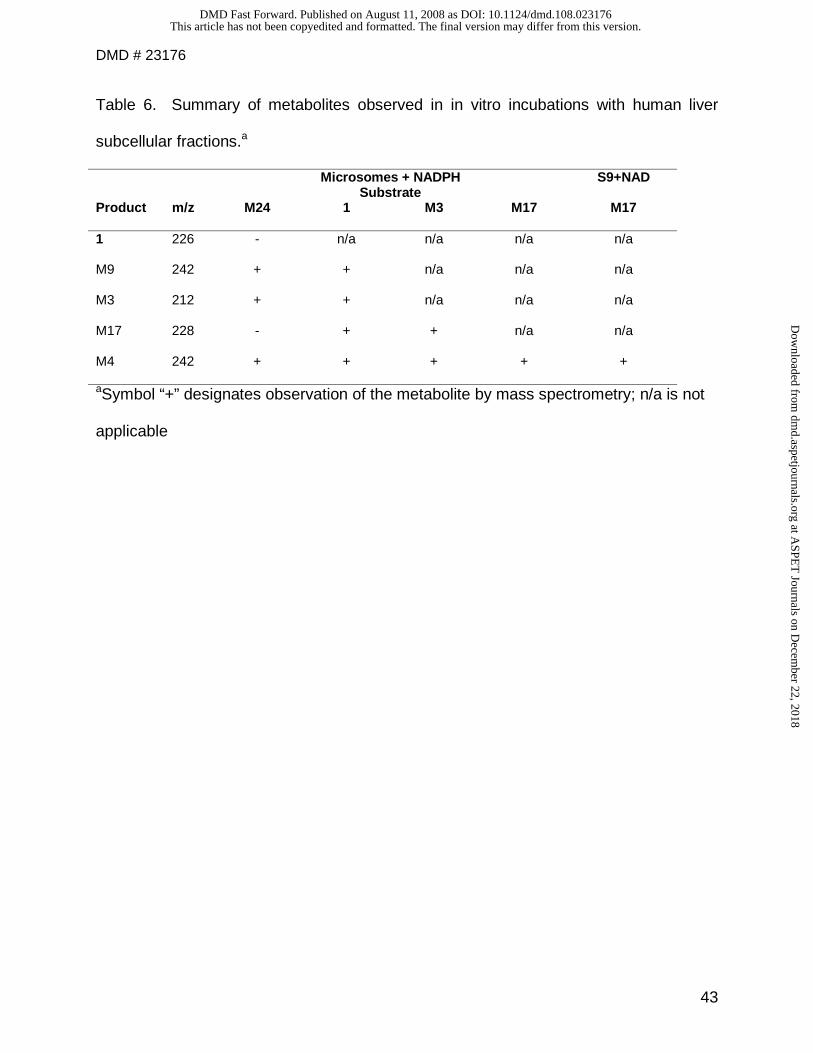
Investigation of the Metabolic Pathway to Metabolite M4. A summary of metabolites
observed in in vitro incubations conducted to investigate the pathway to M4 is listed in
Table 6. Incubation of M24 with human liver microsomes under conditions supporting
P450 activity yielded M4 and intermediate metabolites M9 and M3 (Figure 6).
Interestingly, incubation of the analogue lacking the 3,5-trifluorobenzyl substituent did
not yield metabolites, indicating that this compound is not an intermediate metabolite in
the pathway to M4 (data not shown). Under oxidative conditions, incubation of 2-ethyl-
6-trifluoromethylquinoline (1) yielded metabolites that were one carbon atom less on the
2-position (M3, M17, M4; Figure 6). As expected, 2-methyl-6-trifluoromethylquinoline
(M3) was sequentially oxidized to the benzyl alcohol metabolite (M17) and quinaldic
acid (M4), with the latter step being observed under conditions that support P450
activity as well as alcohol dehydrogenase activity (Table 6).
This article has not been copyedited and formatted. The final version may differ from this version.DMD Fast Forward. Published on August 11, 2008 as DOI: 10.1124/dmd.108.023176
at ASPE
T Journals on D
ecember 22, 2018
dmd.aspetjournals.org
Dow
nloaded from
DMD # 23176
27
Discussion
In the present study, the metabolism and disposition of torcetrapib was investigated in
six healthy male volunteers following single oral administration of [14C]torcetrapib at a
dose of 120 mg. Unlike preclinical species (Prakash, et al., manuscript in preparation),
the mass balance study suggested that urine (63%) was the major route of excretion in
humans in contrast to the preclinical species in which most of the radioactivity was
excreted via the feces. Only 76% of the dose was recovered in the humans over a
period of 504 hr (21 days). Assessment of the ratio of AUC0-Tlast to AUC0-∞ (0.70) for
total radioactivity in plasma suggested that complete recovery could likely be obtained
with continued collection of excreta. The low recovery of dose in humans was probably
due to the possible adipose tissue uptake of total radioactivity followed by slow
elimination. This speculation was based on the results from WBAL studies in Long-
Evans rats, which demonstrated sequestration of radioactivity in adipose tissue
(unpublished data). Although a proper assessment of absorption could not be made in
this study because of the low total radioactivity recovery, a 63% recovery of dose in the
urine and the presence of only 5.2% unchanged torcetrapib in the feces suggested
absorption of most of the dose in humans.
Pharmacokinetic analysis of total radioactivity and unchanged torcetrapib suggested
that the absorption was slow since plasma concentrations for both peaked at 6.3 h. The
elimination of total radioactivity and torcetrapib was also slow as indicated by long
terminal elimination half-lives for both (373 h for total radioactivity and 211 h for
torcetrapib). This was also speculated to be due to the adipose tissue uptake of the
drug-related material.
This article has not been copyedited and formatted. The final version may differ from this version.DMD Fast Forward. Published on August 11, 2008 as DOI: 10.1124/dmd.108.023176
at ASPE
T Journals on D
ecember 22, 2018
dmd.aspetjournals.org
Dow
nloaded from

DMD # 23176
28
As observed in the preclinical species, torcetrapib was extensively metabolized in
humans. Only 5.2% of unchanged torcetrapib was detected in the feces and no parent
was detected in the urine. In addition, the majority of the total circulating radioactivity
comprised of metabolites since AUC0-∞ and Cmax of unchanged torcetrapib accounted
for only 7.0 and 25.7% of AUC0-∞ and Cmax of total circulating radioactivity in plasma.
Oxidation was the major route of metabolism of torcetrapib in humans. The proposed
metabolic scheme of torcetrapib in healthy male volunteers is shown in Scheme 3.
Metabolites M1 and M4 constituted major metabolites in plasma and urine.
Approximately 40% of the dose was excreted as M4 and its glucuronide and urea
conjugates in the urine whereas circulating concentrations of M4 were ~3 fold greater
than unchanged torcetrapib.
The exposure to M1 in human plasma as determined by AUC0-∞ and Cmax was 139 and
12 fold greater than the exposure of unchanged torcetrapib whereas M1 accounted to
about 7% of the dose excreted in the urine. The plasma concentrations of M1 peaked
at 24 h which was approximately 18 h later than torcetrapib and total radioactivity
suggesting that M1 formation could not be only attributed to the parent drug and that
other metabolites also contributed to its formation. Neither of the metabolites M1 nor
M4 inhibited CETP. This was not surprising given the structural and lipophilicity
differences of these two metabolites and torcetrapib. In contrast to urine, M1 and M4
were not detected in the fecal extracts. Instead, the metabolic profile of the fecal
extracts showed decarbamoylation of torcetrapib as the primary pathway (M2, M6, M7,
M24 and M25) and oxidative metabolites of torcetrapib (M12 and M13). All metabolites
(except M24 and M25) detected in the plasma, urine and feces of humans were present
This article has not been copyedited and formatted. The final version may differ from this version.DMD Fast Forward. Published on August 11, 2008 as DOI: 10.1124/dmd.108.023176
at ASPE
T Journals on D
ecember 22, 2018
dmd.aspetjournals.org
Dow
nloaded from
DMD # 23176
29
in the toxicology species. Although unique in humans, both M24 and M25 constituted
only ~1% of the total excreted dose. Additionally, neither metabolite was present in
human plasma. Thus no additional studies were conducted to assess their safety in
preclinical species.
In the in vitro studies undertaken to assess the formation of the major metabolites M1
and M4, torcetrapib was incubated with human liver microsomal and S9 fractions.
These studies revealed that torcetrapib primarily underwent decarbamoylation resulting
in M2 in both the fractions. Although, oxidative decarbamoylation as well as hydrolysis
of carbamates by intestinal and hepatic esterases has been well documented in the
literature (Yumibe et. al. 1996; Quinney et. al. 2005; Khanna et. al. 2000), formation of
M2 was NADPH dependent and led to the conclusion that this was a CYP-mediated
process rather than hydrolysis. Further phenotyping studies using recombinant CYPs
and inhibitors indicated that this pathway was CYP 3A4/3A5 catalyzed. Thus, a
pathway similar to oxidative decarbamoylation of loratadine (Yumibe et.al. 2004) could
be proposed for the formation of M2 (Scheme 4). This could involve initial hydrogen
atom abstraction from the carbon atom of the carbamoyloxy group followed by oxygen
rebound and subsequent cleavage of the corresponding α-hydroxycarbamate via
concomitant decarboxylation to yield M2. Metabolites M1 and M4 were not detected in
these experiments suggesting that these were downstream products of M2.
Studies to gain further mechanistic insight into the formation of the novel metabolite M4
were conducted by incubating the benzylamine M24 and other synthetic metabolites 1,
M3, M9 and M17 with pooled liver microsomes and cytosolic fractions. Detection of M4
in NADPH-supplemented microsomal incubations of M24 indicated that one possible
This article has not been copyedited and formatted. The final version may differ from this version.DMD Fast Forward. Published on August 11, 2008 as DOI: 10.1124/dmd.108.023176
at ASPE
T Journals on D
ecember 22, 2018
dmd.aspetjournals.org
Dow
nloaded from
DMD # 23176
30
pathway leading to M4 was via the route depicted in Scheme 3. Briefly, the
tetrahydroquinoline metabolite (M24) is first oxidized at the α-position to yield the imine
(2) which will be in equilibrium with the corresponding enamine (3). The latter can
undergo aromatization via elimination of 3,5-bistrifluoromethylbenzylamine moiety to
yield the quinoline intermediate 1. Although the exact mechanism for elimination of the
substituted benzylamine was not explored using unsubstituted analogs, one possible
trigger for this could be the protonation of the amino group which could make 3,5-
disubstituted benzylamine a good leaving group in addition to the drive for
aromatization. Analogous CYP-mediated aromatization of alicyclic amines
(tetrahydroquinolines and 4-substituted piperidines) to quinolines or pyridines, have
been previously reported (Gu et. al. 2006; Fang et. al. 2001; Aventa et. al. 1997). The
intermediate (1) can subsequently undergo modification of the ethyl moiety via
sequential oxidation (to M9 and 4) and decarboxylation of 4 to yield M3 (Scheme 3).
The proposed C-C bond cleavage resulting in the conversion of intermediate 4 to M3
has precedence in organic chemistry (Borsche and Manteuffel, 1936; Doering and
Pasternak, 1950). Furthermore the presence of an electronwithdrawing substituent
such as the trifluoromethyl group on the quinoline ring could further facilitate such a
cleavage. Sequential P450 mediated oxidation of the benzylic methyl group of M3
through M17 to M4 is a common pathway in drug metabolism. The intermediate
products of this mechanism such as M9, M3 and M17 have also been identified as
metabolites in the preclinical species. Metabolite M3 has also been detected as a
circulating metabolite in humans (Figure 5, Table 4). Incubations of M17 with NAD+-
This article has not been copyedited and formatted. The final version may differ from this version.DMD Fast Forward. Published on August 11, 2008 as DOI: 10.1124/dmd.108.023176
at ASPE
T Journals on D
ecember 22, 2018
dmd.aspetjournals.org
Dow
nloaded from
DMD # 23176
31
supplemented human S9 fractions also resulted in M4 indicating that this reaction could
also be catalyzed by alcohol dehydrogenase in addition to P450.
Although several pathways could be envisioned for M1 formation, one direct pathway
could involve oxidative N-dealkylation of torcetrapib or its metabolites M2, M6, M7, M12
M13, M24 or M25 (Scheme 5). This pathway is consistent with the previous reports that
have demonstrated N-dealkylation of amides or carbamates in the past (Morino et. al.
1985; Hey and Tolando, 2000; Hall and Hanzlik, 1991; Labroo et. al. 1995).
Alternatively, M24 can also undergo dealkylation which on oxidation would result in M1.
In conclusion, this study demonstrated the metabolism of torcetrapib in humans.
Administration of torcetrapib to humans resulted in extensive metabolism of the drug to
multiple oxidative metabolites. Initial metabolism of torcetrapib proceeds via CYP 3A4-
mediated decarbamoylation. Subsequent oxidations lead to the major circulating and
excretory metabolites M1 and M4.
This article has not been copyedited and formatted. The final version may differ from this version.DMD Fast Forward. Published on August 11, 2008 as DOI: 10.1124/dmd.108.023176
at ASPE
T Journals on D
ecember 22, 2018
dmd.aspetjournals.org
Dow
nloaded from
DMD # 23176
32
Acknowledgements:
The authors wish to thanks Drs. Klaas Schildknegt, Roger Ruggeri and Gregory
Dolnikowski for providing radiolabelled torcetrapib and synthetic metabolite standards.
This article has not been copyedited and formatted. The final version may differ from this version.DMD Fast Forward. Published on August 11, 2008 as DOI: 10.1124/dmd.108.023176
at ASPE
T Journals on D
ecember 22, 2018
dmd.aspetjournals.org
Dow
nloaded from
DMD # 23176
33
References
Aventa KM, Rikerb RR, Fraserb GL, Van der Schyfd CJ, Usuki E, and Pond SM (1997)
Metabolism of haloperidol to pyridinium species in patients receiving high doses
intravenously: Is HPTP an intermediate? Life Sci. 61: 2383-2390.
Borsche W and Manteuffel R. (1936) Uber chinolyl-2-brenztraubensaure und chinolyl-2-
essigsaure.. Ann. Chem. 526: 22-46.
Brousseau ME, Schaefer EJ, Wolfe ML, Bleeodon LT, Digenio AG, Clark RW, Mancuso
JP, and Rader DJ. () Effects of an inhibitor of cholesteryl ester transfer protein on HDL
cholesterol. N. Engl. J. Med. 350:1505-1515.
Clark RW, Ruggeri RB, Cunningham D, and Bamberger MJ. (2006) Description of the
torcetrapib series of cholesteryl ester transfer protein inhibitors, including mechanism of
action.. J Lipid Res, 47(3): 537-552.
Clark RW, SutfinTA, Ruggeri RB, Willauer AT, Sugarman ED, Magnus-Aryitey G,
Cosgrove PG, Sand TM, Wester RT, Williams JA, Perlman ME, and Bamberger MJ.
(2004) Raising high-density lipoprotein in humans through inhibition of cholesteryl ester
transfer protein: an initial multi-dose study in humans. Arterioscler. Thromb. Vasc. Biol.
24: 490-497.
Dalvie DK and Ruggeri RB. (2005) Preparation of quinoline glucuronides as cholesteryl
ester transfer protein (CETP) inhibitors and metabolites. PCT Int. Appl. WO
2005033082 A2 pp 1-45.
Doering WE and Pasternak VZ (1950) Mechanism of the decarboxylation of α-
pyridylacetic acid. J. Am. Chem. Soc. 72: 143-147.
This article has not been copyedited and formatted. The final version may differ from this version.DMD Fast Forward. Published on August 11, 2008 as DOI: 10.1124/dmd.108.023176
at ASPE
T Journals on D
ecember 22, 2018
dmd.aspetjournals.org
Dow
nloaded from
DMD # 23176
34
Fang J, McKay G, Song J, Remillrd A, Li X, and Midha K (2001) In Vitro
Characterization of the Metabolism of Haloperidol Using Recombinant Cytochrome
P450 Enzymes and Human Liver Microsomes Drug Metab. Dispos. 29: 1638-1643.
Gu C, Collins R, Holsworth DD, Walker GS and Voorman RL. (2006) Metabolic
aromatization of N-Alkyl-1,2,3,4-tetrahydroquinoline substructures to quinolinium by
human liver microsomes and horseradish peroxidase. Drug Metab Dispos, 34: 2044-
2055.
Hall LR, and Hanzlik RP (1991) N-Dealkylation of tertiary amides by cytochrome P450.
Xenobiotica 21: 1127-1138.
Hamliton RA, Garnett WR, and Kline BJ. (1981) Determination of mean valproic acid
serum level by assay of a single pooled sample. Clin. Pharmacol. Ther. 29: 408-413.
Hey J, and Tolando R. (2000) The oxidation of tertiary amides: mechanistic aspects. J.
Chem. Soc. Perkin Trans. 2 2328-2336.
Howes LG, and Kostner K. (2007) The withdrawal of torcetrapib from drug
development: implications for the future of drugs that alter HDL metabolism. Expert
Opin. Investig. Drugs 16: 1509-1516.
Khanna R, Morton CL, Danks MK, and Potter PM. (2000) Proficient Metabolism of
Irinotecan by a Human Intestinal Carboxylesterase. Cancer Res. 60: 4725-4728.
Labroo RB, Thummel KE, Kunze KL, Podoll T, Trager WF, and Kharash ED. (1995)
Catalytic role of cytochrome P4503A4 in multiple pathways of alfentanil metabolism.
Drug Metab. Dispos. 23: 490-496.
Mckenney JM, Davidson MH, Shear CL, and Revkin JH. (2006) Efficacy and safety of
torcetrapib, a novel cholesteryl ester transfer protein inhibitor, in individuals with below-
This article has not been copyedited and formatted. The final version may differ from this version.DMD Fast Forward. Published on August 11, 2008 as DOI: 10.1124/dmd.108.023176
at ASPE
T Journals on D
ecember 22, 2018
dmd.aspetjournals.org
Dow
nloaded from
DMD # 23176
35
average high-density lipoprotein cholesterol levels on a background of atorvastatin. J.
Am. Coll. Cardiol. 48: 1782-1790.
Morino A, Nakamura A, Nakanishi K, Tatewaki N, and Sugiyama M. (1985) Species
differences in the disposition and metabolism of camazepam. Xenobiotica 15: 1033-
1043.
Quinney SK, Sanghani SP, Davis WI, Hurley TD, Sun Z, Murry DJ, and Bosron WF.
(2005) Hydrolysis of capecitabine to 5’-deoxy-5-fluorocytidine by human
carboxylesterases and inhibition by loperamide. J. Pharmacol. Expt. Ther. 313: 1011-
1016
Yumibe N, Huie K, Chen K-J, Snow M, Clement RP, and Cyen MN. (1996) Identification
of human liver cytochrome P450 enzymes that metabolize the non-sedating
antihistamine loratadine. Biochem. Pharmacol. 51: 165-172.
This article has not been copyedited and formatted. The final version may differ from this version.DMD Fast Forward. Published on August 11, 2008 as DOI: 10.1124/dmd.108.023176
at ASPE
T Journals on D
ecember 22, 2018
dmd.aspetjournals.org
Dow
nloaded from
DMD # 23176
36
Footnotes:
Current Address:
1Arena Pharmaceuticals, San Diego CA;
2Genentech, San Fransisco, CA.
This article has not been copyedited and formatted. The final version may differ from this version.DMD Fast Forward. Published on August 11, 2008 as DOI: 10.1124/dmd.108.023176
at ASPE
T Journals on D
ecember 22, 2018
dmd.aspetjournals.org
Dow
nloaded from
DMD # 23176
37
Figure Legends
Figure 1 Mean urine and fecal cummulative recovery of total radioactivity versus
time profile after a single oral administration of 120 mg (92 µCi) of
[14C]Torcetrapib to healthy male volunteers (n=6) over 504 h.
Figure 2 Mean plasma concentration-time profiles for total radioactivity, torcetrapib
and BTFMBA following a single oral administration of [14C]Torcetrapib
(120 mg, 92 µCi) to healthy male subjects (n=6).
Figure 3 Representative HPLC radiochromatogram of a pooled human urine
following single oral administration of [14C]Torcetrapib to healthy male
volunteers at a dose of 120 mg (92 µCi).
Figure 4 Representative radiochromatogram of a pooled human feces following
single oral administration of [14C]Torcetrapib to healthy male volunteers at
a dose of 120 mg (92 µCi).
Figure 5 HPLC radiochromatogram of human plasma after single oral
administration of [14C]torcetrapib to healthy male volunteers at a dose of
120 mg (92 µCi).
Figure 6 HPLC-MS reconstructed ion chromatograms from liver microsomal
incubation mixtures for M24 and 1.
Panel A: observation of M3 generated from M2; Panel B: observation of M4 and M9
generated from M24; Panel C: control for panel A; Panel D: control for panel B. Panel
E: observation of M3 generated from 1; Panel F: observation of M17 generated from 1;
Panel G: observation of M4 and M9 generated from 1; Panel H: control for panel E;
Panel I: control for panel F; panel J: control for panel G.
This article has not been copyedited and formatted. The final version may differ from this version.DMD Fast Forward. Published on August 11, 2008 as DOI: 10.1124/dmd.108.023176
at ASPE
T Journals on D
ecember 22, 2018
dmd.aspetjournals.org
Dow
nloaded from
DMD # 23176
38
Table 1. Recovery of total radioactivity in urine and feces after single oral
administration of 120 mg (92 µCi) of [14C]Torcetrapib.
Total Percent of Dose Excreted in 504 h Subjects 1 2 3 4 5 6 Mean SD
Urine 70.5 61.9 64.4 58.5 52.4 70.1 63 7.0 Feces 12.2 13.1 15.4 6.9 13 15.5 12.7 3.1
Total 82.7 75.1 79.8 65.4 65.4 85.6 75.7 8.7
This article has not been copyedited and formatted. The final version may differ from this version.DMD Fast Forward. Published on August 11, 2008 as DOI: 10.1124/dmd.108.023176
at ASPE
T Journals on D
ecember 22, 2018
dmd.aspetjournals.org
Dow
nloaded from
DMD # 23176
39
Table 2. Individual and mean pharmacokinetic parameters of total circulating
radioactivity, torcetrapib and metabolite M1 in healthy male volunteers following oral
administration of [14C]Torcetrapib to healthy male volunteers (n=6) at a dose of 120 mg
(92 µCi).
Subjects Tmax Cmax AUC0-tlast AUC0-inf T1/2
(h) (ng/mL) (ng-h/mL) (ng-h/mL) (h)
Radioactivity 1 4 2650 53300 69600 331 2 4 1980 63300 117000 657 3 6 2040 57000 59700 108 4 6 2600 88800 130000 424 5 6 2780 108000 139000 322 6 12 1400 91500 133000 395
Mean 6.3 2240 77000 108000 373 SD 2.9 530 22200 34500 178
Torcetrapib
1 6.0 859 8470 9070 218 2 6.0 596 5880 6160 117 3 8.0 383 6920 7730 222 4 6.0 509 8230 9030 225 5 6.0 694 5590 6060 277 6 6.0 413 7020 7350 204
Mean 6.3 576 7020 7570 211 SD 0.8 180 1180 1320 52
Metabolite M1
1 12 2530 366000 384000 117 2 24 2610 380000 397000 109 3 24 3680 535000 558000 109 4 24 3660 479000 498000 112 5 36 2810 450000 473000 115 6 24 2250 367000 399000 137
Mean 24 2920 430000 452000 117 SD 7.6 606 69800 69600 11
a The plasma concentrations for total radioactivity were expressed in ng-equiv/mL.
This article has not been copyedited and formatted. The final version may differ from this version.DMD Fast Forward. Published on August 11, 2008 as DOI: 10.1124/dmd.108.023176
at ASPE
T Journals on D
ecember 22, 2018
dmd.aspetjournals.org
Dow
nloaded from
DMD # 23176
40
Table 3. Individual and mean percentage of urinary and fecal metabolites of torcetrapib
in healthy male volunteers (n=6) following oral administration of [14C]Torcetrapib at a
dose of 120 mg (92 µCi).
Metabolites Percent of Dose Excreted in Subjects 1 2 3 4 5 6 Mean SD Feces
M25 1.1 1.2 1.7 0.5 1.2 1.1 1.1 0.4 M24 0.9 0.6 1.4 0.5 1.1 1.2 0.9 0.4
M7 & M6A 1.6 1 1.8 0.7 1.9 2 1.5 0.5
M12 & M13 2.4 2.2 2.3 1.4 3.1 4.2 2.6 1.0 M6B 1.0 1.0 1.2 0.6 0.9 1.2 1.0 0.2
Torcetrapib 5.2 7 5.8 2.9 4.4 5.6 5.2 1.4
Urine M5A 0.9 1.5 1.1 0.8 ND ND 0.7 0.6 M5B 2.7 1.5 1.3 1.6 2.1 2.8 2.0 0.6 M11A 6.9 5.8 7.1 6.2 9 10.1 7.5 1.7 M11B 3.9 4.1 4.8 4.8 5.7 5.6 4.8 0.7 M11C 1.6 0.8 1.5 0 2.3 1.6 1.3 0.8 M11D 6.8 4.1 4.4 3.8 2.8 4.9 4.4 1.4
M4 36.4 25.5 31.1 28.7 20.5 29.9 28.7 5.4 M22 6.7 14.4 7.5 9 3.2 8.3 8.2 3.7
BTFMBA (M1)a 5.0 4.0 9.0 11.0 5.5 5.0 6.6 2.8
ND – Not detected
a Percent of dose of BTFMBA excreted in urine was determined by analyzing M1 in the
urine and converting it to % of dose as described in the methods section.
This article has not been copyedited and formatted. The final version may differ from this version.DMD Fast Forward. Published on August 11, 2008 as DOI: 10.1124/dmd.108.023176
at ASPE
T Journals on D
ecember 22, 2018
dmd.aspetjournals.org
Dow
nloaded from
DMD # 23176
41
Table 4. Individual and mean percentage of circulating metabolites of torcetrapib in
healthy male volunteers (n=6) following oral administration of [14C]Torcetrapib at a dose
of 120 mg (92 µCi).
Metabolites % of Total Circulating Radioactivity in Subjects 1 2 3 4 5 6 Mean SD
M3 2.5 5.3 7 12.1 9.6 6.7 7.2 3.3 M4 66.9 71.5 63.9 54.4 67.2 55.3 63.2 6.9 M2 4.5 2.4 2.5 3.4 1.5 4.5 3.1 1.2
Torcetrapib 26.1 16.2 21.7 19.1 12.6 33.5 21.5 7.5
This article has not been copyedited and formatted. The final version may differ from this version.DMD Fast Forward. Published on August 11, 2008 as DOI: 10.1124/dmd.108.023176
at ASPE
T Journals on D
ecember 22, 2018
dmd.aspetjournals.org
Dow
nloaded from
DMD # 23176
42
Table 5. Enzyme kinetics of the conversion of torcetrapib to its major initial
decarbamoylated metabolite M2.
pooled human liver microsomes
recombinant CYP3A4
recombinant CYP3A5
Parameter Mean ± SD Mean ± SD Mean ± SD
KM (µM) 2.9 ± 0.4 1.8 ± 0.5 0.35 ± 0.06 Vmax (nmol/min/mg) 1.3 ± 0.1 0.51 ± 0.08 0.21 ± 0.02 CLint (µL/min/mg) 430 ± 20 290 ± 40 610 ± 80
Ks (µM) 52 ± 17 57 ± 5 190 ± 60
This article has not been copyedited and formatted. The final version may differ from this version.DMD Fast Forward. Published on August 11, 2008 as DOI: 10.1124/dmd.108.023176
at ASPE
T Journals on D
ecember 22, 2018
dmd.aspetjournals.org
Dow
nloaded from
DMD # 23176
43
Table 6. Summary of metabolites observed in in vitro incubations with human liver
subcellular fractions.a
Microsomes + NADPH Substrate
S9+NAD
Product m/z M24 1 M3 M17 M17
1 226 - n/a n/a n/a n/a
M9 242 + + n/a n/a n/a
M3 212 + + n/a n/a n/a
M17 228 - + + n/a n/a
M4 242 + + + + +
aSymbol “+” designates observation of the metabolite by mass spectrometry; n/a is not
applicable
This article has not been copyedited and formatted. The final version may differ from this version.DMD Fast Forward. Published on August 11, 2008 as DOI: 10.1124/dmd.108.023176
at ASPE
T Journals on D
ecember 22, 2018
dmd.aspetjournals.org
Dow
nloaded from
DMD # 23176
44
Scheme 1. Structure of torcetrapib.
N
O O
NO
O
CF3F3C
F3C*
Asterisk indicates the site of radiolabel
This article has not been copyedited and formatted. The final version may differ from this version.DMD Fast Forward. Published on August 11, 2008 as DOI: 10.1124/dmd.108.023176
at ASPE
T Journals on D
ecember 22, 2018
dmd.aspetjournals.org
Dow
nloaded from
DMD # 23176
45
Scheme 2 Mass Spectral fragmentation and structures of torcetrapib and its
proposed metabolites.
Metabolites [M+H]+
Torcetrapib 618 (M+NH4)+ 601 (-NH3) 300 254 228
M2 529 228 200
M3 212 196
M4 242 224 196
M5 A & B 418 400 242 224 196
M6 A & B 545 527 244 200
M7 559 258 198
Fragment Ions
N
O O
NO
O
CF3F3C
F3C
300
228254
NH
NO
O
CF3F3C
F3C228
200
N
F3C
CH3
196
N
F3C
C
196
O
OH
224
N
F3C
C
196
O
O
224
OHO2C
OHOH
HO
242
NH
NO
O
CF3F3C
F3C
OH 244
200
NH
NO
O
CF3F3C
F3C
CO2H258
198
This article has not been copyedited and formatted. The final version may differ from this version.DMD Fast Forward. Published on August 11, 2008 as DOI: 10.1124/dmd.108.023176
at ASPE
T Journals on D
ecember 22, 2018
dmd.aspetjournals.org
Dow
nloaded from
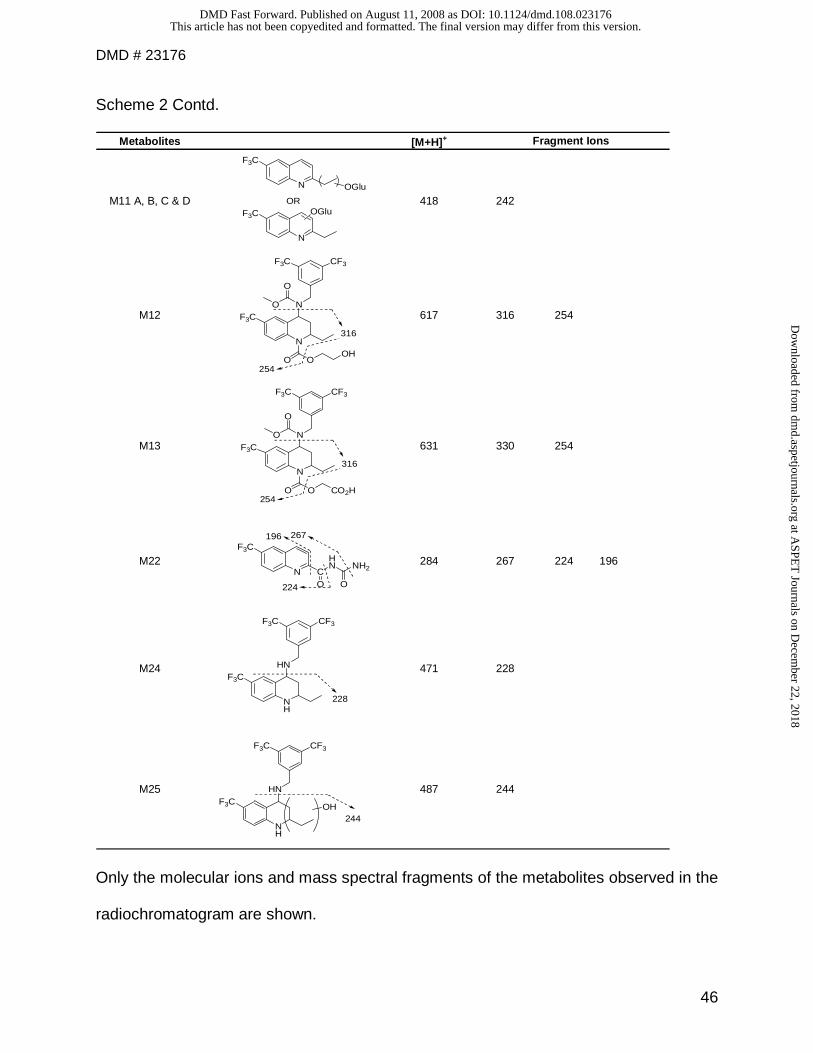
DMD # 23176
46
Scheme 2 Contd.
Metabolites [M+H]+
M11 A, B, C & D 418 242
M12 617 316 254
M13 631 330 254
M22 284 267 224 196
M24 471 228
M25 487 244
Fragment Ions
N
F3C
OGlu
N
F3C OGluOR
N
O
NO
O
CF3F3C
F3C
OOH
316
254
N
O
NO
O
CF3F3C
F3C
O CO2H
316
254
N
F3C
CO
HN NH2
O
267
224
196
NH
HN
CF3F3C
F3C
228
NH
HN
CF3F3C
F3COH
244
Only the molecular ions and mass spectral fragments of the metabolites observed in the
radiochromatogram are shown.
This article has not been copyedited and formatted. The final version may differ from this version.DMD Fast Forward. Published on August 11, 2008 as DOI: 10.1124/dmd.108.023176
at ASPE
T Journals on D
ecember 22, 2018
dmd.aspetjournals.org
Dow
nloaded from
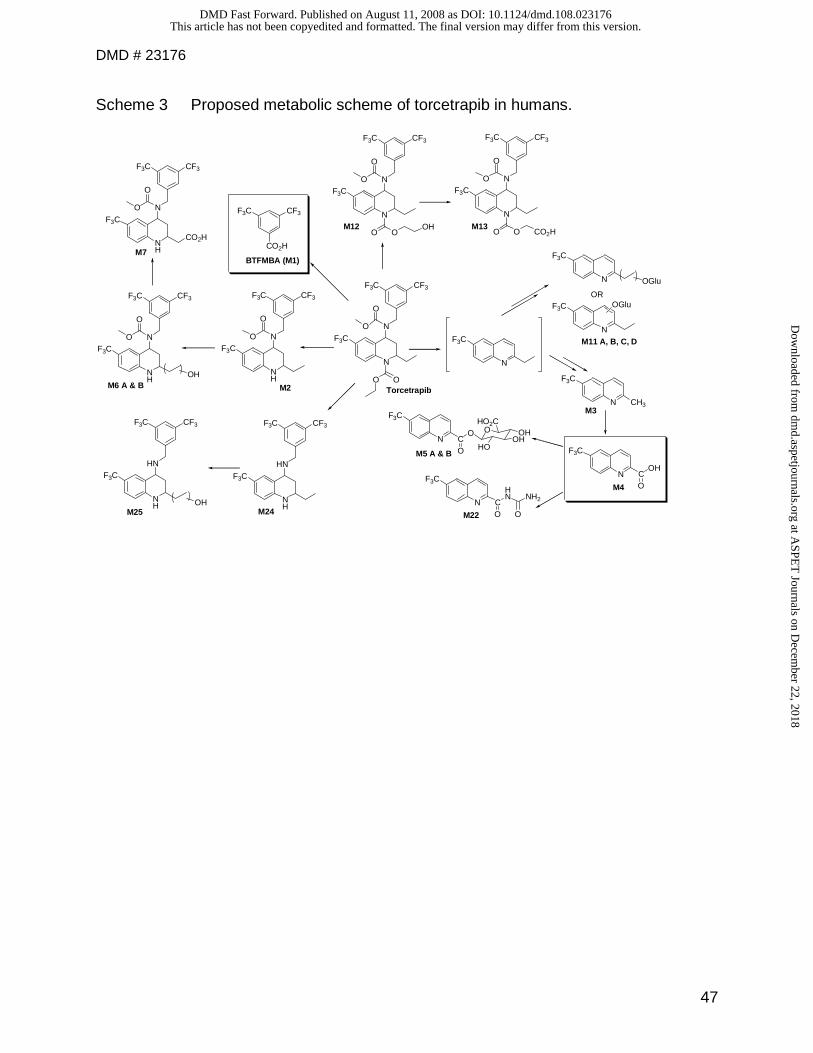
DMD # 23176
47
Scheme 3 Proposed metabolic scheme of torcetrapib in humans.
N
O O
NO
O
CF3F3C
F3C
NH
NO
O
CF3F3C
F3C
N
F3C
CH3
N
F3C
CO
O OHO2C
OHOH
HO
NH
NO
O
CF3F3C
F3C
OH
NH
NO
O
CF3F3C
F3C
CO2H
N
O
NO
O
CF3F3C
F3C
OOH
N
O
NO
O
CF3F3C
F3C
O CO2H
N
F3C
OGlu
N
F3C OGluOR
N
F3C
CO
HN NH2
O
NH
HN
CF3F3C
F3C
NH
HN
CF3F3C
F3C
TorcetrapibM2M6 A & B
M7
M12 M13
CF3F3C
CO2H
BTFMBA (M1)
M24M25
N
F3C
CO
OH
N
F3C
M4
M3
M22
M5 A & B
M11 A, B, C, D
OH
This article has not been copyedited and formatted. The final version may differ from this version.DMD Fast Forward. Published on August 11, 2008 as DOI: 10.1124/dmd.108.023176
at ASPE
T Journals on D
ecember 22, 2018
dmd.aspetjournals.org
Dow
nloaded from
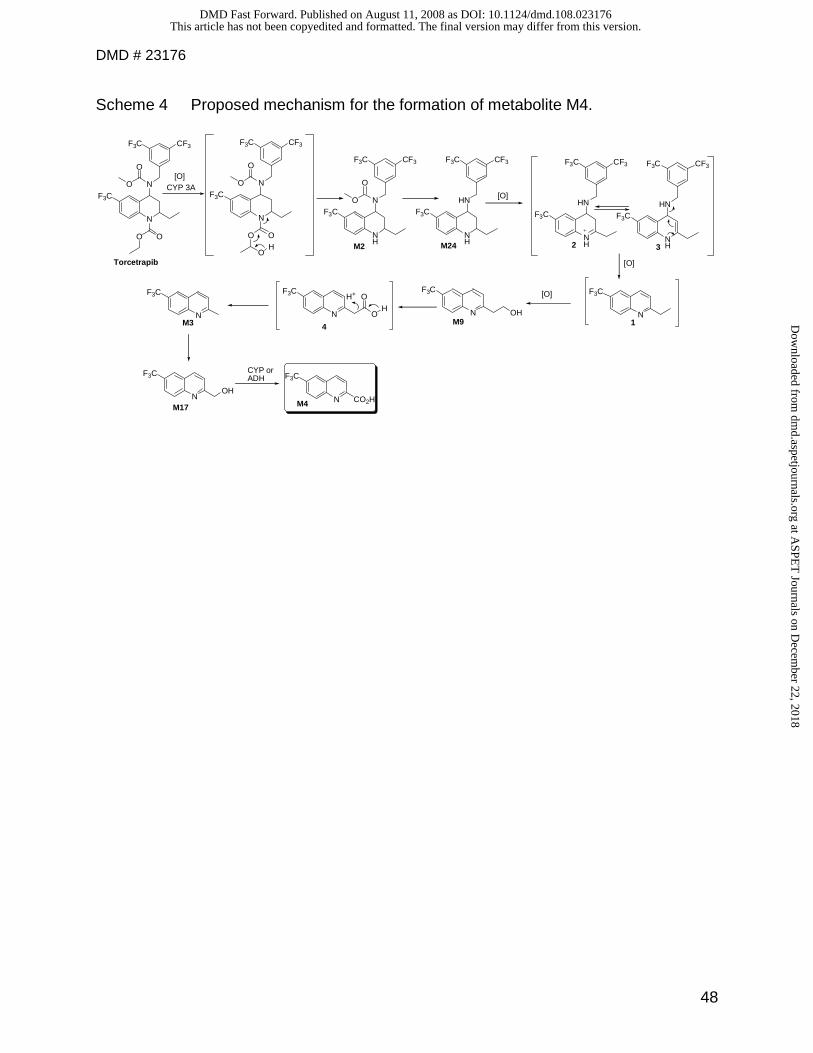
DMD # 23176
48
Scheme 4 Proposed mechanism for the formation of metabolite M4.
N
O O
NO
O
CF3F3C
F3C
N
O O
NO
O
CF3F3C
F3C
OH
NH
HN
CF3F3C
F3C
NH
HN
CF3F3C
F3C
NH
HN
CF3F3C
F3C
N
F3C
N
F3C
OHN
F3C
N
F3C
CO2HM4
[O]
N
F3C
OH
M17
M3 M9
[O]
1
Torcetrapib
N
F3C
4
2 3
CYP 3A
CYP orADH
M24
[O]
[O]
NH
N
CF3F3C
F3CO
O
M2
O
O
H
H+
This article has not been copyedited and formatted. The final version may differ from this version.DMD Fast Forward. Published on August 11, 2008 as DOI: 10.1124/dmd.108.023176
at ASPE
T Journals on D
ecember 22, 2018
dmd.aspetjournals.org
Dow
nloaded from
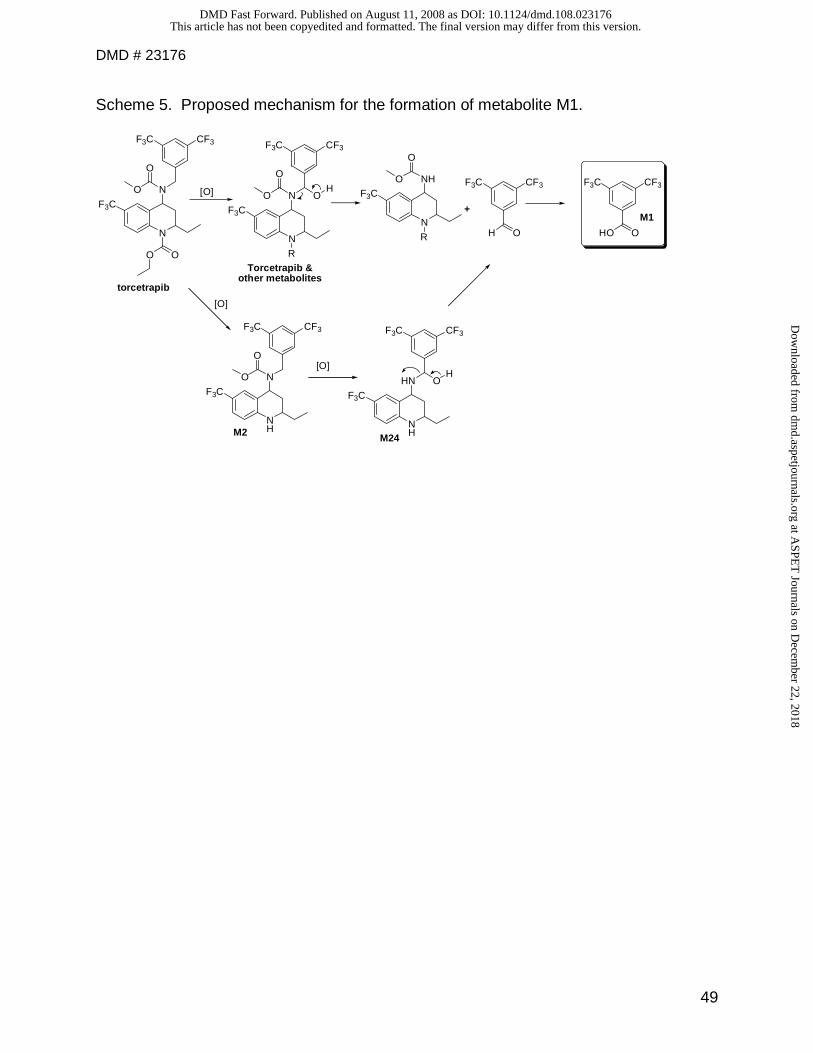
DMD # 23176
49
Scheme 5. Proposed mechanism for the formation of metabolite M1.
N
O O
NO
O
CF3F3C
F3C
N
NO
O
CF3F3C
F3C
R
OH
N
NHO
O
CF3F3CF3C
R O
CF3F3C
OH HO
+M1
torcetrapib
Torcetrapib & other metabolites
[O]
NH
NO
O
CF3F3C
F3C
M2NH
HN
CF3F3C
F3C
M24
OH
[O]
[O]
This article has not been copyedited and formatted. The final version may differ from this version.DMD Fast Forward. Published on August 11, 2008 as DOI: 10.1124/dmd.108.023176
at ASPE
T Journals on D
ecember 22, 2018
dmd.aspetjournals.org
Dow
nloaded from
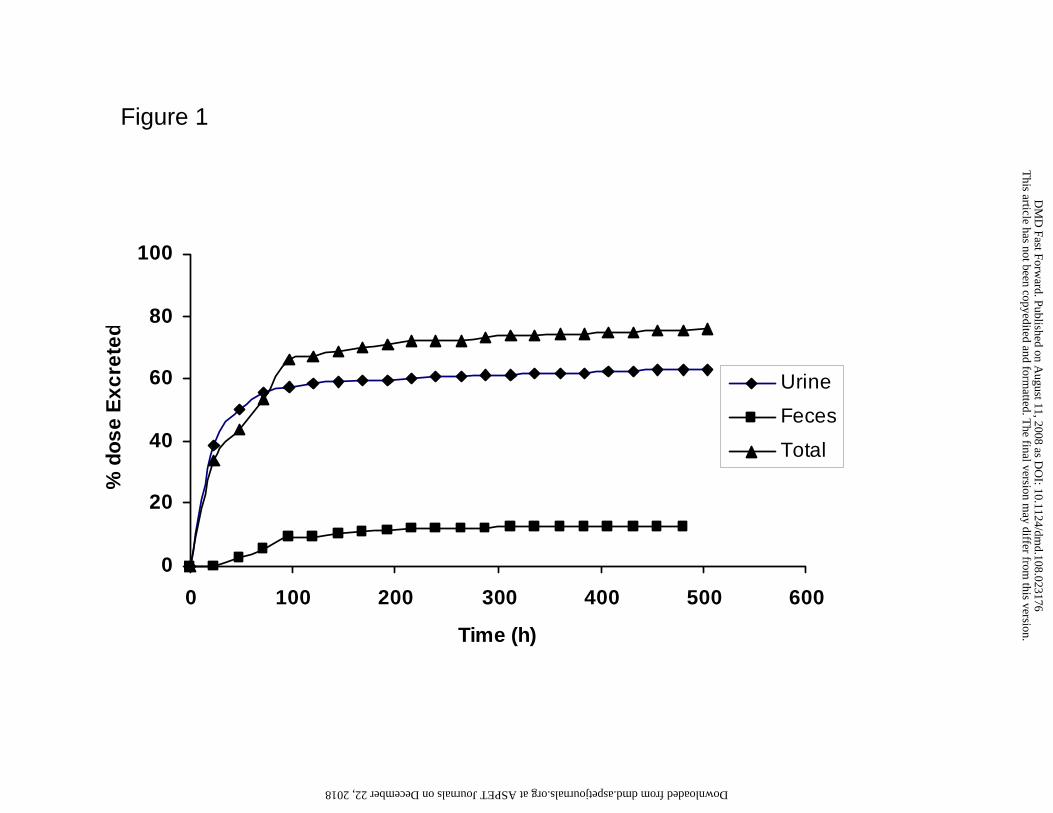
0
20
40
60
80
100
0 100 200 300 400 500 600
Time (h)
% d
ose
Exc
rete
d
Urine
Feces
Total
Figure 1
This article has not been copyedited and form
atted. The final version m
ay differ from this version.
DM
D Fast Forw
ard. Published on August 11, 2008 as D
OI: 10.1124/dm
d.108.023176 at ASPET Journals on December 22, 2018 dmd.aspetjournals.org Downloaded from

Figure 2
1
10
100
1000
10000
0 100 200 300 400 500 600
Time (h)
Pla
sma
Co
nce
ntr
atio
ns
Total Radioactivity (ng-equiv/mL)
Torcetrapib (ng/mL)
BTFMBA (ng/mL)
This article has not been copyedited and form
atted. The final version m
ay differ from this version.
DM
D Fast Forw
ard. Published on August 11, 2008 as D
OI: 10.1124/dm
d.108.023176 at ASPET Journals on December 22, 2018 dmd.aspetjournals.org Downloaded from
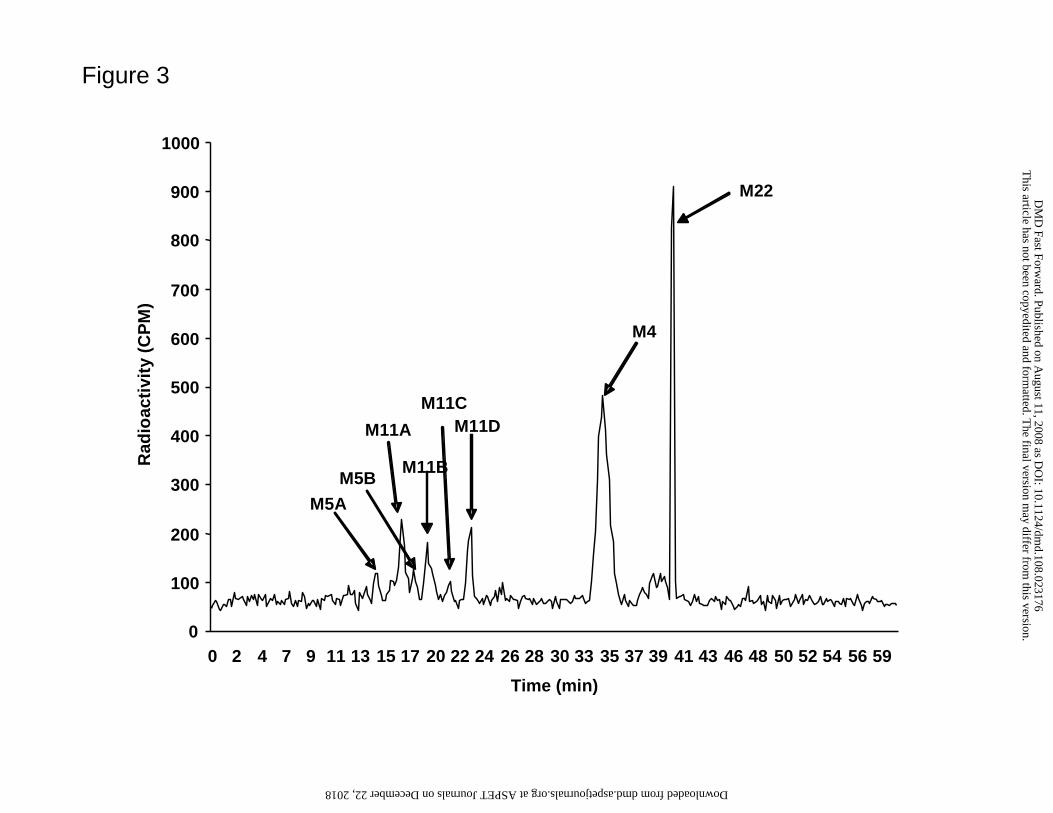
Figure 3
0
100
200
300
400
500
600
700
800
900
1000
0 2 4 7 9 11 13 15 17 20 22 24 26 28 30 33 35 37 39 41 43 46 48 50 52 54 56 59
Time (min)
Rad
ioac
tivi
ty (
CP
M)
M4
M22
M11BM5B
M5A
M11A
M11CM11D
This article has not been copyedited and form
atted. The final version m
ay differ from this version.
DM
D Fast Forw
ard. Published on August 11, 2008 as D
OI: 10.1124/dm
d.108.023176 at ASPET Journals on December 22, 2018 dmd.aspetjournals.org Downloaded from
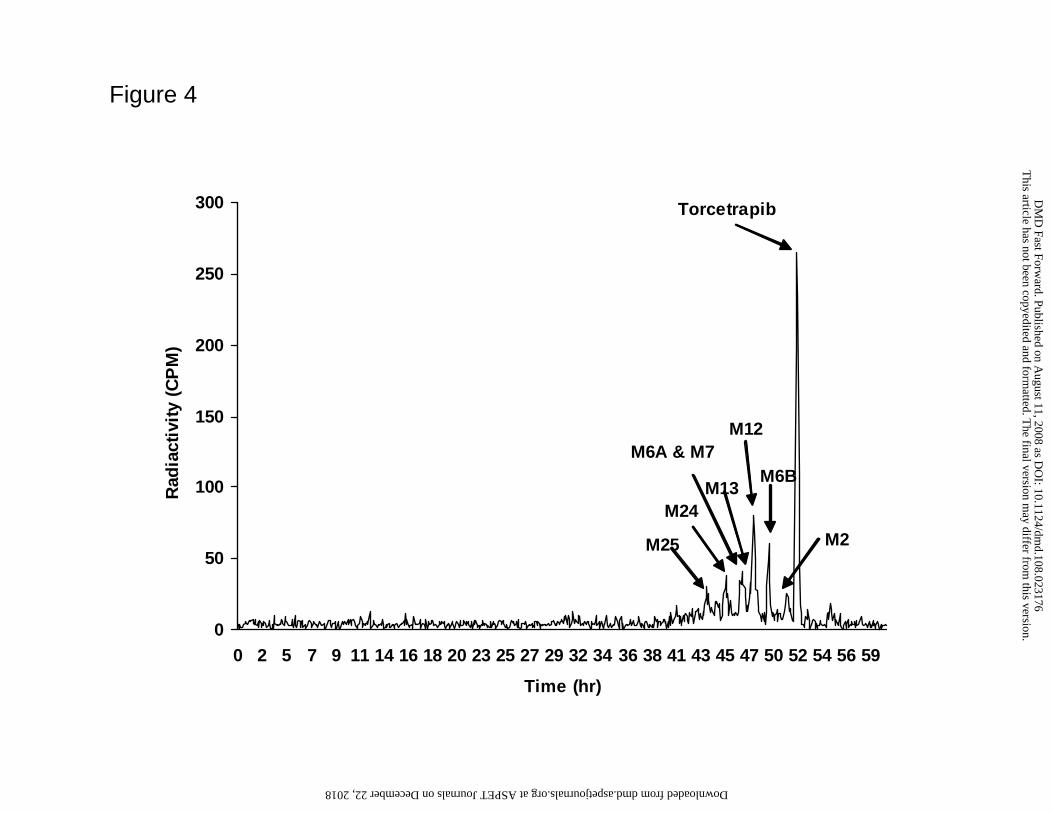
Figure 4
0
50
100
150
200
250
300
0 2 5 7 9 11 14 16 18 20 23 25 27 29 32 34 36 38 41 43 45 47 50 52 54 56 59
Time (hr)
Rad
iact
ivit
y (C
PM
)
M6B
M2
Torcetrapib
M25
M12M6A & M7
M24M13
This article has not been copyedited and form
atted. The final version m
ay differ from this version.
DM
D Fast Forw
ard. Published on August 11, 2008 as D
OI: 10.1124/dm
d.108.023176 at ASPET Journals on December 22, 2018 dmd.aspetjournals.org Downloaded from
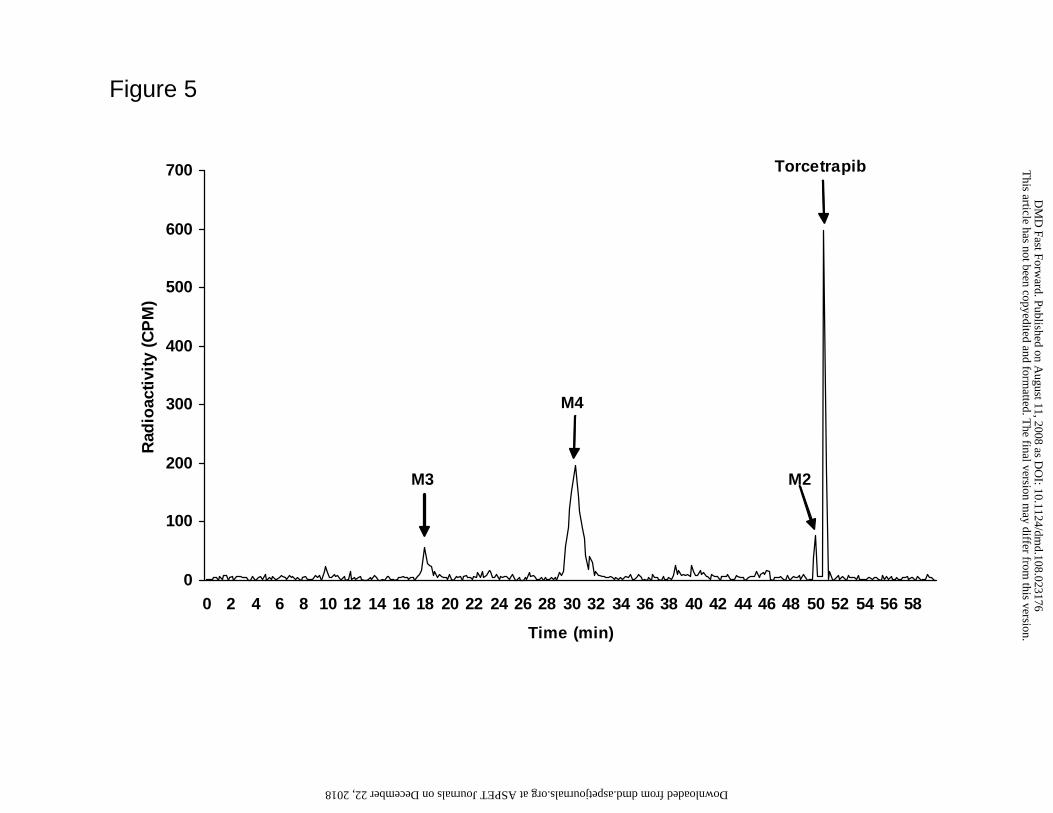
Figure 5
0
100
200
300
400
500
600
700
0 2 4 6 8 10 12 14 16 18 20 22 24 26 28 30 32 34 36 38 40 42 44 46 48 50 52 54 56 58
Time (min)
Rad
ioac
tivi
ty (
CP
M)
Torcetrapib
M2M3
M4
This article has not been copyedited and form
atted. The final version m
ay differ from this version.
DM
D Fast Forw
ard. Published on August 11, 2008 as D
OI: 10.1124/dm
d.108.023176 at ASPET Journals on December 22, 2018 dmd.aspetjournals.org Downloaded from
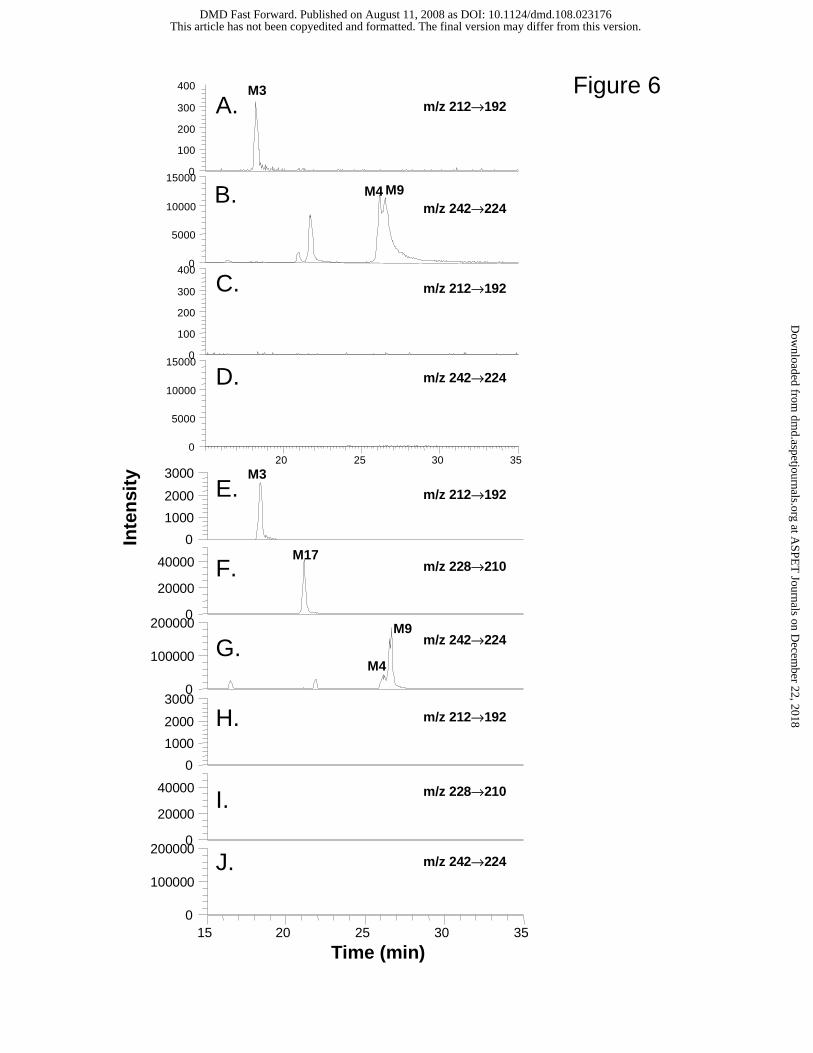
m/z 212→192
m/z 212→192
m/z 242→224
m/z 242→224
M3
M4 M9
A.
B.
C.
D.
20 25 30 350
5000
10000
150000
100
200
300
4000
5000
10000
15000
Inte
nsi
ty
0
100
200
300
400
m/z 212→192
m/z 212→192
m/z 228→210
m/z 228→210
m/z 242→224
m/z 242→224
M3
M17
M9
M4
E.
F.
G.
H.
I.
J.
15 20 25 30 35
Time (min)
0
100000
2000000
20000
40000
0
1000
2000
30000
100000
2000000
20000
40000
0
1000
2000
3000
Figure 6
This article has not been copyedited and formatted. The final version may differ from this version.DMD Fast Forward. Published on August 11, 2008 as DOI: 10.1124/dmd.108.023176
at ASPE
T Journals on D
ecember 22, 2018
dmd.aspetjournals.org
Dow
nloaded from