1 predicting success and risk: multi-spell analyses of student graduation, departure and return roy...
Post on 19-Dec-2015
214 views
TRANSCRIPT
1
Predicting Success and Risk:
Multi-spell Analyses of Student Graduation, Departure and Return
Roy Mathew
Director
Center for Institutional Evaluation Research and Planning (CIERP)

2
Presentation Outline
Introduction Factors that affect graduation within six
years Factors that affect departure and
reenrollment Risk groups and associated trends Implications, and areas for future research

3
Introduction
Institutional Evaluation Questions What more can the institution do to improve degree
completion rates? Can we improve the effectiveness of our current
initiatives?
Research Questions: What factors explain graduation from UTEP within six
years? What factors explain the behavior of student departure? What factors explain students’ return after initial stop-
out?
4
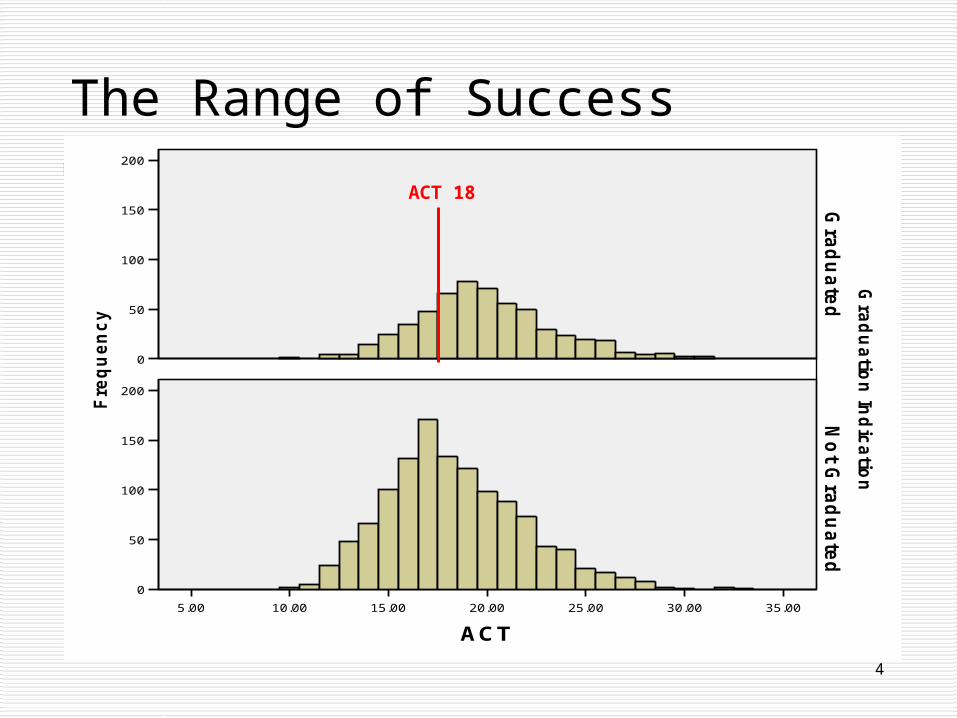
The Range of Success
35.0030.0025.0020.0015.0010.005.00
ACT
200
150
100
50
0
Fre
qu
en
cy
200
150
100
50
0
No
t Gra
du
ate
dG
rad
ua
ted
Gra
du
atio
n In
dic
atio
n
ACT 18

5
Impact of Selectivity
ACT 18

6
Predictors of Graduation

7
Method of Determining Predictors of Graduation
Stepwise logistic regression model Fall 1999 and Fall 2000 first-time student cohorts Variables were added in four steps:
demographic variables academic preparation for college New student survey data first semester academic performance
21 variables were used in the model.
8
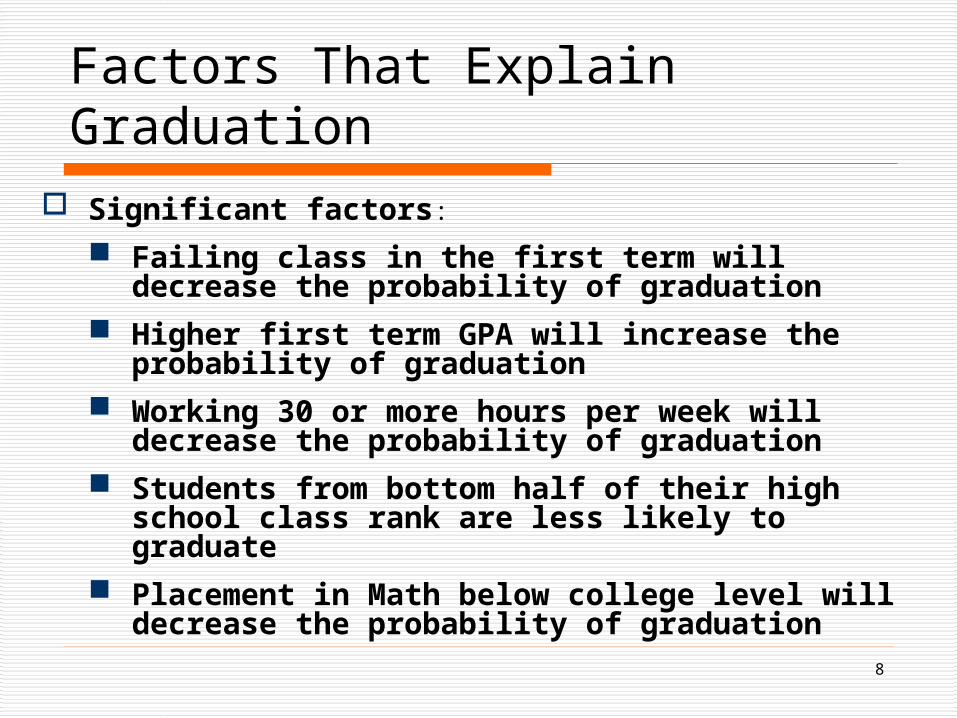
Factors That Explain Graduation
Significant factors:
Failing class in the first term will decrease the probability of graduation
Higher first term GPA will increase the probability of graduation
Working 30 or more hours per week will decrease the probability of graduation
Students from bottom half of their high school class rank are less likely to graduate
Placement in Math below college level will decrease the probability of graduation

9
Modified Method to Determining Factors That Explain Graduation
A longitudinal approach will help assess the effect of performance over time
A proportional sub-distribution hazards model (a class of survival models) was used to examine student graduation under a competing risk setting

10
Factors That Explain Graduation
Survival model results: Higher cumulative GPA increases the probability of
graduation Receiving financial aid (loans, grants and work study)
increases the probability of graduation Failing any class decreases the probability of graduation Enrolling and passing a developmental course did not
decrease a student’s chance of graduation significantly Stopping-out decreases the probability of graduation

11
Factors That Explain Departure

12
Method of Determining Factors that Explain Departure
longitudinal approach Survival model (multi-spell discrete-time logit
model) The hazard is modeled using a logit link function
that will capture the general shape of the hazard profile and the heterogeneity of the hazard caused by different predictor variables.
13
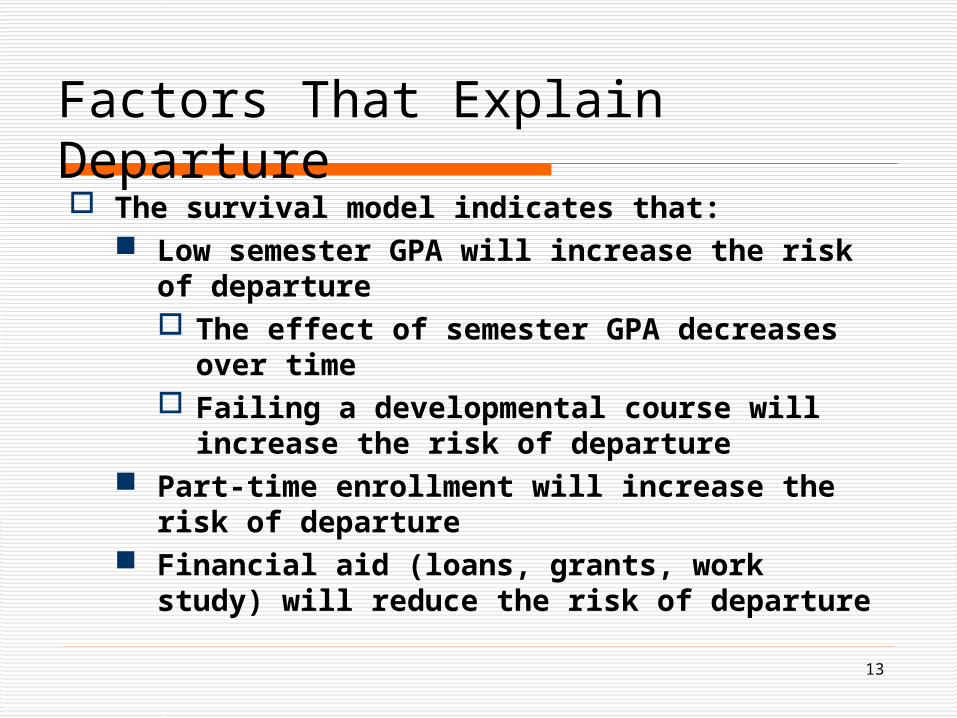
The survival model indicates that: Low semester GPA will increase the risk of
departure The effect of semester GPA decreases over time Failing a developmental course will increase the
risk of departure Part-time enrollment will increase the risk of
departure Financial aid (loans, grants, work study) will reduce
the risk of departure
Factors That Explain Departure
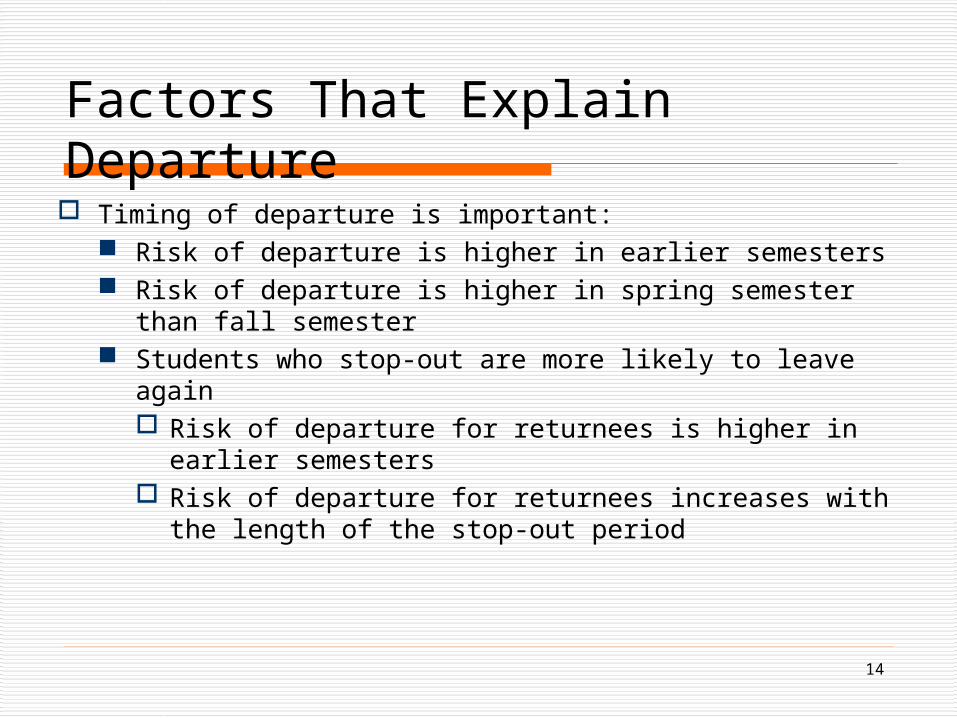
14
Timing of departure is important: Risk of departure is higher in earlier semesters Risk of departure is higher in spring semester than fall
semester Students who stop-out are more likely to leave again
Risk of departure for returnees is higher in earlier semesters
Risk of departure for returnees increases with the length of the stop-out period
Factors That Explain Departure
15
Factors That Explain Reenrollment
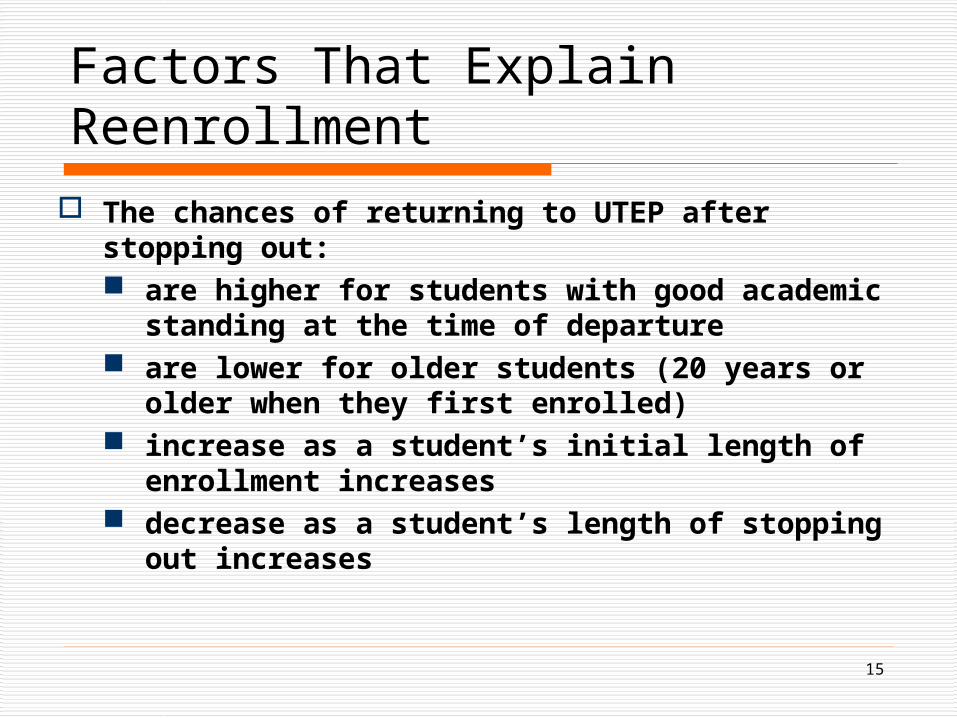
The chances of returning to UTEP after stopping out: are higher for students with good academic standing
at the time of departure are lower for older students (20 years or older when
they first enrolled) increase as a student’s initial length of enrollment
increases decrease as a student’s length of stopping out increases
16
Identifying Students
At Risk of Departure
17
Method for Identifying Students At Risk of Departure
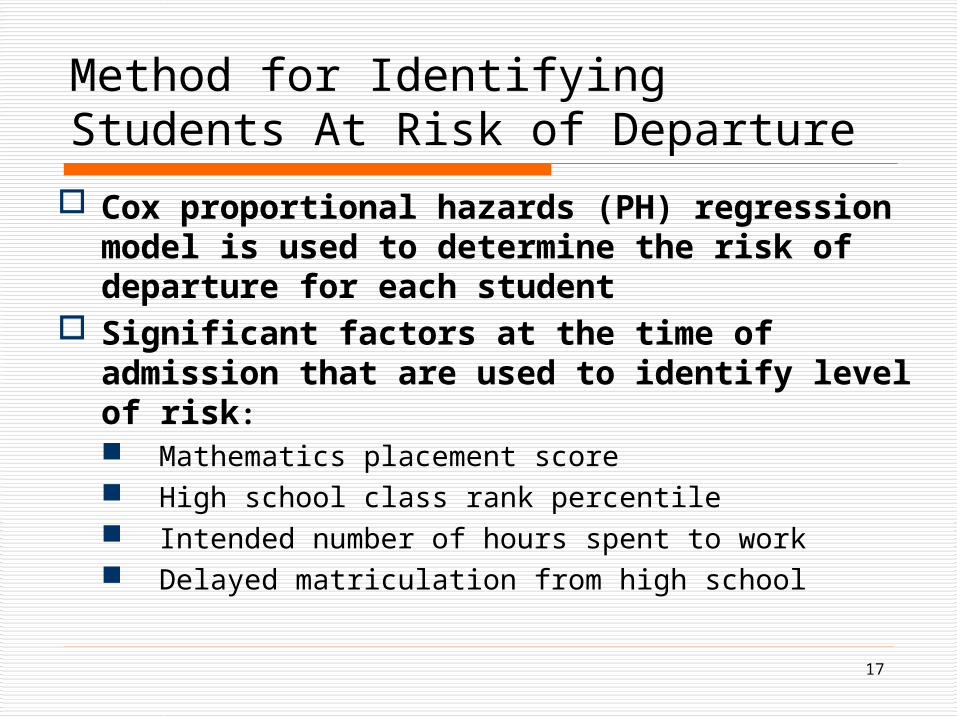
Cox proportional hazards (PH) regression model is used to determine the risk of departure for each student
Significant factors at the time of admission that are used to identify level of risk: Mathematics placement score High school class rank percentile Intended number of hours spent to work Delayed matriculation from high school

18
Assigning Risk Score
Low risk group: Students with 0 risk score with college level math placement top quartile of high school class intend to work less than 20 hours per week Directly matriculated from high school
Medium risk group: Students with a score of less than 1.15 are assigned into medium risk group
High risk group: Students with a score of 1.15 or higher is assigned into high risk group.

19
0 1 2 3 4 5 6
0.0
0.2
0.4
0.6
0.8
1.0
Kaplan-Meier Survival Curve for the Entire Sample
Term
High RiskMedium RiskLow Risk
Survival Trends Associated with Risk Groups (First Three Years)
20
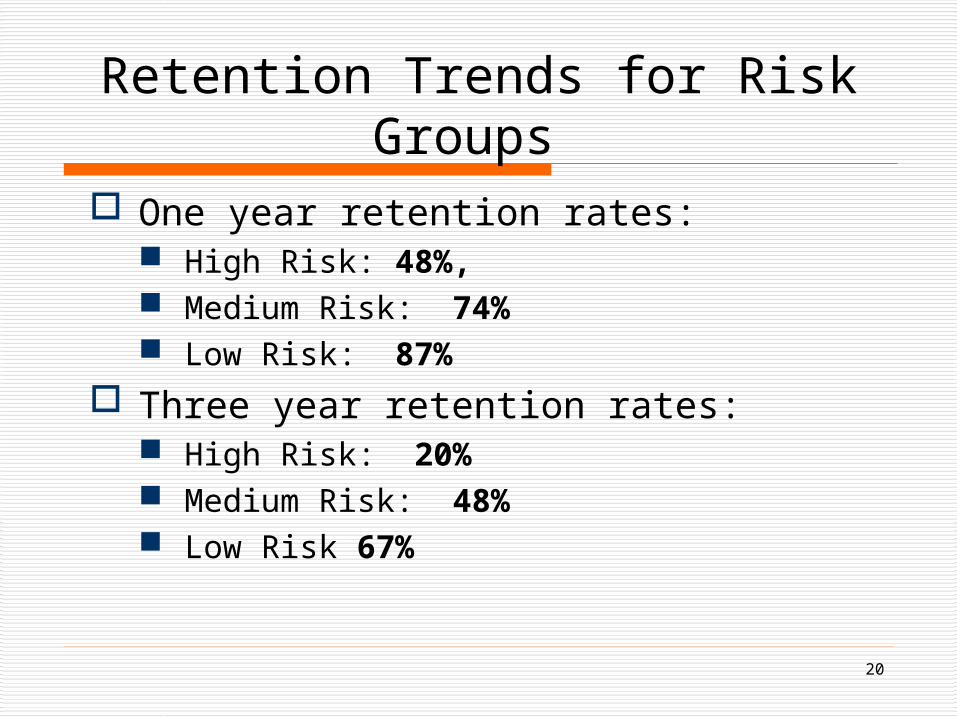
One year retention rates: High Risk: 48%, Medium Risk: 74% Low Risk: 87%
Three year retention rates: High Risk: 20% Medium Risk: 48% Low Risk 67%
Retention Trends for Risk Groups

21
Graduation Trends for Risk Groups
Six year graduation rates: High Risk: 9% Medium Risk: 30% Low Risk: 60%
Graduation rate upon persisting through the first year with cumulative GPA of at least 2.0 High Risk: 25% Medium Risk: 43% Low Risk: 70%

22
Implications and Further Research Implications
Evaluate efficacy of current interventions for each risk group, and modify interventions
Develop tools and methods to track progress during critical periods
Areas for further research Advance understanding of students within each risk
group Explore how ecosystems affect student performance Explore factors that explain the success of transfer
students
23
Student Success Research Team Denise Carrejo, Ph.D. Bereket Weldeslassie, M.S. Thomas Taylor, Ph.D. candidate Myoung Kim, Ph.D. candidate Roy Mathew, Ph.D. Julia Bader, Ph.D. (UTEP Statistical Consulting Lab)
For more information, please email: [email protected]
We gratefully acknowledge the support ofLumina Foundation for Education