1. project goal our final product will be an interactive public website which will allow the user to...
TRANSCRIPT

1
SENIOR DESIGN REVIEW
Modeling Energy System Investment Planning Infrastructure
for the State of Iowa
Advisor / Clients: Dr. James McCalley Venkat Krishnan Joseph Slegers
Team Members: Michael Healy, Deogratius Mpinge, Spenser Mussmann, and Abdelmagid Yousif

2
PROJECT GOAL
Our final product will be an interactive public website
which will allow the user to view various aspects of our
current and future infrastructure. The website interaction
will be simple and easy to use for the general public, but
the implementation and results will give detailed and
accurate investment planning for the next 40 years.

3
ALTERNATIVE ANALYSIS SOFTWARE
Electric Sectoro NEMSo MARKAL/TIMES
Transportation Sectoro CARVER2 o TRAGIS

4
MARKET SURVEY
Investment Planning for State of Iowa for Next Forty Years
Demonstrates Interdependency of Transportation and Electric Generation Sectors
Utilizes Analysis Software Available Only at Iowa State University

5
FUNCTIONAL REQUIREMENTS
Obtaining Datao Energy generationo Consumptiono Transportation
Visualization of the Datao Publicly shown on our websiteo Gives visualization of current energy and
transportation infrastructure

6
FUNCTIONAL REQUIREMENTS
Visualization of the Data cont.o Will extend the previous groups datao Shown on Iowa map with colored lines, coordinate
locations, and pop out information for each point of interest
Future Analysiso Creates a long term infrastructure plan for the state of
Iowao Uses past and current information including predicted
trends.o Shows a 40 year plan with constraints and input variables
specified by the user

7
NON-FUNCTIONAL REQUIREMENTS
Budget limitation o All data collection efforts are limited by a $12,050
budget Must be usable on any computer for a user of any skill
levelo This is done by simple input specifications the user
can manipulate

8
INPUT FILE DESCRIPTION
Electric Generationo Coal, Natural Gas, Nuclear, Hydro, Solar, Wind etc.
Electric Transmissiono 115KV, 161KV, 230KV, and 345KV
Transportationo Passenger, Commodity, Railroad, River

9
FILE LIST
NETPLAN files include o Capacityo Node Listo Emissionso Life Spano Investment Costso Arc Listo Fuel Type

10
ELECTRIC GENERATION
Generation sites of 20MW and up will be modeled
Each power plant will be denoted by a node Nodes are connected with arcs to
transmission nodes and transportation nodes Excel files were created with the necessary
information to run NETPLAN
11
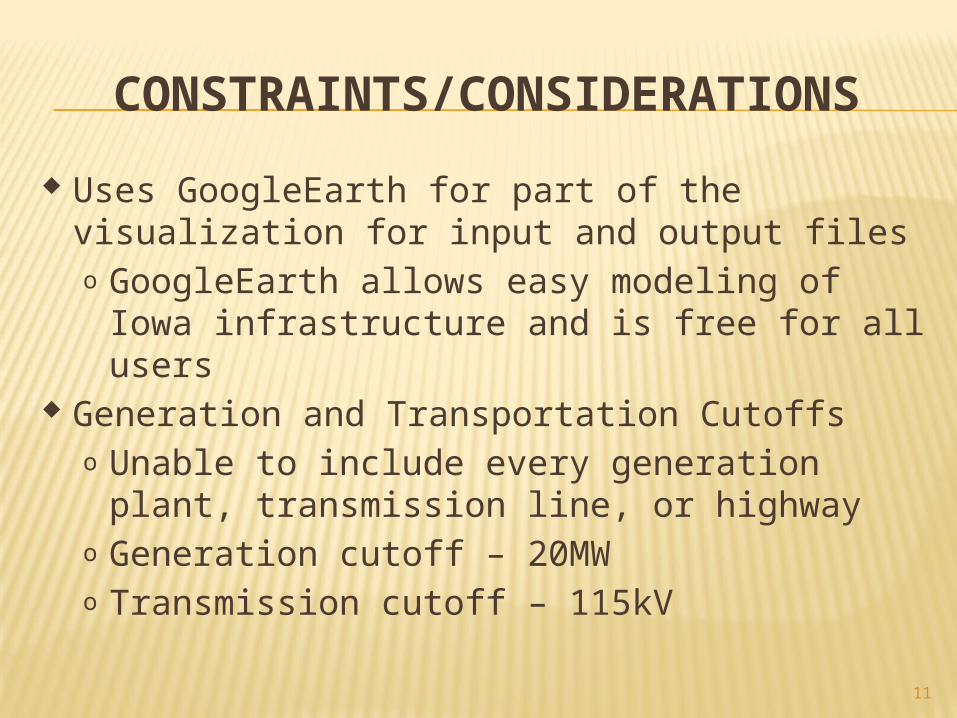
CONSTRAINTS/CONSIDERATIONS
Uses GoogleEarth for part of the visualization for input and output fileso GoogleEarth allows easy modeling of Iowa
infrastructure and is free for all users Generation and Transportation Cutoffs
o Unable to include every generation plant, transmission line, or highway
o Generation cutoff – 20MWo Transmission cutoff – 115kV

12
CONCEPT SKETCH

13
DESIGN PROCESS
.csv data files
Nodes map Created Iowa Data
Our senior design team will collect data of Iowa’s energy infrastructure and transportation. The data will be as points were formatted in Excel spreadsheets.

14
DESIGN PROCESS
KML files stored in ISU server
NETPLAN
KML files will stored on ISU’s server ready to read by the Google Earth implementation in our project’s website. Transmissions lines will not display as point, but will mapped out with Photoshop and save as KML file on ISU’s server as well.

15
DESIGN PROCESS
NETPLANWebsite
The output will be mainly from NETPLAN and will be in three difference formsVisual in Google Earth, graphic in chart area relationship, and Data table in excel.

16
INPUT SPECIFICATION
Input menu will appear from design’s website will allow users to choose different energy Investment scenarios also to run NETPLAN software

17
DESIGN SPECIFICATION Languages: Java, HTML, and C++
Software: CPLEX and NETPLAN
Technologies: Google Earth and Graphic User Interface (GUI)
Server: ISU Linux server

18
NETPLAN RESULTS
Once NETPLAN runs it will show the projected investment o Displays the resiliency of the system
These are influenced by the users initial specifications
o Displays investment planning and emissionso Output displayed by events
Such as load increases
19
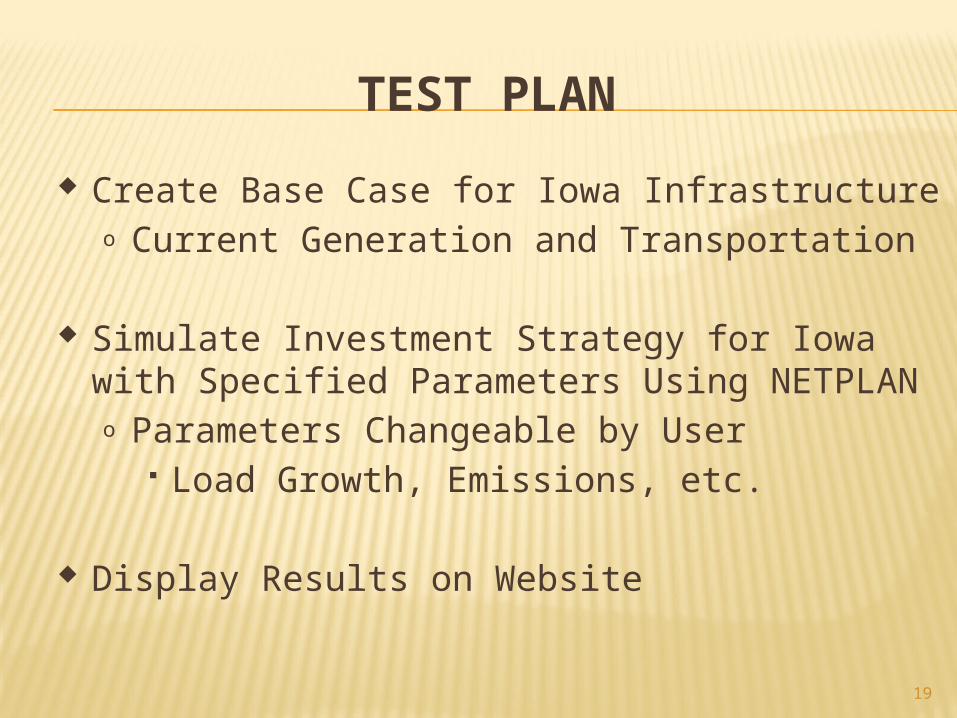
TEST PLAN
Create Base Case for Iowa Infrastructureo Current Generation and Transportation
Simulate Investment Strategy for Iowa with Specified Parameters Using NETPLANo Parameters Changeable by User
Load Growth, Emissions, etc.
Display Results on Website

20
POTENTIAL RISKS AND MITIGATIONS
Using multiple software and computer language Google Earth map requires Google Earth plug-in to be embedded in the website Finding most recent data Restricted data Working with NESCORE21 research group Using newly developed software NETPLAN

21
RESOURSCES AND COST ESTIMATE The software license will cost approximately $4,000 If it include labor hours, there almost 400 hours of work in $20/hour rate that will total of $8,000 Poster $50
Total cost $12,050 ≅ “including Labor”

22
PROJECT SCHEDULESpring Semester

23
PROJECT SCHEDULEFall Semester

24
CURRENT PROJECT STATUS
Base Case/NETPLANo Transmission, Generation, and Transportation files have been
completedo Natural Gas, Generation Investment, and Transportation
Investments are in progresso Passenger Transportation modeling is currently being adapted
into NETPLAN Website Construction
o General website has been createdo GUI for public interaction will be started once base case is
successfully demonstrated

25
TASK RESPOSIBILITY AND CONTRIBUTION
Name Task Total Hours
Michael Healy Data development, analysis, and documentation
45
Deogratius Mpinge Software design and documentation
51
Spenser Mussmann Data development, analysis, and develop investment decision
57
Abdelmagid Yousif Software design and develop investment decision
57
Total 210

26
PLAN FOR NEXT SEMESTER
Writing the codes to run NETPLAN form the website Improve Google Earth map view Proposed solution for long-term (40+ years) energy investment Deliverable: website, documents, and poster

27
QUESTIONS?

28
REFERENCESSenior design team Dec10_12http://seniord.ece.iastate.edu/dec1012/ Wind picturehttp://www.conserve-energy-future.com/Images/Wind_Energy.jpg Transmission lines picturehttp://www.exponent.com/files/Uploads/Images/Energy/utilities.jpg Plug in car picturehttp://www.ecoautoninja.com/wp-content/uploads/2011/03/plug-in-electric-car-technology.jpg Highway picturehttp://www.faqs.org/photo-dict/photofiles/list/4592/6074highway.jpg Electric train picturehttp://blog.nj.com/njv_editorial_page/2009/04/large_high-speed-train.jpg Power plant picturehttp://coloradoindependent.com/wp-content/uploads/2008/11/south-platte-river-power-plant.jpg

29
THANK YOU