1 purdue discovery lecture series biotech 2007: a global transformation g. steven burrill, ceo...
TRANSCRIPT

1
Purdue Discovery Lecture Series
Biotech 2007: A Global Transformation
G. Steven Burrill, CEOBurrill & Company
West Lafayette, IN, November 8, 2007

2
Burrill & Company
Exclusive focus on Life Sciences
Human Healthcare (Rx and Dx)
Nutraceuticals/Wellness
Agbio
Industrial
Biofuels/ Bioenergy
Enabling Technologies

3
Venture Capital Group Venture Capital—investing across the entire spectrum of the life
sciences/biotechnology . . . over $900 million under management
Merchant Banking Practice (Burrill LLC) Strategic Partnering including licensing, research and other collaborations
Strategic Advisory Services including new company formation
Merger & Acquisitions across life sciences
Spin-outs ranging from products, to research divisions to disease area franchises
Media Conferences
Publications
Headcount: 50+ professionals and staff
Burrill & Company
4
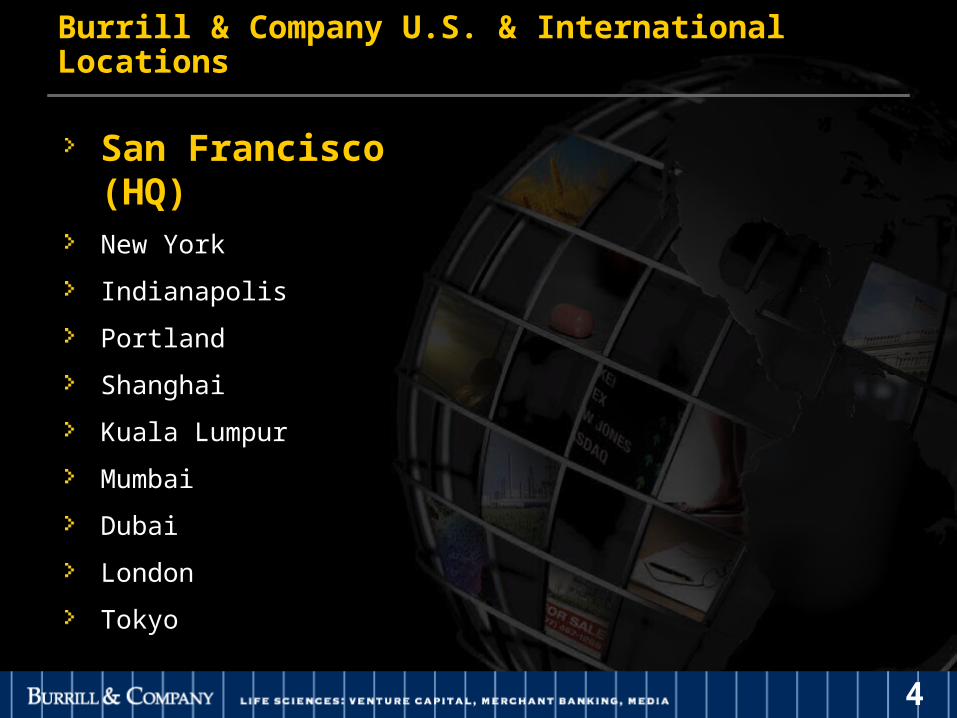
Burrill & Company U.S. & International Locations
San Francisco (HQ)New York
Indianapolis
Portland
Shanghai
Kuala Lumpur
Mumbai
Dubai
London
Tokyo
5
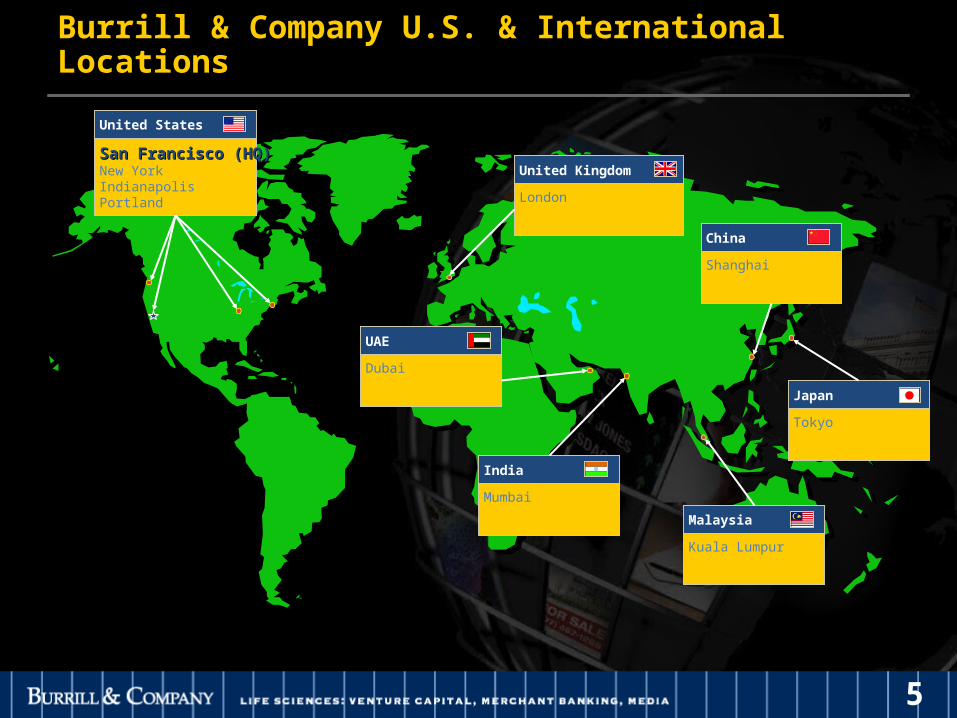
Burrill & Company U.S. & International Locations
San Francisco (HQ)San Francisco (HQ)New YorkIndianapolisPortland
United States
Shanghai
China
Tokyo
Japan
Mumbai
India
London
United Kingdom
Kuala Lumpur
Malaysia
Dubai
UAE

6
Burrill Life Sciences Capital Fund III (2006) $283
Burrill Life Sciences Capital Fund II (2003)(1) $211
Burrill Life Sciences Capital Fund I(1)
Burrill Biotechnology Capital Fund (1999)(1) $140
Burrill Agbio Capital Funds I & II (1998(1)/2001)(1) $ 80
Burrill Nutraceuticals Capital Fund (2000)(1) $ 57$277
Malaysian Life Sciences Capital Fund (a JV Fund) $150
Burrill AgBio II Annex* (a side-car fund to the MLSCF) $ 25
Total Funds Under Management at 10/31/07$946
(1) Fully invested, including reserves/commitments for subsequent financings in existing portfolio companies
Burrill Venture Capital Funds Under Management ($ millions)

7
Burrill Merchant Banking Services (Burrill LLC)
Potential Scope of Potential Scope of
Burrill LLCBurrill LLC
Client RelationshipClient Relationship
Transactions Across Life Sciences for Public and Private Clients
Sell-sideBuy-SideDivestituresReverse mergers
M&A Transactions
Early Stage Research to Product Development and Commercialization
Out-license, co-development, co-promotionPreclinical through marketed productsRepresenting pharma and biotech
Strategic Partnering
Create a New Company or Merge into an Established Entity
Newco financings for pharma and biotech
Spin-Outs
Private PlacementsPIPE financingLate-stage venture financingM&A financing
Financing

8
To order most recent book or complete sets, visit:
www.burrillandco.com
G. Steven Burrill’s Annual Book
Our 21st annual book is out now…

9
The Burrill & Company’s monthly and quarterly bio-intelligence reports and publications:
The Burrill Greater China Life Sciences Biointelligence Report
The Burrill Japan Life Sciences Biointelligence Report
The Burrill India Life Sciences Biointelligence Report
The Burrill European Life Sciences Biointelligence Report
The Burrill Canadian Biotech News
The Burrill Biotechnology Biointelligence Report
The Burrill M&A/Partnering Biointelligence Report
The Burrill Personalized Medicine Biointelligence Report
The Burrill Stem Cell & Regenerative Medicine Biointelligence Report
Burrill Biointelligence Reports

10
Mr. William Patrick
Editor in Chief
A six-times per year publication. For information, see our website
www.burrillandco.comand
www.tjols.com
The Journal of Life Sciences

11
The Journal of Life Sciences on the web Weekly Brief and Weekly Brief, California Edition
To request the free weekly e-mail editions:

12
For inquires, contact Thea Schwartz at (415) 591-5477 or [email protected]
Burrill Created/Hosted Industry Events

13
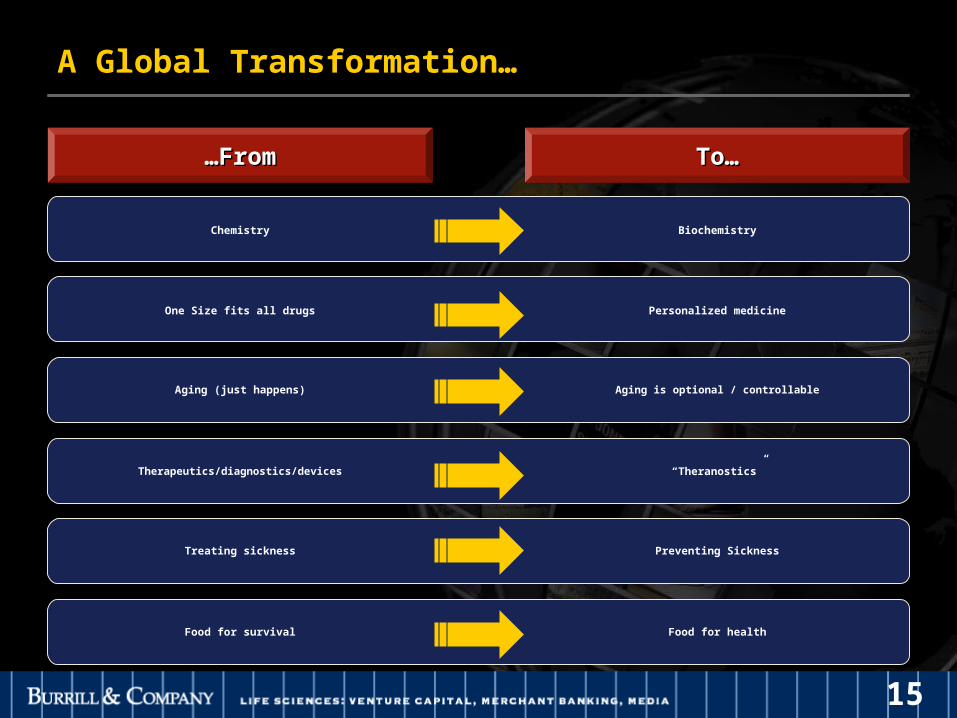
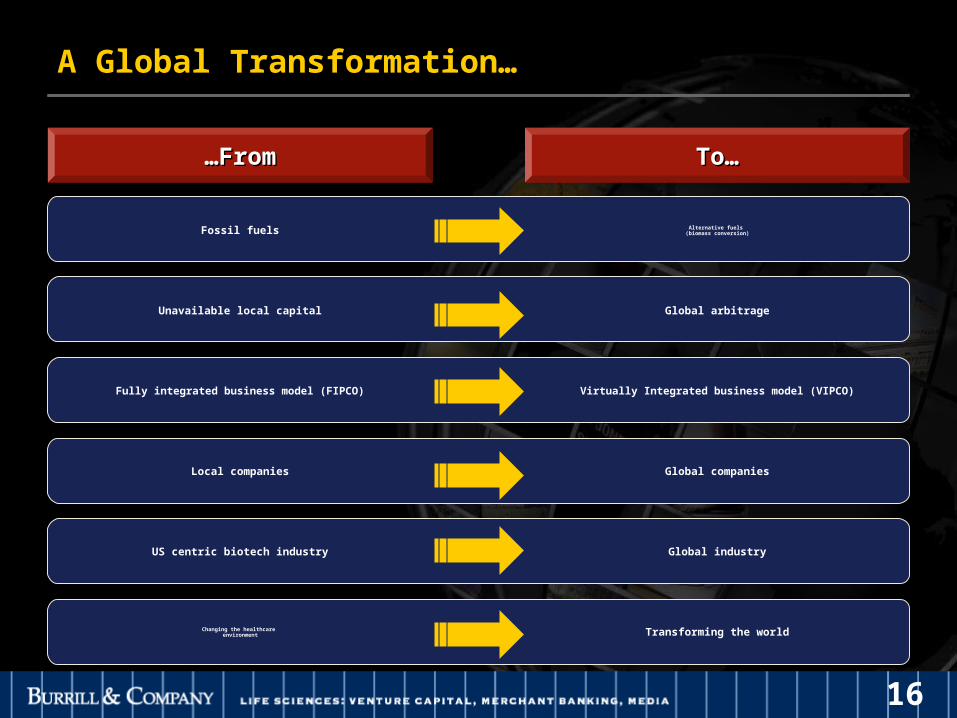
Biotech Is Transforming The Globe…
…and being transformed by it

14
Webster: trans·for·ma·tion Pronunciation: "tran(t)s-f&r-'mA-sh&n”, -Function: noun
1. The act or process of transforming somebody or something
Webster: trans.form1a: To change in composition or structure
Transformation
15
Chemistry Biochemistry
A Global Transformation…
To…To………FromFrom
One Size fits all drugs Personalized medicine
Aging (just happens) Aging is optional / controllable
Therapeutics/diagnostics/devices “Theranostics”
Treating sickness Preventing Sickness
Food for survival Food for health
16
A Global Transformation…
To…To………FromFrom
Fossil fuels Alternative fuels (biomass conversion)
Unavailable local capital Global arbitrage
Fully integrated business model (FIPCO) Virtually Integrated business model (VIPCO)
Local companies Global companies
US centric biotech industry Global industry
Changing the healthcare environment Transforming the world

17
Circa 1953 – Watson and Crick
Circa 1973 – Inception of biotech
ALZA (`68) Cetus (`71) Amgen (`80),
Genentech (`76 ) Biogen (`78),
Centocor (`79) Hybritech (`78)
Circa 1993 - Meaningful biotech revenue
Circa 2007 – Transforming the world
Life Sciences – Biotech: A Short History …

18
Understand the pieces
Hardware of Life (20th Century) genes/proteins
Software of Life (21st Century) – systems/network
“Biomarkers ‘r us” (Note: “genes ‘r us” biz model failed)
Cost per bit of biological info rapidly decreasing (Moore’s law)
Era of Unprecedented Advances in Medical Research
The consequences are staggering …The consequences are staggering …

19
Moore’s law – Cost Per Base

20
Challenges/Opportunities in Improvement of Care
And we see its implications:
Evidence based medicine
Advances in health information (Web MD)
Personalized, predictive, preventative medicine - (3 P’s)
Electronic Health Records (EHR)
BUT …
Delivery system so flawed can’t bring healthcare “advances” to market place
Government increasingly the payor (Medicare/other government healthcare systems)

21
Current Healthcare System in “Silos”
Insurers
Employers (Providing $)
Providers/ Managed Care
Doctors/Nurses/Hospitals
Suppliers
Pharma Companies
Diagnostic Companies
Medical Device Companies
Medical Innovators

22
Integration is Essential BUT where is it happening?
……Therefore integration within the healthcare system is Therefore integration within the healthcare system is essential if benefits of new technologies are to be realizedessential if benefits of new technologies are to be realized
Kaiser Permanente (California)
Intermountain Health (Utah)
Analogy (Clayton Christiansen/ Harvard)
Color TVs invented by RCA but no sales since nobody would broadcast in color
RCA then bought NBC, then integration happened

23
HHS Secretary Michael Leavitt
“Combining gene based medical care with health information technology could transform healthcare…”
“Personalized healthcare will combine basic scientific breakthrough of the human genome with computer-age ability to exchange and memorize data”

24
Not only integration, but a greater need for international collaboration
Pandemic diseases
Regulatory harmonization
Approvals
Patents
Drug/ Food Safety
Diseases know no borders
It’s a global economy

25
Entering a Period of Co-opetition (Cooperation / Competition)
Strategic Partnering
Co-development
Co-branding
Co-promotion
Co-marketing
Country to country
Public/private
Big/small
Within industry/outside industry (IT/biotech)

26
Let’s look at where we Let’s look at where we are…are…

27
Key Industry Stats – Biotech 2007
$597B$44B$45B$26B$482BMarket Cap
>70084140120363# of Public Cos.
233,6007,44012,00068,000146,100# of Employees
4300+400700+1,600+1,500+# of Companies
$25B$0.6B$0.3B$5B$19BAnnual R&D
$89B$2B$3B$12B$72BSales/Rev.
TotalCanadaAsia/Pacific
EuropeUSA

28
Company 10/31/07 12/31/06 12/31/05 12/31/04 12/31/03
Pfizer 170 187 172 199 280
Johnson & Johnson 189 180 186 184 154
Merck 126 82 69 69 103
Eli Lilly 61 62 65 65 77
Bristol-Myers Squibb 59 50 46 47 58
Pfizer/Merck 296 269 241 268 383
Total US Biotech 499 496 491 399 342
Industry 1.7x 1.8x 2.0x 1.5x 0.9x
Pharma vs. Biotech Industry Market Cap ($B)

29
Top ten Biotech Companies by Market Cap
POSITIONBIOTECH1986
BIOTECH1991
BIOTECH1996
BIOTECH2001
BIOTECH2006
BIOTECH2007
1 Genentech Amgen Amgen Amgen Genentech Genentech
2 Cetus Genentech Genentech Genentech Amgen Amgen
3 ALZA ALZA Chiron ElanGileadSciences
GileadSciences
4AppliedBiosystems
Centocor ALZA Shire Celgene Celgene
5 Centocor Chiron Biogen ALZA Biogen Idec Biogen Idec
6 Amgen Genzyme Genzyme Biogen Genzyme Genzyme
7 Nova CetusGeneticsInstitute
Chiron Serono (ADR) Shire (ADR)
8 Chiron Synergen Centocor Immunex Shire (ADR)QuestDiagnostics
9GeneticsInstitute
GeneticsInstitute
IDEXX MedImmuneQuestDiagnostics
Elan
10 BiogenDiagnosticProducts
Immunex Millennium MedImmuneApplied Biosystems

30
Historical Biotech Market Cap 1997–2007
$109
$149
$312
$441
$382
$224
$341
$400
$490 $489 $499
$0
$100
$200
$300
$400
$500
1997 1999 2001 2003 2005 a/o10/31/07
Source: Burrill & Company
($ b
illi
on
)

31
$0
$100
$200
$300
$400
$500
$600
$700
$800
2000 2001 2002 2003 2004 2005 2006 2007
To
tal
Ma
rke
t C
ap
($
bil
lio
n)
Top US Pharma*
Total Biotech Mkt Cap
Top 5 US Pharma vs. Biotech Market Cap
* Pfizer, Merck, Lilly, Wyeth and Schering Plough
As of October 31, 2007
0
100
200
300
400
500
600
700
2000 2001 2002 2003 2004 2005 2006 2007
To
tal
Ma
rke
t C
ap
($
bil
lio
n)
Top Five US Pharma*
Total Biotech
32
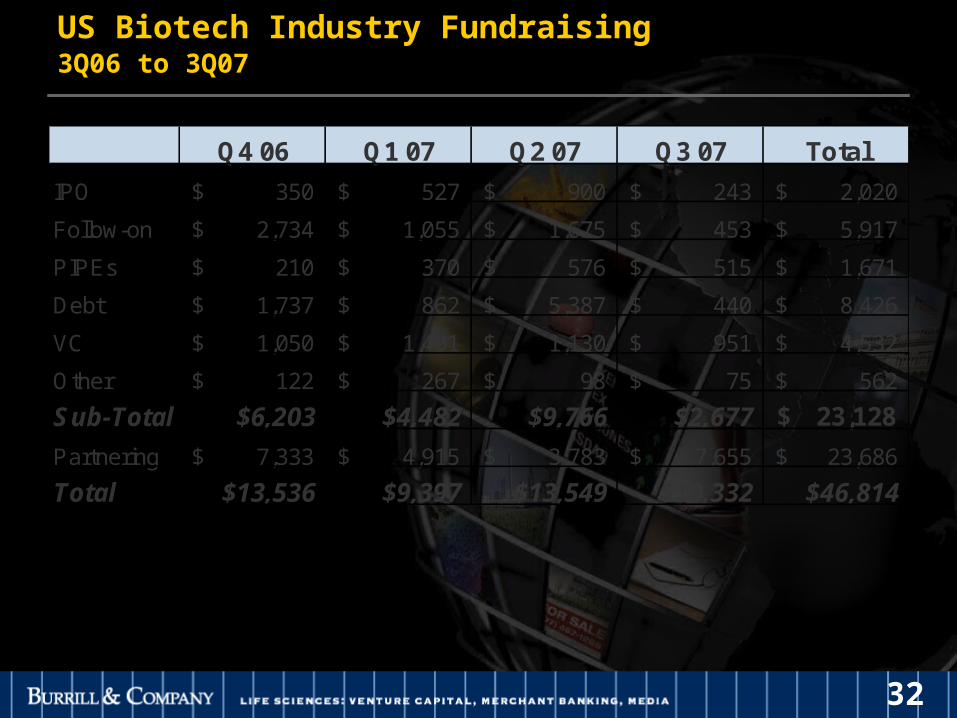
US Biotech Industry Fundraising3Q06 to 3Q07
Q4 06 Q1 07 Q2 07 Q3 07 Total
IPO 350$ 527$ 900$ 243$ 2,020$
Follow-on 2,734$ 1,055$ 1,675$ 453$ 5,917$
PIPEs 210$ 370$ 576$ 515$ 1,671$
Debt 1,737$ 862$ 5,387$ 440$ 8,426$
VC 1,050$ 1,401$ 1,130$ 951$ 4,532$
Other 122$ 267$ 98$ 75$ 562$
Sub-Total $6,203 $4,482 $9,766 $2,677 23,128$
Partnering 7,333$ 4,915$ 3,783$ 7,655$ 23,686$
Total $13,536 $9,397 $13,549 $10,332 $46,814
33
……and look at what and look at what happened during the last happened during the last year...year...

34
So, what really happened during the last year ?
Stem cell science continues delivering breakthroughs
Technology/platform companies rebounded
BioFuels are BOOMING…
Industrial biotech is finally happening
Ag/animal health show progress
acreage is up
but “organics” and “natural’ are hot
35
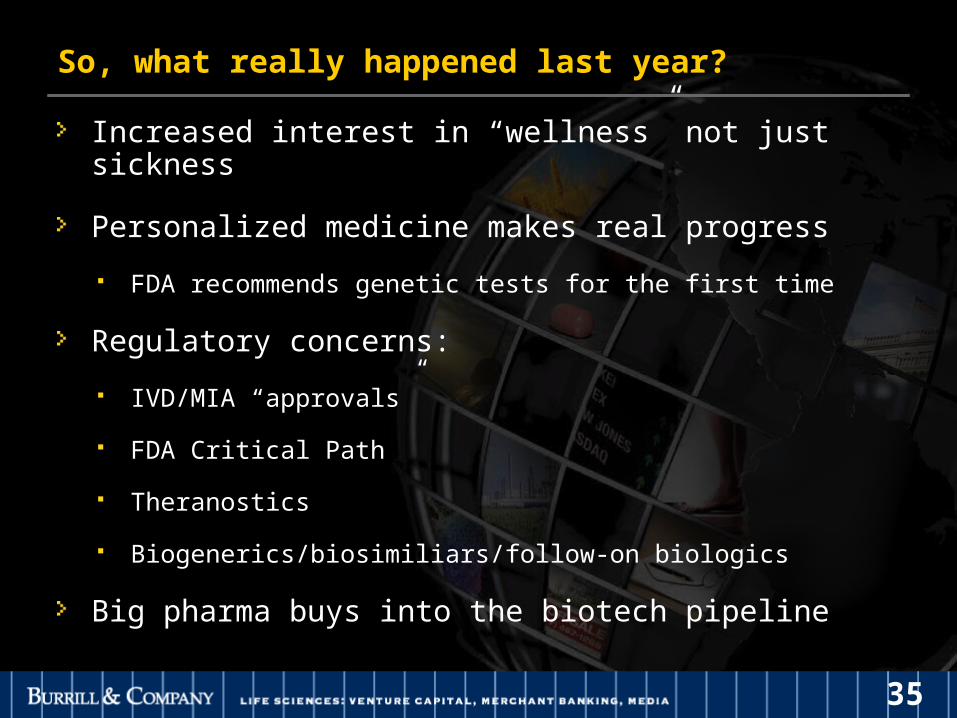
So, what really happened last year?
Increased interest in “wellness” not just sickness
Personalized medicine makes real progress
FDA recommends genetic tests for the first time
Regulatory concerns:
IVD/MIA “approvals”
FDA Critical Path
Theranostics
Biogenerics/biosimiliars/follow-on biologics
Big pharma buys into the biotech pipeline
36
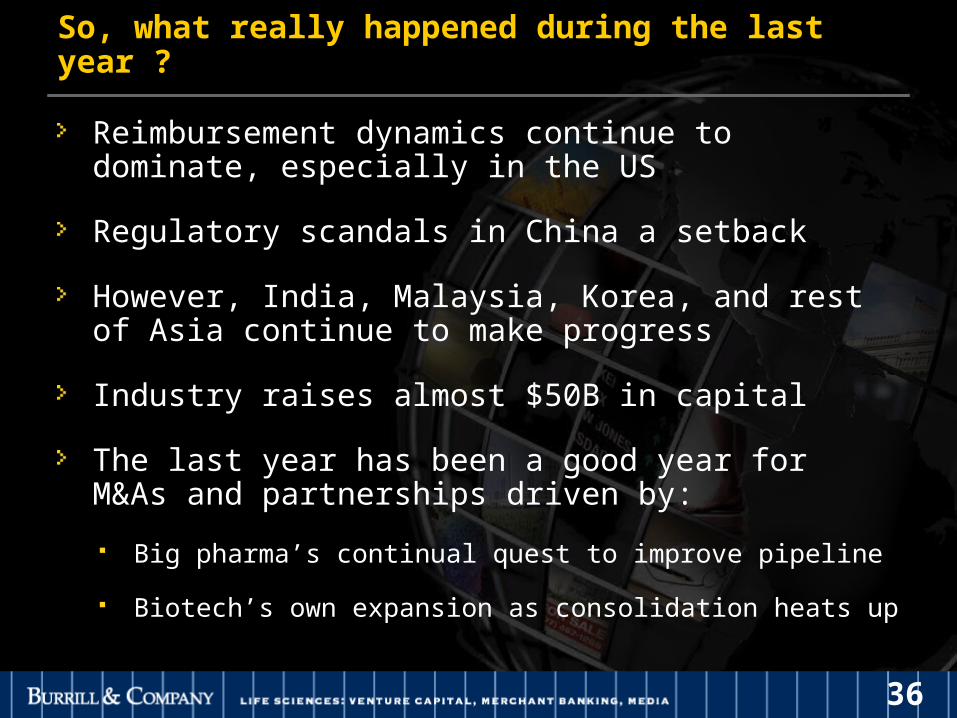
So, what really happened during the last year ?
Reimbursement dynamics continue to dominate, especially in the US
Regulatory scandals in China a setback
However, India, Malaysia, Korea, and rest of Asia continue to make progress
Industry raises almost $50B in capital
The last year has been a good year for M&As and partnerships driven by:
Big pharma’s continual quest to improve pipeline
Biotech’s own expansion as consolidation heats up

37
TransformatiTransformation:on:Sickness to wellnessSickness to wellness

38
Healthcare Industry Dilemma…
Rising Healthcare Costs
Loss of Patent Protection for Blockbuster Drugs
Need for Innovation; build vs. buy
Reimbursement/Payment system changes – Medicare Part D
Compulsory Licensing

39
Healthcare Costs Have Been Rising -For a Long Time

40
Health expenditure as a percentage of GDP is increasing rapidly in the OECD countries
2007
2008
2009
2010
2011
2012
2013
2014
2015
2016
2017
US
% G
DP
Source: PricewaterhouseCoopers Health Research Institute
2006
2018
2019
2020
9
11
13
15
17
19
21
OECD ex-US
41
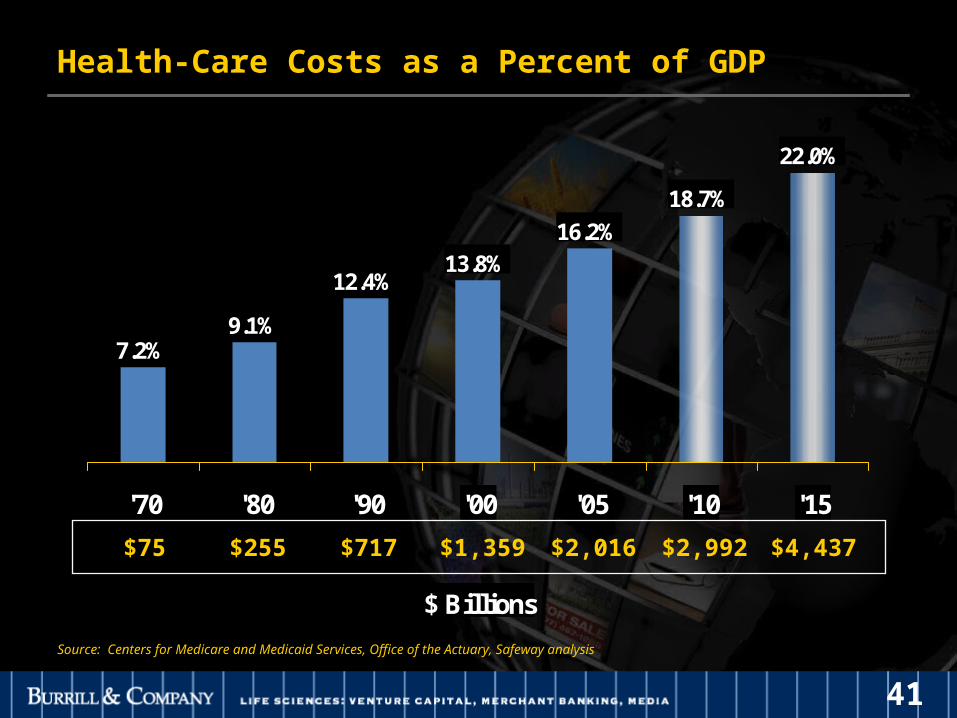
Health-Care Costs as a Percent of GDP
7.2%9.1%
12.4%13.8%
16.2%
18.7%
22.0%
'70 '80 '90 '00 '05 '10 '15
$ Billions
Source: Centers for Medicare and Medicaid Services, Office of the Actuary, Safeway analysis
$75 $255 $717 $1,359 $2,016 $2,992 $4,437

42
16%
11%
10% 10%
9%
8% 8%
0%
5%
10%
15%
20%
U.S. Germany Canada France Sweden Japan U.K.
The US spends more than anybodyHealth Care Spending as a % of GDP
+56%
10%
16%
Source: Organization for Economic Cooperation and Development (OECD)
% ofGDP
43
Prescription Drug Costs as Percentage of Healthcare

44
Estimate of overall US healthcare spendingon prescription drugs (by general public)
45
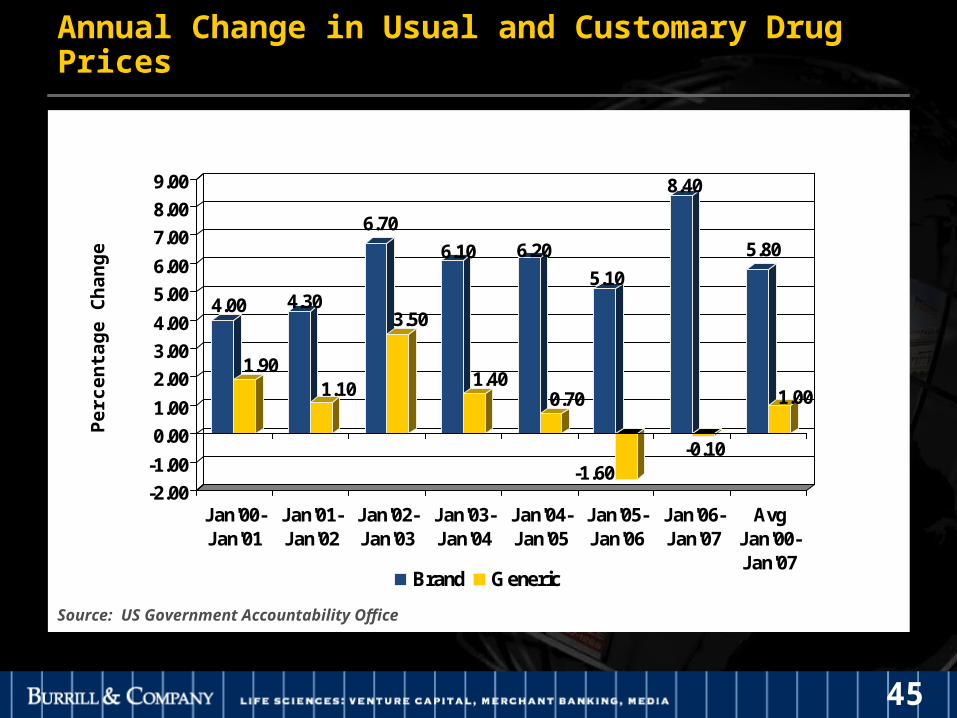
4.00
1.90
4.30
1.10
6.70
3.50
6.10
1.40
6.20
0.70
5.10
-1.60
8.40
-0.10
5.80
1.00
-2.00
-1.00
0.00
1.00
2.00
3.00
4.00
5.00
6.00
7.00
8.00
9.00
Jan'00-Jan'01
Jan'01-Jan'02
Jan'02-Jan'03
Jan'03-Jan'04
Jan'04-Jan'05
Jan'05-Jan'06
Jan'06-Jan'07
AvgJan'00-Jan'07
Brand Generic
4.00
1.90
4.30
1.10
6.70
3.50
6.10
1.40
6.20
0.70
5.10
-1.60
8.40
-0.10
5.80
1.00
-2.00
-1.00
0.00
1.00
2.00
3.00
4.00
5.00
6.00
7.00
8.00
9.00
Jan'00-Jan'01
Jan'01-Jan'02
Jan'02-Jan'03
Jan'03-Jan'04
Jan'04-Jan'05
Jan'05-Jan'06
Jan'06-Jan'07
AvgJan'00-Jan'07
Brand Generic
Annual Change in Usual and Customary Drug PricesP
erce
nta
ge
Ch
ang
e
Source: US Government Accountability Office

46
Today’s medicine challenge: One size doesn’t fit all
~30% of patients do not benefit from medicines1
(100,000 deaths and 2.2 million nonfatal events from ADR in the US in 1994)
1JAMA 1998, 279: 1200
Source: Bayer HealthCare Diagnostics and Burrill & Company
Medicines are not Differentiated
Patients are Different

47
Pharmacogenomics Shapes the Healthcare Business in 2000+

48
140 Years of Drug Discovery Technology
penicillinssulphonamidesaspirin
psychotropics
NSAIDS
H2-antagonistsbeta blockers
lipid lowerersACE-inhibitors
Biotech drugs
chronicdegenerativedisease associatedwith ageing,inflammation,cancer
drugs againsttargets identifiedfrom disease genes
1900 20301950 1960 1970 1980 1990 2000 2010 2020 2040
New
Th
erap
euti
c C
ycle
s
1st generation 2nd generation 3rd generation
natural productsand derivatives
serendipity
receptors
enzyme
genetic engineering
cell pharmacology/molecular biology
genomics/ proteomics
So
urc
e:
CM
S,
Le
hm
an
Bro
the
rs r
ese
arc
h

49
Confluence of Technology, Tools, and Knowledge

50
Nanomedicine Patents and Publications on the Rise
51
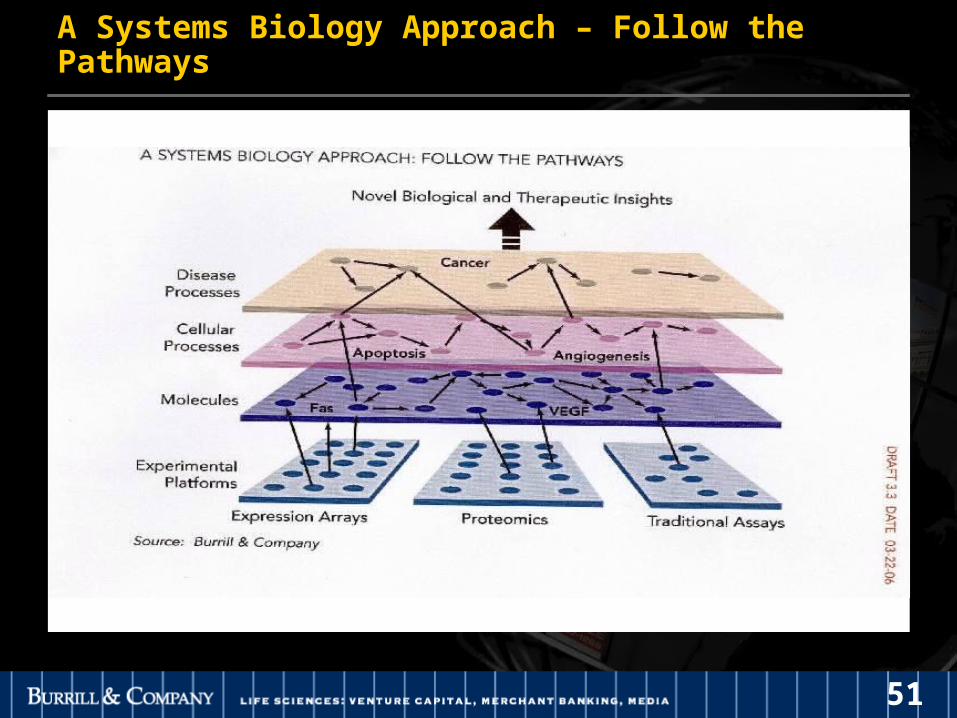
A Systems Biology Approach – Follow the Pathways
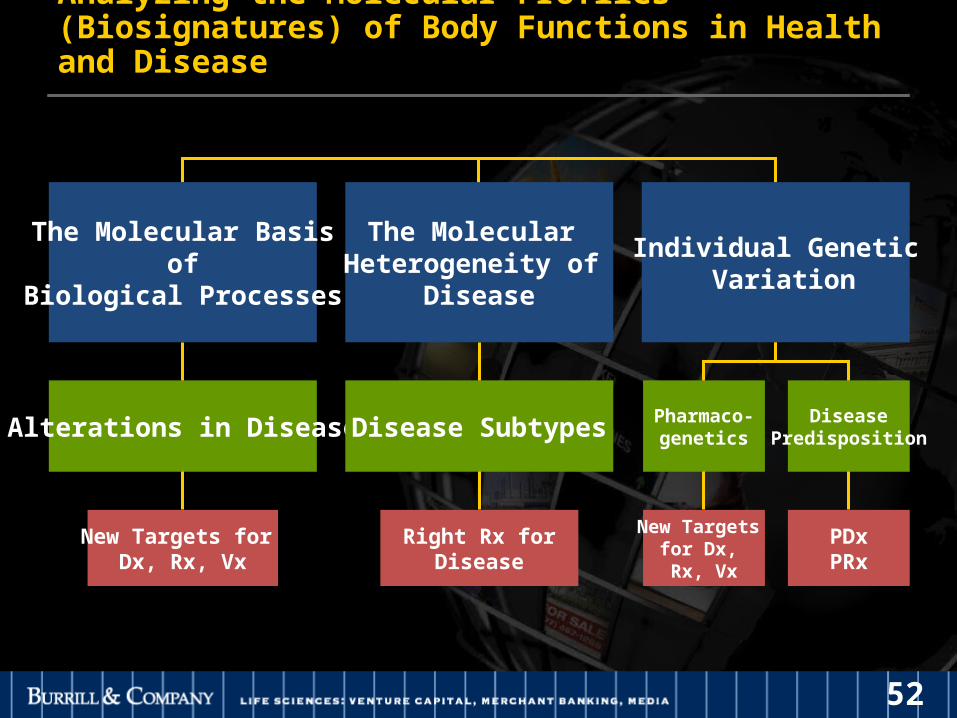
52
The Molecular Basis of
Biological Processes
Alterations in Disease
New Targets for Dx, Rx, Vx
The Molecular Heterogeneity of
Disease
Disease Subtypes
Right Rx forDisease
Individual Genetic Variation
Pharmaco-genetics
New Targets for Dx, Rx, Vx
DiseasePredisposition
PDxPRx
Analyzing the Molecular Profiles (Biosignatures) of Body Functions in Health and Disease
53
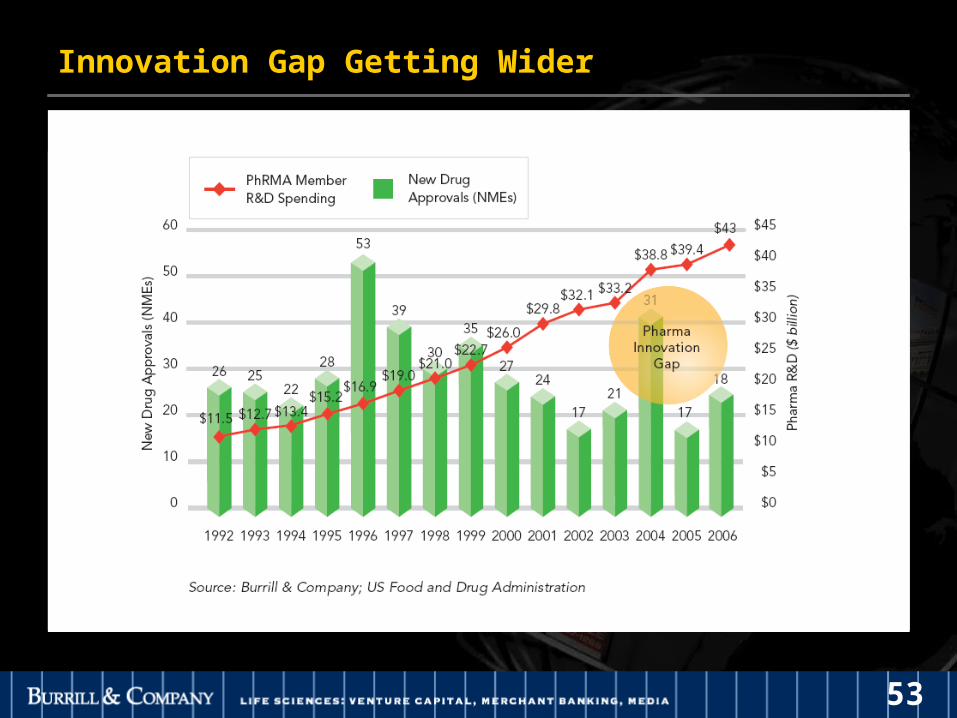
Innovation Gap Getting Wider

54
This Confluence of Healthcare Technology is bringing us…
Targeted therapies (mutation specific), personalized medicine
Drug/device combinations (drug eluding stents)
Molecular diagnostics/Algorithm based diagnostics
Non-invasiveness
Non-hospital based with constant monitoring…
Increased predictions and prevention

55
…that’s changing the healthcare economy
Better outcomes/patients living longer
Costs going up/more patients treatable…
…But, US system leaves 25-45m uninsured/underinsured
Consumer healthcare is here to stay (copays ), individuals empowered and informed
56
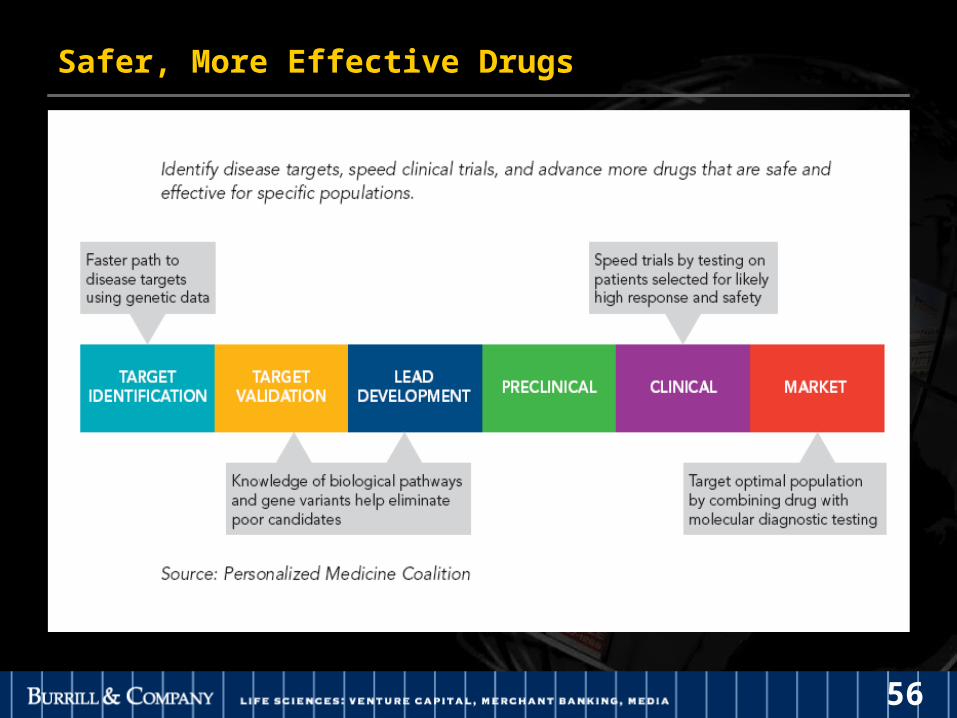
Safer, More Effective Drugs

57
International :Where is Stem Cell Research Happening

58
Stem Cells linger in scientific & business cloudy environment
Advanced Cell Therapeutics creates embryonic stem cells without destroying embryo
US political football with limited federal funding
• Alternative development strategies, some research moves off-shore (Asia, UK)
Increased State funding initiatives
• CIRM gets State of California support for bond anticipation notes, initiates grants
• Other state initiatives- Missouri/Maryland/Wisconsin/NY/Mass all make progress
What’s happening in Stem Cells?
“This mouse offers proof that researchers can create embryonic stem cells without using an egg. It grew from an embryo containing cells that had been reprogrammed to an embryonic state.”
Source: Whitehead Institute for Biomedical Research

59
Some Stem Cell – Advances 2007
Human nerve stem cells transplanted into rats' damaged spinal cords have survived
Found: Stem Cells Responsible for Pancreatic Cancer
Mother's Stem Cells Passed to Baby—Suggests Possible Way to Treat Diabetes
Stem Cell Lines Generated from Amniotic Fluid
Multipotent Adult Progenitor Cells (MAPCs) Regenerate Blood in Mice
Treatments for Alzheimer’s and Multiple Sclerosis
Regeneration and repair of periphery nerves
Repair damaged heart muscle and improve cardiac function
Stem-cell transplantation for refractory or relapsing lymphomas
60
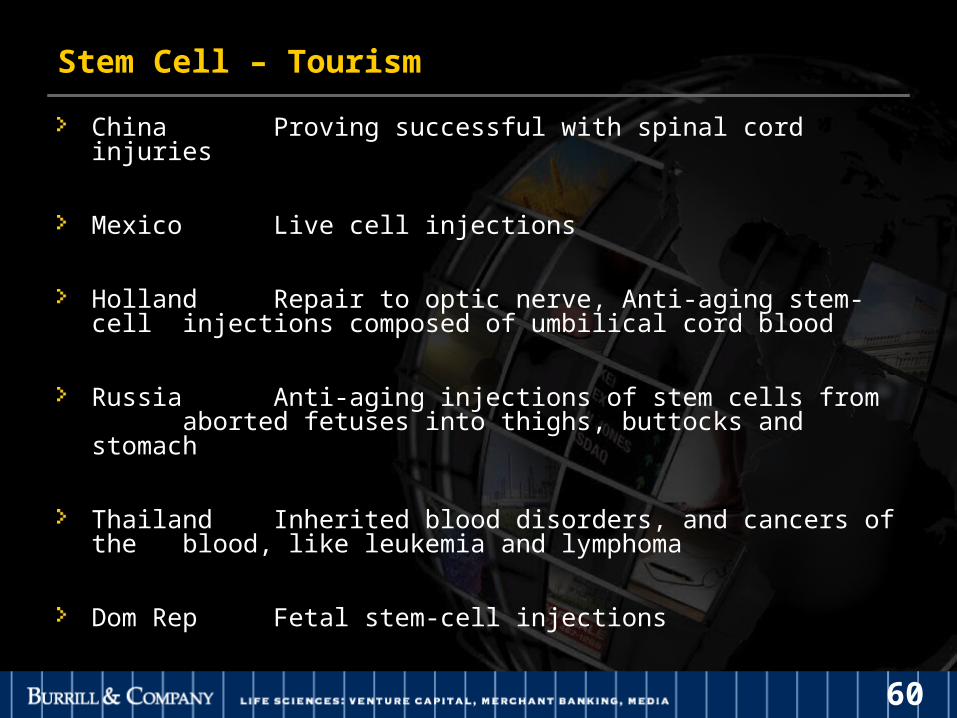
Stem Cell – Tourism
China Proving successful with spinal cord injuries
Mexico Live cell injections
Holland Repair to optic nerve, Anti-aging stem-cell injections composed of umbilical cord blood
Russia Anti-aging injections of stem cells from aborted fetuses into thighs, buttocks and stomach
Thailand Inherited blood disorders, and cancers of the blood, like leukemia and lymphoma
Dom Rep Fetal stem-cell injections
61
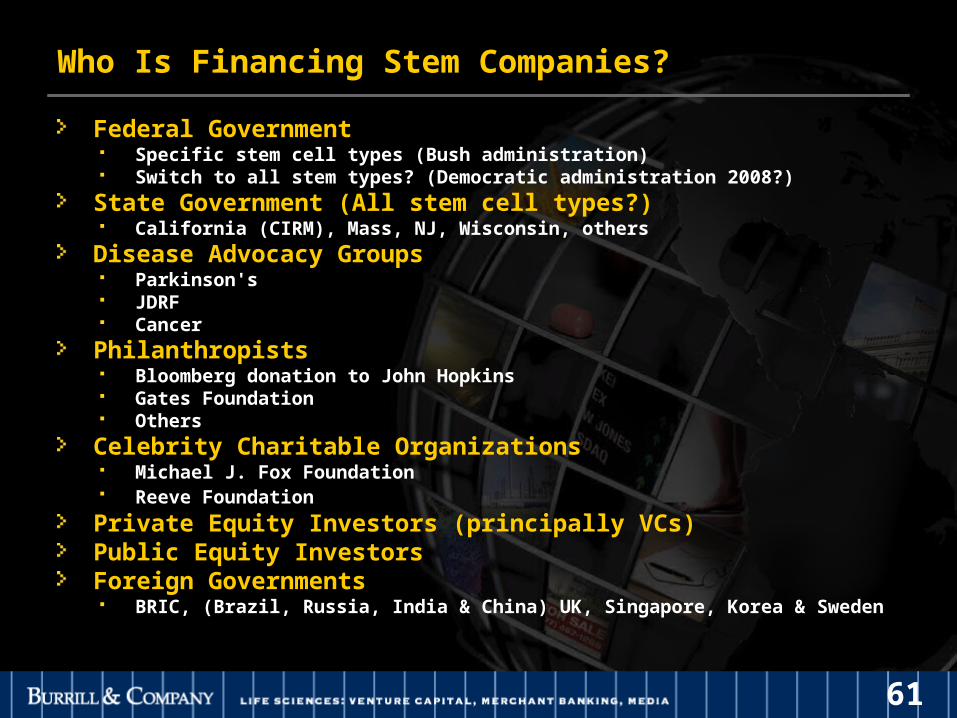
Who Is Financing Stem Companies?
Federal Government Specific stem cell types (Bush administration) Switch to all stem types? (Democratic administration 2008?)
State Government (All stem cell types?) California (CIRM), Mass, NJ, Wisconsin, others
Disease Advocacy Groups Parkinson's JDRF Cancer
Philanthropists Bloomberg donation to John Hopkins Gates Foundation Others
Celebrity Charitable Organizations Michael J. Fox Foundation Reeve Foundation
Private Equity Investors (principally VCs)Public Equity Investors Foreign Governments BRIC, (Brazil, Russia, India & China) UK, Singapore, Korea & Sweden
62
TransformatiTransformation:on:New Diseases / New New Diseases / New MarketsMarkets

63
Worldwide Global Pharmaceutical Sales
64
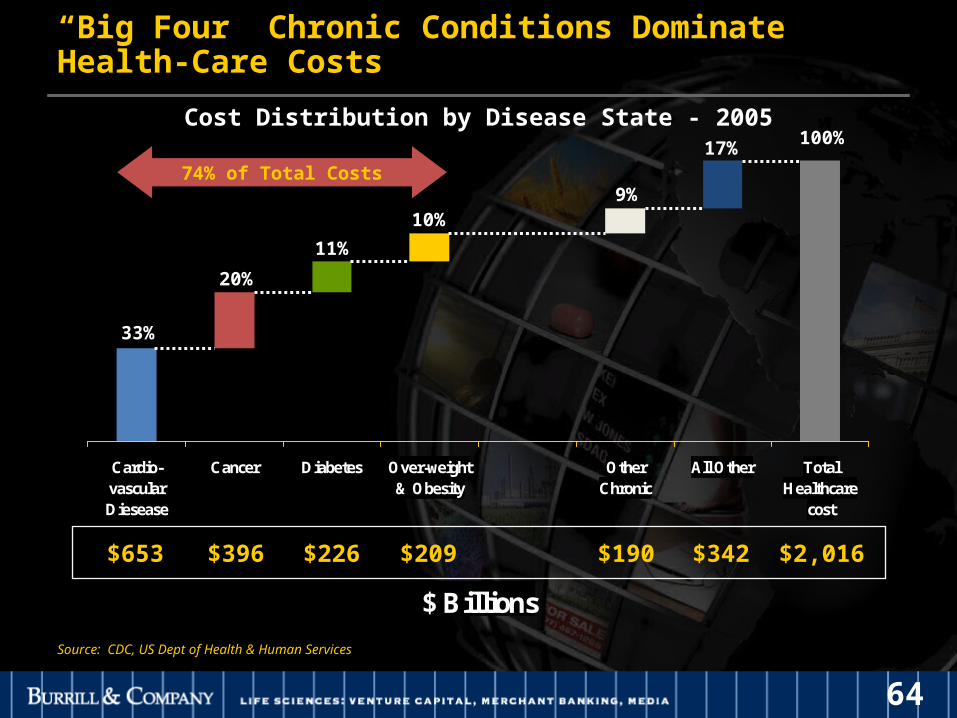
“Big Four” Chronic Conditions Dominate Health-Care Costs
Cardio-vascularDiesease
Cancer Diabetes Over-weight& Obesity
OtherChronic
All Other TotalHealthcare
cost
$ Billions
Source: CDC, US Dept of Health & Human Services
$653 $396 $226 $209 $190 $342 $2,016
33%
20%
11%
10%9%
17%100%
Cost Distribution by Disease State - 2005
74% of Total Costs

65
Efforts Against Heart Disease, Not So For Cancer

66
Big “new” markets
Obesity/diabetes/metabolic disease
Alzheimer's/memory
Anti-aging
Anti infectives (antibiotic resistance)
Wellness (preventative/predictive cure)

67
Projected Alzheimer’s Disease Prevalence, 2000 to 2100
68
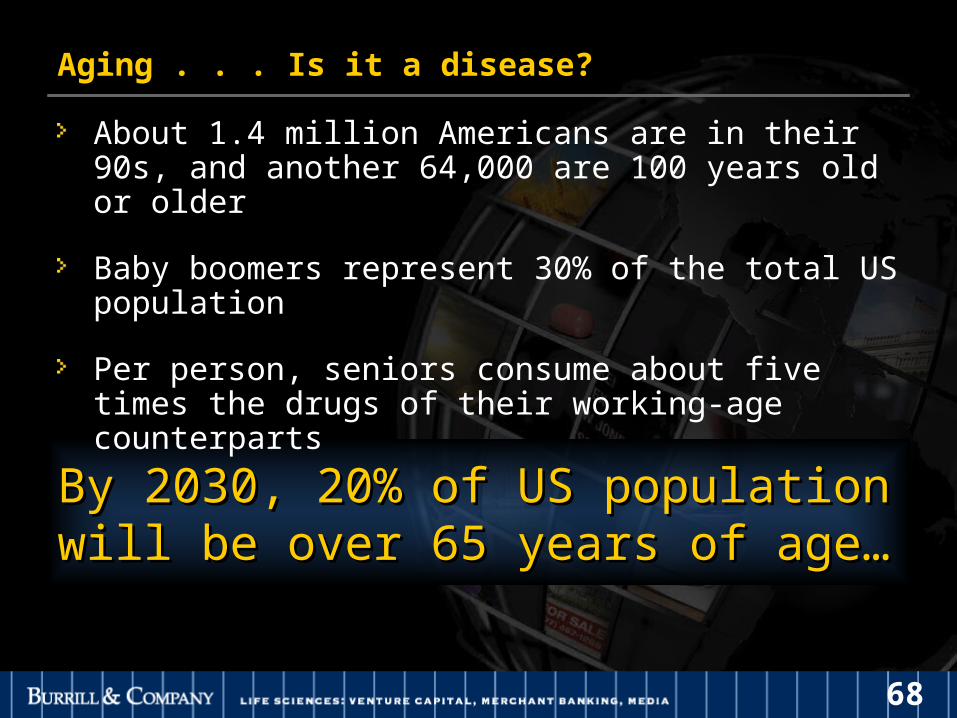
Aging . . . Is it a disease?
By 2030, 20% of US population will be By 2030, 20% of US population will be over 65 years of age…over 65 years of age…
About 1.4 million Americans are in their 90s, and another 64,000 are 100 years old or older
Baby boomers represent 30% of the total US population
Per person, seniors consume about five times the drugs of their working-age counterparts
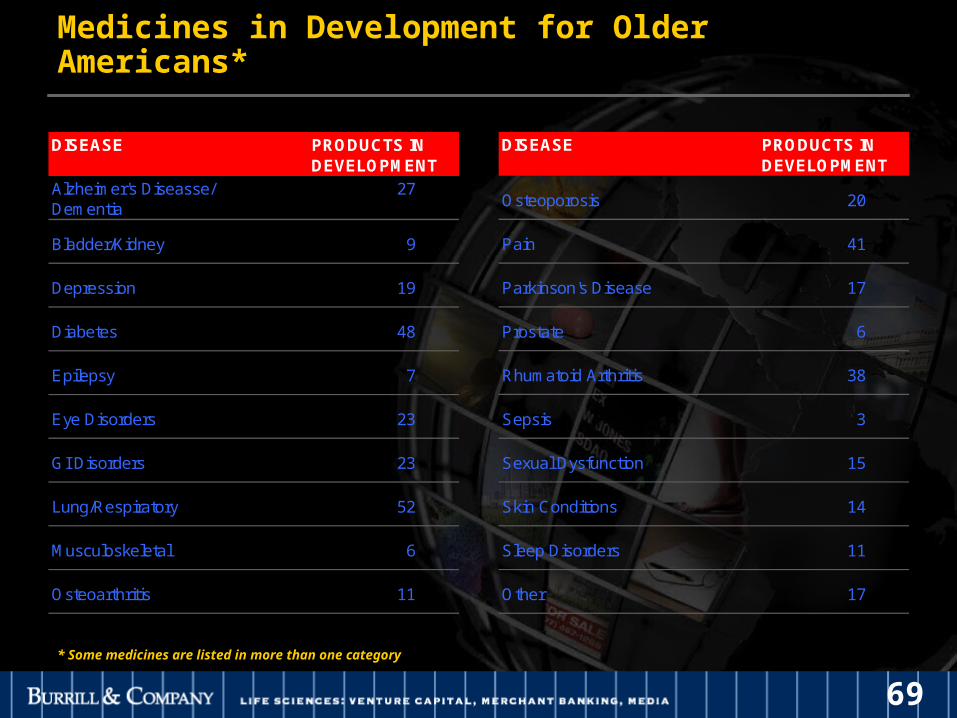
69
Medicines in Development for Older Americans*
* Some medicines are listed in more than one category
DISEASE
Alzheimer's Diseasse/Dementia
27
Bladder/Kidney 9
Depression 19
Diabetes 48
Epilepsy 7
Eye Disorders 23
GI Disorders 23
Lung/Respiratory 52
Musculoskeletal 6
Osteoarthritis 11
PRODUCTS INDEVELOPMENT
DISEASE
Osteoporosis 20
Pain 41
Parkinson's Disease 17
Prostate 6
Rhumatoid Arthritis 38
Sepsis 3
Sexual Dysfunction 15
Skin Conditions 14
Sleep Disorders 11
Other 17
PRODUCTS INDEVELOPMENT

70
Chronic Disease
125 million Americans have 1 or more chronic conditions (e.g. congestive heart failure, diabetes)
Chronic diseases account for 75% of all health care expenditures
Current costs for chronic diseases is approaching $1 trillion
These expenditures are not delivering what is possible

71
Stratifying Into Risk Categories Diabetes Type 2: What’s Becoming Possible?
72
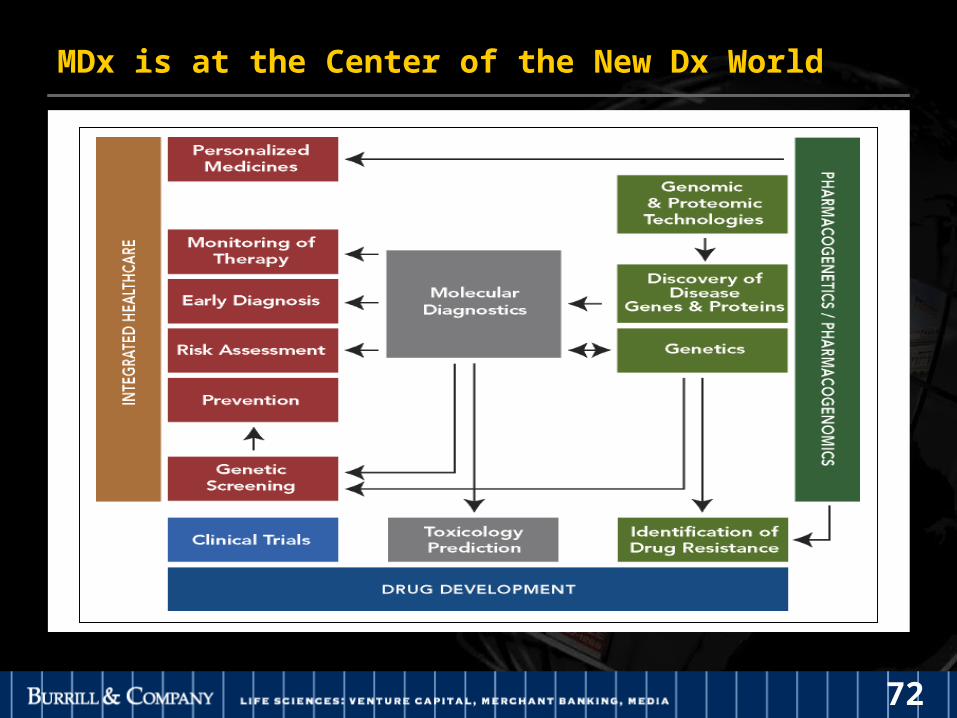
MDx is at the Center of the New Dx World
73
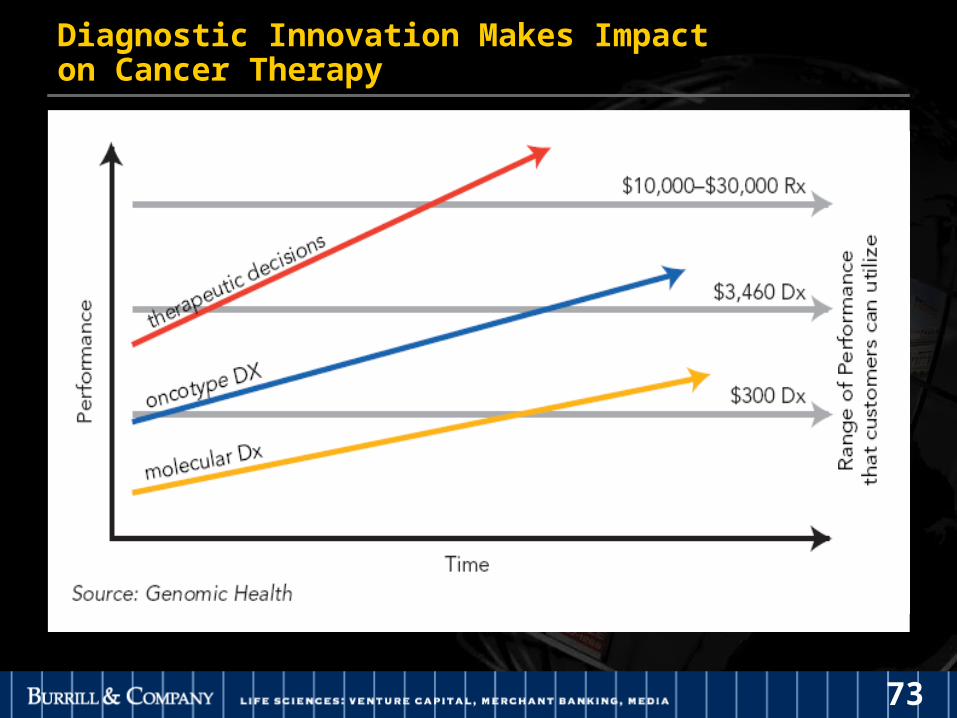
Diagnostic Innovation Makes Impact on Cancer Therapy
74
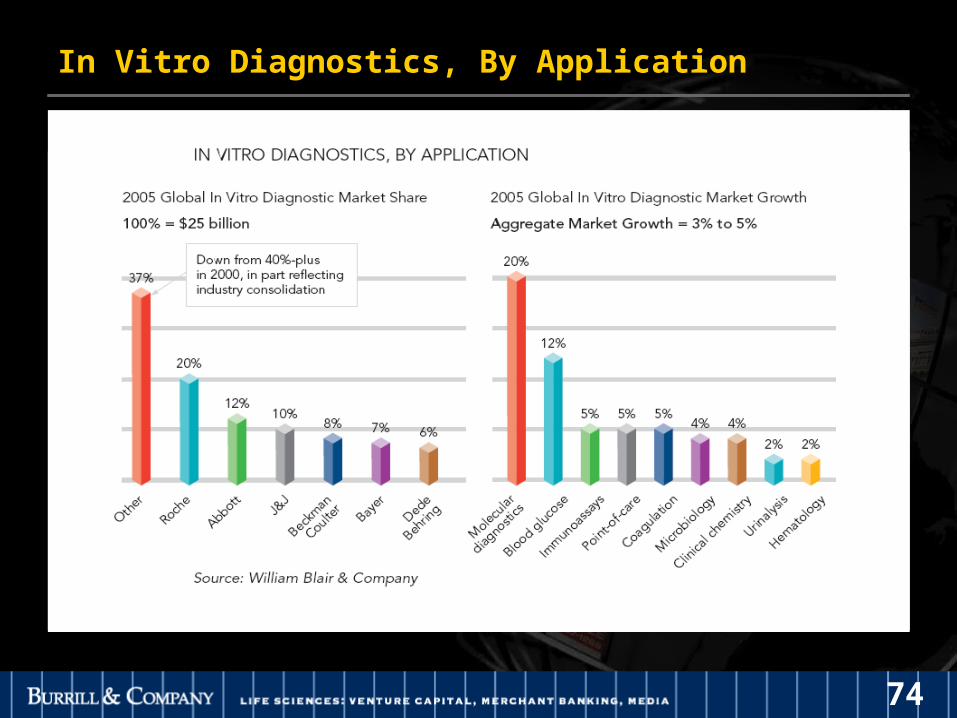
In Vitro Diagnostics, By Application

75
Worldwide In Vitro Diagnostics Market

76
Genomic Health on a Tear
Source: Burrill & Company
0%
20%
40%
60%
80%
100%
120%
140%
160%
180%
Jan-0
6
Feb-0
6
Mar
-06
Apr-0
6
May
-06
Jun-
06
Jul-0
6
Aug-0
6
Sep-0
6
Oct-0
6
Nov-0
6
Dec-0
6
Jan-0
7
Feb-0
7
Mar
-07
Apr-0
7
May
-07
Jun-
07
Jul-0
7
Aug-0
7
Sep-0
7
77
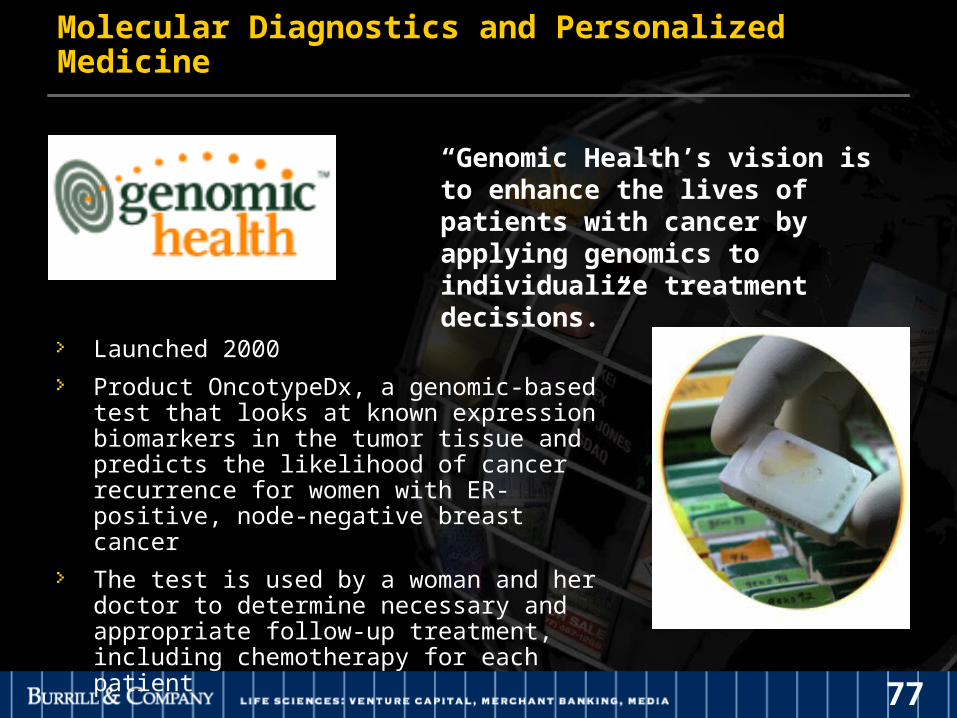
“Genomic Health’s vision is to enhance the lives of patients with cancer by applying genomics to individualize treatment decisions.”
Launched 2000
Product OncotypeDx, a genomic-based test that looks at known expression biomarkers in the tumor tissue and predicts the likelihood of cancer recurrence for women with ER-positive, node-negative breast cancer
The test is used by a woman and her doctor to determine necessary and appropriate follow-up treatment, including chemotherapy for each patient
Molecular Diagnostics and Personalized Medicine
78
TransformatiTransformation:on:Governments are our Governments are our Partners …and are Partners …and are increasingly involvedincreasingly involved
79
On The Regulatory/Patent/Policy Front…
Patent reform (PTO proposals to restrict claims examined in a single application and limit continuation applications)
FDA resources – PDUFA authorization follow-on biologics (biogenerics)
drug safety
theranostics
food safety (pet food)
Biofuels – renewable and alternative energy sources through use of biotechnology
Medicare Prescription Drug Price Negotiation Act – Non-interference (proposal to require Medicare interference)
Sarbanes Oxley compliance – reducing the burden on small companies
SBIR eligibility
Agbio/ GMO’s
Stem cell research – federal funding
80
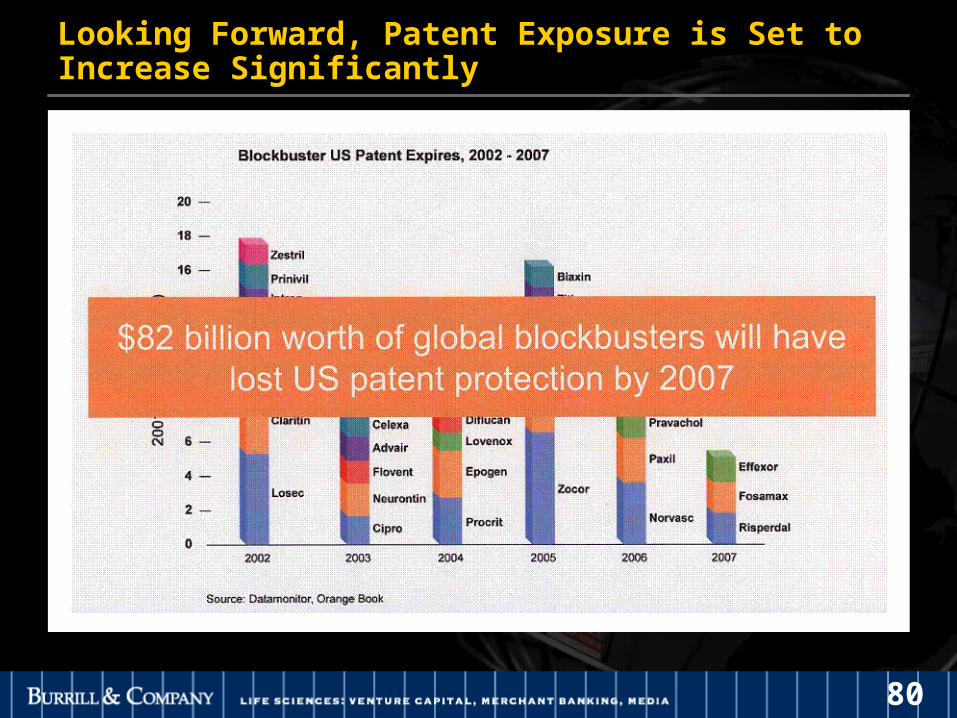
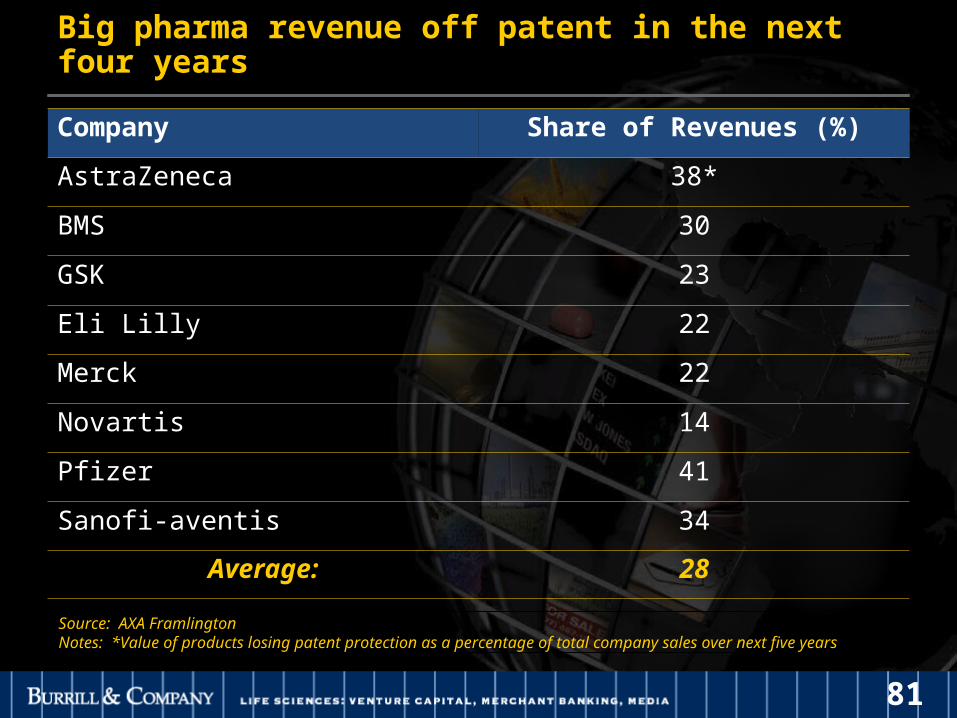
Looking Forward, Patent Exposure is Set to Increase Significantly
81
Big pharma revenue off patent in the next four years
Company Share of Revenues (%)
AstraZeneca 38*
BMS 30
GSK 23
Eli Lilly 22
Merck 22
Novartis 14
Pfizer 41
Sanofi-aventis 34
Average: 28
Source: AXA FramlingtonNotes: *Value of products losing patent protection as a percentage of total company sales over next five years
82
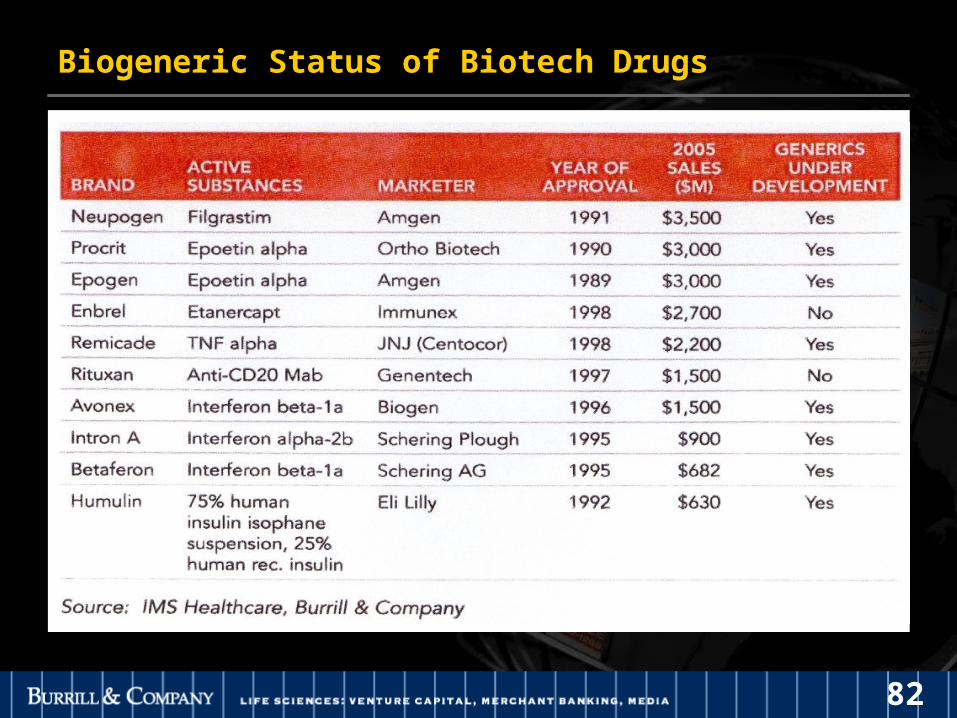
Biogeneric Status of Biotech Drugs

83
Manufacturer Reported Serious Adverse Events Per Fiscal Year

84
Pulled from the MarketDateApproved
Drug Name Use Risks
Date Withdrawn
2004
2001
Tysabri
Bextra
Multiple Sclerosis
Pain reliever
Rare, frequently fatal demyleinating disease of CNS
Heart attack/stroke; fatal skin reactions2005
2005
1999 Vioxx Pain reliever Heart attack/stroke 2004
1997 Baycol Cholesterol Severe damage to muscle, that is sometimes fatal
2001
1999 Raplon Anesthesia An inability to breathe normally 2001
1993 Propulsid Heartburn Fatal heart rhythm abnormalities 2000
1997 Rezulin Type 2 diabetes Severe liver toxicity 2000
1988 Hismanal Antihistamine Fatal heart rhythm abnormalities 1999
1997 Raxar Antibiotic Fatal heart rhythm abnormalities 1999
1997 Posicor High blood pressure Dangerous interactions with other drugs 1998
1997 Duract Pain reliever Severe liver damage 1998
1985 Seldane Antihistamine Fatal heart rhythm abnormalities 1998
1973 Pondimin Obesity Heart valve abnormalities 1997
1996 Redux Obesity Heart valve abnormalities 1997
Blockbuster drugs pulled from the
Blockbuster drugs pulled from the
market gave investors concern
market gave investors concern

85
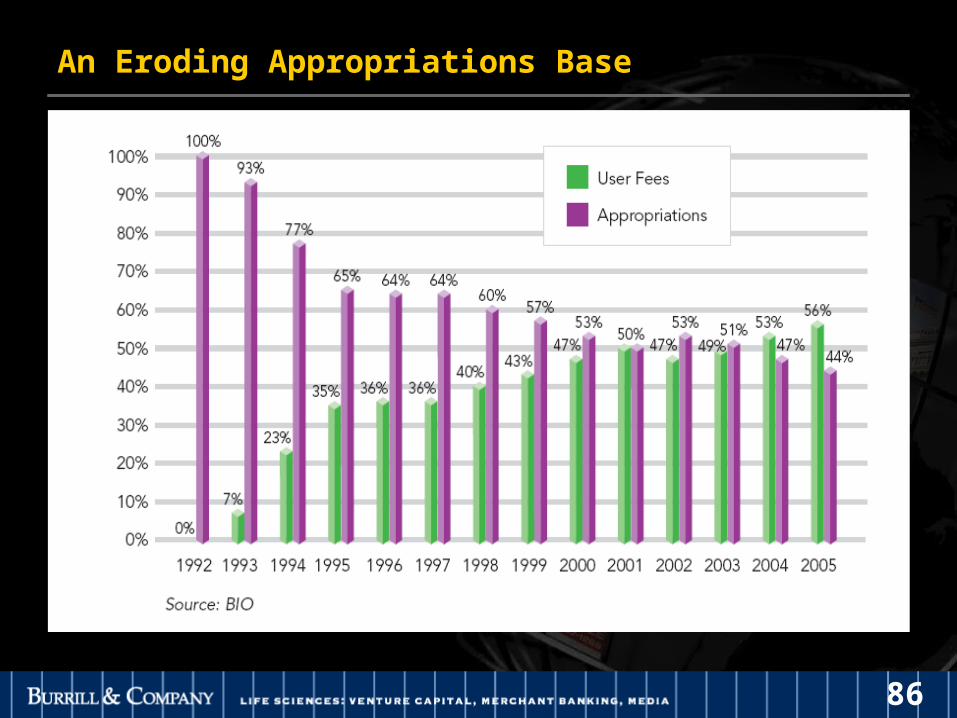
FDA Funding Lagging
86
An Eroding Appropriations Base
87
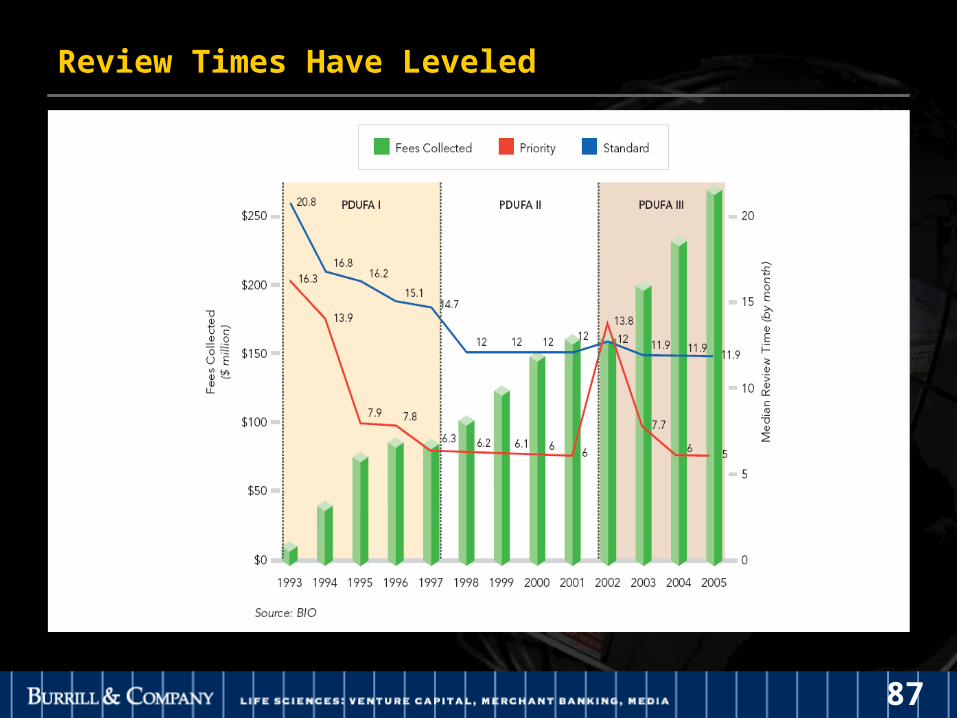
Review Times Have Leveled

88
The Cost of Developing a New Drug Has Greatly Increased
89
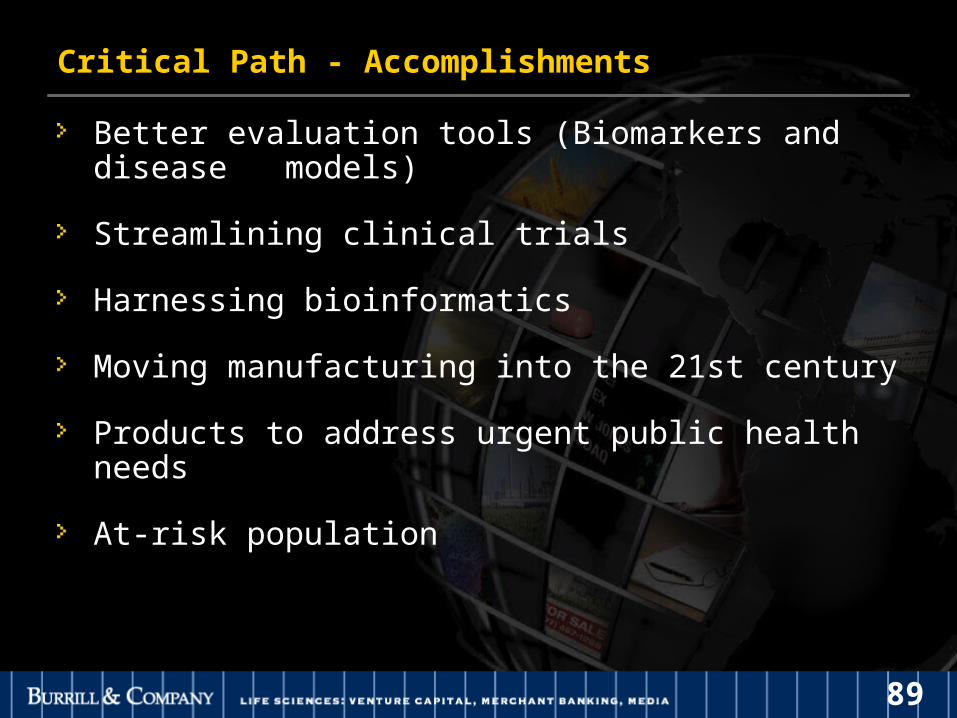
Critical Path - Accomplishments
Better evaluation tools (Biomarkers and disease models)
Streamlining clinical trials
Harnessing bioinformatics
Moving manufacturing into the 21st century
Products to address urgent public health needs
At-risk population

90
Major Government Initiatives in Biotechnology
EU/Eastern Europe/Scandinavia
China
India
Japan
Malaysia
Singapore
UAE/Dubai and Kuwait
Israel
Various Latin American Countries (esp. Chile/Brazil)
Australia/New Zealand

91
0
5
10
15
20
25
30
35
40
45
19821983198419851986 19871988198919901991 1992199319941995 19961997199819992000 20012002200320042005
New Indications
Biotech Drugs
2006
Number of Products Approved — 1980–2006
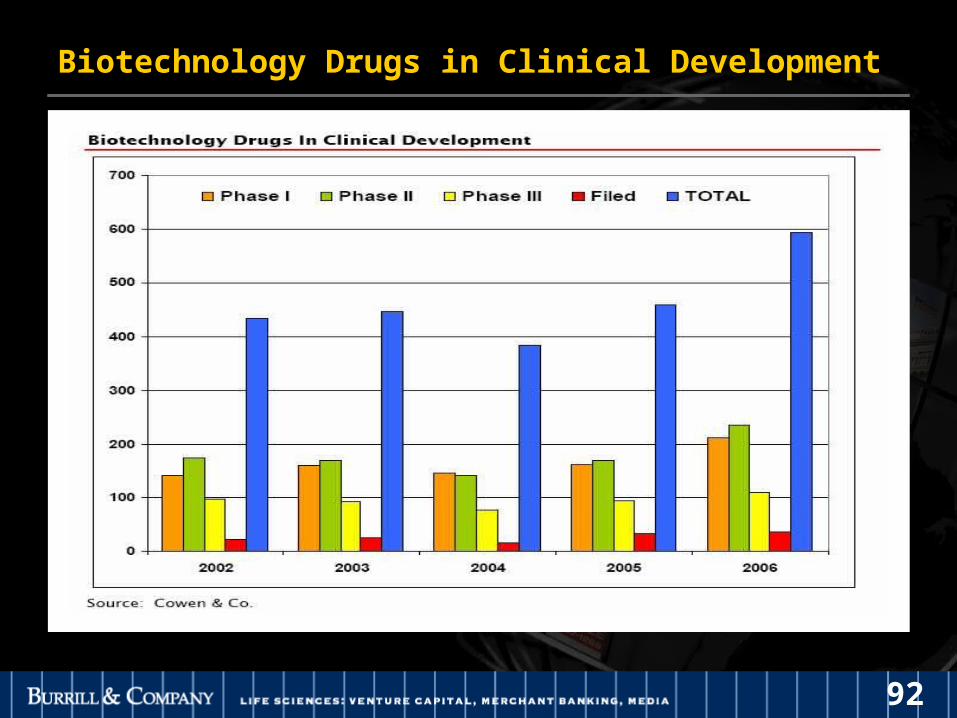
92
Biotechnology Drugs in Clinical Development
93
TransformatiTransformation:on:Fossil Fuels to BiofuelsFossil Fuels to Biofuels

94
Global Area of Biotech Crops, 1996 to 2006

95
Global Area of Biotech Crops 1996 to 2006 by Trait
96
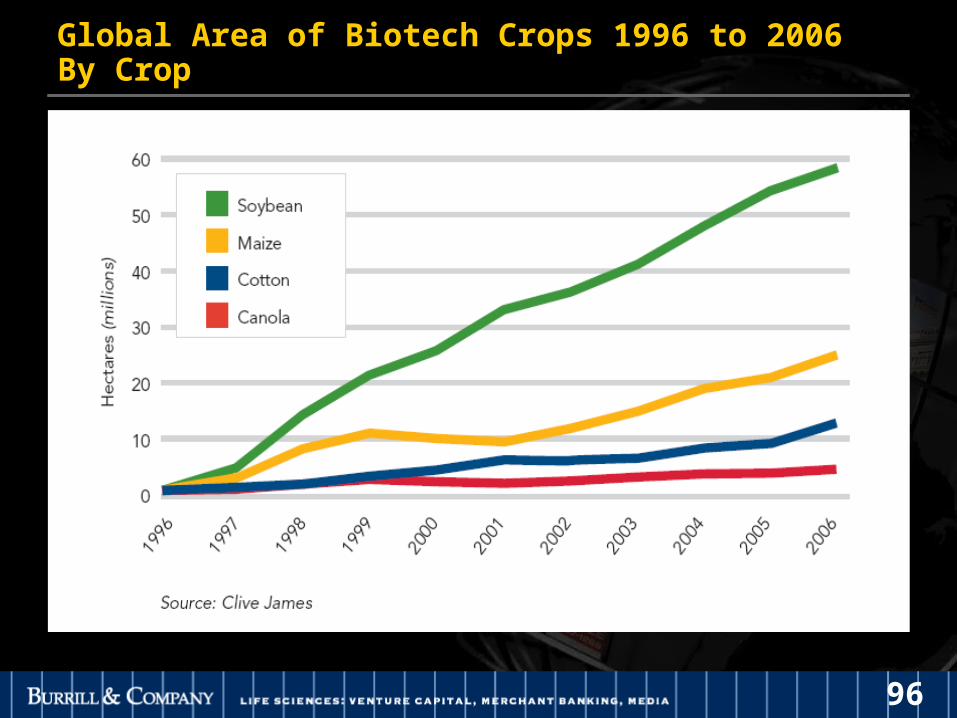
Global Area of Biotech Crops 1996 to 2006 By Crop

97
Burrill Agbio Index 2002 to 2007
-50.00%
0.00%
50.00%
100.00%
150.00%
200.00%
Dec-0
1
Mar
-02
Jun-
02
Sep-0
2
Dec-0
2
Mar
-03
Jun-
03
Sep-0
3
Dec-0
3
Mar
-04
Jun-
04
Sep-0
4
Dec-0
4
Mar
-05
Jun-
05
Sep-0
5
Dec-0
5
Mar
-06
Jun-
06
Sep-0
6
Dec-0
6
Mar
-07
Jun-
07
Sep-0
7
Burrill AgBio
DJIA
NASDAQ

98
Designing Crops to Harvest Fuel
Europe has a policy for setting Europe has a policy for setting aside 3% to 14% surplus farmland aside 3% to 14% surplus farmland for cultivation of biofuel- cropsfor cultivation of biofuel- crops

99
2005 State of the Union
“Cellulosic Ethanol”
100
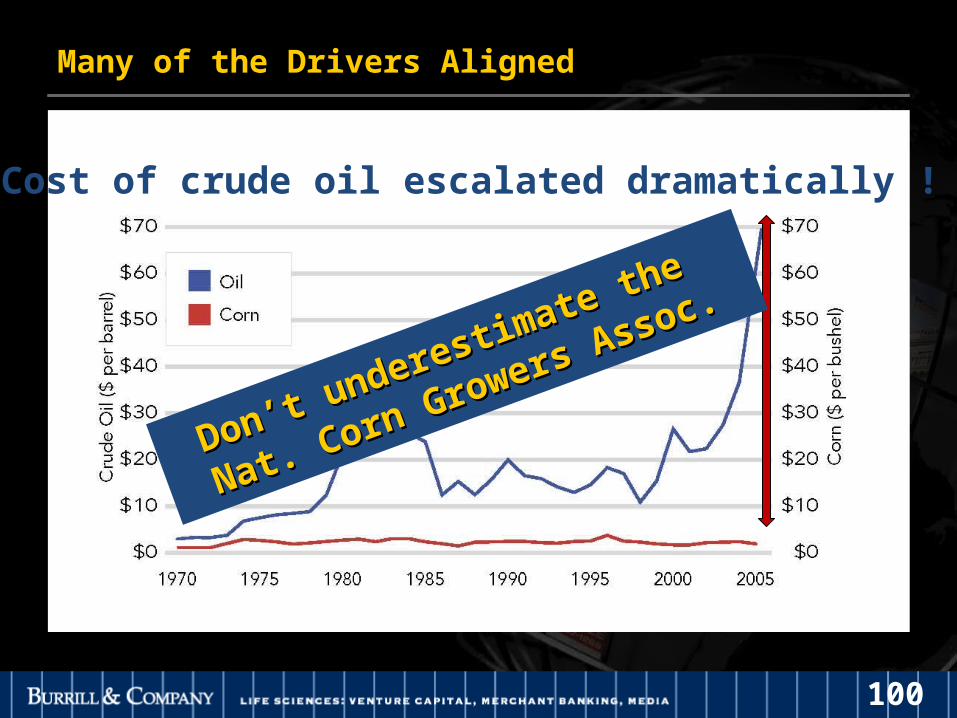
Cost of crude oil escalated dramatically !
Many of the Drivers Aligned
Don’t underestimate the
Don’t underestimate the
Nat. Corn Growers Assoc.
Nat. Corn Growers Assoc.

101
Loss of Energy Security
Geopolitical unrest wherever oil is produced
Extreme weather demonstrated the vulnerability of the US supply
102
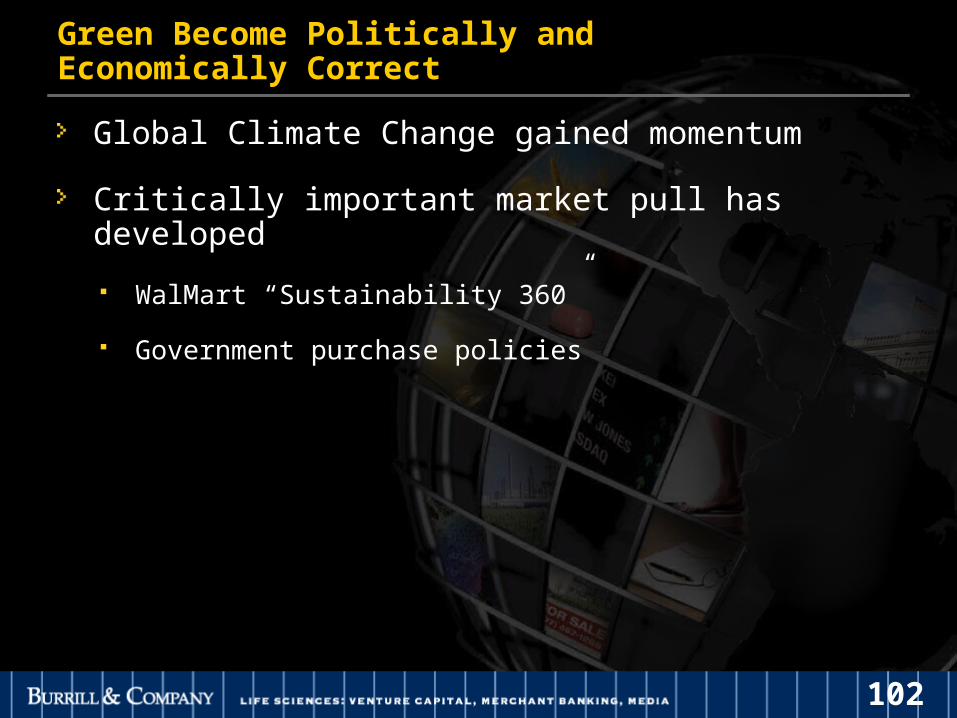
Green Become Politically and Economically Correct
Global Climate Change gained momentum
Critically important market pull has developed
WalMart “Sustainability 360”
Government purchase policies

103
The Perfect Storm
AcceleratedBiobasedEconomy
EnablingPolicy
Economic PressureMarket Pull
Ready technologies
104
What has happened since?
Ethanol plant construction exploded (All corn based) Now have 113 in operation, 77 under construction Production at 5 billion gallons, potential for 12B
Price of feed grains $2 historically, topped $4.20 today 20% of corn crop today, 50% in two years ! 13% of soybeans going to biodiesel
Investments $2.9 B in Cleantech up 78% $2.1 B energy related, up 74%

105
Corn Used in Ethanol Production
106
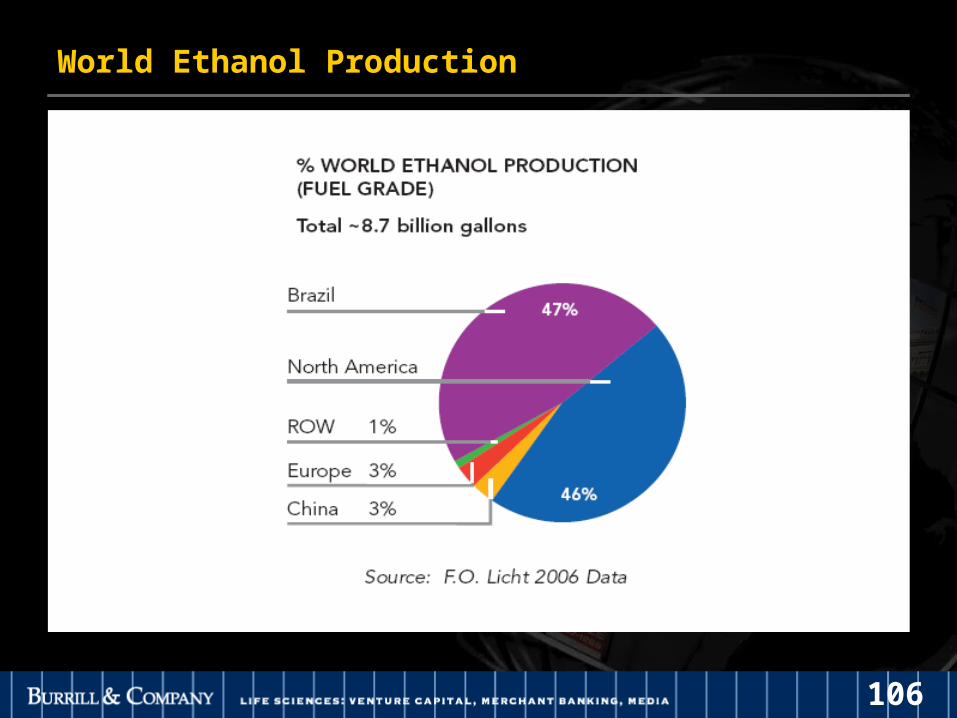
World Ethanol Production

107
Biofuel Yields of Selected Ethanol and Biodiesel Feedstock

108
Annual Biomass Resource Potential From Forest and Agricultural Resources
109
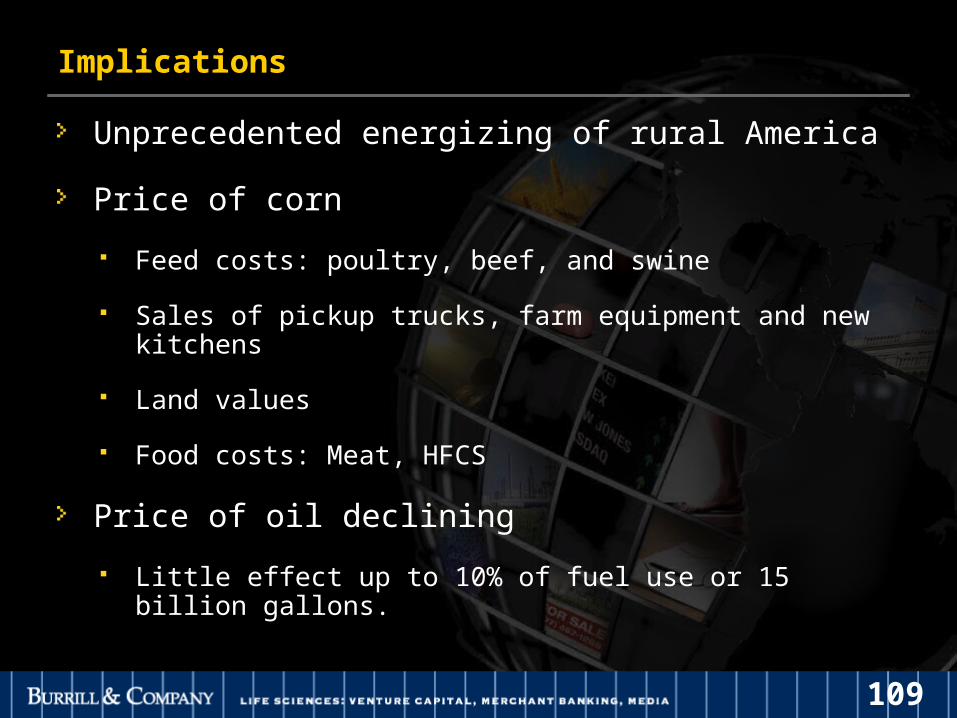
Implications
Unprecedented energizing of rural America
Price of corn
Feed costs: poultry, beef, and swine
Sales of pickup trucks, farm equipment and new kitchens
Land values
Food costs: Meat, HFCS
Price of oil declining
Little effect up to 10% of fuel use or 15 billion gallons.
110
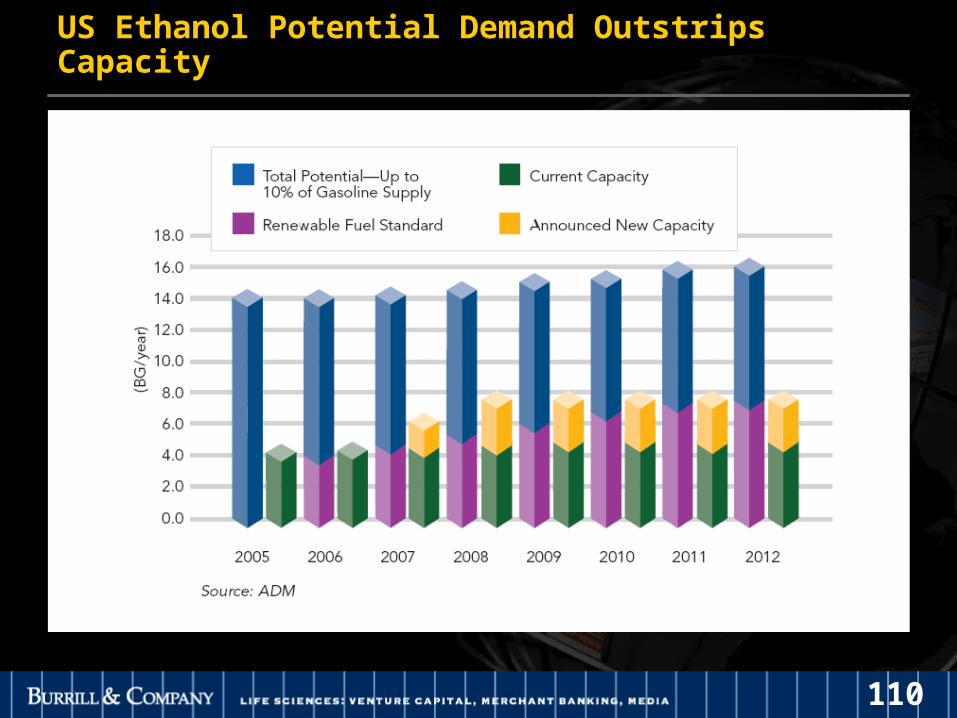
US Ethanol Potential Demand Outstrips Capacity

111
The technology is ready for prime time in The technology is ready for prime time in commercially relevant timelinescommercially relevant timelines
The $1 Trillion chemical industry is expected to grow by $500 billion in ten years – 50% from
Biotechnology
It’s Not Just About Energy

112
Non-biofuel products in the market
Plastics – NatureWorks, Serona, Metabolix
Enzymes – Detergents, bioprocessing
Specialty chemicals -
Biomaterials - emerging

113
TransformatiTransformation:on:Local Companies to Local Companies to Global CompaniesGlobal Companies
114
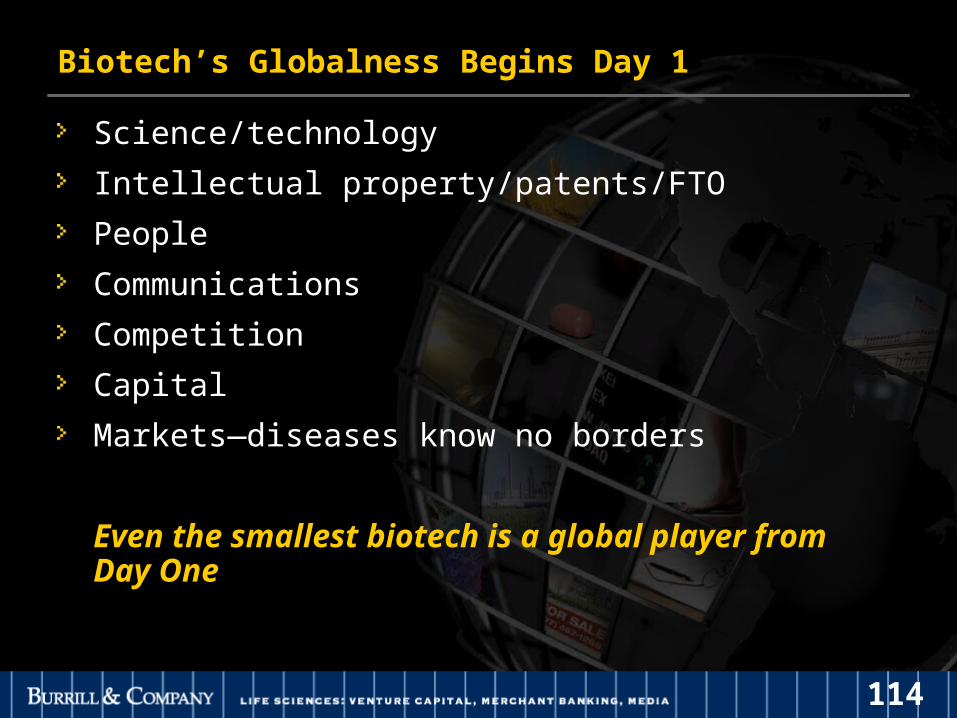
Biotech’s Globalness Begins Day 1
Science/technology
Intellectual property/patents/FTO
People
Communications
Competition
Capital
Markets—diseases know no borders
Even the smallest biotech is a global player from Day One

115
BIG PHARMA/PHARMABIG PHARMA/PHARMA
Bayer AG/Schering AG$ 19.9 billion
Merck KGaA/Serono$ 12.9 billion
UCB/Schwartz Pharma$ 5.4 billion
BIG PHARMA/BIOTECHBIG PHARMA/BIOTECH
Abbot/Kos$ 3.7 billion
Eli Lilly/Icos$ 2.1 billion
BIOTECH/BIOTECHBIOTECH/BIOTECH
Gilead/Myogen$ 2.5 billion
Genentech/Tanox$ 900 million
Genzyme/AnorMED$ 560 million
Illumina/Solexa$ 500 million
Mergers/ Acquisitions & Partnering
Astra Zeneca/
MedImmune$ 15 billion

116
Industry M&A Activity: Total Number of Deals by Total Deal Value

117
Big Pharma Alliances in 2006

118
Industry M&A Activity: Total Deal Number and Average Deal Value

119
Alliance Involving Regional Companies: China, India, Middle East
120
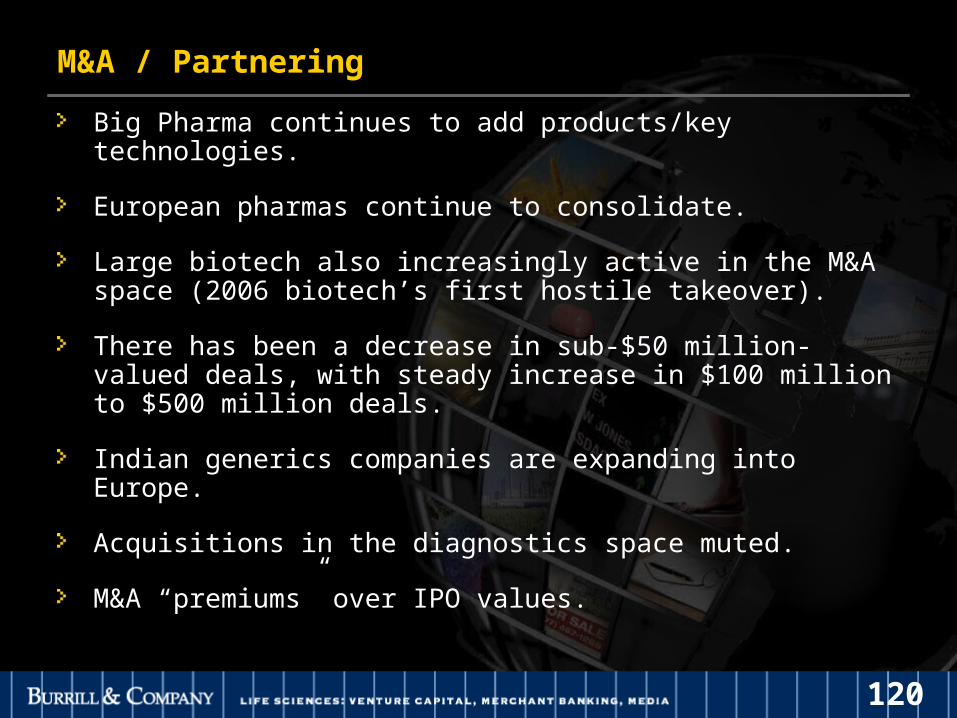
M&A / Partnering
Big Pharma continues to add products/key technologies.
European pharmas continue to consolidate.
Large biotech also increasingly active in the M&A space (2006 biotech’s first hostile takeover).
There has been a decrease in sub-$50 million-valued deals, with steady increase in $100 million to $500 million deals.
Indian generics companies are expanding into Europe.
Acquisitions in the diagnostics space muted.
M&A “premiums” over IPO values.
121
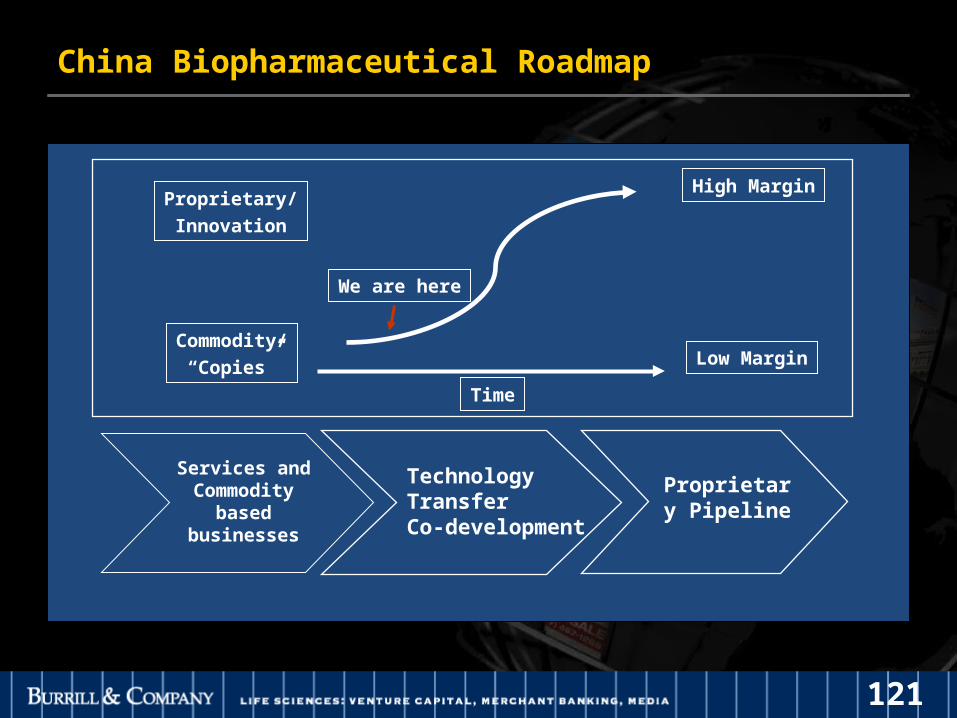
Time
Commodity/
“Copies”
Proprietary/
Innovation
Low Margin
High Margin
We are here
Technology TransferCo-development
Proprietary Pipeline
Services and Commodity
based businesses
China Biopharmaceutical Roadmap
122
Sources: *IMS Global Health
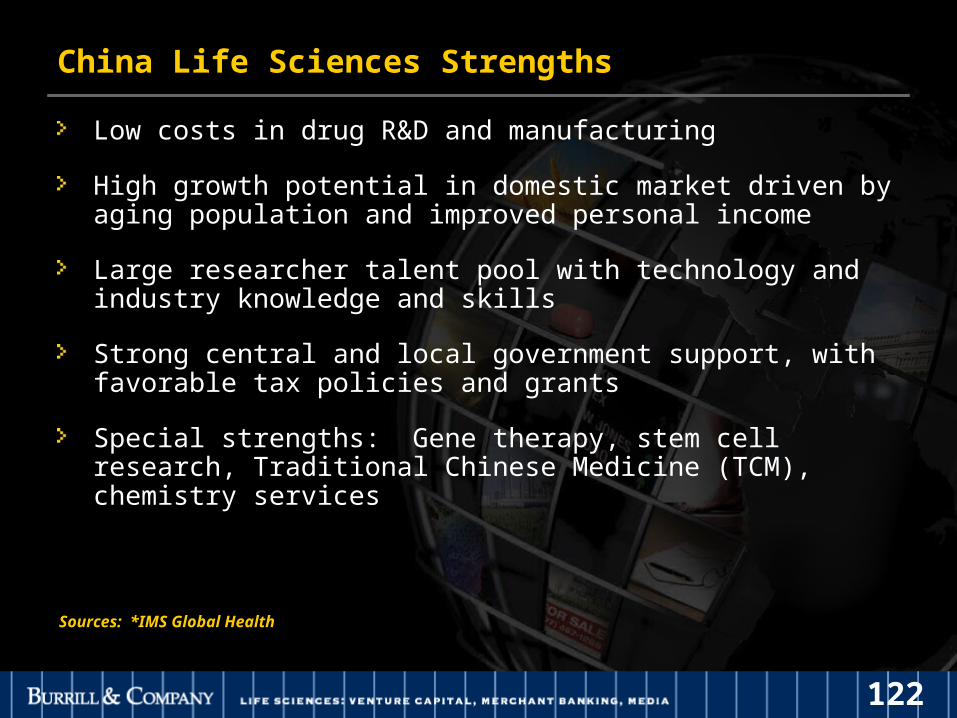
China Life Sciences Strengths
Low costs in drug R&D and manufacturing
High growth potential in domestic market driven by aging population and improved personal income
Large researcher talent pool with technology and industry knowledge and skills
Strong central and local government support, with favorable tax policies and grants
Special strengths: Gene therapy, stem cell research, Traditional Chinese Medicine (TCM), chemistry services

123
Indian Patents & Publications
0
50
100
150
200
250
300
1991
1992
1993
1994
1995
1996
1997
1998
1999
2000
2001
2002
Year
Publications
Patents
-Nature Magazine
India – Innovation is Increasing
State of Innovation:
Innovation historically has been in process improvement
However, there are a growing number of patents and publications from government and academic labs

124
Selected FDA Approved Plants Outside the U.S.
Source: Businessworld
0 10 20 30 40 50 60 70
Israel
Hungary
Taiwan
China
Spain
Italy
India 61
60
25
22
9
5
7

125
Malaysia is a player too…
Converting palm oil industry from food to energy
Investing in innovation through venture capital
Building the science base through collaboration with UCSF/QB3
Adding an accelerator strategy through global acquisition
Largest contingent represented at BIO ‘07

126
TransformatiTransformation:on:Local Financial Markets Local Financial Markets to to Global ArbitrageGlobal Arbitrage

127
US Biotech Industry Financings 2002-2007
2002 2003 2004 2005 2006 '07 to-date
IPO 445$ 456$ 1,701$ 819$ 920$ 1,670$
Follow-on 979 3,536$ 3,388$ 4,194$ 5,766$ 3,183$
PIPEs 1,007 2,051$ 2,417$ 2,376$ 2,027$ 1,461$
Debt 5,251 7,170$ 8,418$ 5,565$ 13,978$ 6,689$
VC 2,688$ 2,841$ 3,733$ 3,518$ 4,236$ 3,482$
Other 178$ 294$ 269$ 1,114$ 425$ 440$
Sub-Total $10,548 $16,348 19,927$ 17,586$ 27,352$ 16,925$
Partnering 7,496 8,933$ 10,933$ 17,268$ 19,796$ 18,153$
Total $18,044 $25,281 $30,860 $34,854 $47,148 $35,078
Source: Burrill & Company

128
Capital Raised 1980-2007
$0
$5,000
$10,000
$15,000
$20,000
$25,000
$30,000
$35,000
$40,000
$45,000
$50,000
1980 1981 1982 1983 1984 1985 1986 1987 1988 1989 1990 1991 1992 1993 1994 1995 1996 1997 1998 1999 2000 2001 2002 2003 2004 2005 2006 2007
Financings Partnering

129
Droughts
Rallies
0
10
20
30
40
50
60
1983 1986 1991 1995 2000 2003
Biotech’s Five Cycles Length of Rallies/Droughts in Months
0
10
20
30
40
50
60
1983 1986 1991 1995 2000 2003
Rallies
Droughts

130
Burrill Large Cap Index vs. NASDAQ, DOW
-5.00%
0.00%
5.00%
10.00%
15.00%
20.00%
25.00%
Sep-0
6
Oct-06
Nov-0
6
Dec-0
6
Jan-
07
Feb-0
7
Mar
-07
Apr-0
7
May
-07
Jun-
07
Jul-0
7
Aug-0
7
Sep-0
7
Burrill Large Cap
DJIA
NASDAQ

131
Small, Mid-Cap vs. NASDAQ, DOW
-10.00%
-5.00%
0.00%
5.00%
10.00%
15.00%
20.00%
25.00%
Sep-0
6
Oct-06
Nov-0
6
Dec-0
6
Jan-
07
Feb-0
7
Mar
-07
Apr-0
7
May
-07
Jun-
07
Jul-0
7
Aug-0
7
Sep-0
7
Burrill Mid Cap
DJIA
NASDAQ
Burill Small Cap

132
Billion-Dollar Club
112
90
60
36
58
162
66
46
19
36
82
85
68
32
48
92
100
70
47
51
104
104
54
46
55
91
101
65
44
59
91
103
66
45
60
0
100
200
300
400
500
'01 '02 '03 '04 '05 '06 '07
>1B500-1B250-500100-250<100
133
0
10
20
30
40
50
60
70
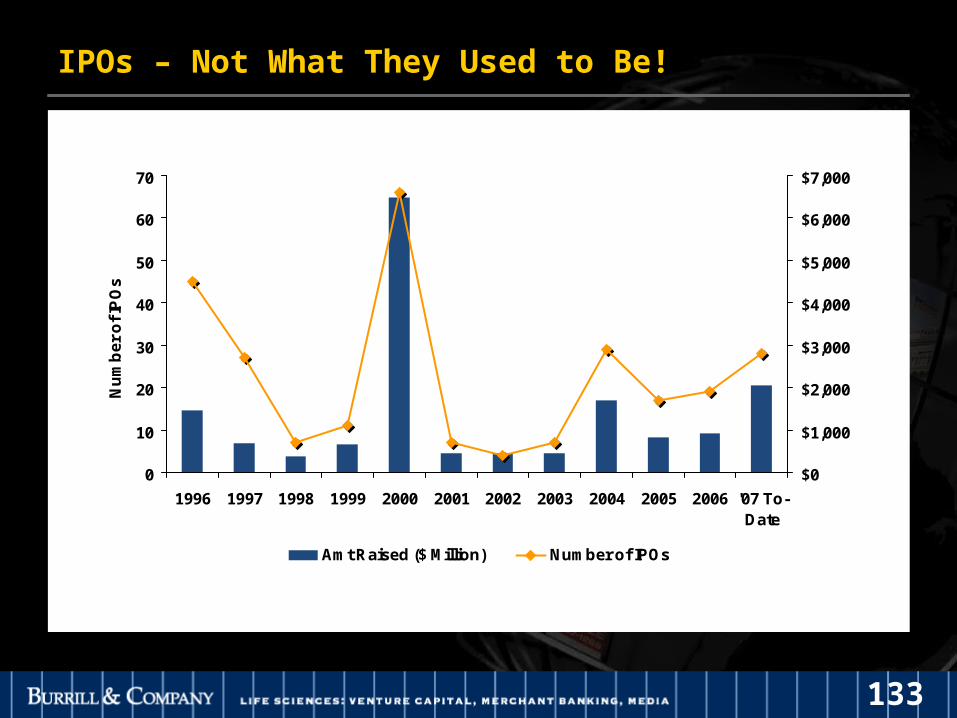
1996 1997 1998 1999 2000 2001 2002 2003 2004 2005 2006 '07 To-Date
Nu
mb
er
of
IPO
s
$0
$1,000
$2,000
$3,000
$4,000
$5,000
$6,000
$7,000
Amt Raised ($ Million) Number of IPOs
$1,628
$819 $920
$2,686
$438
29
19
7
17
27
0
5
10
15
20
25
30
35
2003 2004 2005 2006 1H07
Nu
mb
er
of
IPO
s
$0
$500
$1,000
$1,500
$2,000
$2,500
$3,000
$3,500
$4,000
$4,500
$5,000
Am
ou
nt
Ra
ise
d (
$ M
illio
n)
IPOs – Not What They Used to Be!
0
10
20
30
40
50
60
70
1996 1997 1998 1999 2000 2001 2002 2003 2004 2005 2006 '07 To-Date
Nu
mb
er
of
IPO
s
$0
$1,000
$2,000
$3,000
$4,000
$5,000
$6,000
$7,000
Amt Raised ($ Million) Number of IPOs

134
Company Amount Raised ($M)% Change
Issue to 9/28/07Market Cap
($M)Trubion 59.80 -6.69% 215.43Cadence 62.10 55.56% 407.54Achillion 59.50 -43.83% 100.78Catalyst 20.10 -46.67% 40.10Emergent 62.50 -28.96% 264.00Affymax 106.40 8.24% 402.92Rosetta Genomics 26.3 -0.71% 82.43Oculus Innovatis Sciences 24.2 -6.25% 89.103SBIO 123.2 -9.81% 313.56Optimer 49 18.71% 192.29Synta 50 -34.00% 223.28Molecular Insight 70 -51.50% 168.39Xtent 75.2 -46.88% 206.90Tongjitang CH MD 98.7 4.50% 349.24Orixegen Therapeutics 84 10.08% 355.48Pharmasset 45 35.11% 256.21Simcere 227 9.86% 959.46Amicus 75 11.40% 372.30NeurogesX 44 -20.91% 116.84Eurand 112 0.94% 708.34Biodel 75 13.60% 343.53Helicos BioSciences 48.6 -3.33% 182.00Sirtris 69 55.98% 490.20Response Genetics 24.5 -37.86% 44.54Jazz 108 -37.78% 274.96ImaRx Therapeutics 15 -32.00% 34.00Sucampo 43.1 -6.52% 454.24WuXi Pharma Tech 185 101.43% 697.67
Avg: 72.94 -3% 298.06
Life Science Financing OverviewSept ’06 to Sept ‘07 IPOs
Total IPOs = 28Avg Amt Raised: $72.94MAvg % Change a/o 9/28/07: -3%Avg Market Cap: $298M

135
Finance and Capital Markets
The global financial markets have created additional opportunities for companies to look outside their borders for financing
Europeans on NASDAQ/NYSE
Chinese on NYSE
Americans on AIM/Euronext/SWX
Other markets are available Mothers (Tokyo) DFX (Dubai) Hong Kong

136
TransformatiTransformation:on:FIPCO’s to VIPCO’sFIPCO’s to VIPCO’s

137
FIPCO (Fully Integrated Pharma Co.)
ResearchTechnology
Manufacturing
Clinical &Regulatory
Sales &Distribution
CSO
CMO
CROs
Partnerships
Academia, Scientific, Institutions
R&D
Preclinical Support
Clinical Development
Manufacturing
Sales & Distribution
Preclinical CRO
VIPCO (Virtually Integrated Pharma Co.)
Changing Business Models

138
So the predictions for So the predictions for 2008…2008…

139
The Predictions for Biotech in 2008
Heated debate on healthcare - campaign trail for the 2008 presidential election
Sales of products will continue to increase, but reimbursement becomes more challenging
Despite stricter regulatory oversight, more products to the marketplace
Regulators
Raising the bar for innovation, theranostics
Pharmacovigilence is the name of the game
Drug safety will continue to be a major issue

140
The Predictions for Biotech in 2008 (continued)
Congress aiming to add power to Medicare to negotiate what it pays for drugs
Congress may reduce the capital gains differential (bad for the capital raising side of the industry)
Both big Pharma and big Biotech will be competing for companies with advanced product pipelines
We will see US biotechs accessing capital overseas…international companies accessing capital in non-local markets

141
Biofuels boom
Ag/Animal Health continue to progress
“Capital Markets” more robust than 2006/2007 in the US
~35 IPO’s (Laguna ’07 to Laguna ’08)
2008 $50+ billion will be raised by the US biotechs
MKT Cap will reach an all time high of $600B
Of the 60 IPO’s completed by 2006, most all trading above offer price by end of 2007
The Predictions for Biotech in 2008 (continued)

142
Biotech’s globality increases with US dominance continuing to decrease
US research engine faces challenging times
Non-health care aspects of biotech also becoming less dominant as industrial, biofuels, ag increase in importance
Clusters are redefined away from geography to virtual clusters (diseases, markets, unique industry segments)
Business models continue to evolve
The Predictions for Biotech in 2008 (continued)

143
The Future of Life The Future of Life Sciences:Sciences:

144
What does our world look like 15 years from now?
Drug discovery in silico / adaptive trials in market place
Personalized health record (including genotype) on smart card / walk-in clinics and consumerization of healthcare
Wellness care – pre-symptomatic Dx and preventive medicine
Products are combination of Dx/delivery/device/Rx
Spare parts – regenerative medicine
Governments are big customers
Business models change
Today’s pharmas are tomorrow’s “distributors” (outsource innovation/ development/manufacturing)
Biotech’s virtually integrated
“Biotechs” dominates innovation / pharmas are distributors
145
Purdue Discovery Lecture Series
Biotech 2007: A Global Transformation
G. Steven Burrill, CEOBurrill & Company
West Lafayette, IN, November 8, 2007