1 q12 conference call presentation
DESCRIPTION
TRANSCRIPT
1
Teleconferência - 4º Trimestre de 2011
Anis Chacur Neto Sergio Lulia Jacob CEO Vice-Presidente Financeiro
May | 3rd | 2012
Conference Call – 1st Quarter 2012
Anis Chacur Neto Alexandre Sinzato CEO Head de Relações com Investidores
2
Highlights
2
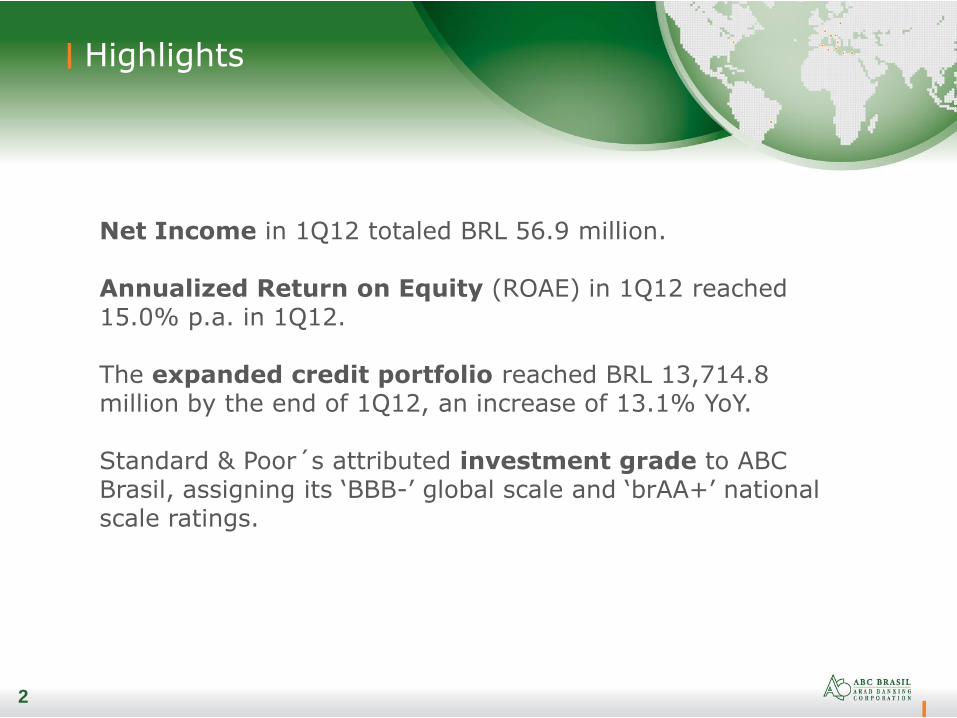
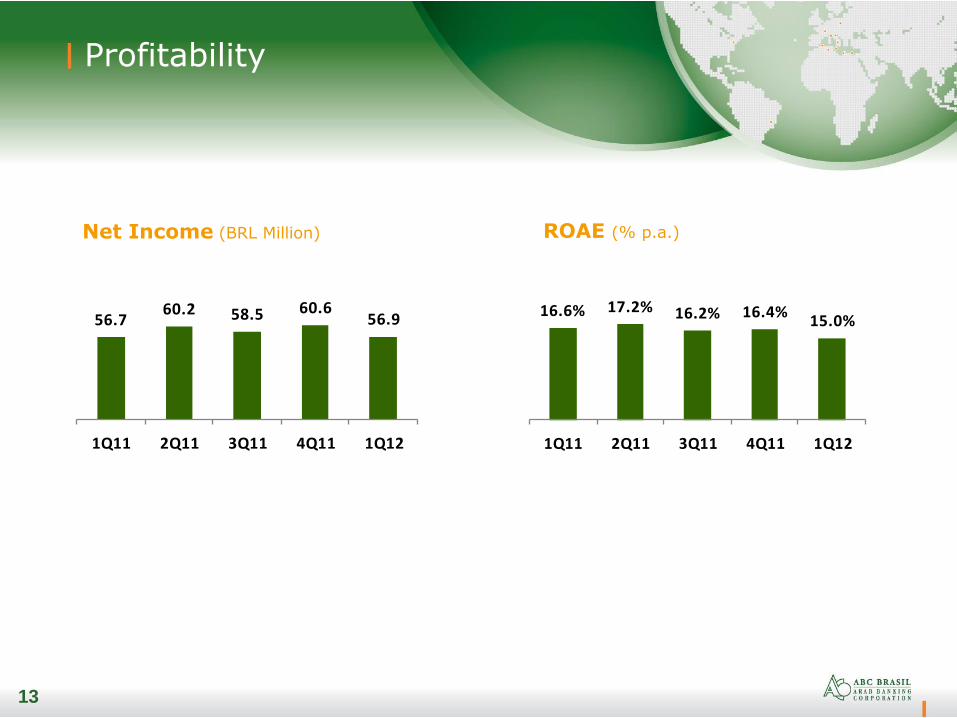
Net Income in 1Q12 totaled BRL 56.9 million. Annualized Return on Equity (ROAE) in 1Q12 reached 15.0% p.a. in 1Q12. The expanded credit portfolio reached BRL 13,714.8 million by the end of 1Q12, an increase of 13.1% YoY. Standard & Poor´s attributed investment grade to ABC Brasil, assigning its ‘BBB-’ global scale and ‘brAA+’ national scale ratings.
3
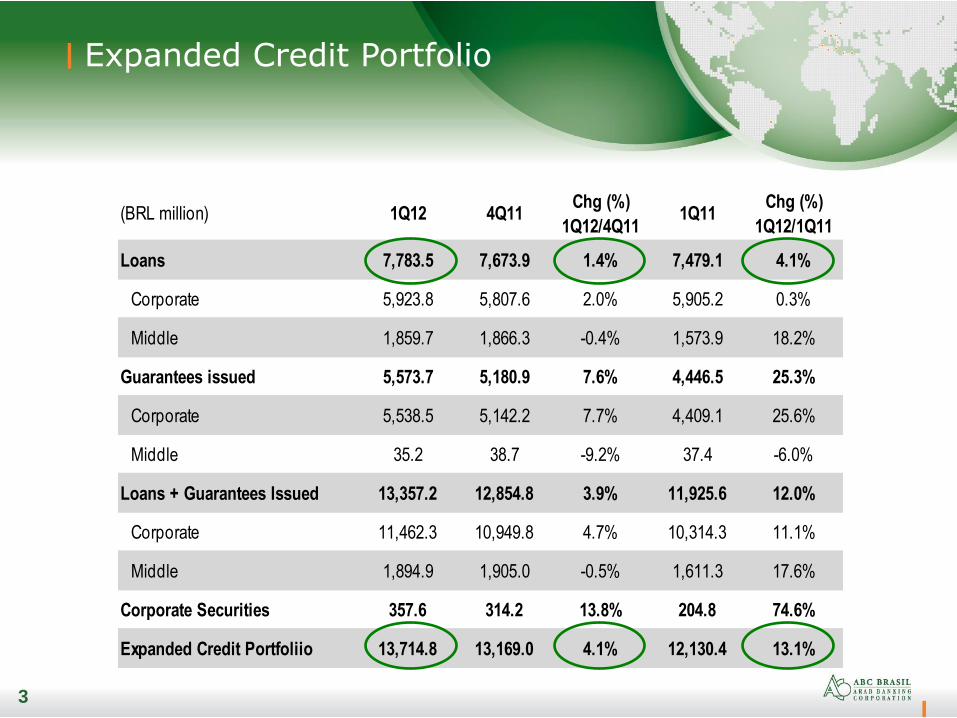
(BRL million) 1Q12 4Q11Chg (%)
1Q12/4Q111Q11
Chg (%)
1Q12/1Q11
Loans 7,783.5 7,673.9 1.4% 7,479.1 4.1%
Corporate 5,923.8 5,807.6 2.0% 5,905.2 0.3%
Middle 1,859.7 1,866.3 -0.4% 1,573.9 18.2%
Guarantees issued 5,573.7 5,180.9 7.6% 4,446.5 25.3%
Corporate 5,538.5 5,142.2 7.7% 4,409.1 25.6%
Middle 35.2 38.7 -9.2% 37.4 -6.0%
Loans + Guarantees Issued 13,357.2 12,854.8 3.9% 11,925.6 12.0%
Corporate 11,462.3 10,949.8 4.7% 10,314.3 11.1%
Middle 1,894.9 1,905.0 -0.5% 1,611.3 17.6%
Corporate Securities 357.6 314.2 13.8% 204.8 74.6%
Expanded Credit Portfoliio 13,714.8 13,169.0 4.1% 12,130.4 13.1%
Expanded Credit Portfolio
3
4
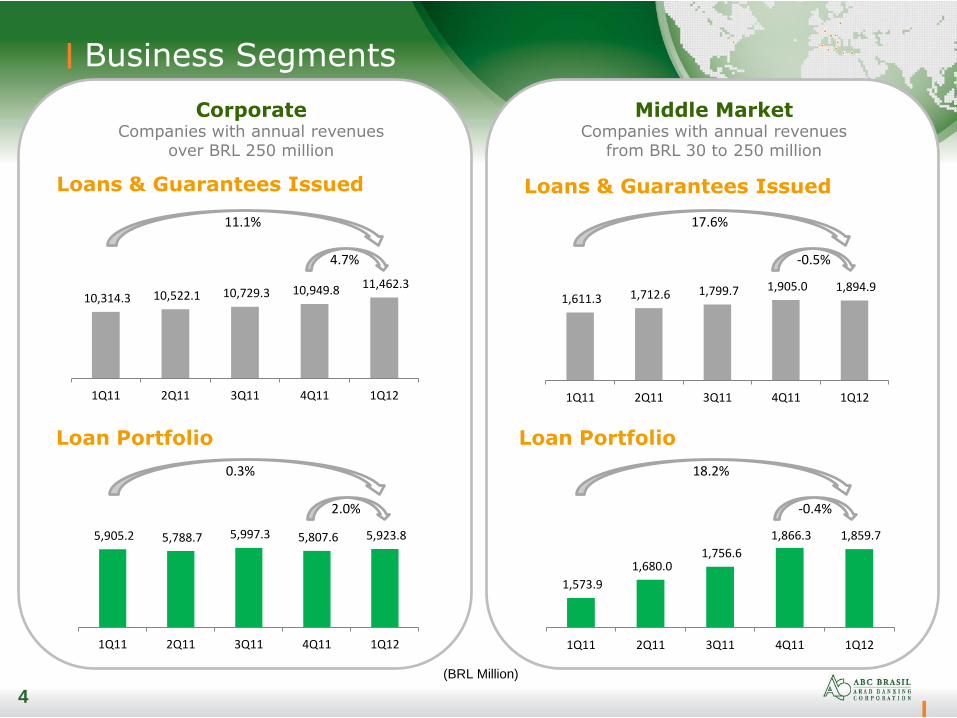
Business Segments
4
Loan Portfolio
Corporate Companies with annual revenues
over BRL 250 million
Loan Portfolio
Middle Market Companies with annual revenues
from BRL 30 to 250 million
Loans & Guarantees Issued
17.6%
-0.5%
0.3%
2.0%
18.2%
-0.4%
(BRL Million)
11.1%
4.7%
1,611.3 1,712.6 1,799.7 1,905.0 1,894.9
1Q11 2Q11 3Q11 4Q11 1Q12
10,314.3 10,522.1 10,729.3 10,949.8 11,462.3
1Q11 2Q11 3Q11 4Q11 1Q12
5,905.2 5,788.7 5,997.3 5,807.6 5,923.8
1Q11 2Q11 3Q11 4Q11 1Q12
1,573.9
1,680.0 1,756.6
1,866.3 1,859.7
1Q11 2Q11 3Q11 4Q11 1Q12
Loans & Guarantees Issued
5
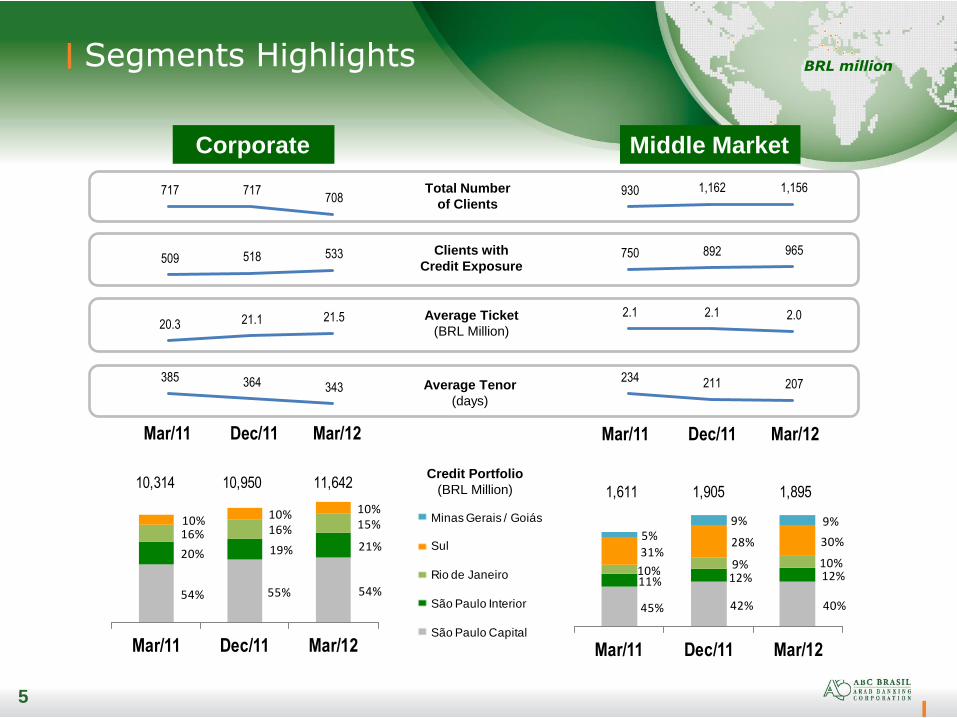
Segments Highlights
5
Corporate Middle Market
Average Ticket
(BRL Million)
Average Tenor
(days)
Total Number
of Clients
Clients with
Credit Exposure
Credit Portfolio
(BRL Million)
BRL million
Minas Gerais / Goiás
Sul
Rio de Janeiro
São Paulo Interior
São Paulo Capital
Mar/11 Dec/11 Mar/12 Mar/11 Dec/11 Mar/12
717 717 708
509 518 533
20.3 21.1 21.5
930 1,162 1,156
750 892 965
2.1 2.1 2.0
234 211 207
54% 55% 54%
20% 19% 21%16% 16% 15%10% 10% 10%
Mar/11 Dec/11 Mar/12
10,314 10,950 11,642
45% 42% 40%
11% 12% 12%10% 9% 10%31%
28% 30%5%9% 9%
Mar/11 Dec/11 Mar/12
1,611 1,905 1,895
385 364 343
6 6
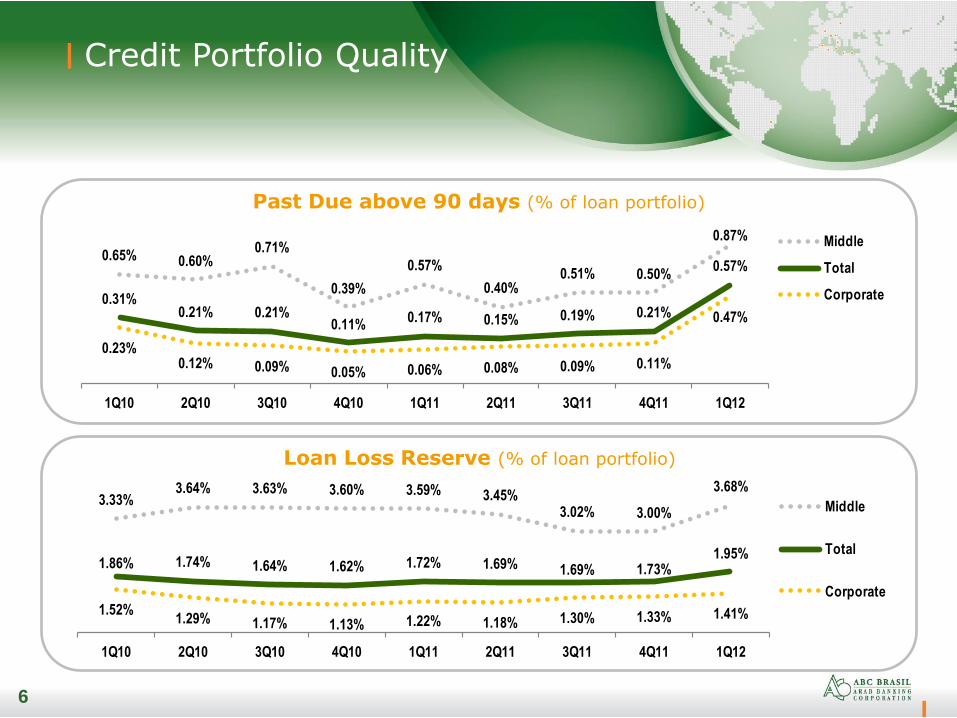
Credit Portfolio Quality
Past Due above 90 days (% of loan portfolio)
Loan Loss Reserve (% of loan portfolio)
0.65% 0.60%0.71%
0.39%
0.57%
0.40%0.51% 0.50%
0.87%
0.31%0.21% 0.21%
0.11%0.17% 0.15% 0.19% 0.21%
0.57%
0.23%0.12% 0.09% 0.05% 0.06% 0.08% 0.09% 0.11%
0.47%
1Q10 2Q10 3Q10 4Q10 1Q11 2Q11 3Q11 4Q11 1Q12
Middle
Total
Corporate
3.33%3.64% 3.63% 3.60% 3.59% 3.45%
3.02% 3.00%
3.68%
1.86% 1.74% 1.64% 1.62% 1.72% 1.69% 1.69% 1.73%1.95%
1.52%1.29% 1.17% 1.13% 1.22% 1.18% 1.30% 1.33% 1.41%
1Q10 2Q10 3Q10 4Q10 1Q11 2Q11 3Q11 4Q11 1Q12
Middle
Total
Corporate
7 7
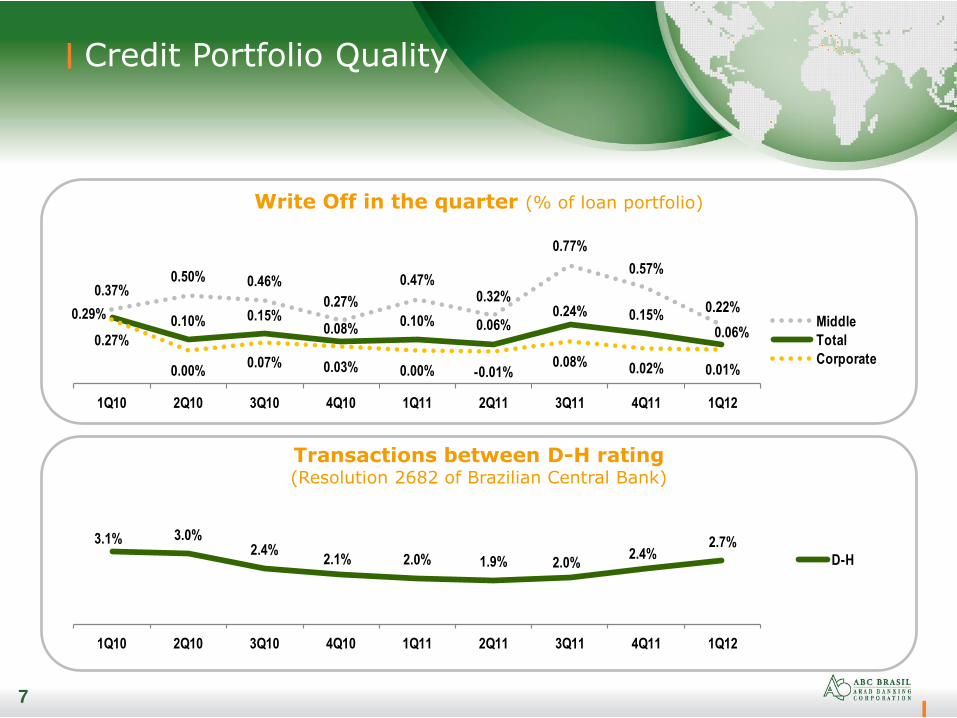
Credit Portfolio Quality
Transactions between D-H rating (Resolution 2682 of Brazilian Central Bank)
Write Off in the quarter (% of loan portfolio)
3.1% 3.0%2.4%
2.1% 2.0% 1.9% 2.0%2.4%
2.7%
1Q10 2Q10 3Q10 4Q10 1Q11 2Q11 3Q11 4Q11 1Q12
D-H
0.37%0.50% 0.46%
0.27%
0.47%0.32%
0.77%
0.57%
0.22%0.29%0.10% 0.15%
0.08%0.10% 0.06%
0.24% 0.15%
0.06%0.27%
0.00%0.07% 0.03% 0.00% -0.01%
0.08% 0.02% 0.01%
1Q10 2Q10 3Q10 4Q10 1Q11 2Q11 3Q11 4Q11 1Q12
Middle
Total
Corporate
8
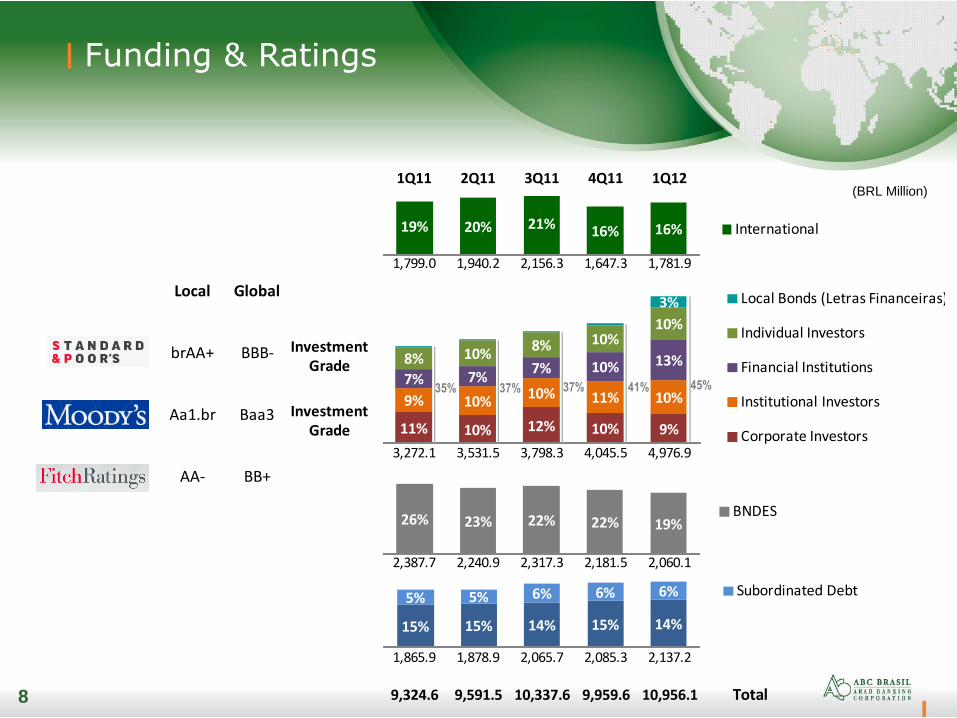
Funding & Ratings
8
(BRL Million)
InvestmentGrade
InvestmentGrade
Local Global
brAA+ BBB-
Aa1.br Baa3
AA- BB+
1Q11 2Q11 3Q11 4Q11 1Q12
1,799.0 1,940.2 2,156.3 1,647.3 1,781.9
3,272.1 3,531.5 3,798.3 4,045.5 4,976.9
2,387.7 2,240.9 2,317.3 2,181.5 2,060.1
1,865.9 1,878.9 2,065.7 2,085.3 2,137.2
9,324.6 9,591.5 10,337.6 9,959.6 10,956.1 Total
15% 15% 14% 15% 14%
5% 5% 6% 6% 6% Subordinated Debt
26% 23% 22% 22% 19%BNDES
19% 20% 21% 16% 16% International
11% 10% 12% 10% 9%
9% 10%10% 11% 10%
7% 7%7% 10% 13%8% 10%8% 10%
10%
3% Local Bonds (Letras Financeiras)
Individual Investors
Financial Institutions
Institutional Investors
Corporate Investors
35% 37% 37% 41% 45%
9
Basel Index & Shareholders´ Equity
9
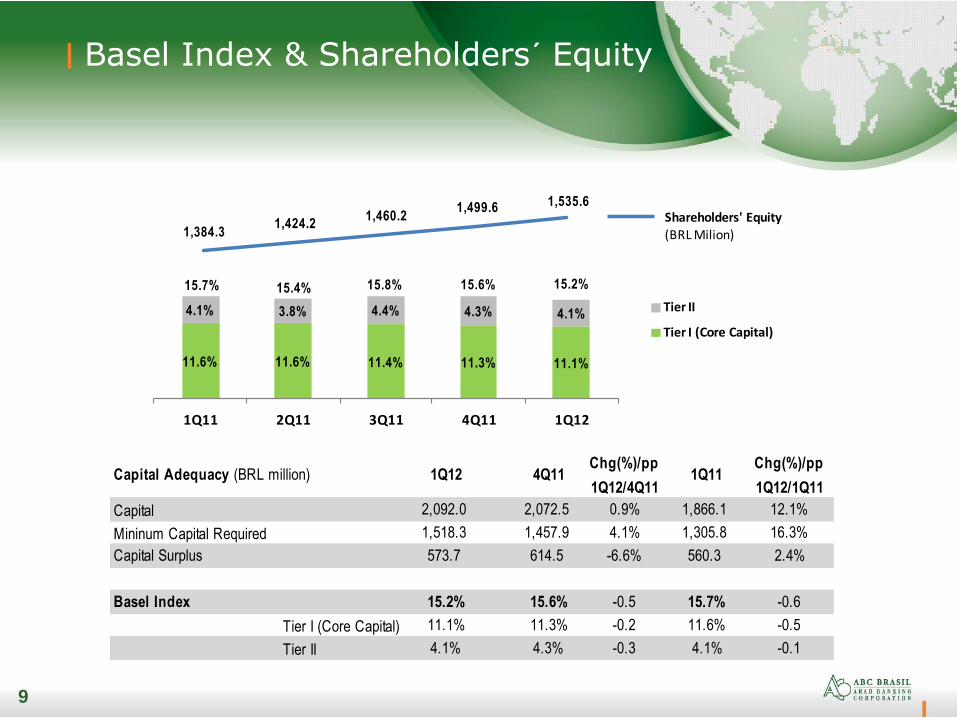
11.6% 11.6% 11.4% 11.3% 11.1%
4.1% 3.8% 4.4% 4.3% 4.1%
1Q11 2Q11 3Q11 4Q11 1Q12
Tier II
Tier I (Core Capital)
Shareholders' Equity(BRL Milion)
15.7% 15.4% 15.8% 15.6% 15.2%
1,384.3 1,424.2
1,460.2 1,499.6 1,535.6
Capital Adequacy (BRL million) 1Q12 4Q11Chg(%)/pp
1Q12/4Q111Q11
Chg(%)/pp
1Q12/1Q11
Capital 2,092.0 2,072.5 0.9% 1,866.1 12.1%
Mininum Capital Required 1,518.3 1,457.9 4.1% 1,305.8 16.3%
Capital Surplus 573.7 614.5 -6.6% 560.3 2.4%
Basel Index 15.2% 15.6% -0.5 15.7% -0.6
Tier I (Core Capital) 11.1% 11.3% -0.2 11.6% -0.5
Tier II 4.1% 4.3% -0.3 4.1% -0.1
10
Financial Margin
10
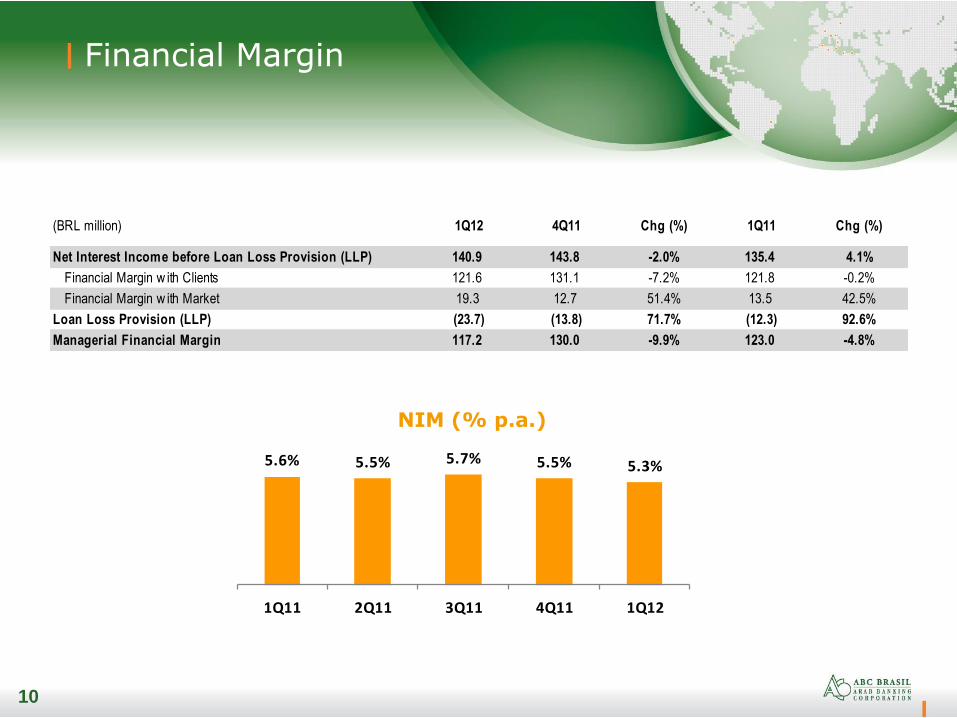
NIM (% p.a.)
5.6% 5.5% 5.7% 5.5% 5.3%
1Q11 2Q11 3Q11 4Q11 1Q12
(BRL million) 1Q12 4Q11 Chg (%) 1Q11 Chg (%)
Net Interest Income before Loan Loss Provision (LLP) 140.9 143.8 -2.0% 135.4 4.1%
Financial Margin w ith Clients 121.6 131.1 -7.2% 121.8 -0.2%
Financial Margin w ith Market 19.3 12.7 51.4% 13.5 42.5%
Loan Loss Provision (LLP) (23.7) (13.8) 71.7% (12.3) 92.6%
Managerial Financial Margin 117.2 130.0 -9.9% 123.0 -4.8%

11
Income from Services
11
14.9 16.5 17.4 19.6 20.8 22.6 23.5 23.8 24.2
7.18.1 4.9
6.96.8 5.4 4.2 3.8 3.3
2.41.6 0.5
8.2
2.0 2.8 2.47.2
1.9
1T10 2T10 3T10 4T10 1T11 2T11 3T11 4T11 1T12
Capital Markets and
M&A Fees
Banking Tariffs
Guarantees Issued
(BRL Million)
19.3% 20.3%17.6%
23.8%
19.7% 20.3%18.3%
20.6%18.3%
Income from ServicesTotal of Revenues
Banking Service Fees (BRL million) 1Q12 4Q11 Chg (%) 1Q11 Chg (%)
Guarantees Issued 24.2 23.8 1.4% 20.8 16.0%
Capital Markets and M&A Fees 1.9 7.2 -73.8% 2.0 -5.9%
Banking Tariffs 3.3 3.8 -13.0% 6.8 -51.7%
Total 29.3 34.8 -15.8% 29.6 -1.0%
12
Expenses
12
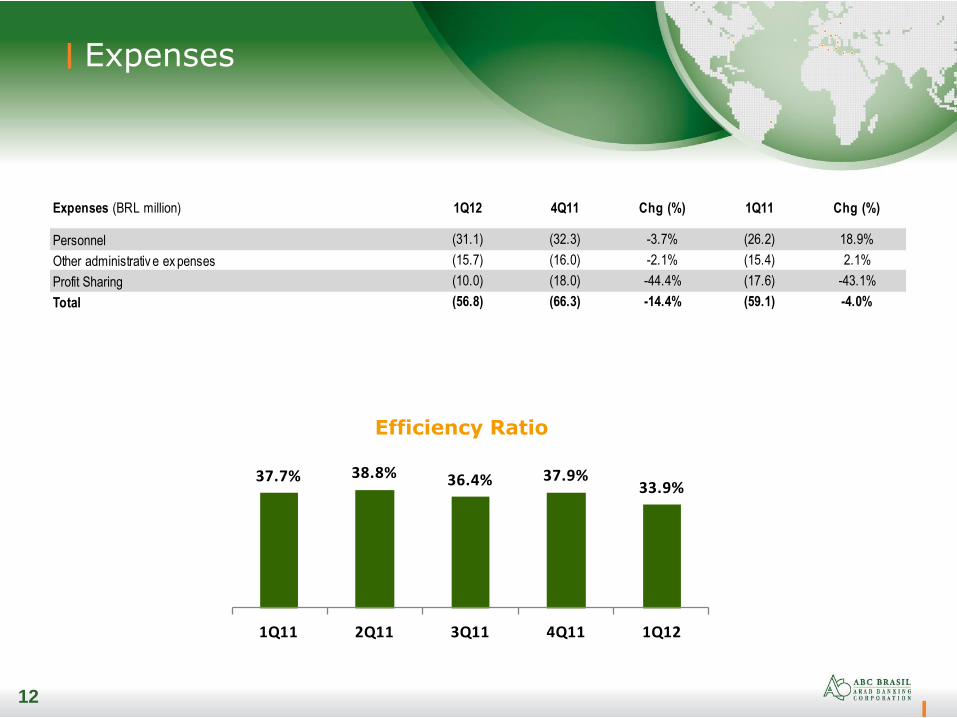
Efficiency Ratio
37.7% 38.8% 36.4% 37.9%33.9%
1Q11 2Q11 3Q11 4Q11 1Q12
Expenses (BRL million) 1Q12 4Q11 Chg (%) 1Q11 Chg (%)
Personnel (31.1) (32.3) -3.7% (26.2) 18.9%
Other administrativ e ex penses (15.7) (16.0) -2.1% (15.4) 2.1%
Profit Sharing (10.0) (18.0) -44.4% (17.6) -43.1%
Total (56.8) (66.3) -14.4% (59.1) -4.0%
13
Profitability
13
Net Income (BRL Million) ROAE (% p.a.)
56.760.2 58.5 60.6
56.9
1Q11 2Q11 3Q11 4Q11 1Q12
16.6% 17.2% 16.2% 16.4%15.0%
1Q11 2Q11 3Q11 4Q11 1Q12

14
Investor Relations
14
Sergio Lulia Jacob Financial Vice-President
Alexandre Sinzato, CFA Head of Investor Relations
Web Site: www.abcbrasil.com.br/ir Email: [email protected] Phone: +55 (11) 3170-2186

15
Disclosure
The following material, on this date, is a presentation containing general information about the Banco ABC Brasil S.A. We offer no guarantee and make no declaration, implicitly or explicitly, as to the accuracy, completeness or scope of this information. This presentation may include forward-looking statements of future events or results according to the regulations of the Brazilian and International securities and exchange commissions. These statements are based on certain assumptions and analyses by the Company that reflect its experience, the economic environment, future market conditions and expected events by the company, many of which are beyond the control of the Company. Important factors that may lead to significant differences between the actual results and the statements of expectations about future events or results include the company’s business strategy, Brazilian and International economic conditions, technology, financial strategy, financial market conditions, uncertainty regarding the results of its future factors, operations, plans, objectives, expectations and intentions, among others. Considering these factors, the actual results of the company may be significantly different from those shown or implicit in the statement of expectations about future events or results. The information and opinions contained in this presentation should not be understood as a recommendation to potential investors and no investment decision is to be based on the veracity, current events or completeness of this information or these opinions. No advisors to the company or parties related to them or their representatives should have any responsibility for any losses that may result from the use or contents of this presentation.