1 quotas of the member states traditional methodology computation, drawbacks and alternatives
TRANSCRIPT

1
QUOTAS OF THE MEMBER STATES
TRADITIONAL METHODOLOGYCOMPUTATION, DRAWBACKS AND
ALTERNATIVES

2
QUOTAS -TRADITIONAL METHOD
• The Traditional Method is the simplest approach to compute a scale of quota assessments
• However, it results in a scale that, under present circumstances, does not strictly adhere to the “ability to pay” principle

3
QUOTAS -TRADITIONAL METHOD
• The methodology consists of three steps:
1. Establish a maximum quota of 59.47% (United States)
2. Establish a minimum quota of 0.020% for those member states who pay the minimum quota at the UN (0.001% which applies to 8 OAS member states)
3. Multiply the UN quota of the remaining 26 member states, whose aggregate UN quota is 8.149%, by a factor of 4.954*
The minimum and maximum quotas are set by agreement among the member states
*See Annex I for calculation of this factor

4
QUOTAS -TRADITIONAL METHOD
The scale adds up to 100%
United States 59.470%
8 member states paying minimum at UN (8 x 0.020) 0.160
Remaining 26 member states (8.149 x 4.954) 40.370
Total: 100.000%

5
TRADITIONAL METHODSHORTCOMINGS
• The problem with this approach is that it would result in calculated quotas that are below the agreed-upon minimum of 0.020%. (See Annex II)
• St. Lucia, for example, has a UN quota of 0.002%. Multiplying it by the correction factor of 4.954 would yield a quota of 0.010%
• Similar results are obtained when the factor is applied to Antigua and Barbuda and Haiti, whose UN quota is 0.003%, yielding an OAS quota of 0.015%

6
TRADITIONAL METHODSHORTCOMINGS
• This situation could be remedied by applying the minimum quota of 0.020% to St. Lucia, Antigua and Barbuda, and Haiti.
• The difference in percentage points would be redistributed among the remaining 23 member states (see Annex III for results)
7
TRADITIONAL METHODSHORTCOMINGS
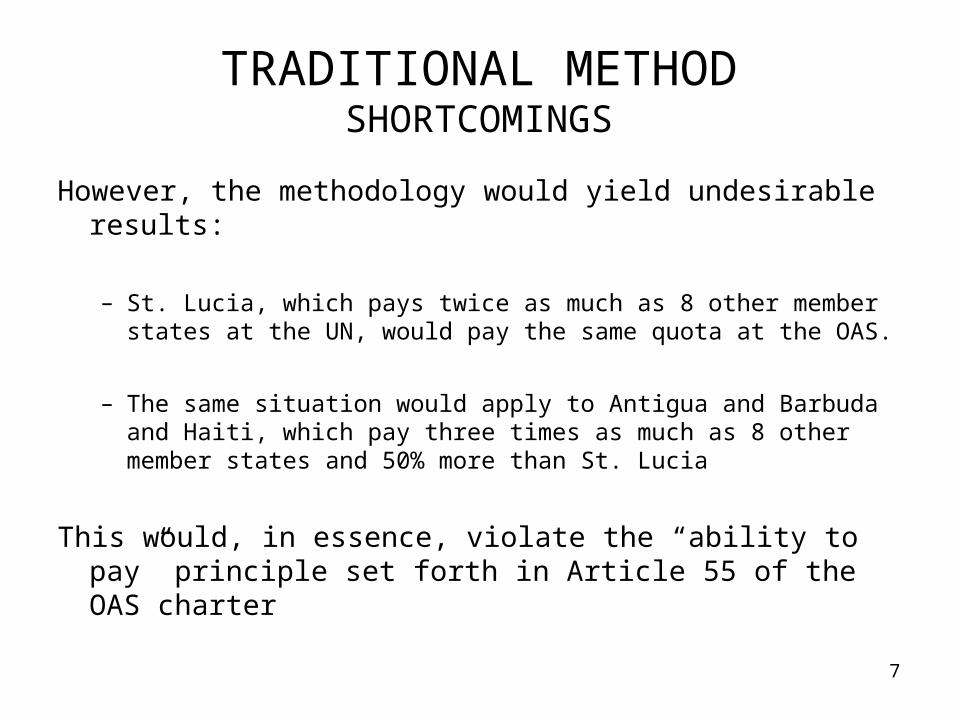
However, the methodology would yield undesirable results:
– St. Lucia, which pays twice as much as 8 other member states at the UN, would pay the same quota at the OAS.
– The same situation would apply to Antigua and Barbuda and Haiti, which pay three times as much as 8 other member states and 50% more than St. Lucia
This would, in essence, violate the “ability to pay” principle set forth in Article 55 of the OAS charter

8
TRADITIONAL METHODALTERNATIVES
• The traditional methodology is essentially a “linear”, or constant-proportionality, calculation. As we have established, it is not appropriate for the calculation of OAS scales, given current UN quotas.
• The next alternative is an exponential relationship of the form:Y = aXb + c
Where:Y = OAS quotaX = UN quota, anda, b, and c are parameters to be determined using optimization methods (see
Annex IV for an example of the resulting scale)
• This solution yields a scale that reflects the UN rankings and meets the constraints of minimum and maximum quotas

9
ALTERNATIVE METHODY = aXb + c
• This methodology was first proposed in 1998, along with another variation thereof.
• The member states were unsuccessful in reaching an agreement on a quota scale based on any of the alternative methodologies presented.
• In 2000, a more sophisticated approach was first proposed, using logistic regression as the basis for a new mathematical formula. This is the latest methodology presented to the CAAP for consideration

10
ANNEX ITRADITIONAL METHOD
• The following charts describe the step-by-step calculation of the scale using the traditional method

11
OAS MEMBER STATES PAY 30.157% OF THE TOTAL UN QUOTA
0
5
10
15
20
25
30
35
UN
Total UN = 22.000+0.008+8.149=
30.157
OAS member states pay 30.157% of the entire UN
Quota.
United States22.000%
Other OAS Member States8.149%
Member States paying UN Minimum0.008%

12
CALCULATING A NEW QUOTA SCALE
0
20
40
60
80
100
120
UN OAS
Total UN = 22.000+0.008+8.149=
30.157
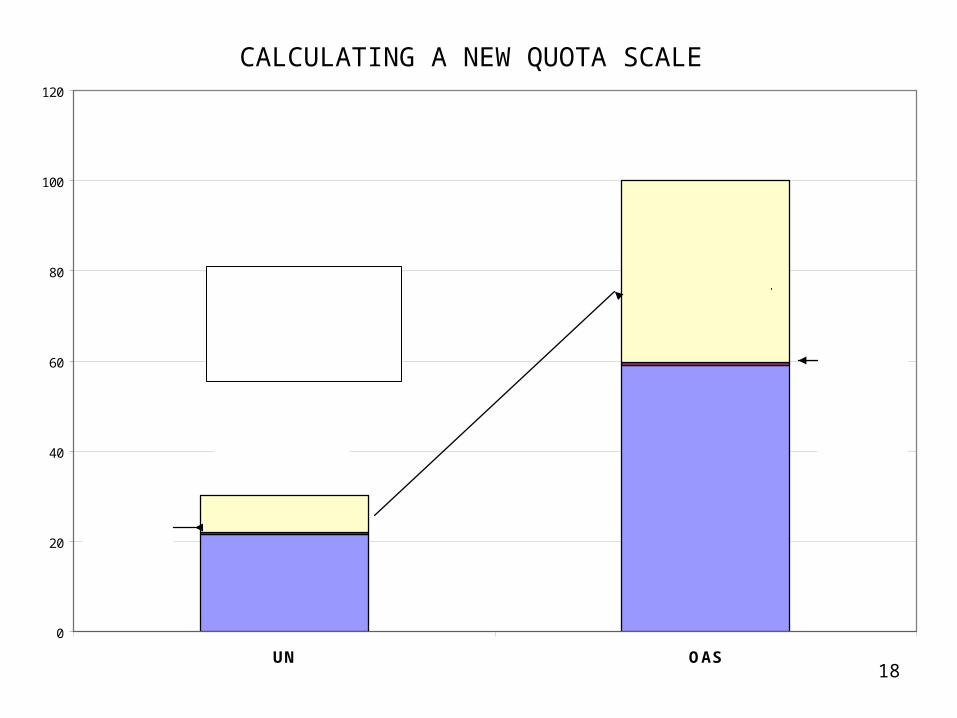
Total OAS = 100.0%
The new quota scale would "transform" UN quotas into new values in an OAS scale that would add up to 100%
US22.000%
US
Other MMSS 8.149%
Other Member States
MMSS paying min
0.008%
MMSS paying min

13
CALCULATING A NEW QUOTA SCALE
0
20
40
60
80
100
120
UN OAS
Total UN = 22.000+0.008+8.149=
30.157
Total OAS = 100.0%
The most simplistic approach would be to multiply UN
quotas by a factor of 3.316
(since 100/30.157 = 3.316)
US22.000%
US
Other MMSS 8.149%
Other Member States
MMSS paying min
0.008%
MMSS paying min

14
CALCULATING A NEW QUOTA SCALE
22.000
0
20
40
60
80
100
120
UN OAS
However, this approach would not work, since the US pays almost 73%
of the relative portion of all the member states' quotas at the UN
(above the established maximum of 59.47%)
22.000 x 3.316 = 72.952
72.952
US
USmaximum at OAS = 59.47%
Other Member States
Other MMSS 8.149% MMSS paying min
0.008%
Total UN = 22.000+0.008+8.149
= 30.157
MMSS paying min

15
CALCULATING A NEW QUOTA SCALE
0
20
40
60
80
100
120
UN OAS
Total UN = 22.000+0.008+8.149=
30.157
The new quota scale should take into account the pre-established minimum and maximum limits of 0.020%
and 59.47%
US22.000%
US
Other MMSS 8.149% MMSS paying min
0.008%
MMSS paying min
at UN
Other Member States

16
CALCULATING A NEW QUOTA SCALE
0
20
40
60
80
100
120
UN OAS
Total UN = 22.000+0.008+8.149=
30.157
The US would pay the maximun
59.47%
US22.000%
US59.47%
Other MMSS 8.149% MMSS paying min
0.008%
MMSS paying min
at UN
Other Member States

17
CALCULATING A NEW QUOTA SCALE
0
20
40
60
80
100
120
UN OAS
Total UN = 22.000+0.008+8.149=
30.157
Eight member states paying the minimum at the UN,
would pay the OAS minimum, or
8 x 0.020 = 0.16
US22.000%
US59.47%
Other MMSS 8.149% MMSS paying min
0.008%
MMSS paying minat UN would pay min at the OAS, or
0.16%
Other Member States
18
CALCULATING A NEW QUOTA SCALE
0
20
40
60
80
100
120
UN OAS
Total UN = 22.000+0.008+8.149=
30.157
Total OAS = 59.47+0.16+40.37=
100.0
To have the scale add up to 100%, the remaining member
states would pay their UN quota multiplied by a
constant factor
US22.000%
US59.47%
Other MMSS 8.149% MMSS paying min
0.008%
MMSS paying minat UN would pay min at the OAS, or
0.16%
Other Member States would pay the
remainder, or 40.370%
in proportion to their UN quotas

19
CALCULATING A NEW QUOTA SCALE
0
20
40
60
80
100
120
UN OAS
Total UN = 22.000+0.008+8.149=
30.157
Total OAS = 59.47+0.16+40.37=
100.0
The quota for the remaining member states would be "converted," or multiplied by a factor of 4.954 so that the new scale can add up to 100%
US22.000
US59.470
Other Member States40.370
8.149
0.008
8.149 x 4.954= 40.370
MMSS paying minat UN would pay min at the OAS, or
0.16%

20
ANNEX IIResulting Scale
Traditional Method
• The scale that results from applying the traditional methodology yields quotas for three member states that are below the minimum, 0.020%
• The reason for this is that the minimum OAS quota is 10 times greater than that of St. Lucia, and 6.67 times greater than those of Antigua and Barbuda and Haiti, but the proportional rate applied is only 4.954.
• Note that the mathematical relation applied preserves the UN rankings of the member states; that is, the quota for Antigua and Barbuda is the same as Haiti’s, and these are still greater than that of St. Lucia
Belize 0.030 0.001 0.020 (0.010)Dominica 0.020 0.001 0.020 0.000Grenada 0.030 0.001 0.020 (0.010)Guyana 0.020 0.001 0.020 0.000Nicaragua 0.070 0.001 0.020 (0.050)Saint Kitts and Nevis 0.020 0.001 0.020 0.000St. Vincent and Grenadines 0.020 0.001 0.020 0.000Suriname 0.070 0.001 0.020 (0.050)
Saint Lucia 0.030 0.002 0.010 (0.020)Antigua and Barbuda 0.020 0.003 0.015 (0.005)Haïti 0.070 0.003 0.015 (0.055)
Honduras 0.070 0.005 0.025 (0.045)Jamaica 0.180 0.008 0.040 (0.140)Bolivia 0.070 0.009 0.045 (0.025)Barbados 0.080 0.010 0.050 (0.030)Paraguay 0.180 0.012 0.059 (0.121)Bahamas 0.070 0.013 0.064 (0.006)Ecuador 0.180 0.019 0.094 (0.086)Panamá 0.130 0.019 0.094 (0.036)El Salvador 0.070 0.022 0.109 0.039Trinidad and Tobago 0.180 0.022 0.109 (0.071)Costa Rica 0.130 0.030 0.149 0.019Guatemala 0.130 0.030 0.149 0.019República Dominicana 0.180 0.035 0.173 (0.007)Uruguay 0.260 0.048 0.238 (0.022)Perú 0.410 0.092 0.456 0.046Colombia 0.940 0.155 0.768 (0.172)Venezuela 3.200 0.171 0.847 (2.353)Chile 0.540 0.223 1.105 0.565Argentina 4.900 0.956 4.736 (0.164)Brasil 8.550 1.523 7.545 (1.005)México 6.080 1.883 9.328 3.248Canada 12.360 2.813 13.936 1.576United States 59.470 22.000 59.470 0.000Sum 98.76 30.114 99.787 1.027Cuba 1.24 0.043 0.213 (1.027)Total 100.00 30.157 100.000 0.000
Arithmetic difference between traditional method and current
OAS quotas
EXAMPLE OF RECALCULATED QUOTA SCALESBased on approved U.N. quotas for 2004-06, using Traditional Method
CountryCurrent
OAS
UN quotas for 2004-
06
Traditional Method
Treshold = 0.001

21
ANNEX IIIResulting Scale
Traditional Method w/Correction
• The scale should be corrected by enforcing the minimum quota on those countries whose calculated quota falls below 0.020%.
• However, these member states are paying the same quota at the OAS as those who pay the minimum at the UN, resulting in a deviation from the “ability to pay” principle.
• For example, Haiti pays 3 times as much as Suriname at the UN, but both countries would pay the same quota at the OAS
• This distortion renders the traditional methodology unusable for our purposes, given current UN scales.
Belize 0.030 0.001 0.020 (0.010)Dominica 0.020 0.001 0.020 0.000Grenada 0.030 0.001 0.020 (0.010)Guyana 0.020 0.001 0.020 0.000Nicaragua 0.070 0.001 0.020 (0.050)Saint Kitts and Nevis 0.020 0.001 0.020 0.000St. Vincent and Grenadines 0.020 0.001 0.020 0.000Suriname 0.070 0.001 0.020 (0.050)
Saint Lucia 0.030 0.002 0.020 (0.010)Antigua and Barbuda 0.020 0.003 0.020 0.000Haïti 0.070 0.003 0.020 (0.050)
Honduras 0.070 0.005 0.025 (0.045)Jamaica 0.180 0.008 0.040 (0.140)Bolivia 0.070 0.009 0.045 (0.025)Barbados 0.080 0.010 0.050 (0.030)Paraguay 0.180 0.012 0.059 (0.121)Bahamas 0.070 0.013 0.064 (0.006)Ecuador 0.180 0.019 0.094 (0.086)Panamá 0.130 0.019 0.094 (0.036)El Salvador 0.070 0.022 0.109 0.039Trinidad and Tobago 0.180 0.022 0.109 (0.071)Costa Rica 0.130 0.030 0.149 0.019Guatemala 0.130 0.030 0.149 0.019República Dominicana 0.180 0.035 0.173 (0.007)Uruguay 0.260 0.048 0.238 (0.022)Perú 0.410 0.092 0.456 0.046Colombia 0.940 0.155 0.767 (0.173)Venezuela 3.200 0.171 0.847 (2.353)Chile 0.540 0.223 1.104 0.564Argentina 4.900 0.956 4.734 (0.166)Brasil 8.550 1.523 7.541 (1.009)México 6.080 1.883 9.324 3.244Canada 12.360 2.813 13.929 1.569United States 59.470 22.000 59.470 0.000Sum 98.76 30.114 99.787 1.027Cuba 1.24 0.043 0.213 (1.027)Total 100.00 30.157 100.000 0.000
Arithmetic difference between traditional method and current
OAS quotas
EXAMPLE OF RECALCULATED QUOTA SCALESBased on approved U.N. quotas for 2004-06, using Traditional Method
CountryCurrent
OAS
UN quotas for 2004-
06
Traditional Method
Treshold = 0.003
22
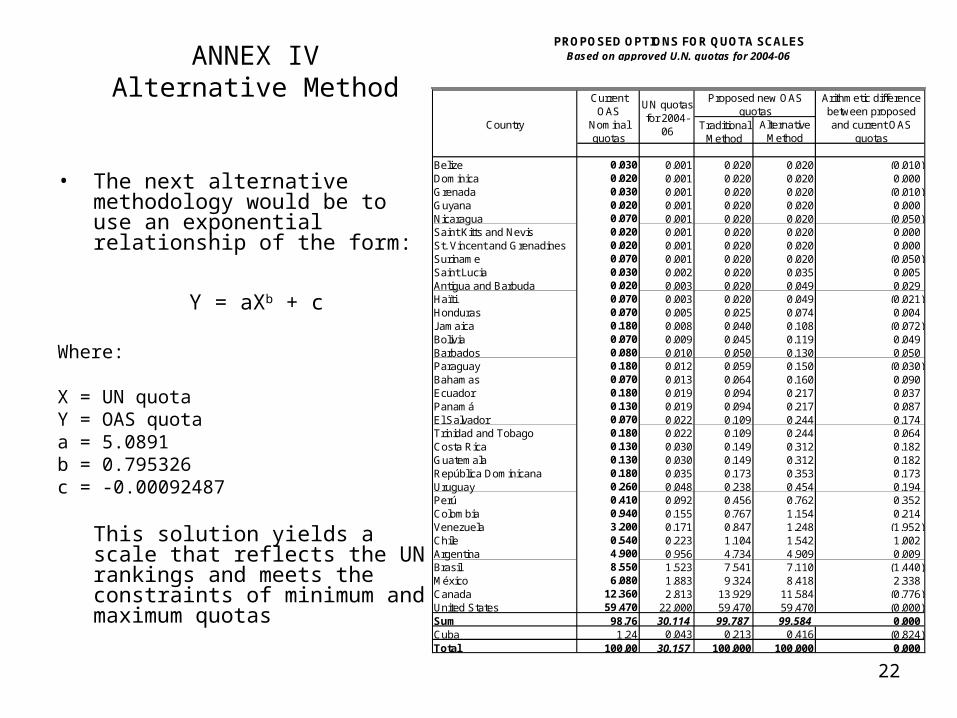
ANNEX IVAlternative Method
• The next alternative methodology would be to use an exponential relationship of the form:
Y = aXb + c
Where:
X = UN quotaY = OAS quotaa = 5.0891b = 0.795326c = -0.00092487
This solution yields a scale that reflects the UN rankings and meets the constraints of minimum and maximum quotas
Traditional Method
Alternative Method
Belize 0.030 0.001 0.020 0.020 (0.010)Dominica 0.020 0.001 0.020 0.020 0.000Grenada 0.030 0.001 0.020 0.020 (0.010)Guyana 0.020 0.001 0.020 0.020 0.000Nicaragua 0.070 0.001 0.020 0.020 (0.050)Saint Kitts and Nevis 0.020 0.001 0.020 0.020 0.000St. Vincent and Grenadines 0.020 0.001 0.020 0.020 0.000Suriname 0.070 0.001 0.020 0.020 (0.050)Saint Lucia 0.030 0.002 0.020 0.035 0.005Antigua and Barbuda 0.020 0.003 0.020 0.049 0.029Haïti 0.070 0.003 0.020 0.049 (0.021)Honduras 0.070 0.005 0.025 0.074 0.004Jamaica 0.180 0.008 0.040 0.108 (0.072)Bolivia 0.070 0.009 0.045 0.119 0.049Barbados 0.080 0.010 0.050 0.130 0.050Paraguay 0.180 0.012 0.059 0.150 (0.030)Bahamas 0.070 0.013 0.064 0.160 0.090Ecuador 0.180 0.019 0.094 0.217 0.037Panamá 0.130 0.019 0.094 0.217 0.087El Salvador 0.070 0.022 0.109 0.244 0.174Trinidad and Tobago 0.180 0.022 0.109 0.244 0.064Costa Rica 0.130 0.030 0.149 0.312 0.182Guatemala 0.130 0.030 0.149 0.312 0.182República Dominicana 0.180 0.035 0.173 0.353 0.173Uruguay 0.260 0.048 0.238 0.454 0.194Perú 0.410 0.092 0.456 0.762 0.352Colombia 0.940 0.155 0.767 1.154 0.214Venezuela 3.200 0.171 0.847 1.248 (1.952)Chile 0.540 0.223 1.104 1.542 1.002Argentina 4.900 0.956 4.734 4.909 0.009Brasil 8.550 1.523 7.541 7.110 (1.440)México 6.080 1.883 9.324 8.418 2.338Canada 12.360 2.813 13.929 11.584 (0.776)United States 59.470 22.000 59.470 59.470 (0.000)Sum 98.76 30.114 99.787 99.584 0.000Cuba 1.24 0.043 0.213 0.416 (0.824)Total 100.00 30.157 100.000 100.000 0.000
PROPOSED OPTIONS FOR QUOTA SCALESBased on approved U.N. quotas for 2004-06
Country
Current OAS
Nominal quotas
UN quotas for 2004-
06
Arithmetic difference between proposed and current OAS
quotas
Proposed new OAS quotas