1 rice production and productivity scenario in india : issues and strategies gurbachan singh...
TRANSCRIPT

11
Rice Production and ProductivityRice Production and ProductivityScenario in India : Issues and StrategiesScenario in India : Issues and Strategies
GURBACHAN SINGHAgriculture Commissioner
Ministry of AgricultureDepartment of Agriculture and Cooperation
Email : [email protected]
22
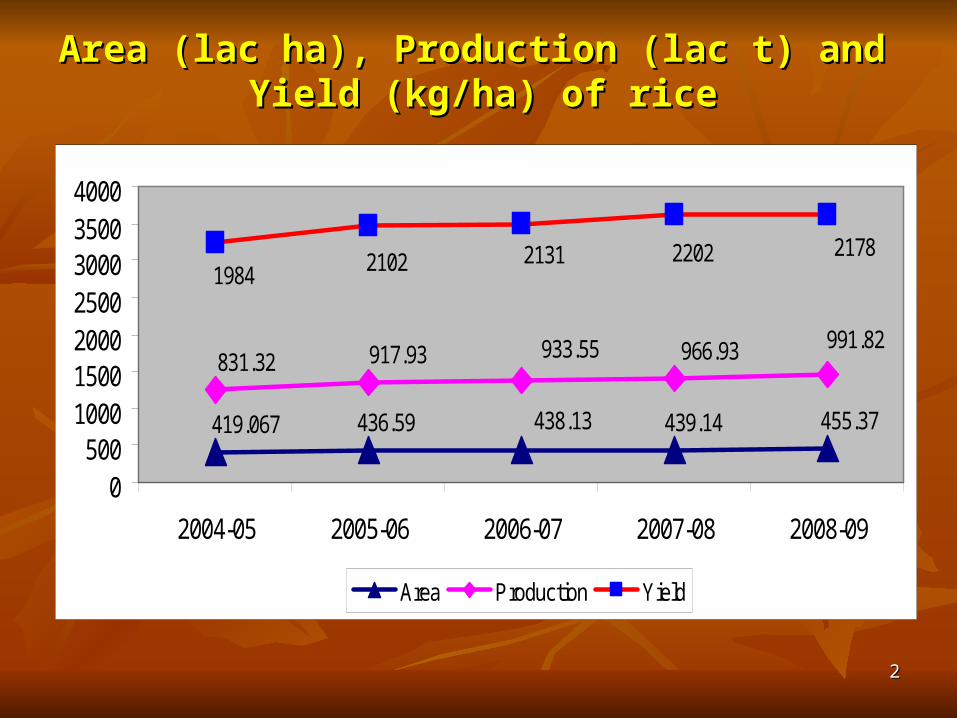
Area (lac ha), Production (lac t) and Area (lac ha), Production (lac t) and Yield (kg/ha) of riceYield (kg/ha) of rice
455.37439.14438.13436.59419.067
831.32 917.93 933.55 966.93 991.82
2102 2131 2202 21781984
0500
1000150020002500300035004000
2004-05 2005-06 2006-07 2007-08 2008-09
Area Production Yield

33
Rice Culture in IndiaRice Culture in India
Water RegimeWater Regime Yield RangeYield Range(t/ha)(t/ha)
Irrigated (Wet season, Kharif)Irrigated (Wet season, Kharif) 3.0 - 4.03.0 - 4.0
Irrigated (Dry season, Rabi)Irrigated (Dry season, Rabi) 4.0 – 6.04.0 – 6.0
Rainfed (Shallow lowland)Rainfed (Shallow lowland) 2.5 – 3.52.5 – 3.5
Rainfed (Semi deep water)Rainfed (Semi deep water) 2.0 – 2.52.0 – 2.5
Floating or deep waterFloating or deep water < 1.0< 1.0
Rainfed uplandRainfed upland 1.0 – 1.51.0 – 1.5
44
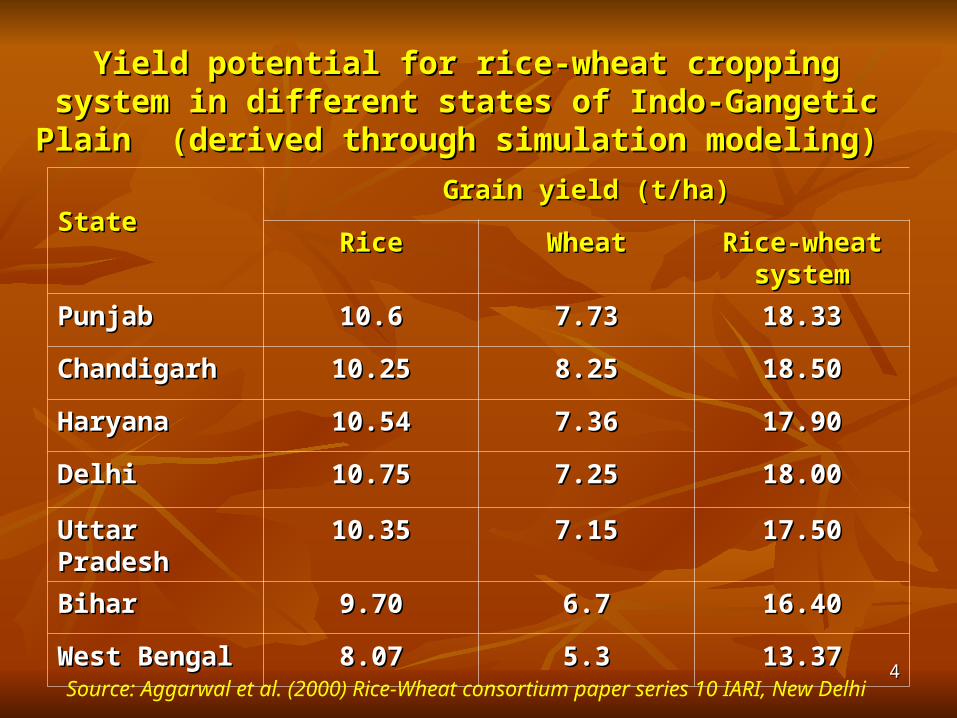
StateStateGrain yield (t/ha)Grain yield (t/ha)
RiceRice WheatWheat Rice-wheat Rice-wheat systemsystem
PunjabPunjab 10.610.6 7.737.73 18.3318.33
ChandigarhChandigarh 10.2510.25 8.258.25 18.5018.50
HaryanaHaryana 10.5410.54 7.367.36 17.9017.90
DelhiDelhi 10.7510.75 7.257.25 18.0018.00
Uttar PradeshUttar Pradesh 10.3510.35 7.157.15 17.5017.50
BiharBihar 9.709.70 6.76.7 16.4016.40
West BengalWest Bengal 8.078.07 5.35.3 13.3713.37
Yield potential for rice-wheat cropping system in Yield potential for rice-wheat cropping system in different states of Indo-Gangetic Plain (derived through different states of Indo-Gangetic Plain (derived through
simulation modeling)simulation modeling)
Source: Aggarwal et al. (2000) Rice-Wheat consortium paper series 10 IARI, New Delhi

55
Productivity of rice and wheat (2004) and fertilizer Productivity of rice and wheat (2004) and fertilizer
consumption (2002-03) in different countriesconsumption (2002-03) in different countries CountryCountry Productivity (t/ha)Productivity (t/ha) Fertilizer Fertilizer
Consumption Consumption (Kg N + (Kg N + PP22OO55+K+K22O) / haO) / ha
RiceRice WheatWheat Rice + WheatRice + Wheat
EgyptEgypt 9.59.5 6.56.5 16.016.0 437.5437.5
AustraliaAustralia 8.28.2 6.06.0 14.214.2 247.2247.2
FranceFrance 5.65.6 7.67.6 13.213.2 215.1215.1
SpainSpain 7.47.4 3.33.3 10.710.7 157.7157.7
JapanJapan 6.96.9 3.83.8 10.710.7 290.6290.6
USAUSA 7.67.6 2.92.9 10.510.5 109.6109.6
ChinaChina 6.36.3 4.24.2 10.510.5 275.0275.0
Republic of KoreaRepublic of Korea 6.46.4 3.03.0 9.49.4 409.7409.7
ChileChile 4.64.6 4.64.6 9.29.2 229.6229.6
UkraineUkraine 4.64.6 3.73.7 8.38.3 18.118.1
PakistanPakistan 3.43.4 2.42.4 5.85.8 138.1138.1
IndiaIndia 2.92.9 2.62.6 5.55.5 99.799.7
WorldWorld 3.973.97 2.872.87 6.846.84 100.8100.8Source: FAO Production Year Book, 2004

66
Productivity of rice in major rice Productivity of rice in major rice growing statesgrowing states
0
500
1000
1500
2000
2500
3000
3500
4000
4500
2004-05 2005-06 2006-07 2007-08 2008-09
2004-05 3111 1460 792 1170 1305 2712 720 1425
2005-06 2939 1468 1075 1337 1150 3868 999 1779
2006-07 2984 1332 1486 1354 1828 2470 824 1680
2007-08 3344 1428 1237 1446 2018 2625 934 1903
2008-09 3246 1614 1599 1176 2031 2511 927 1501
AP Assam Bihar Chhattisgarh Jharkhand Karnataka MP Maharashtra

77
Productivity of rice in major rice Productivity of rice in major rice growing statesgrowing states
0
500
1000
1500
2000
2500
3000
3500
4000
4500
2004-05 2005-06 2006-07 2007-08 2008-09
2004-05 2712 2301 1446 3943 2703 1790 1869 2574
2005-06 3868 2284 1531 2858 2546 1996 1954 2509
2006-07 2470 2390 1534 3868 3423 1879 1979 2593
2007-08 2625 2310 1694 4019 2817 2063 2052 2570
2008-09 2511 2519 1529 4022 2683 2171 1966 2533
Karnataka Kerala Orissa Punjab TN UP Uttarakhand WB
88
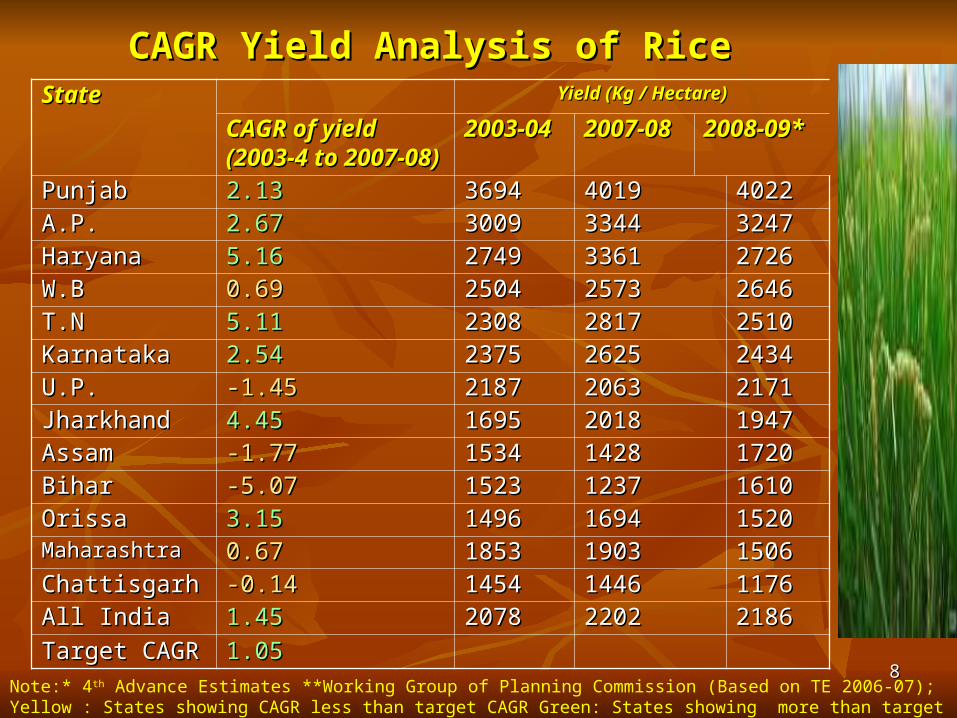
CAGR Yield Analysis of RiceCAGR Yield Analysis of Rice State State Yield (Kg / Hectare)Yield (Kg / Hectare)
CAGR of yield CAGR of yield (2003-4 to 2007-08)(2003-4 to 2007-08)
2003-042003-04 2007-082007-08 2008-09*2008-09*
PunjabPunjab 2.132.13 36943694 40194019 40224022
A.P.A.P. 2.672.67 30093009 33443344 32473247
HaryanaHaryana 5.165.16 27492749 33613361 27262726
W.BW.B 0.690.69 25042504 25732573 26462646
T.NT.N 5.115.11 23082308 28172817 25102510
KarnatakaKarnataka 2.542.54 23752375 26252625 24342434
U.P.U.P. -1.45-1.45 21872187 20632063 21712171
JharkhandJharkhand 4.454.45 16951695 20182018 19471947
AssamAssam -1.77-1.77 15341534 14281428 17201720
BiharBihar -5.07-5.07 15231523 12371237 16101610
OrissaOrissa 3.153.15 14961496 16941694 15201520MaharashtraMaharashtra 0.670.67 18531853 19031903 15061506
ChattisgarhChattisgarh -0.14-0.14 14541454 14461446 11761176
All India All India 1.451.45 20782078 22022202 21862186
Target CAGRTarget CAGR 1.051.05Note:* 4th Advance Estimates **Working Group of Planning Commission (Based on TE 2006-07); Yellow : States showing CAGR less than target CAGR Green: States showing more than target CAGR
99
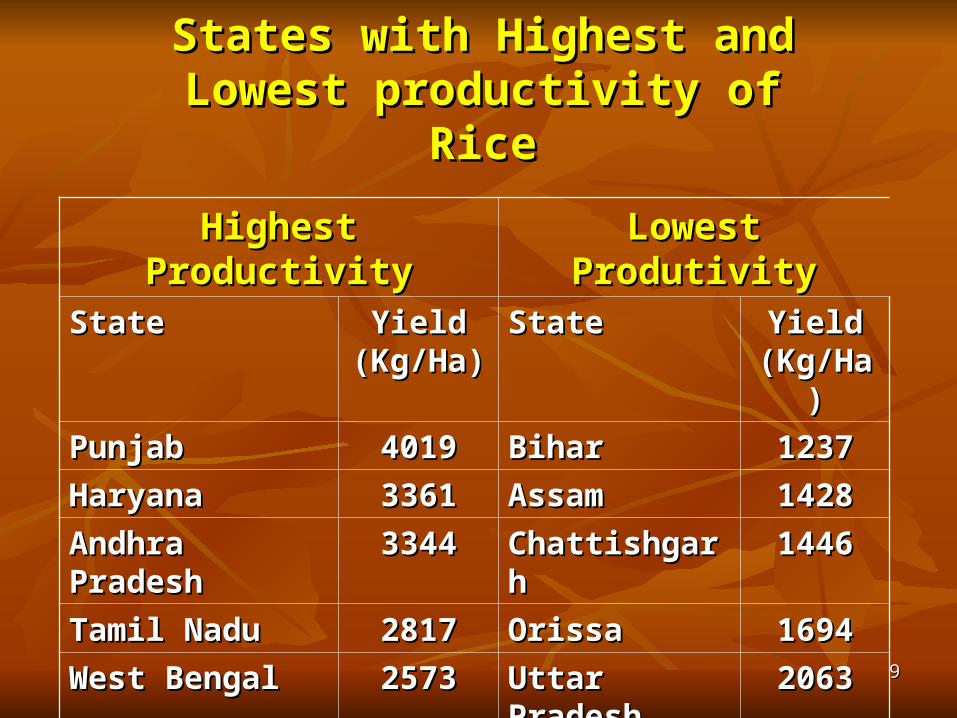
States with Highest and States with Highest and Lowest productivity of RiceLowest productivity of Rice
Highest ProductivityHighest Productivity Lowest ProdutivityLowest ProdutivityStateState Yield Yield
(Kg/Ha)(Kg/Ha)StateState Yield Yield
(Kg/Ha)(Kg/Ha)
PunjabPunjab 40194019 BiharBihar 12371237
HaryanaHaryana 33613361 AssamAssam 14281428
Andhra PradeshAndhra Pradesh 33443344 ChattishgarhChattishgarh 14461446
Tamil NaduTamil Nadu 28172817 OrissaOrissa 16941694
West BengalWest Bengal 25732573 Uttar PradeshUttar Pradesh 20632063National Average : 2202 kg/haNational Average : 2202 kg/ha

1010
10Reference: Agriculture Situation in India, August 2002 (Yield Reference: Agriculture Situation in India, August 2002 (Yield
updated as in 2009)updated as in 2009)
Actual Yield

111111
(Yield t/ha)

1212
IssuesIssues
Declining levels of soil Declining levels of soil organic matterorganic matter
Widening N: P : K Ratio Widening N: P : K Ratio Micro-nutrient deficiencies Micro-nutrient deficiencies Declining response in Declining response in
terms of grains / kg terms of grains / kg fertilizer fertilizer
Heavy metal pollution Heavy metal pollution Low nutrient use efficiencyLow nutrient use efficiency
StrategiesStrategies
Integrated Nutrient Integrated Nutrient Management Management
Conservation Agriculture Conservation Agriculture PracticesPractices
NBS: Balanced NutritionNBS: Balanced Nutrition
Soil Health ManagementSoil Health Management

1313
Current status of nutrient use Current status of nutrient use efficiencyefficiency
NutrientNutrient Efficiency percentageEfficiency percentage
NN 30-5030-50
PP 10-2010-20
KK <80<80
SS 8-128-12
ZnZn 2-52-5
FeFe 1-21-2
CuCu 1-21-2
MnMn 1-21-2

1414
Measures to increase nutrient use efficiency
MeasureMeasure NutrientNutrient Increase in Increase in nutrient use nutrient use efficiency(%)efficiency(%)
Split vs. single dose Split vs. single dose application application
NN 15-2015-20
Furrow placement vs Furrow placement vs broadcast application broadcast application
PKPK 20-3020-30
The incorporation of urea The incorporation of urea super granules (USG)vs super granules (USG)vs split applicationsplit application
NN 2020
The foliar vs basal The foliar vs basal applicationapplication
Micro-Micro-nutrientsnutrients
15-2015-20
Neem coated vs prilled Neem coated vs prilled ureaurea
NN 5-105-10
Preferential application of Preferential application of phosphorus to wheat in phosphorus to wheat in rice-wheat sequencerice-wheat sequence
PP 5050
1515
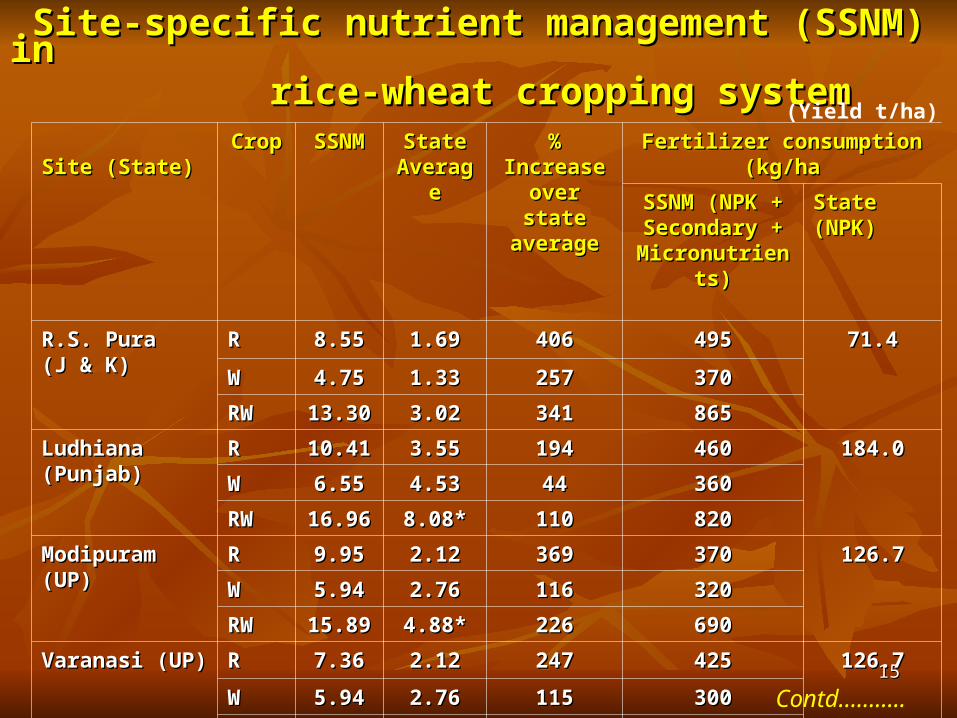
Site-specific nutrient management (SSNM) in Site-specific nutrient management (SSNM) in rice-wheat cropping system rice-wheat cropping system
(Yield t/ha)
Site (State)Site (State)CropCrop SSNMSSNM State State
AverageAverage% Increase % Increase over state over state averageaverage
Fertilizer consumption (kg/haFertilizer consumption (kg/ha
SSNM (NPK + SSNM (NPK + Secondary + Secondary +
Micronutrients)Micronutrients)
State (NPK)State (NPK)
R.S. Pura R.S. Pura (J & K)(J & K)
RR 8.558.55 1.691.69 406406 495495 71.471.4
WW 4.754.75 1.331.33 257257 370370
RWRW 13.3013.30 3.023.02 341341 865865
Ludhiana Ludhiana (Punjab)(Punjab)
RR 10.4110.41 3.553.55 194194 460460 184.0184.0
WW 6.556.55 4.534.53 4444 360360
RWRW 16.9616.96 8.08*8.08* 110110 820820
Modipuram (UP)Modipuram (UP) RR 9.959.95 2.122.12 369369 370370 126.7126.7
WW 5.945.94 2.762.76 116116 320320
RWRW 15.8915.89 4.88*4.88* 226226 690690
Varanasi (UP)Varanasi (UP) RR 7.367.36 2.122.12 247247 425425 126.7126.7
WW 5.945.94 2.762.76 115115 300300
RWRW 13.3013.30 4.88*4.88* 173173 725725
Contd………..
1616
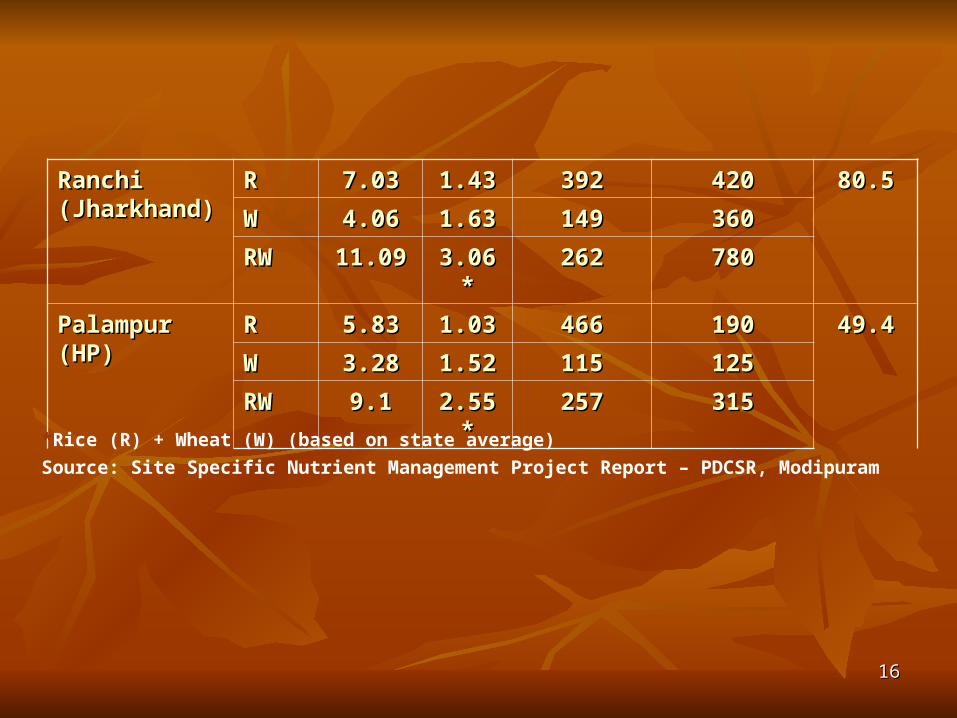
Ranchi Ranchi (Jharkhand)(Jharkhand)
RR 7.037.03 1.431.43 392392 420420 80.580.5
WW 4.064.06 1.631.63 149149 360360
RWRW 11.0911.09 3.06*3.06* 262262 780780
Palampur (HP)Palampur (HP) RR 5.835.83 1.031.03 466466 190190 49.449.4
WW 3.283.28 1.521.52 115115 125125
RWRW 9.19.1 2.55*2.55* 257257 315315
*Rice (R) + Wheat (W) (based on state average)
Source: Site Specific Nutrient Management Project Report – PDCSR, Modipuram
1717
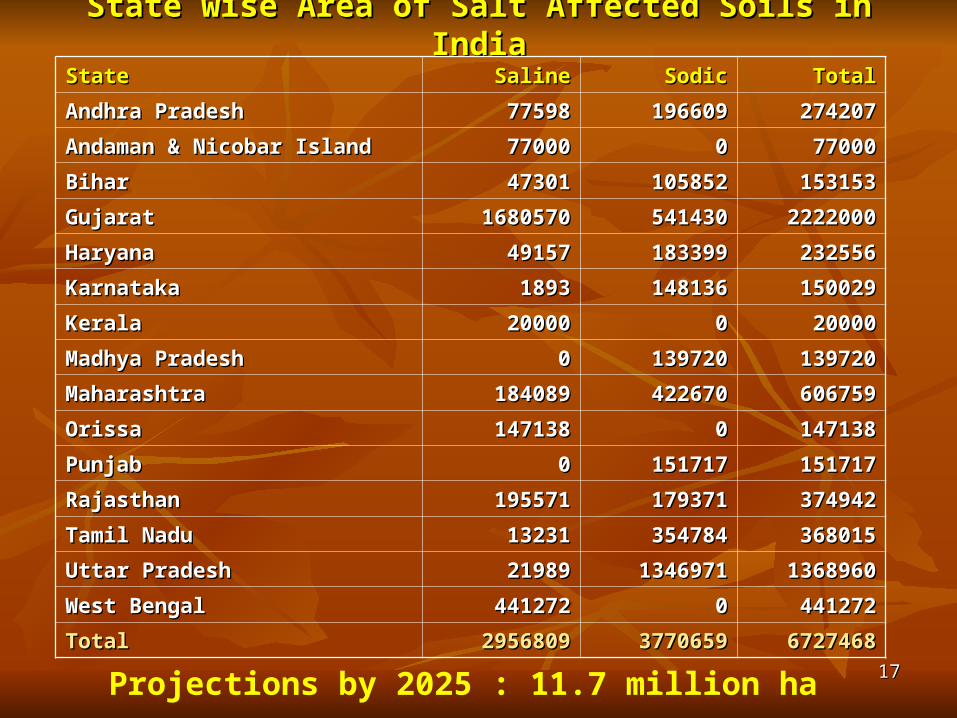
State wise Area of Salt Affected Soils in IndiaState wise Area of Salt Affected Soils in India
StateState SalineSaline SodicSodic TotalTotal
Andhra PradeshAndhra Pradesh 7759877598 196609196609 274207274207
Andaman & Nicobar IslandAndaman & Nicobar Island 7700077000 00 7700077000
BiharBihar 4730147301 105852105852 153153153153
GujaratGujarat 16805701680570 541430541430 22220002222000
HaryanaHaryana 4915749157 183399183399 232556232556
KarnatakaKarnataka 18931893 148136148136 150029150029
KeralaKerala 2000020000 00 2000020000
Madhya PradeshMadhya Pradesh 00 139720139720 139720139720
MaharashtraMaharashtra 184089184089 422670422670 606759606759
OrissaOrissa 147138147138 00 147138147138
PunjabPunjab 00 151717151717 151717151717
RajasthanRajasthan 195571195571 179371179371 374942374942
Tamil NaduTamil Nadu 1323113231 354784354784 368015368015
Uttar PradeshUttar Pradesh 2198921989 13469711346971 13689601368960
West BengalWest Bengal 441272441272 00 441272441272
TotalTotal 29568092956809 37706593770659 67274686727468
Projections by 2025 : 11.7 million ha

1818
CSR 10, CSR 13, CSR 17, CSR 23, CSR 27, CSR 30 (Basmati), CSR 36
Sodicity Range up to 9.8 pH2
Salinity Range up to EC2 8 ds/m
Salt Tolerant Rice Verities

1919
EXTENT OF WATERLOGGED AREASEXTENT OF WATERLOGGED AREASStateState Waterlogged area (m ha)Waterlogged area (m ha)
Andhra PradeshAndhra Pradesh 0.430.43
BiharBihar 0.350.35
GujaratGujarat 0.170.17
HaryanaHaryana 0.230.23
KarnatakaKarnataka 0.050.05
KeralaKerala 0.080.08
Madhya PradeshMadhya Pradesh 0.060.06
MaharashtraMaharashtra 0.020.02
OrissaOrissa 0.180.18
PunjabPunjab 0.300.30
RajasthanRajasthan 0.180.18
Tamil Nadu & PondicherryTamil Nadu & Pondicherry 0.610.61
Uttar PradeshUttar Pradesh 0.590.59
West BengalWest Bengal 0.290.29
TotalTotal 3.553.55Main Source: Min. of Agriculture (Draft Report, 1999)

2020
LOSSES DUE TO WATER LOGGING LOSSES DUE TO WATER LOGGING AND SOIL SALINITYAND SOIL SALINITY
CropCrop Normal Normal landslands
Salt Salt affected affected landslands
WaterloggeWaterlogged landsd lands
PaddyPaddy 39.939.9 21.8 (45)21.8 (45) 23.0 (42)23.0 (42)
WheatWheat 26.026.0 15.8 (40)15.8 (40) 18.6 (38)18.6 (38)
CottonCotton 16.316.3 6.1 (63)6.1 (63) 3.7 (77)3.7 (77)
SugarcaneSugarcane 636.8636.8 330.2 (48)330.2 (48) 247.5 (61)247.5 (61)
Source: Joshi (1994); Figures in parentheses indicate percentage loss over normal lands

2121
Coastal Saline Areas About 3 m ha in West Bengal, Orissa, Andhra Pradesh,
Tamil Nadu, Karnataka, Kerala, Maharashtra and Gujarat
Islands of Andeman & Nicobar, Laksdeep, Daman and Diu and Goa
Climate change related sea water rise will inundate large areas in near future

2222
Rice Varieties suitable for cultivation in Coastal Saline Areas
Released byReleased by Varieties
Upland situation (0-15 cm water regime) with moderately high salinity
CSR1, CSR2, CSR3, CSR4, CST 7-1, Canning 7, Jaya, 1ET1444
Shallow water (15-30 cm) with moderate soil salinity (4.0 to 6.0 ds m-1)
Sumati, CSR6, SR 26B, Dhudesar, NC 128, NC 678, SMS, Matla, Hamilton, Jhingasail, Gavir Saru, Gopal Bhog
Semi deep water (30-50 cm with low soil salinity (around 4.0 ds / m)
Utpala, CSR 6, SR26B, NC 1281, Matla, Hamilton, Asfad, Gavir Saru
Acid sulphate soils Canning T, SR 26 B, Mashuri
Flash floods CSR 4, SR 26 B
Rabi / Summer Season CSR4, CST 7-1, Canning 7, Ratna

2323
Hybrid Rice cultivation
Drawbacks :• No yield advantage in high productivity areas• Narrow choice of hybrids to suit different regions/
States• Less acceptable grain and cooking quality• Procurement/ Marketing issues
Opportunity :• Ample potential to boost productivity in East Indian
States • States having productivity <2t/ ha
About 55% area under hybrid rice in China
Several hybrids developed in India but area coverage is insignificant

2424Source : Pathak, 2000;Hybird Rice
2525
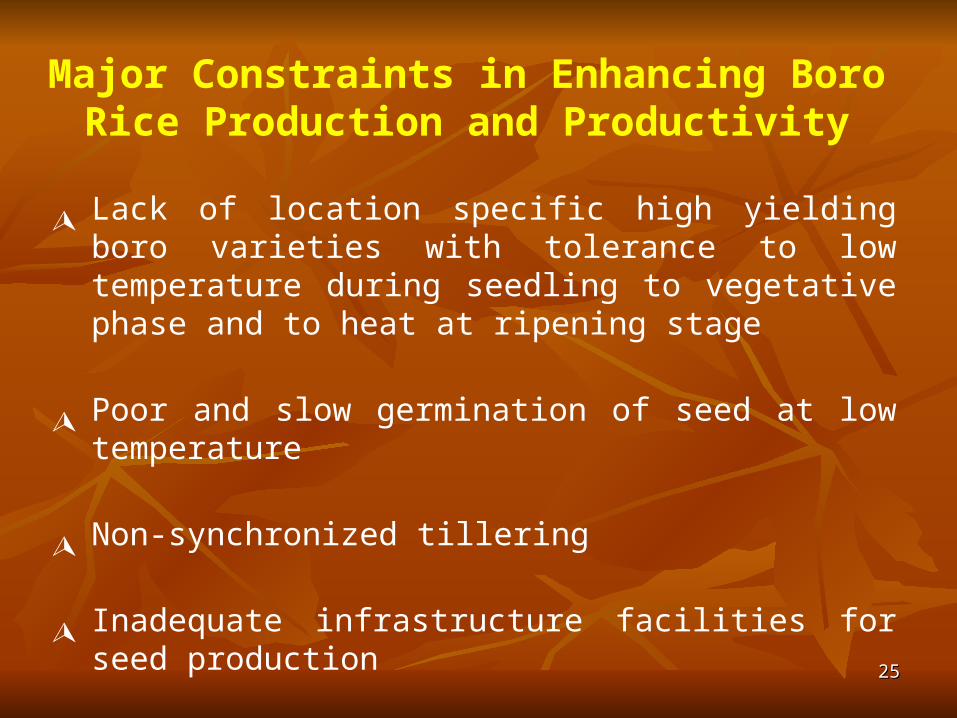
Major Constraints in Enhancing Boro Rice Production and Productivity
Lack of location specific high yielding boro varieties with tolerance to low temperature during seedling to vegetative phase and to heat at ripening stage
Poor and slow germination of seed at low temperature
Non-synchronized tillering
Inadequate infrastructure facilities for seed production
Weak extension linkages
2626
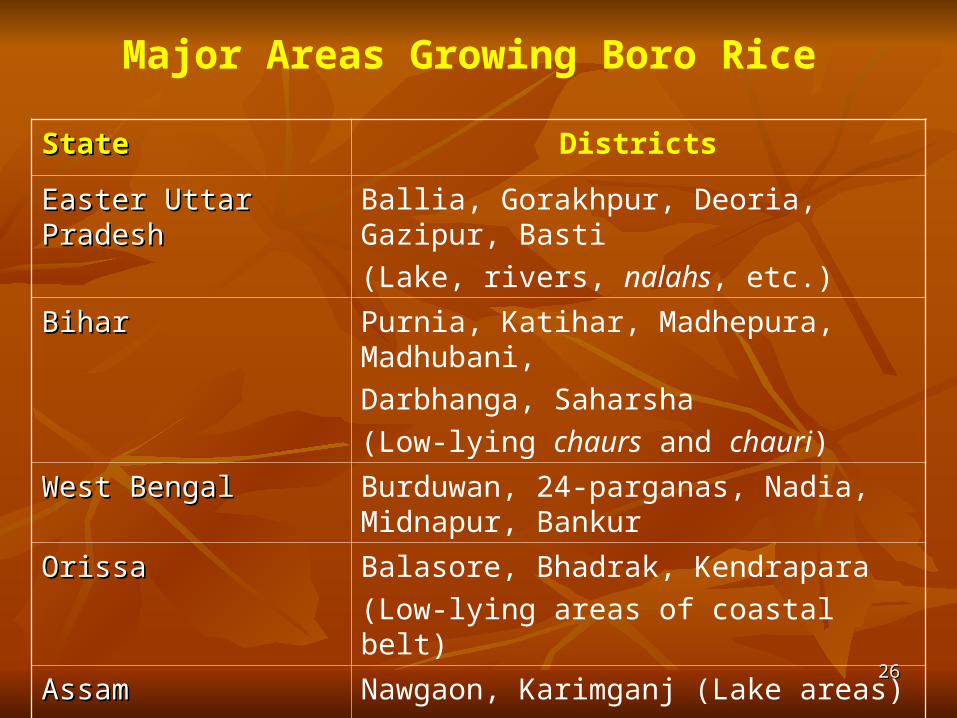
Major Areas Growing Boro Rice
StateState Districts
Easter Uttar PradeshEaster Uttar Pradesh Ballia, Gorakhpur, Deoria, Gazipur, Basti
(Lake, rivers, nalahs, etc.)
BiharBihar Purnia, Katihar, Madhepura, Madhubani,
Darbhanga, Saharsha
(Low-lying chaurs and chauri)
West Bengal West Bengal Burduwan, 24-parganas, Nadia, Midnapur, Bankur
OrissaOrissa Balasore, Bhadrak, Kendrapara
(Low-lying areas of coastal belt)
AssamAssam Nawgaon, Karimganj (Lake areas)
2727
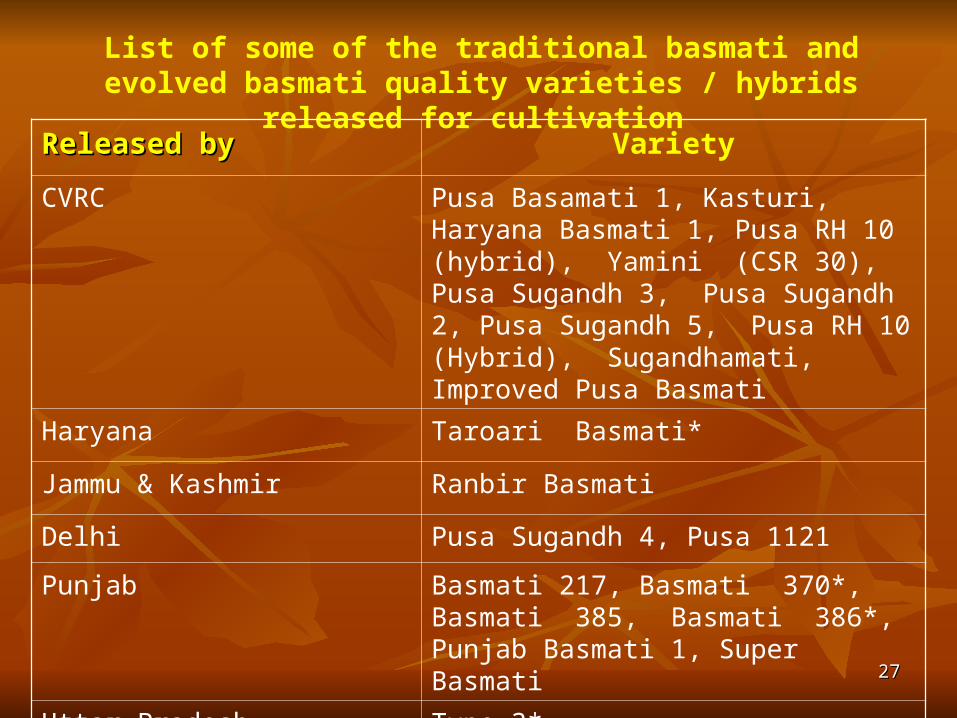
List of some of the traditional basmati and evolved basmati quality varieties / hybrids released for cultivation
Released byReleased by Variety
CVRC Pusa Basamati 1, Kasturi, Haryana Basmati 1, Pusa RH 10 (hybrid), Yamini (CSR 30), Pusa Sugandh 3, Pusa Sugandh 2, Pusa Sugandh 5, Pusa RH 10 (Hybrid), Sugandhamati, Improved Pusa Basmati
Haryana Taroari Basmati*
Jammu & Kashmir Ranbir Basmati
Delhi Pusa Sugandh 4, Pusa 1121
Punjab Basmati 217, Basmati 370*, Basmati 385, Basmati 386*, Punjab Basmati 1, Super Basmati
Uttar Pradesh Type 3*

2828
Some of the tips for getting higher production and better quality basmati rice includes :
• Adjusting planting date of traditional varieties in such a way that cool temperature is prevalent during grain filling stage
• Except Pusa Basmati I which responds upto 90 kg N / ha, most varieties respond well upto 40-45 kg N / ha. Higher N application leads to lodging of the crop and thus aggravating diseases / pest menace.

2929
System of Rice Intensification (SRI)
• Most suitable for small and marginal farmers• Labour intensive• Precision operations• Efficient utilization of water and nutrients • Higher returns
Direct Seeded Rice Cultivation
• Saves water by 15-20 %, less energy use • Weed management serious problem• Reduced cost of cultivation• With proper plant population and weed management, yields almost equivalent to transplanted puddeled crop can be achieved.

3030
Specific constraints to Rice productivity in different Regions/ Ecologies
Northern Region :
Low organic matter
Declining ground water levels
N, P, S, Fe, Mn, Zn deficiency
Imbalanced fertilizer use
Less than optimum plant population
Delayed planting due to labour shortage
Weeds and Pests
Eastern Region :• Widespread Pand Zn deficiency• Delayed / prolonged transplanting• Low/ imbalanced fertilizer use• Poor water management • Less adoption of new high yielding varities• weeds and pests

3131
Southern Region : Less than optimum plant population
Salinity/ alkalinity
Delayed planting
Imbalanced fertilizer use
North East Hill Region :• Prevalence of shifting cultivation• Mostly native varieties cultivated • Poor coverage under HYV• Acidity, low P and Zn availability• Fe toxicity• Very low fertilizer use

3232
Rainfed Uplands :• Low organic matter, N, P, Zn, Bo• Very low fertilizer use• Severe weed infestation• Moisture stress at critical stages• Inadequate supply and use of quality seeds• Wide spread poverty
Rainfed Lowlands :• Acid soils of low fertility, N, P, Zn, Mo deficiency• Saline soils deficient in N, P, and Zn in coastal areas• Low fertilizer use and poor use efficiency• Submergence in flood prone and waterlogged areas• Intermittent drought spells• Inadequate supply and use of quality seed• Wide spread poverty

3333
Central Region :• High fixation of P and deficiency of N, Zn, Mo• Water logging at early stages and drought at grain formation/ filling stages• Severe weed/ Pest infestation
Western Region :• Salinity and deficiency of N, Ca, S, Zn • poor quality ground water for irrigation • Low fertilizer use and poor use efficiency• Periods of moisture stress in rainfed and partially irrigated areas

3434
Projection of rice production (million tonnes)Projection of rice production (million tonnes)
99.287.6
105.0116.0
130.0
0.0
20.0
40.0
60.0
80.0
100.0
120.0
140.0
2008-09 2009-10 2010-11 2015-16 2020-2212020-212020-21

3535
Expected rates of return to research on rice - wheat system
ProjectProject Internal rate of return (%)Internal rate of return (%)
High High productivity productivity
RegionRegion
Low productivityLow productivityRegionRegion
Development of rice varietyDevelopment of rice variety 109109 8585
Development of wheat varietyDevelopment of wheat variety 6565 7070
Tillage and residue Tillage and residue managementmanagement
79 #79 # **
Water managementWater management 48 #48 # 4545
Nutrient managementNutrient management 68 #68 # 5656
Weed controlWeed control 74 #74 # 6262
# This does not include non-monetary improvement of resources* Tillage and residue management is not a research priority for the low
productivity region.
Source: Annual Report, NCAP, 1997-98

3636
Exploiting untapped potentials of production
Proposed intervention/Proposed intervention/Untapped potentialUntapped potential
Expected Expected additional additional
production (Mt)production (Mt)
Enhancing fertilizer use efficiencyEnhancing fertilizer use efficiency 3030
Water management including drainageWater management including drainage 3030
Soil health care including reclamation of Soil health care including reclamation of salinity/acidity/alkalinitysalinity/acidity/alkalinity
4040
Realignment of cropping patterns on ecological Realignment of cropping patterns on ecological principlesprinciples
3030
Region productivity of command areas of wells Region productivity of command areas of wells and tanks, and small and medium irrigation and tanks, and small and medium irrigation projectsprojects
120120
Total increase in production expectedTotal increase in production expected 250250
3737