1-s2.0-s1385894711011570-main
DESCRIPTION
kb,jugukgi.lTRANSCRIPT

N
YD
a
ARR1A
KNCGG
1
Cttbw[tpo
C
t[cttcth[
1d
Chemical Engineering Journal 175 (2011) 512– 518
Contents lists available at SciVerse ScienceDirect
Chemical Engineering Journal
jo u r n al hom epage: www.elsev ier .com/ locate /ce j
ano CaO grain characteristics and growth model under calcination
anqing Zhu, Sufang Wu ∗, Xieqing Wangepartment of Chemical and Biological Engineering, Zhejiang University, Hangzhou, 310027, China
r t i c l e i n f o
rticle history:eceived 31 May 2011eceived in revised form2 September 2011ccepted 13 September 2011
eywords:
a b s t r a c t
This paper addresses the grain characteristics and growth model of nano CaO under high-temperaturecalcination conditions. Nano CaO samples derived from nano CaCO3 were prepared with a chambercalciner under different calcination times (10–480 min) and temperatures (750–900 ◦C) to study thenano CaO grain growth. X-ray diffractometer and the Scherrer formula were used to test and calculatethe grain size of nano CaO. The microstructure and sorption performances of nano CaO were observedby a nitrogen adsorption/desorption apparatus and a thermogravimetric analysis. The results showed
ano CaOalcinationrain characteristicsrowth model
that the grain size of CaO grew faster as the calcination temperature increased. A growth asymptotewas approached by prolonging the consecutive calcination time. A grain growth model for nano CaOwas built according to solid phase sintering theory for the following conditions: 10–120 min isothermalcalcination at 750–900 ◦C. The activation energy for nano CaO grain growth was calculated as 120 kJ/mol.In addition, the relation of grain growth, structural properties and CO2 adsorption performance of nanoCaO are discussed.
. Introduction
CaO has been identified as the most promising candidate forO2 capture because CaO-based adsorbent has the following advan-ages: a high reactive sorption capacity for CO2, a low cost andhe abundance of its natural precursors [1]. CaO-based adsor-ents for CO2 capture through carbonation–calcination cycles areidely studied in zero-emission power generation technologies
2,3], reactive sorption-enhanced reforming for hydrogen produc-ion (ReSER) [4–6] and energy storage systems in chemical heatumps [7,8]. In these technologies, CaO are used repeatedly basedn the reversible reactions given in Eq. (1):
aO(s) + CO2(g)carbonation
�calcination
CaCO3(s) �H = −178 kJ/mol (1)
The calcination process determines the structural characteris-ics of fresh CaO, which is an active sorbent for CO2. Sun et al.9] investigated sintering during repeated cycles of calcination andarbonation with limestone. And they found that the carbonationime has little effect on the pore size distribution of sorbents, i.e.hat sintering of limestone largely occurs during calcination pro-esses. Actually, the sintering of CaO is a common phenomenon
hat happens simultaneously with calcination. Many researchersave studied the consequences of sorbent sintering. Borgwardt10] studied the sintering rate of CaO in a N2 atmosphere at∗ Corresponding author. Tel.: +86 571 87953138; fax: +86 571 87953735.E-mail address: [email protected] (S. Wu).
385-8947/$ – see front matter © 2011 Elsevier B.V. All rights reserved.oi:10.1016/j.cej.2011.09.084
© 2011 Elsevier B.V. All rights reserved.
temperatures between 700 and 1100 ◦C. They found that thesurface area and porosity of sorbent sharply decreased with cal-cination temperature increased. And sintering of CaO may beaccelerated by the presence of CO2 and H2O in the gas phase[11]. Furthermore, Borgwardt modeled the rate of surface areadecrease using a correlation proposed by German and Munir [12].Wu et al. [13] adopted nano CaO/Al2O3 to capture CO2 withcarbonation–calcination cycles. They compared the SEM imagesbefore and after 20 runs with the CaO/Al2O3 sorbents. It showedthat some of the sorbent particles increased from about 10 nm toabout 1.4 �m caused by sintering. Many literatures showed thatthe sintering of CaO resulted in specific surface area and pore vol-ume reductions [10,14–16], average particle size increases [11,13]and the closure of micropores [11,17]. The changes in the CaOmicrostructure significantly decrease the CO2 sorption capacity anddurability [18–20].
Sintering researches above focused on the structural propertiesas surface area, pore size and particle size. More detailed studiesshowed that calcination caused the formation and growth of CaOgrains. When CaCO3 decomposes at high temperatures, small CaOgrains form, and then the contact grains form necks and begin togrow, resulting in an increase in the average grain size [10,21]. Cur-rently, there are few published studies addressing CaO grain growthduring calcination. Dash et al. [22] adopted high-temperature X-ray diffractometer (HTXRD) to test the CaO grain size derived from
CaCO3 (laboratory reagent) calcination at 1273 K and 1473 K. Thegrain sizes of CaO calculated by the Scherrer formula were 17 and47 nm, respectively. Feng et al. [23] used nano CaCO3 as CaO pre-cursors to investigate the CaO sintering characteristics in multiple
Y. Zhu et al. / Chemical Engineering Journal 175 (2011) 512– 518 513
Nomenclature
C grain growth rate constantd grain size, nmE activation energy for grain growth, kJ/molG instantaneous average grain size, nmG0 initial grain size of CaO after decomposition, nmK Scherrer constant, 0.9M initial mass of sorbent, mgR 8.314, J K−1 mol−1
T temperature, Kt calcination time, minˇ main peak breadth in XRD spectra� X-ray wavelength, nm, (=0.15406)
cp3atCgg
aCtwgtpnp(
2
2
upsCadcatNm
TE
(D/MAX-RA, Rigaku, Japan). The characteristic peaks of 2� = 53.9◦,64.2◦ and 67.4◦ in the CaO XRD patterns show that these are singlediffraction apexes without noise interference and are suitable for
� Bragg angle, degree
ycles (carbonation in 100%CO2 and calcination in 100%N2 at tem-erature of 850 ◦C). He found that the CaO grain size increased from7 to 62 nm after 6 carbonation–calcination cycles. Li et al. [24]ssumed that limestone modified by acetic acid solution had bet-er sintering-resistance because the modified limestone protectedaO grain growth. The aforementioned research only studied CaOrain size change; there has been no detailed investigation of therain growth model and its consequences (Table 1).
In this study, nano CaCO3 with a particle size of 70 nm wasdopted as a precursor of nano CaO-based CO2 sorbent. The nanoaO grain growth characteristics were investigated more sys-ematically under continuous changes in calcination conditionsith X-ray diffractometer (XRD) and Scherrer equation. The grain
rowth model of nano CaO related to calcination temperature andime were investigated. The relation of nano CaO grain growth,ore size distribution and specific surface area was studied byitrogen adsorption isotherm measurement. And the adsorptionerformance of CaO sample tested by a thermogravimetric analysisTGA) was discussed.
. Experimental
.1. Preparation of nano CaO samples
Nano CaCO3 (>95% purity) (Hu Zhou Ling Hua Ltd. China) wassed as the CaO-based adsorbent precursor. The X-ray diffractionattern tested with XRD and the morphology tested with transmis-ion electron microscope (TEM) were shown in Figs. 1 and 2. NanoaCO3 used here is hexagonal calcite with an average particle sizebout 70 nm. Nano CaO samples for studying grain growth wereerived from different calcination conditions with a chamber cal-iner. A 3 g sample of nano CaCO3 was placed in corundum cruciblend put into the chamber of the calciner. The calciner was heated
o 750–900 ◦C at a rate of 12 ◦C/min in a N2 flow (0.8 L/min). The2 flow was maintained to prevent CaO from reacting with CO2 oroisture in the atmosphere. The temperature was held constant forable 1xperimental data for CaO grain size during calcination.
t/min T/K
d/nm
1023.5 1073.5 1123.5 1173.510 35.9 41.8 55.6 65.260 42.2 51.5 63.3 91.8
120 51.7 63.0 85.2 102.7240 58.9 75.1 101.8 133.8
Fig. 1. XRD pattern of nano CaCO3.
10–480 min and then cooled to room temperature to make severalsamples.
Samples of the CaO material after multiplecarbonation–calcination cycles were prepared in a verticaltube in a fixed bed. The diagram of gas-solid fixed bed reactorfor evaluating CO2 adsorbent was shown in Fig. 3. The innerdiameter of vertical tube reactor is 18 mm. A 10 g sample of nanoCaCO3 was placed around the thermocouple in the tube reactorto minimize the temperature error. The cyclic CO2 adsorptiontests were conducted under atmosphere pressure. Firstly, heatingthe reactor to 800 ◦C and holding for 30 min in a N2 gas flow(40 mL/min) to complete CaCO3 decomposition. Secondly, coolingthe reactor to 650 ◦C and holding for 40 min, during this period CO2(10 mL/min) was added to complete carbonation. And then repeatthe calcination–carbonation cycles. CaO samples were collectedafter decomposition period at different cycles.
2.2. Characterization of nano CaO
The X-ray diffraction pattern of CaO was tested by an XRD
Fig. 2. TEM image of nano CaCO3.

514 Y. Zhu et al. / Chemical Engineering Journal 175 (2011) 512– 518
e fixed
ub
d
w
tpcdt
r
Bal(oiAe
3
3
tFatCCioX
growth curve for longer calcination times.We also found that the CaO grain size increased 64% at 750 ◦C
after 240 min and gradually accelerated to 105% at 900 ◦C after240 min. The higher the calcination temperature was, the faster
0.9
1.0
1.1
1.2
1.3
1.4
1.5
1.6
wei
ght(m
g)
594.4 ºC
721.1 ºC
Fig. 3. Diagram of th
se in grain size calculations. The mean grain size was determinedy the Scherrer equation, as follows:
= K�
cos �(nm) (2)
here can be fitted by XRD characteristic peaks.TGA (Pyris1, Perkin-Elmer, USA) was used to measure the reac-
ive sorption capacity of nano CaO. Samples of less than 3 mg werelaced into the platinum nacelle of TGA. The sorption process wasonducted at 600 ◦C for 10 min with 0.02 MPa of CO2 in N2. Theetailed operation of the test is described elsewhere [25]. The reac-ive sorption capacity was calculated according to Eq. (3):
eactive sorption capacity = CO2 sorption mol amountM
× 1000 (mol/kg) (3)
The Brunauer–Emmer–Teller (BET) surface area and thearrett–Joyner–Halenda (BJH) desorption pore size distributionnalyses of samples were conducted by nitrogen physisorption iniquid N2 using a Belsorp apparatus (BEL II-mini, Japan). And TEMJEM-1230, JEOL, Japan) was used to investigate the morphologyf nano CaCO3 and nano CaO. Powder materials were dispersedn anhydrous alcohol and then ultrasonically dispersed for 20 min.fter pretreatment the samples were observed with high multiplelectron microscope.
. Results and discussion
.1. The decomposition of nano CaCO3
TGA was adopted to investigate the decomposition tempera-ure of nano CaCO3. The quality curve of nano CaCO3 was shown inig. 4 when temperature programmed heating from 150 to 850 ◦Ct a rate of 15 ◦C/min in N2 atmosphere. From Fig. 4 we found thathe starting and the complete decomposition temperature of nanoaCO3 were 594.4 ◦C and 721.1 ◦C respectively. To investigate nano
aCO3 decomposition in the fixed bed, 750 ◦C calcination for 10 minn N2 atmosphere was adopted. The component and morphologyf decomposition product were examined with XRD and TEM. The-ray diffraction pattern was shown in Fig. 5. Typical peaks of CaO
bed reactor system.
were found in Fig. 5 and no CaCO3 was existed because of com-plete decomposition. The image of CaO was shown in Fig. 6. FromFig. 6 we found that CaO derived from nano CaCO3 decomposi-tion agglomerated in some extent, and the separated grains were80–100 nm.
3.2. The grain growth characteristic of nano CaO undercalcination
To investigate the effect of calcination temperature and accumu-lation of the consecutive calcination time on CaO grain growth, fourcalcination temperatures (750 ◦C, 800 ◦C, 850 ◦C and 900 ◦C) andfive isothermal times (10, 60, 120, 240 and 480 min) were selected.The grain size of the nano CaO under the different calcination con-ditions is shown in Fig. 7. When raising the calcination temperaturefor a fixed isothermal time, the grain size of CaO grew significantly.Prolonging the calcination time at a fixed temperature led to a rapidincrease in the CaO grain size; an asymptote can well describe the
100 200 300 400 500 600 700 800 9000.8
temperature (ºC)
Fig. 4. Decomposition curve of nano CaCO3.

Y. Zhu et al. / Chemical Engineering Journal 175 (2011) 512– 518 515
Fig. 5. XRD pattern of CaO derived from nano CaCO3 decomposition (decompositionconditions: N2 atmosphere, 750 ◦C, 10 min in fixed bed).
Fig. 6. TEM image of CaO derived from nano CaCO3 decomposition (decompositionconditions: N2 atmosphere, 750 ◦C, 10 min in fixed bed).
500450400350300250200150100500-50
40
60
80
100
120
140
750 ºC 800 ºC850 ºC 900 ºC
grai
n si
ze(n
m)
ttIt
40302010020
30
40
50
60
70
80
90
100
110
grai
n si
ze(n
m)
runs
t(min)
Fig. 7. CaO grain size under different calcination conditions.
he CaO grains grew. The CaO grain size increased as the consecu-ive calcination time increased, but the growth was not unlimited.ncreasing the calcination temperature caused the CaO grain sizeo increase and the growth rate to accelerate.
Fig. 8. Nano CaO grain size over multiple cycles (carbonation conditions: 650 ◦C,40 min (N2: 40 mL/min, CO2: 10 mL/min); calcination conditions: 800 ◦C, 30 min (N2:40 mL/min)).
The CaO grain growth over multiple cycles was examined, andthe results are shown in Fig. 8. The CaO grain size grew from 47.6to 82.8 nm after the first 6 cycles and then leveled out at approxi-mately 90 nm over a total of 40 cycles. This result indicates that theintermittent calcination time scattered over multiple cycles had acumulative effect on the grain growth speed only in the first fewcycles. The grain size also approached an asymptote as the numberof cycles increased.
3.3. Nano CaO grain growth kinetics
The grain growth kinetics of nano CaO derived from the decom-position of fresh CaCO3 was investigated. CaCO3 calcination toregenerate CaO is actually a process of simultaneous decompositionand sintering. Small CaO grains emerge after decomposition andthen migrate to the growth interface of large grains, growing largerduring calcination. This process is similar to the sintering processof solid-phase materials. The grain growth model of solid-phasesintering is as follows [20]:
G2 − G20 = Ct (4)
In Eq. (4), the instantaneous average grain size of CaO, G, is aparabola (opening to the right) for growth as a function of calcina-tion time. Here, we treated C as a grain growth rate constant thatcan be used to represent the speed of grain growth. The initial grainsize of CaO after decomposition, G0, and C are both a function of thecalcination temperature. C follows the Arrhenius equation, whichcan be written as given in Eq. (5). The E in Eq. (5) represents theactivation energy of the grain growth.
C = C0 exp(
− E
RT
)(5)
To determine the activation energy for the grain growth by datafitting, Eq. (5) can be written in a linear form, as follows:
ln C = ln C0 − E
R
1T
. (6)
First, Eq. (4) was applied to fit the experimental data shown inFig. 7. By linearly fitting G2 with t, the slope C and intercept G2
0were obtained. The results showed that G0 has a linear relationship
with the calcination temperature. Eq. (7) is the regression equationobtained by linearly fitting G0 and temperature T.G0 = −163.7 + 0.19T R2 = 0.9537 (7)
5 eering Journal 175 (2011) 512– 518
e
C
k
G
tdtsfiaw
3
gpcFac
1401201008060402020
40
60
80
100
120
140
calc
ulat
ed d
ata(
nm)
experimental data(nm)
F(
16 Y. Zhu et al. / Chemical Engin
By linearly fitting ln C and −1/T, the value of C0 and the activationnergy E can be calculated as follows:
0 = 1.25 × 10⁷ E = 120kJ/mol
Combining the results of C0, E and G0, we obtain the grain growthinetics equation:
¯ 2 = (0.19T − 163.7)2 + 1.25 × 10⁷ exp(
−120000RT
)t (8)
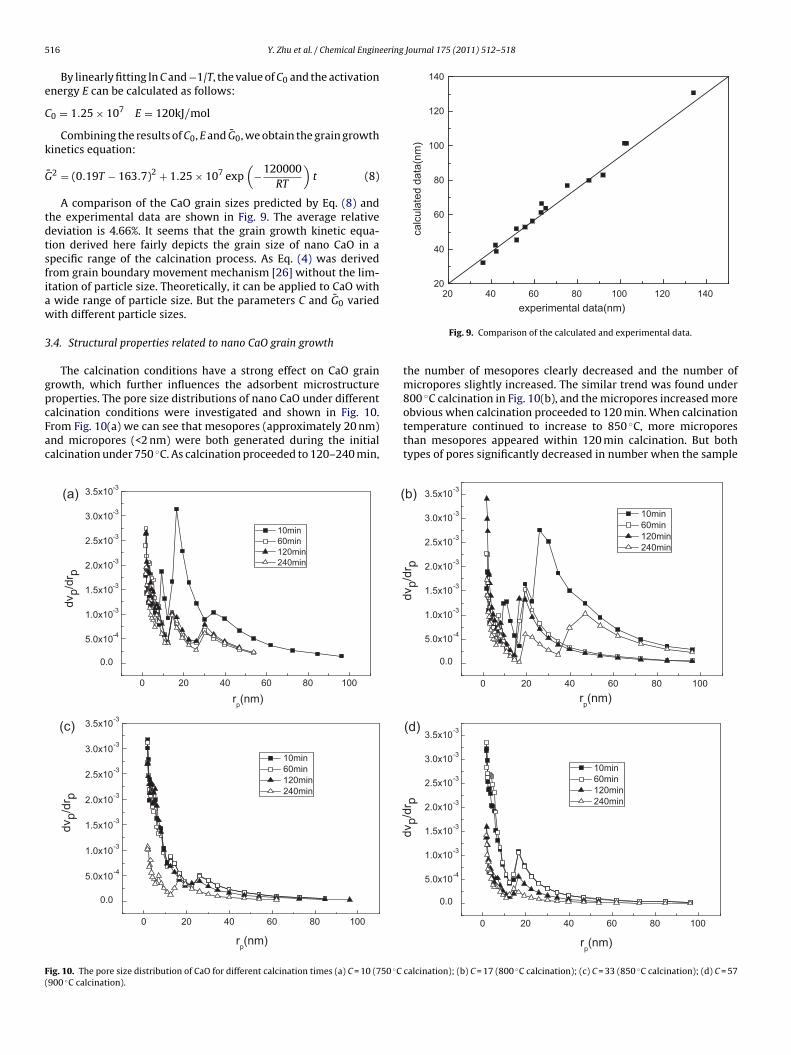
A comparison of the CaO grain sizes predicted by Eq. (8) andhe experimental data are shown in Fig. 9. The average relativeeviation is 4.66%. It seems that the grain growth kinetic equa-ion derived here fairly depicts the grain size of nano CaO in apecific range of the calcination process. As Eq. (4) was derivedrom grain boundary movement mechanism [26] without the lim-tation of particle size. Theoretically, it can be applied to CaO with
wide range of particle size. But the parameters C and G0 variedith different particle sizes.
.4. Structural properties related to nano CaO grain growth
The calcination conditions have a strong effect on CaO grainrowth, which further influences the adsorbent microstructureroperties. The pore size distributions of nano CaO under different
alcination conditions were investigated and shown in Fig. 10.rom Fig. 10(a) we can see that mesopores (approximately 20 nm)nd micropores (<2 nm) were both generated during the initialalcination under 750 ◦C. As calcination proceeded to 120–240 min,100806040200
0.0
5.0x10⁻⁴
1.0x10⁻³
1.5x10⁻³
2.0x10⁻³
2.5x10⁻³
3.0x10⁻³
3.5x10(a) (
(c)
-3
dvp/
drp
rp(nm)
10min 60min 120min 240min
100806040200
0.0
5.0x10⁻⁴
1.0x10⁻³
1.5x10⁻³
2.0x10⁻³
2.5x10⁻³
3.0x10⁻³
3.5x10⁻³
rp(nm)
dvp/
drp
10min 60min 120min 240min
ig. 10. The pore size distribution of CaO for different calcination times (a) C = 10 (750 ◦C
900 ◦C calcination).
Fig. 9. Comparison of the calculated and experimental data.
the number of mesopores clearly decreased and the number ofmicropores slightly increased. The similar trend was found under800 ◦C calcination in Fig. 10(b), and the micropores increased more
obvious when calcination proceeded to 120 min. When calcinationtemperature continued to increase to 850 ◦C, more microporesthan mesopores appeared within 120 min calcination. But bothtypes of pores significantly decreased in number when the sampleb)
(d)
100806040200
0.0
5.0x10⁻⁴
1.0x10⁻³
1.5x10⁻³
2.0x10⁻³
2.5x10⁻³
3.0x10⁻³
3.5x10⁻³
rp(nm)
dvp/
drp
10min 60min 120min 240min
100806040200
0.0
5.0x10⁻⁴
1.0x10⁻³
1.5x10⁻³
2.0x10⁻³
2.5x10⁻³
3.0x10⁻³
3.5x10⁻³
rp(nm)
dvp/
drp
10min 60min 120min 240min
calcination); (b) C = 17 (800 ◦C calcination); (c) C = 33 (850 ◦C calcination); (d) C = 57

ering Journal 175 (2011) 512– 518 517
wA6s
dciC1gmmpgtsTibta
dt7wf
2502001501005000
4
8
12
16
20
750 ºC
800 ºC
850 ºC
900 ºC
surfa
ce a
rea(
m2 /g
)
t(min)
Y. Zhu et al. / Chemical Engine
as calcined for 240 min under 850 ◦C (shown in Fig. 10(c)).nd under 900 ◦C calcination, many micropores appeared within0 min calcination but sharply decreased in number when theample was calcined more than 120 min (shown in Fig. 10(d)).
Under different calcination temperature the trends of pore sizeistributions of nano CaO were not uniform. The grain growth rateonstant C was determined by the calcination temperature accord-ng to Eq. (5). Under calcinations at 750 ◦C, 800 ◦C, 850 ◦C and 900 ◦C,
was calculated as 10, 17, 33 and 57, respectively. When C was0–17, the grain growth of nano CaO was relatively slow. Smallrains coalesced and grew to large grains resulted to the originalesopores between small grains disappeared and transformed toicropores with smaller space. The pore size tended to be micro-
orous. However, when C continued to increase to 33, the smallrains grew rapidly and the micropores sharply decreased whenhe grain size of CaO grew over 100 nm. When C was 57, the grainize of CaO was already more than 100 nm over 120 min calcination.he pore size tended to be nonporous. As discussed above, this find-ng indicated that when sintering was mild, the pore size tended toe microporous at low grain growth speeds, whereas the materialended to be nonporous at rapid grain growth speeds, which wasttributed to severe sintering.
The BET-specific surface areas of the CaO samples derived fromifferent calcination conditions were shown in Fig. 11. It appeared
hat the specific surface areas of the CaO were little change at50–800 ◦C calcination within 120 min, and only a slight declineas observed at 240 min of calcination. However, the specific sur-ace areas of the CaO were little larger during initial times (<60 min)
86420-1
0
1
2
3
4
5
6
7
8
9 (b(a)
(c) (
reac
tive
sorp
tion
capa
city
(mol
/kg)
t(min)
10min 60min 120min 240min
86420
0
2
4
6
8
t(min)
reac
tive
sorp
tion
capa
city
(mol
/kg)
10min 60min 120min 240min
Fig. 12. The reactive sorption capacity of the 1st cycle (a) 750 ◦C calcination
Fig. 11. Specific surface area of CaO derived at different calcination conditions.
at 850–900 ◦C calcination and sharply reduced for long calcinationtimes (>60 min). As the grain size of nano CaO grew for the entiretemperature range investigated, the specific surface area was sup-posed to decrease with the ongoing calcination. The reason for the
◦
almost unchanged specific surface area at 750–800 C calcinationwithin 120 min and the larger surface areas during initial time athigher calcination temperatures may be the increase in micropores(shown in Fig. 10). The emergence of more micropores provided)
d)
86420-1
0
1
2
3
4
5
6
7
8
t(min)
reac
tive
sorp
tion
capa
city
(mol
/kg)
10min 60min 120min 240min
86420-1
0
1
2
3
4
5
6
7
8
t(min)
reac
tive
sorp
tion
capa
city
(mol
/kg)
10min 60min 120min 240min
; (b) 800 ◦C calcination; (c) 850 ◦C calcination; (d) 900 ◦C calcination.

5 eering
ldslcdng
3c
metrtfwrsceacdcs(C
4
mcagCcadpsers
A
dT
[
[
[
[
[
[
[
[
[
[
[
[
[
[
[sorbent looping cycle for CO2 mitigation, Fuel 88 (2009) 697–704.
18 Y. Zhu et al. / Chemical Engin
arger surface areas. This effect in some extent counteracted theecrease of surface areas caused by grain growth. However, atevere calcination conditions the rapid growth of grains and theoss of porous structure reduced the specific surface area. We canonclude that nano CaO grain growth was not the only factoretermining the specific surface area. The specific surface area ofano CaO was determined by both pore size distribution and grainrowth.
.5. CO2 adsorption performance related to nano CaO calcinationonditions
The calcination conditions determined the grain growth and theicrostructure characteristics of nano CaO, which further influ-
nced the CO2 capture performance. TGA was adopted to measurehe sorption capacity of CaO during the first carbonation, and theesults are shown in Fig. 12. From Fig. 12(a) and (b) we found thathe CO2 sorption capacity was 7.5–7.8 mol/kg when CaO derivedrom 750 to 800 ◦C calcination within 120 min. And a slight declineas observed in the 240 min calcination samples. Alternatively, the
esults from the samples derived from 850 ◦C calcination (Fig. 12(c))howed that the sorption capacity was 8 mol/kg for 10 min cal-ination and gradually reduced with calcination time increasespecially more than 60 min. The sorption capacity decreased 50%nd 67% when calcination for 120 min and 240 min. At 900 ◦C cal-ination shown in Fig. 12(d) high sorption capacity was reacheduring initial time and sharply decreased 55% and 76% when cal-ination for 120 min and 240 min respectively. Compared with theurface areas of CaO derived from different calcination conditionsshown in Fig. 11), we found that the sorption capacity of fresh nanoaO was consistent with the specific surface area evolution.
. Conclusions
In this paper, the grain growth characteristics and the growthodel of nano CaO derived from fresh nano CaCO3 under different
alcination conditions were studied. The microstructure propertiesnd the CO2 sorption performance as a function of the nano CaOrain growth were determined. It was found that the grain size ofaO grew significantly and approached an asymptote as isothermalalcination proceeded. The grain growth kinetic equation was built,nd the activation energy was 120 kJ/mol calculated. The pore sizeistribution of nano CaO was determined by the calcination tem-erature and time and varied at different grain growth speeds. Thepecific surface area evolution can be explained by combining theffects of the grain growth and the pore size distribution, and theeactive sorption capacity of CaO was consistent with the specificurface area evolution.
cknowledgments
We are grateful for support from the National Science Foun-ation of China (grant no. 20876142) and the State 863 Highechnology R&D Project of China (grant no. 2009AA05Z104).
[
[
Journal 175 (2011) 512– 518
Appendix A. Supplementary data
Supplementary data associated with this article can be found, inthe online version, at doi:10.1016/j.cej.2011.09.084.
References
[1] B. Feng, H. An, E. Tan, Screening of CO2 adsorbing materials for zero emissionpower generation systems, Energy Fuels 21 (2007) 426–434.
[2] K. Lackner, A guide to CO2 sequestration, Science 300 (2003) 1677–1678.[3] H. Gupta, L.S. Fan, Carbonation-calcination cycle using high reactivity calcium
oxide for carbon dioxide separation from flue gas, Ind. Eng. Chem. Res. 41 (2002)4035–4042.
[4] C. Han, D.P. Harrison, Simultaneous shift reaction and carbon dioxide sep-aration for the direct production of hydrogen, Chem. Eng. Sci. 49 (1994)5875–5883.
[5] D.P. Harrison, Sorption-enhanced hydrogen production: a review, Ind. Eng.Chem. Res. 47 (2008) 6486–6501.
[6] S.F. Wu, L.B. Li, Y.Q. Zhu, X.Q. Wang, A micro-sphere catalyst complex withnano CaCO3 precursor for hydrogen production used in ReSER process, Eng.Sci. 8 (2010) 22–26.
[7] M. Gadalla, Z. Olujic, P. Jansens, M. Jobson, R. Smith, Reducing CO2 emissionsand energy consumption of heat-integrated distillation systems, Environ. Sci.Technol. 39 (2005) 6860–6870.
[8] Y. Kato, N. Harada, Y. Yoshizawa, Kinetic feasibility of a chemical heat pumpfor heat utilization of high-temperature processes, Appl. Therm. Eng. 19 (1999)239–254.
[9] P. Sun, J.R. Grace, C.J. Lim, E.J. Anthony, The effect of CaO sintering on cyclic CO2
capture in energy systems, AlChE J. 53 (2007) 2432–2442.10] R.H. Borgwardt, Sintering of nascent calcium oxide, Chem. Eng. Sci. 44 (1989)
53–60.11] R.H. Borgwardt, Calcium oxide sintering in atmospheres containing water and
carbon dioxide, Ind. Eng. Chem. Res. 28 (1989) 493–500.12] R.M. German, Z.A. Munir, Surface area reduction during isothermal sintering, J.
Am. Ceram. Soc. 59 (1976) 379–383.13] S.F. Wu, Q.H. Li, J.N. Kim, K.B. Yi, Properties of a nano CaO/Al2O3 CO2 sorbent,
Ind. Eng. Chem. Res. 47 (2008) 180–184.14] J.C. Abanades, The maximum capture efficiency of CO2 using a carbona-
tion/calcination cycle of CaO/CaCO3, Chem. Eng. J. 90 (2002) 303–306.15] V. Fierro, J. Adanez, F. Garcia-Labiano, Effect of pore geometry on the sintering
of Ca-based sorbents during calcination at high temperatures, Fuel 83 (2004)1733–1742.
16] J.C. Abanades, D. Alvarez, Conversion limits in the reaction of CO2 with lime,Energy Fuels 17 (2003) 308–315.
17] G.S. Grasa, J.C. Abanades, CO2 capture capacity of CaO in long series of carbon-ation/calcination cycles, Ind. Eng. Chem. Res. 45 (2006) 8846–8851.
18] J.C. Abanades, E.J. Anthony, D.Y. Lu, C. Salvador, D. Alvarez, Capture of CO2 fromcombustion gases in a fluidized bed of CaO, AlChE J. 50 (2004) 1614–1622.
19] S. Dobner, L. Sterns, R.A. Graff, A.M. Squires, Cyclic calcination and recarbona-tion of calcined dolomite, Ind. Eng. Chem., Process Des. Dev. 16 (1977) 479–486.
20] H. Lu, E.P. Reddy, P.G. Smirniotis, Calcium oxide based sorbents for cap-ture of carbon dioxide at high temperatures, Ind. Eng. Chem. Res. 45 (2006)3944–3949.
21] W.Q. Liu, N.W. Low, B. Feng, G.X. Wang, J.C.D. da Costa, Calcium precursorsfor the production of CaO sorhents for multicycle CO2 capture, Environ. Sci.Technol. 44 (2010) 841–847.
22] S. Dash, M. Kamruddin, P.K. Ajikumar, A.K. Tyagi, B. Raj, Nanocrystalline andmetastable phase formation in vacuum thermal decomposition of calcium car-bonate, Thermochim. Acta 363 (2000) 129–135.
23] Z.X. Feng, Y. Zheng, L. Zhang, C.G. Zheng, Research on high temperature sin-tering behavior of CaO sorbent used in multi-cyclic CO2 capturing, J. Eng.Thermophys. 30 (2009) 537–539.
24] Y.J. Li, C.S. Zhao, H.C. Chen, C. Liang, L.B. Duan, W. Zhou, Modified CaO-based
25] S.F. Wu, Y.Q. Zhu, Behavior of CaTiO3/Nano-CaO as a CO2 reactive adsorbent,Ind. Eng. Chem. Res. 49 (2010) 2701–2706.
26] G.W. Cui, Defects, diffusion and sintering, Tsinghua University Press, Peking,1990.