1 sawdust city waste collection by todd m. kamenick a research
TRANSCRIPT

Sawdust City Waste Collection
by
Todd M. Kamenick
A Research Paper Submitted in Partial Fulfillment of the
Requirements for the Master of Science Degree
In
Technology Management
Jim Keyes, Ph.D.
The Graduate School
University of Wisconsin-Stout
May, 2011
1

2
The Graduate School
University of Wisconsin-Stout
Menomonie, WI
Author: Kamenick, Todd M.
Title: Sawdust City Waste Collection
Graduate Degree/ Major: MS Technology Management
Research Adviser: Jim Keyes, Ph.D.
Month/Year: May, 2010
Number of Pages: 56
Style Manual Used: American Psychological Association, 6th
edition
Abstract
This study examined the strategies of wood dust removal using statistical data and practical
solutions surrounding the challenges facing a small wood products manufacturer. The
information focused on costs of the existing multiple containment system versus a new central
wood dust and wood chip collection system with a justification for new equipment. The project
studied the air quality concerns within the workplace, assessed the options and strategies of
wood dust control, and explained compliance of federal regulations. The study followed the Six
Sigma Determine-Measure-Analyze-Improve-Control (DMAIC) model as a methodology within
a problem solving process. The conclusions established convincing financial justification for
improvements to the existing wood dust and wood chip collection system.
3
Table of Contents
………………………………………………………………………………………………....Page
Abstract…………………………………………………………………………………………....2
List of Tables..................................................................................................................................6
List of Figures…………………………………………………………………………………......7
Chapter I: Introduction……………………………………………………………………………8
Statement of the Problem……………………………………………………………….....9
Purpose of the Study..........................................................................................................10
Assumptions of the Study..................................................................................................10
Definition of Terms............................................................................................................11
Limitations of the Study.....................................................................................................11
Methodology......................................................................................................................11
Chapter II: Literature Review........................................................................................................14
Dust Particles.....................................................................................................................15
Efficiencies versus Cleaning..............................................................................................15
Health Concerns.................................................................................................................16
Fire Hazards.......................................................................................................................20
Slips and Falls Hazards......................................................................................................22
The DMAIC Process of Six Sigma....................................................................................22
Existing Dust Collection Equipment.................................................................................24
Available Dust Collection Equipment...............................................................................25
Summary............................................................................................................................26
Chapter III: Methodology..............................................................................................................28

4
Define Phase......................................................................................................................28
Measure Phase...................................................................................................................30
Instrumentation……………………………………..............................................32
Data Collection Procedures....................................................................................32
Analysis Phase...................................................................................................................33
Cleaning versus Efficiencies..................................................................................33
Air Quality.............................................................................................................35
Improve Phase....................................................................................................................37
Cost of Cleaning....................................................................................................37
Control Phase.....................................................................................................................39
Summary............................................................................................................................39
Chapter IV: Results........................................................................................................................41
Results: Cleaning versus Efficiencies................................................................................41
Results: Air Quality...........................................................................................................42
Item Analysis.....................................................................................................................42
Limitations of Data............................................................................................................43
Summary............................................................................................................................43
Chapter V: Discussion...................................................................................................................44
Recommendations..............................................................................................................44
Discussion on ―As-Is‖........................................................................................................45
Discussion on Recommendation #1...................................................................................45
Discussion on Recommendation #2...................................................................................47
Conclusions and Implications............................................................................................48

5
Further Research Recommendations.................................................................................48
References......................................................................................................................................50
Appendix A: Mapping the Process-―As Is‖...................................................................................53
Appendix B: Mapping the Process-Recommendation #1..............................................................54
Appendix C: Mapping the Process-Recommendation #2…...………......…………………..…...55
Appendix D: Internal Review Board Approval.............................................................................56

6
List of Tables
Table 1: Occupational Exposure Levels........................................................................................18
Table 2: Respiratory Conditions……...………………………………………………….............19
Table 3: Summary of DMAIC Model............................................................................................23
Table 4: Dust Collector Specifications..........................................................................................24
Table 5: A Summary of Dust Collection Methods........................................................................25
Table 6: Define Checklist for Sawdust City..................................................................................29
Table 7: Cost of Cleaning..............................................................................................................37
Table 8: Cost/Benefit Analysis of Wood Dust Collection Systems..............................................38

7
List of Figures
Figure 1: Fishbone Diagram..........................................................................................................31
Figure 2: Estimated Time of Cleaning Comparison......................................................................34
Figure 3: CFM Ratings on Existing Equipment............................................................................36

8
Chapter I: Introduction
Sawdust City is a small manufacturer that creates a variety of custom wood products. With
a family-like atmosphere, the company employs around twelve full-time workers and is located in
Eau Claire, WI. Through wholesale outlets and internet retail sales, the company‘s customer base
reaches across the United States. The wood products are made from solid knotty pine with quality
paints, stains, glues and fasteners. Sawdust City uses only certified sustainable forestry mills and
uses appropriate methods of recycling waste.
As a responsible employer, Sawdust City would like to provide a clean and safe production
environment for its employees. In 2009, the Occupational Safety and Health Administration
(OSHA) made an unannounced visit to the production facility. The owner of Sawdust City was
faced with a manufacturing challenge to the Eau Claire facility. While the air quality tests and
inspection came back above the OSHA standards and no citations were given to the company, the
levels of saw dust particles throughout the facility needed to be dealt with to eliminate the chance of
future violations.
Sawdust City currently has a separate patchwork of dust collection devices at individual
work stations. These devices range in types, brands and ages. The inconsistency and variability of
the collection devices are problematic for operators and employees. Airborne dust particles settle
on finished products, work-in-process products, raw materials and on all vertical and horizontal
surfaces. The challenge is to implement a wood dust and wood chip collection strategy that would
eliminate or greatly reduce the airborne particles. An improvement to the existing waste collection
system would provide increased efficiencies to the production process, a cleaner air and working
environment for the employees and a reduction in fire hazards. The secondary benefits to
implementing a wood dust and wood chip collection strategy would be a complete compliance to

9
OSHA laws and regulations, possible reduction in fire insurance premiums, and more content
employees manufacturing an increased level of quality products for the customer.
With established findings of health hazards that well-documented in international studies,
the problems created by wood dust particles are a strong area of concern for woodshop and wood
products manufacturers. By using the studies and information from OSHA, the levels of pollutants
are well-known and published; information on regulations, testing, and other areas of concern
involving the amount of wood dust particulate are common related workplace violations for
woodshop and wood products manufacturers. A comprehensive wood dust and wood chip
collection strategy would provide an improvement to the work environment centering on the long-
term health and safety of the employees.
The problems of wood dust particles affect the efficiencies of the production process in
several ways. A major area of cost to a woodshop and wood products manufacturer involves
cleaning. Although it is usually not calculated into the total production equation, cleaning wood
dust and wood chip particles can be associated with loss of production time and wages. The
categories of cleaning associated with this project are the regularly planned cleaning and the
continual dusting of products and equipment. Information on the costs of planned and continual
dusting was gathered at the facility. Another area of cost would be wear and tear to the operational
equipment; wood dust and wood chips particles can reduce efficiencies to cutting blades, electric
motors, and tool life. These could be considered secondary production costs. The primary costs
were factored on hourly wages of employees, costs of operating equipment and other general
overhead expenses.
Statement of the Problem
Sawdust City has a need for an integrated wood dust and wood chip collection system to

10
handle the amount of uncontrollable and somewhat uncontainable wood waste throughout the
production plant that results in airborne particles. These airborne particles are causing several
problems in terms of costs, which include loss of production and efficiencies, poor air quality to
employees, fire hazards, and increase risk of injuries due to slip and fall hazards.
Purpose of the Study
The underlying principle improvements in this project involved reductions in the amount
of time spent cleaning wood dust and wood chip particles, and improved air quality in the
workplace. The purpose of this study was to examine the amount of wood dust and wood chip
waste produced, the amount of time that it takes for the cleanup, the levels of airborne particles,
and the cost benefit analysis of implementing a single industrial dust and wood chip collection
system. This study followed the Six Sigma system improvement model called Determine-
Measure-Analyze-Improve-Control (DMAIC) as a methodology for comprehensive problem-
solving. The goal of this project was to develop the strategy of wood dust removal, to provide
specific information and statistical data, and to create practical solutions surrounding the
problems that faced Sawdust City‘s production facility and management. This study examined
the amount of airborne particles as dictated by OSHA regulation code case number 9004-34-6.
This study also examined the cost of a central collection system versus a multiple containment
system with a justification for new equipment. At the conclusion of this project, the project will
make a set of choice recommendations to assist the management of Sawdust City through the
multifaceted decision-making process.
Assumptions of the Study
This study presumes the existing wood dust and wood chip collection system is
inefficient in collecting waste particles. While the current working environment has passed an

11
OSHA inspection, the levels of wood dust particles need to be improved for the overall health of
the employees. For the purpose of this study, the information gathered was based on the testing
methods by OSHA, and are assumed to be true and accurate. The efficiency versus cleaning
calculations established a comparison for the production data; it is based on an average of one
thousand pieces produced per 10-hour shift and the applied standard hourly rates.
Definition of Terms
DMAIC- ―(Pronounced ‗Duh-MAY-ick‘) is a structured problem-solving methodology
widely used in business,‖ (George, 2005, p. 1).
Six Sigma- ―Method for setting continuous improvement targets and for monitoring
progress in improving any process,‖ (Berger, 2003, p. 2).
Limitations of the Study
This study will be limited to the wood dust and wood chip collection systems that are
examined and available. This study is also limited to the amount of information collected from
OSHA and Sawdust City. The study was unrestrained in finding information and observing the
production process by Sawdust City‘s ownership and management.
Methodology
The primary goal of collecting and analyzing data from the existing wood dust and wood
chip collection system required a methodology that examined detail, and defined aspects of this
complex problem. By using a logical set of problem-solving steps, the chosen methodology for
this project was found in the Six Sigma process improvement model. Specifically, the problem-
solving process known by the acronym DMAIC (Determine, Measure, Analysis, Improve and
Control) is part of the broader Six Sigma system. The DMAIC problem-solving process was
chosen as a methodology because of the systematic and logical examination of all the facets

12
involved within a complex project.
The ―Define‖ phase started with the definition and understanding of the problem. What
factors determined this problem and what were the core issues as it related to the problem? By
using process tools like Critical to Quality (CTQ), Definition Checklist, Brainstorming, and
Mapping the Process, the ―Define‖ phase develops the problem model that will be studied.
Mapping the Process in this phase is a high-level, ―As Is‖ map of the production flow and
positioning of the wood manufacturing and dust collection equipment.
The second phase involves the process of ―Measure.‖ This examines the data to be
collected and the most probable causes of the problem by using a Cause-and-Effect diagram, also
known as a Fishbone diagram. Within the Fishbone diagram, the 5M‘s (machine, material,
method, measurement, manpower) and 1E (environment) are examined. From this a Data
Collection Plan is developed and defects are identified. Within this project, defects are
considered wood dust particles, the sources of the particles not collected and areas of the shop
that need to be cleaned. Information regarding current rules and regulations, and standards of the
industry were gathered and studied as a baseline comparison.
Within the ―Analysis‖ phase, the statistical data was compiled into a quantitative analysis
to show exposure, cost comparisons, and production process information. Along with the
physical analysis of the dust and wood chips particles, production analysis produced a baseline
with a relationship of time and cost. Graphical techniques, such as a Histogram and Plot Graph,
were utilized to illustrate relationships between the defects, equipment and sources of the
particles. Also using Correlation Analysis and Hypothesis Testing as analysis techniques
discovered patterns within the data variation and possible areas of future examination.
The data was then charted in the ―Improve‖ phase. Other types of statistical methods

13
were used to look at alternative solutions for solving the wood dust and wood chip collection
problem. In this phase, the information was integrated to develop final drafts of Mapping the
Process, alternative improvements, and an implementation of the best alternative. A cost/benefit
analysis was compiled to validate and synthesize a rationale for improving the process. The
information and findings were discussed with the stakeholders of the project.
The final phase of the project involved the ―Control‖ phase, which encompassed
implementing solutions with all the information gathered. For this project, the ―Control‖ phase
consisted of more planning and design implementation. Documentation of the project was
compiled, and several opportunities regarding system changes were identified. The intention of
this process started as a complete examination of the problem with a yield at conclusion of
finding tangible sets of choices for management.

14
Chapter II: Literature Review
Finding the right strategy for the many challenges involved in collecting wood dust and
wood chip particles can be a real puzzle for a wood shop or wood manufacturing business. The
tests that the industry faces today entail developing an efficient process that reduces costs, while
maintaining profitable returns from capital assets, and creating a healthy work environment for
their employees from reductions in the amount of wood dust particles. The needs for innovative
strategies have been dictated by modern changes in wood working equipment. Wood
manufacturing companies have moved from using hand tools to an automated process with high-
powered wood working equipment. ―The investment in a quality wood dust and wood chip
collection system is essential to meeting the modern demands,‖ (Iwanski, 1999, p. 8).
While developing an effective wood dust collection strategy, an understanding of
compliance regarding the OSHA rules and regulations by the business becomes an important
factor. In the OSHA Limits for Air Contaminants (2009), wood dust particles are categorized as
cellulose under case number 9004-34-6. The total wood dust amount a worker can be exposed to
is 15 mg/m (3) and a respirable dust fraction exposure of 5 mg/m (3), (Table Z-1, Cellulose).
Mg/m (3) means milligrams per cubic meter. The inhalation exposure is measured by figuring
the parts per million. Used with mathematical formulas, it is factored as the dose of particles that
is represented, (Keith, 1996).
Sampling is examined to determine the collection and containment of wood dust and
wood chip particles while analyzing the equipment needed to meet or exceed the OSHA
standards. Revealing the exposure amounts of wood dust in a workplace can be a valuable tool
to management, not only for meeting regulations, but for the planning of future expansion and
finding the areas of the wood shop or wood manufacturing areas that need attention.

15
Dust Particles
An overall understanding of the source and the size of the particulate matter can change
the strategy of collection and containment. Different sizes of dust from the variety of wood
working equipment can determine the areas of sampling and eventually the methods of
collection. According to Nagyszalanczy (1996), the different categories of dust would include:
―large shavings that gather rapidly and provide the most challenges in terms of volume; chips
and sawdust that cover a wide variety of sizes and can also produce volume; and the last
category is fine wood powder, which is the hardest to collect and the provides the most
challenges in a collection strategy,‖ (p. 4-10).
The fine wood dust particles cause the most problems for detection and collection.
Filtration methods offer the best methods for controlling the fine dust. ―The best filters materials
proved quite effective for fine particles. The best mass removal efficiencies for fine particles
around 0.3 mg/m3 were over 80% for some loaded materials,‖ (Welling, 2009, p.97). Similar to
a regular filter on a home furnace, filtering is one of the dust control methods and helps pull the
fine wood dust particles out of the air effectively. Iwanski (1999) found, ―the increased
popularity of fine filter products has also allowed companies to significantly decrease the amount
of fine dust in the air, potentially the most dangerous because of its ‗invisibility,‘‖ (p. 6). In the
Minnesota Wood Dust Study, Brosseau et al (2001) observed and sampled several small wood
working shops on the exposure of workers over an 8-hour work day period. The study found
significant exposure of fine dust particles relating to tasks of sanding, (p. 322).
Efficiencies versus Cleaning
Efficiencies in production time and improved tooling life can be enhanced by a proper
dust collection system. While industry studies on the amount of time the average wood

16
manufacturing worker spends cleaning and dusting product were not available, in wood shops
and wood manufacturing facilities there is significant loss of production time due to the tasks of
cleaning. Most production areas are cleaned by using compressed air to blow the wood dust and
wood chips off the production floors, surfaces and equipment. The employees will then dry
sweep the particles into a pile for disposal. A study conducted by Alwis et al (1999) stated, ―The
use of compressed air to clean the surface of machines to remove dust from stored timber, work
pieces, and clothing made dust airborne. Dry sweeping further aggravated the situation,‖ (p. 6).
While the Bureau of Labor and Statistics does not specifically categorize cleaning, it
could be linked as a non-productive statistic. ―Productivity... ideally compare output to the
actual resources used. This means that only the hours of workers actively engaged in production
should be counted…‖ (Bureau of Labor Statistics, 2003, p. 1). To the employees, the cleaning
process can also be a repetitive, unproductive task. The employee‘s time and efforts would be
better utilized working on manufacturing a product rather than cleaning. According to OSHA
(2009) regulation 1910.141(a)(3)(i) regarding cleaning dictates that, ―All places of employment
shall be kept clean to the extent that the nature of the work allows,‖ (ID9790). Housekeeping is
an inevitable cost of production. It does seem like a complicated challenge of implementing
efficiencies and altering the work environment to meet health regulations; both cleaning and dust
removal can cost serious capital outlay in terms of wages and equipment.
Health Concerns
The health hazards created by the wood dust and wood chip particles are the areas of
concern that center on the long-term effects of health and safety of the employees. According to a
Center of Disease Control (2009) website,
Workers exposed to wood dusts have experienced a variety of adverse health effects such

17
as eye and skin irritation, allergy, reduced lung function, asthma, and nasal cancer.
Therefore, the National Institute for Occupational Safety and Health (NIOSH)
recommends limiting wood dust exposures to prevent these health problems, (p.1).
What are the causes and categories of the health hazards related to wood dust? When it
comes to determining the hazards of wood dust, particle size matters. Fine wood dust that is
produced by sanding poses the most danger the employees in the workplace. The author, Boss,
states, ―Respirable dust is a component of particulates in the air stream that will deposit within
the gaseous exchange areas of the lung. Respirable particles are just the right size to travel with
inspired air into the alveoli of the lung,‖ (2001, p.46). The long term affects of wood dust can
vary in condition and degree of symptoms. Headaches, nasal irritations, shortness of breath,
acute and chronic cough, chest pain, and skin disorders can occur with exposure to wood dust
particles. An extensive study completed by Milanowski et al (2002) found, ―Strong evidence
that exposure…may lead to the development of work-related symptoms and lung function
impairment,‖ (p. 102).
How is the exposure to wood dust particles measured? The level of exposure is
determined through sampling the air in the workplace. ―Air samples, like most environmental
samples, are taken for one of two basic reasons: to gather internal data, or to attempt to prove
compliance with a regulation,‖ (Bodger, 2003, p. 91). Documented compliance and
improvements can become a company asset in the process of satisfying regulators. Sampling
becomes a challenge in determining exposure limits and calculating the doses to employees.
Sampling is a process of determining the amount of exposure a person receives overtime. ―Some
of the possible exposure assessment measurement parameters are as follows: particulate
concentration in the breathing zone (concentration x time = dose),‖ (Keith, 1996, p. 526).
18
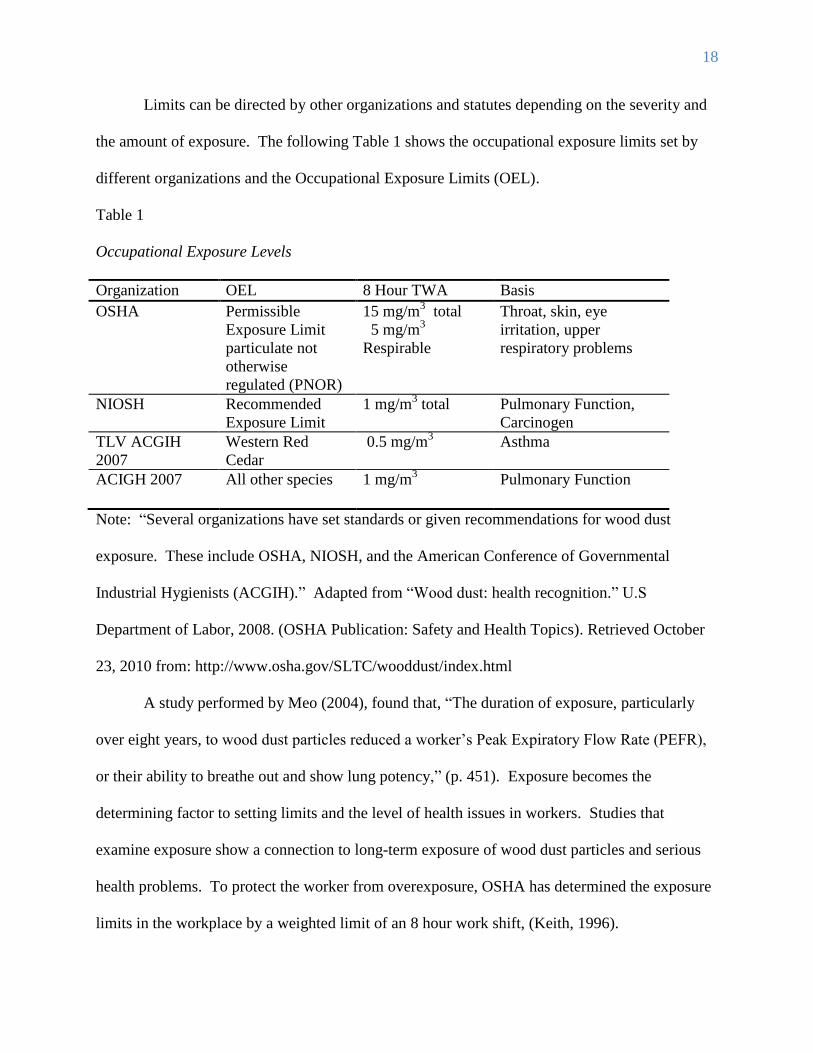
Limits can be directed by other organizations and statutes depending on the severity and
the amount of exposure. The following Table 1 shows the occupational exposure limits set by
different organizations and the Occupational Exposure Limits (OEL).
Table 1
Occupational Exposure Levels
Organization OEL 8 Hour TWA Basis
OSHA Permissible
Exposure Limit
particulate not
otherwise
regulated (PNOR)
15 mg/m3 total
5 mg/m3
Respirable
Throat, skin, eye
irritation, upper
respiratory problems
NIOSH Recommended
Exposure Limit
1 mg/m3 total Pulmonary Function,
Carcinogen
TLV ACGIH
2007
Western Red
Cedar
0.5 mg/m3 Asthma
ACIGH 2007 All other species 1 mg/m3 Pulmonary Function
Note: ―Several organizations have set standards or given recommendations for wood dust
exposure. These include OSHA, NIOSH, and the American Conference of Governmental
Industrial Hygienists (ACGIH).‖ Adapted from ―Wood dust: health recognition.‖ U.S
Department of Labor, 2008. (OSHA Publication: Safety and Health Topics). Retrieved October
23, 2010 from: http://www.osha.gov/SLTC/wooddust/index.html
A study performed by Meo (2004), found that, ―The duration of exposure, particularly
over eight years, to wood dust particles reduced a worker‘s Peak Expiratory Flow Rate (PEFR),
or their ability to breathe out and show lung potency,‖ (p. 451). Exposure becomes the
determining factor to setting limits and the level of health issues in workers. Studies that
examine exposure show a connection to long-term exposure of wood dust particles and serious
health problems. To protect the worker from overexposure, OSHA has determined the exposure
limits in the workplace by a weighted limit of an 8 hour work shift, (Keith, 1996).

19
During a study that examined different types of wood dust emissions, Welling et al
(2009) determined that using sand paper on a piece of pine produced particle sizes of between
.05 and .10 mg. The pine created larger particle sizes and fewer emissions than the MDF
(Medium-Density Fiberboard) and birch plywood that was tested, (p.93). The species and types
of wood can determine the exposure limits and health condition risks.
Table 2
Respiratory Conditions
Number of cases (000)
Incidence rate
Goods producing(2) 2.7 1.3
Natural resources and mining (2)(3) .2 1.6
Construction .7 1.2
Manufacturing 1.7 1.4
Adapted from: ―Illnesses by category of illness rates and counts.‖ Bureau of Labor Statistics,
2009, Table SNR07. Retrieved October 23, 2010 from
http://www.bls.gov/iif/oshwc/osh/os/ostb2429.txt
In contrast to other industry sectors, manufacturing workers have greater
incidents of respiratory problems. Table 2 explains an OSHA survey of Non-Fatal Occupational
Illnesses; as a comparison of different industry sectors for 2009, the information was withdrawn
from a broader study with the focus here showing the number of cases involving respiratory
conditions. In manufacturing, the numbers of cases are much greater than any of the other sectors;
however, the incident rates are very comparable.
The severity of health related illnesses have been linked to the exposure to wood dust, the
size of the particles, and the types of wood products. The longer the duration of contact a person
becomes exposed to fine particles of wood dust, the greater chance for serious health concerns.
―To ensure that a particulate sample is representative, sampling is conducted at a regular
20
array of locations covering the entire cross-sectional area of the duct or stack,‖ (Keith, 1996, p.
481). The ability to meet specific OSHA specifications is related to the sampling collection
methods of wood dust and wood chip particles. By taking several samples from different areas
around the wood shop, a midpoint can be established and comparison samples can be taken at a
later date. Sampling is a way of determining the category of dust, the methods of collection, and
the equipment needed to establish an overall strategy.
Although the natural pine used exclusively in this particular production process has a
lesser-degree of health exposure risk and symptoms, the dangers to the employees must not be
taken without concern to their long-term health and safety.
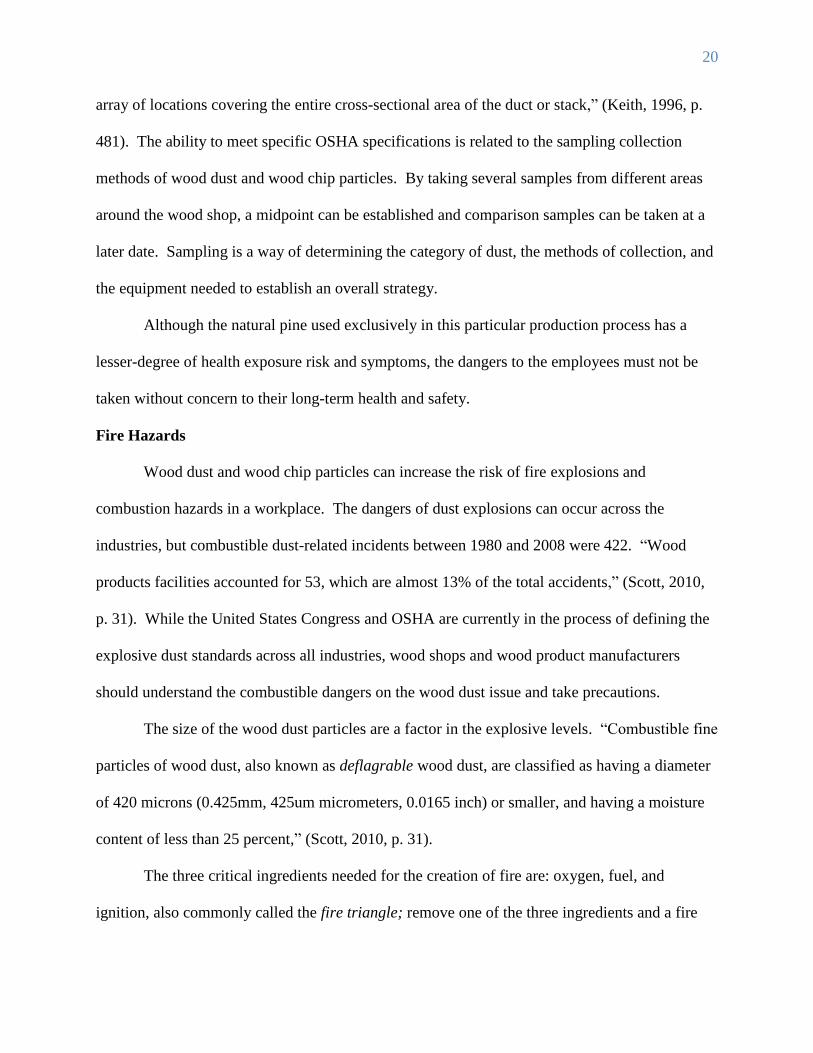
Fire Hazards
Wood dust and wood chip particles can increase the risk of fire explosions and
combustion hazards in a workplace. The dangers of dust explosions can occur across the
industries, but combustible dust-related incidents between 1980 and 2008 were 422. ―Wood
products facilities accounted for 53, which are almost 13% of the total accidents,‖ (Scott, 2010,
p. 31). While the United States Congress and OSHA are currently in the process of defining the
explosive dust standards across all industries, wood shops and wood product manufacturers
should understand the combustible dangers on the wood dust issue and take precautions.
The size of the wood dust particles are a factor in the explosive levels. ―Combustible fine
particles of wood dust, also known as deflagrable wood dust, are classified as having a diameter
of 420 microns (0.425mm, 425um micrometers, 0.0165 inch) or smaller, and having a moisture
content of less than 25 percent,‖ (Scott, 2010, p. 31).
The three critical ingredients needed for the creation of fire are: oxygen, fuel, and
ignition, also commonly called the fire triangle; remove one of the three ingredients and a fire
21
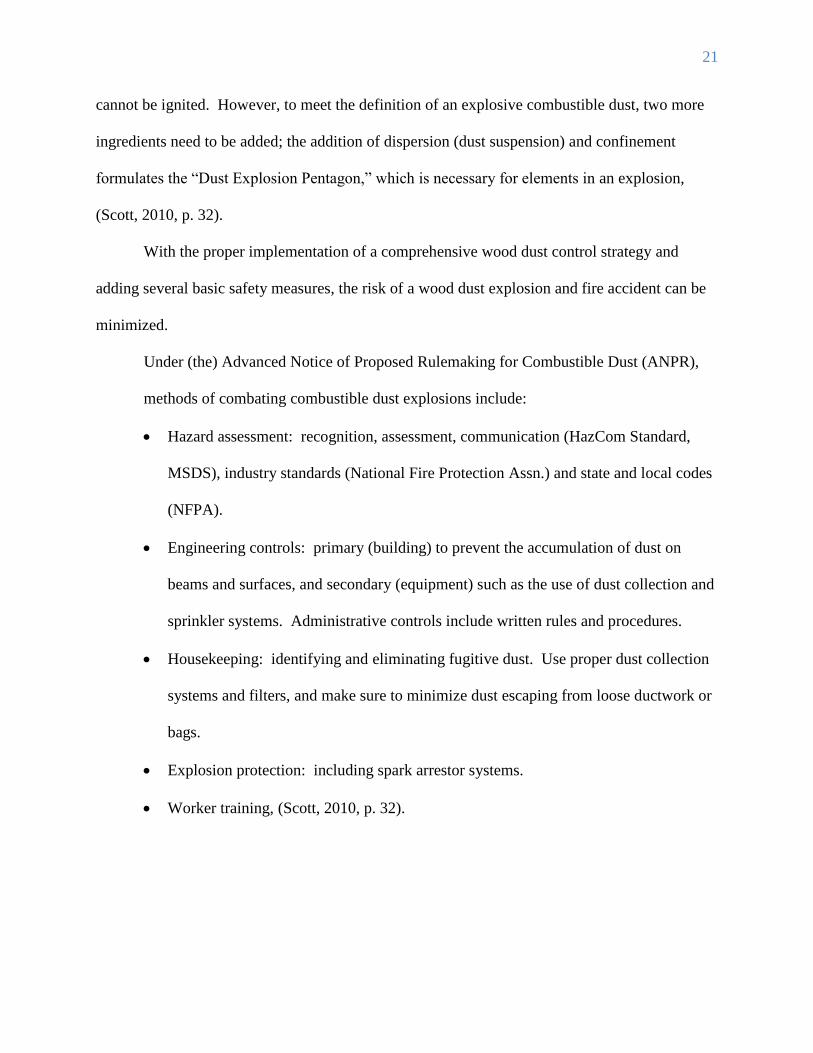
cannot be ignited. However, to meet the definition of an explosive combustible dust, two more
ingredients need to be added; the addition of dispersion (dust suspension) and confinement
formulates the ―Dust Explosion Pentagon,‖ which is necessary for elements in an explosion,
(Scott, 2010, p. 32).
With the proper implementation of a comprehensive wood dust control strategy and
adding several basic safety measures, the risk of a wood dust explosion and fire accident can be
minimized.
Under (the) Advanced Notice of Proposed Rulemaking for Combustible Dust (ANPR),
methods of combating combustible dust explosions include:
Hazard assessment: recognition, assessment, communication (HazCom Standard,
MSDS), industry standards (National Fire Protection Assn.) and state and local codes
(NFPA).
Engineering controls: primary (building) to prevent the accumulation of dust on
beams and surfaces, and secondary (equipment) such as the use of dust collection and
sprinkler systems. Administrative controls include written rules and procedures.
Housekeeping: identifying and eliminating fugitive dust. Use proper dust collection
systems and filters, and make sure to minimize dust escaping from loose ductwork or
bags.
Explosion protection: including spark arrestor systems.
Worker training, (Scott, 2010, p. 32).
22
In a wood manufacturing facility or wood shop there is a great potential for a fire or an
explosion accident caused by the ignition of wood dust and wood chips. However, with the
proper wood dust and wood chip collection strategy the risks of loss of life, property and
business can be greatly reduced.
Slips and Falls Hazard
In the workplace, wood dust and wood chip particles can make surfaces dangerous and
can increase the risk of injuries due to slips and falls hazard. The areas in the workplace must be
free of wood dust and wood particles to the best of the employer‘s ability. The definition
regarding work shop floors, according to OSHA (2009) code 1910.265(c)(3)(iv), ―Nonslip floors,
floors, foot walks, and passageways in the work area around machines or other places where a
person is required to stand or walk shall be provided with effective means to minimize slipping,‖
(ID9861). With an effective wood dust and wood chip collection strategy, regulations will be
met, and the working environment will reflect an employee safety mindset. The benefits to the
wood shop and wood product manufacturer will result in fewer employee accidents, medical
expenses and Workman‘s‘ Compensation Insurance claims; the outcome will also be a net savings
to the organization in real dollars through lower premiums.
The DMAIC Process of Six Sigma
―Six Sigma is a methodology that attempts to create harmony between technology,
people and business strategy and, at the same time, optimize each of the components with the
total organization in mind,‖ (Stamatis, 2004, p.xvi). The project will follow the methodology
used in the Six Sigma problem solving process called DMAIC. The DMAIC process is very
effective in solving complex problems by establishing a step-by-step strategy. With a focus on
the detail of the problem, this functional methodology will examine the problem in a practical

23
way. The DMAIC model is broken down into logical areas of activities called phases. Each of
these phases will use separate tools and methodologies to investigate a little deeper into the main
problem.
Table 3 is a summary of the five different phases, tools/methodologies, and deliverables
within the DMIAC model; it will be followed in sequence as the accepted methodology of this
study.
Table 3
Summary of DMAIC Model
Phases Tools/Methodologies Deliverables
Define Brainstorming
Critical to Quality
Definition Checklist
Process Mapping
The real customers
Team charter—with emphasis on:
Problem statement & Project scope
Projected financial benefits
High-level process map—―as is‖
Measure Process mapping
Cause and effect
Data Collection Plan
Key measurements identified
Defects identified
Data collection plan completed
Baseline measures of process capability
Analyze Process mapping
Graphical techniques
Hypothesis testing
Correlation
Detailed ―As Is‖ process map completed
The sources of variation and their
prioritization
Estimates of the quantifiable opportunity
represented by the problem
Improve Process Mapping
Design of experiments
Simulation
Optimization
Alternative improvements
Implementation of best alternative for
improving the process
―Should be‖ process map developed
Validation of the improvement—especially
for key behaviors required by new process
Cost/benefit analysis for the proposed
solutions
Implementation plan developed—a
preliminary preparation for the transition to
control stage
Communication plan established for any
changes
Control Control Plans
Mistake-proofing
Documentation of the project
Translation opportunities identified

24
Preventive
maintenance
Systems and structures changes to
institutionalize the improvement
Adapted from ―Six Sigma Fundamentals,‖ by D.H. Stamatis, 2004, 41-43.
Existing Dust Collection Equipment
The existing wood dust collection system is a mix of single and dual canisters collection
units of different makes and models. Within the instruction and internet manuals, the machine
data sheets provide specific information to the capacity and capabilities of the units. Table 4 is a
breakdown on these specifications to illustrate comparison of function and power of each unit.
These units were found to be standard dust collection devices in wood products manufacturing.
Table 4
Dust Collector Specifications
Manufacturer
Model Type
Grizzly Model
G1029 Single
Canister
Grizzly Model
G9958 Dual
Canisters
Jet Model
DC1100A
Single Canisters
Bag Size 5 cu. ft. 26 cu ft. 5.3 cu ft.
Air Suction 1600 CFM 3560 CFM 1100 CFM
Static Pressure 11‖ 16.8‖ 11―
(Inches of Water)
Horsepower 2 H.P. 4 H.P. 5..5 H.P.
Voltage 220V 220V 230V
Amps 12 29 11
R.P.M.
(revolutions per
minute)
3450 3450 Unavailable
Adapted from ―Machine Data Sheet,‖ Grizzly Industrial Inc., 2010, 1-2; ―Jet Operating
Instructions and Parts Manual.‖ Walter Meier Manufacturing Inc., 2010.
In a study by Brosseau (2001), it established that, ―The effect of ventilation was positive
(rather than the expected negative effect) for stationary sanding and sawing,‖ (p. 325). The
importance of amps and static pressure should be highlighted, and according to Nagyszalanczy,
(1996), ―The higher the number equals a stronger suction and performance,‖ (p. 81).

25
Available Dust Collection Equipment
There are many different options for collecting wood particles in a wood shop or wood
products manufacturing facility; with a combination of the several methods probably being a
practical alternative, costs and design are important. The types of dust control depend on the size
and scope of the problem that a business faces. Nagyszalanczy (1996) also asserts that an
effective dust collection system is a strategy involving combinations of primary and secondary
collectors along with housekeeping equipment and standards, (p. 31). Along with an overview
of the advantages and disadvantages of dust control and collection methods, he illustrates in
Table 5 an inclusive and rational summary of options offered for a wood shop or wood products
manufacturer.
Table 5
A Summary of Dust Control and Collection Methods
Method Advantages Disadvantages
Personal respiratory
protection
Disposable Masks and respirators
are inexpensive and really
available; can provide good
respiratory protection in lieu of
primary dust collection.
Disposables that don‘t seal well to
face can compromise respiratory
health; reusable cartridge-style
respirators are uncomfortable to
wear for long periods; powered-air
respirators are expensive.
Shop Ventilation Easy, inexpensive way to exhaust
fine-dust-laden air from shop at
minimal cost.
Limited protection from fine dust;
most useful in temperate climates;
unfiltered fan can pollute local
environment.
Air-filtration
devices
Remove fine dust particles
effectively without exhausting
shop air; simple units can be
shop-built; unobtrusive; easy to
install in most shops.
Initially expensive to buy; some
units are noisy; filters need
occasional cleaning and
replacement. Doesn‘t totally replace
primary collection.
Shop Vacuums Compact, portable and relatively
inexpensive; good for primary
collection from portable power
tools.
Limited effectiveness in collection
from most stationary machines;
limited chip-holding capacity; most
units are noisy.
Portable collectors Less expensive and more versatile
than installing a central collection
Not strong enough to use with long
lengths of hose or ductwork; can be
26
system; can be used to collect
from most stationary machines.
expensive; can take up room on the
shop floor.
Central dust
collectors
Powerful; convenient way to
collect from most stationary
machines in the shop.
Expensive to buy; require additional
purchase and installation of
ductwork; need space inside or
outside shop for installation; some
units are noisy.
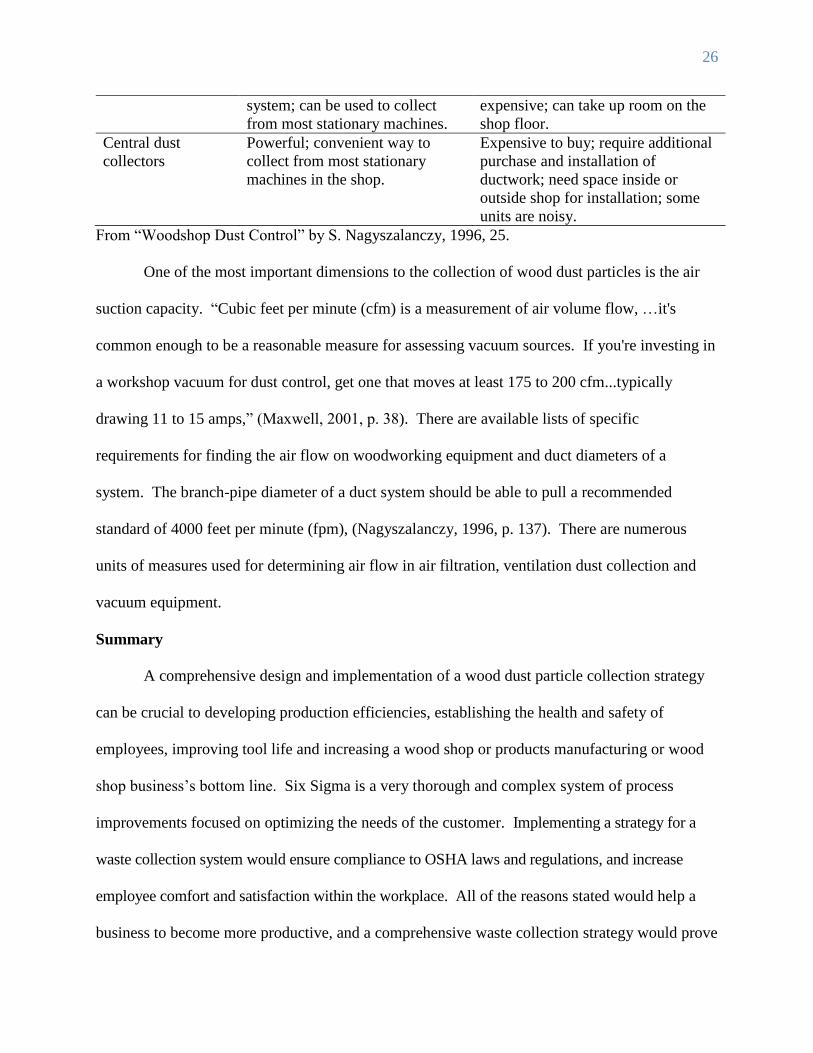
From ―Woodshop Dust Control‖ by S. Nagyszalanczy, 1996, 25.
One of the most important dimensions to the collection of wood dust particles is the air
suction capacity. ―Cubic feet per minute (cfm) is a measurement of air volume flow, …it's
common enough to be a reasonable measure for assessing vacuum sources. If you're investing in
a workshop vacuum for dust control, get one that moves at least 175 to 200 cfm...typically
drawing 11 to 15 amps,‖ (Maxwell, 2001, p. 38). There are available lists of specific
requirements for finding the air flow on woodworking equipment and duct diameters of a
system. The branch-pipe diameter of a duct system should be able to pull a recommended
standard of 4000 feet per minute (fpm), (Nagyszalanczy, 1996, p. 137). There are numerous
units of measures used for determining air flow in air filtration, ventilation dust collection and
vacuum equipment.
Summary
A comprehensive design and implementation of a wood dust particle collection strategy
can be crucial to developing production efficiencies, establishing the health and safety of
employees, improving tool life and increasing a wood shop or products manufacturing or wood
shop business‘s bottom line. Six Sigma is a very thorough and complex system of process
improvements focused on optimizing the needs of the customer. Implementing a strategy for a
waste collection system would ensure compliance to OSHA laws and regulations, and increase
employee comfort and satisfaction within the workplace. All of the reasons stated would help a
business to become more productive, and a comprehensive waste collection strategy would prove

27
to be cost effective in sustaining long-term profitability.

28
Chapter III: Methodology
This study focused on the problem of wood dust particles, the affects on health of the
employees, and the costs to the efficiencies to production. The areas examined were the amount
of time that it takes for the cleanup, the levels of airborne particles, and the cost-benefit analysis
of implementing a central wood dust and wood chip collection system. With the existing
assortment of wood dust collection devices at individual work stations, data was gathered on the
different devices such as types, brands and specifications. The effectiveness on the existing
equipment is the center of the problem; wood dust and wood chip particles are not being collected at
an efficient rate of satisfaction. The inconsistency and variability of the collection devices are
problematic for operators, employees and management. Airborne dust particles settle on finished
products, work-in-process products, raw materials and on all vertical and horizontal surfaces. The
main challenge is to implement a comprehensive strategy that involves a dust and wood chip
collection system that would eliminate or greatly reduce the airborne particles. An improvement to
the existing waste collection system would provide increased efficiencies to the production process,
a cleaner air environment for the employees and a reduction in fire hazards, slips and falls. Using
the DMAIC process as a dynamic methodology, the phases follow the Six Sigma guidelines for
problem solving.
Define Phase
Within the ―Define‖ phase of the DMAIC process, there are several tools that can be used
to help define the problem and objective. The problem has already been addressed, so this
project will use a Define Checklist and activities within the Critical to Quality (CTQ) facets of
the problem. A checklist helps the process to record the overall aspects of the project; the
addition of CTQ helps to determine the importance of the overall goal. ―By identifying CTQ
29
characteristics, the project team determines what is important to each customer from the
customer‘s point of view. Identification of CTQ characteristics ascertains how these particular
features appear when meeting customer expectations,‖ (Stamatis, 2004, p. 32). The customer
expectations in this context are the goals and objectives of the project. Table 6 explains required
outputs, comments that pertain to this project, CTQs and the required actions taken to fulfill the
required outputs.
Table 6
Define Checklist for Sawdust City
Required Outputs Comments Critical To
Quality
Required Action
Project Charter: Is it
complete and
approved?
Approved and supported
by management and
employees.
Critical to the
process.
Approved.
Problem Statement:
Is the problem and
objective clearly
defined?
PS and Objective clearly
defined.
Critical to the
process.
See Chapter 2.
Completed.
Process Map: Are
the areas of
production and
processes
identified?
Process Map, equipment,
and areas created and
identified.
Critical to the
process and
needed for the
larger view of
the project.
See Appendix A.
Completed.
Timeframe: What
will be a projected
timeframe of this
project?
Goal of project
completion is March 1,
2011.
Information
needed for the
process and
overall planning.
Specifics to be
determined, but
on schedule.
Resources: What
types of resources
are the crucial
aspects to the
project?
Complete support from
management and
employees. Open access
to facilities. Will use all
time/energy and literary
resources available.
Critical to the
process.
Open lines of
communication;
Contact with
OSHA
Representative.
Cost-benefit: What
priorities need to be
examined in the
process?
Existing tools and
equipment, possible dust
collection systems, and
different phases of the
production process.
Critical to the
objective and
cost aspects of
the project.
See Cost-Benefit
Table 8.
Risk: What are the Risks would include Critical to the Open lines of

30
key risks and
challenges
identified?
objections to changes in
process or equipment.
Challenges are gathering
proper information,
capital outlay for
equipment and process
changes.
success of the
company, the
employees and
the customer.
communication
between all the
stakeholders.
Stakeholders: Have
the key
stakeholders been
identified?
The key stakeholders in
this project are the
owners/management,
employees and their
customers.
Critical to the
success of the
project.
Open lines of
communication
between all the
stakeholders.
Adapted from ―Smart Things to Know About Six Sigma‖ by A. Berger, 2003, 65-66.
With a good foundation of the ―Define‖ phase established, the next tool will be a
mapping of the process and the production floor. ―Mapping the process in this stage of the
define phase of the Six Sigma methodology is nothing more than a high level visual
representation of the current process steps leading up to the fulfillment of the identified CTQ
characteristics,‖ (Stamatis, 2004, p. 32). Appendix A shows a function-to-function plan of the
original (as is) production process. It also identifies an overview of the production flow, the
wood working equipment, and the wood dust collection equipment. It also shows the links
between the other equipment used on the production floor.
The ―Define‖ phase is a very important piece to the start to this DMAIC process. The
time frame and goals of this project will be completed by March 1, 2011. The key stakeholders
in this project are the owners/management, employees, and their customers; all of the
stakeholders will benefit from an improvement in a comprehensive wood dust and wood chip
collection strategy.
Measure Phase
In the ―Measure‖ phase, the study used tools in the Six Sigma methodology to collect and
process the data. The types of variation defined in this phase will be in classified as common

31
and special causes. Common causes are ―conditions in a process that generate variation through
the interaction of the 5M‘s (machine, material, method, measurement, manpower) and 1E
(environment),‖ (Stamitis, 2004, p. 35). Special causes may be unidentifiable until the data is
collected, and according to Stamitis, could generate unexpected variability within the process.
The three areas of common cause variation monitored were the machinery characteristics and
specifications, method comparisons and manpower wages, and measurements in particle
collections as it correlates to the 1E-Environmental OSHA regulations. Along with the 5Ms,
special causes are unexpected variations and were scrutinized throughout the Measure phase of
this project.
Adapted from ―Smart Things to Know About Six Sigma‖ by A. Berger, 2003, 215.
Figure 1. Fishbone Using the 5M’s.
Natural wood pine was the only product producing wood dust and wood chip particle
waste; there is no variation in materials found in this study. The data gathered on the collection
devices and wood working equipment was exclusively used on natural wood pine dust and chip
particles. While a part-time wage structure is possible during seasonal times of the production
schedule, the manpower variations were solely based on a full-time hourly wage structure. The
1E-Environmental OSHA regulations were steadfast and were used as a baseline comparison for
the health and safety of employees. The measured improvements in particles will yield a rise in
quality of the product that is immeasurable to the customer.
Machinery
Wood Working Equip..
Dust Collection Devices
Methods
Continual Cleaning
Planned Cleaning
Materials
Natural Wood Pine
Other
Measurements
Particle Collection
Cost/Benefit Analysis
Manpower
Part-time Wages
Full-time Wages
1E-EnvironmentalOSHA Regulations
Customer Demands
32
Instrumentation
The cleaning versus efficiencies measurements used methods derived from a General
Estimating Equation to clearly obtain a selected average of data. The two main cleaning
categories, called Continual and Planned were divided into six subcategories: Dusting Raw
Materials (RM), Wiping Work-In-Progress (WIP), Cleaning Finished Products (FP), Scheduled-
Daily, Scheduled-Weekly, and Scheduled-Monthly. The variables involved dealt with average
times taken on each task and the average number of workers on that particular task. The constant
variables were wages of employees and daily output of product.
The air quality measurements were taken from OSHA air quality analysis and
instrumentation readings using a testing device called DustTrak DRX (TSI Incorporated,
Shoreview, MN). The variables involved the size of the particles, areas of the production floor,
and the calibration of the testing unit.
Data Collection Procedures
The two areas of measured data collection, cleaning versus efficiencies and air quality,
were significant in a formative wood dust and wood chip collection strategy. The first area
addressed the subject of cleaning, production time and efficiencies. The measurements assessed:
how much time was involved in cleaning; both continual and planned; what are the costs
involved; and how much production time could be utilized with the time involved?
The data collection procedures for the two cleaning categories sought information on
frequency of cleaning, relationship of cleaning to loss of production, and variables within the
entire production process.
The second category dealt with the topic of air quality and the wood dust particles. Using
an established baseline from OSHA regulations, the particle amounts were compared from a

33
recent air quality test by an OSHA representative. The measurements assessed: what is the
existing tested air quality; how do the levels compare to the OSHA regulations; what areas of the
manufacturing facility show the highest levels; and how do they compare. The data collection
procedures for the air quality sought information on exposure limits, and comparisons within the
entire production process.
Analysis Phase
In the ―Analysis‖ phase, the data identified and collected in the two areas of the study:
cleaning versus efficiencies and air quality. This part of the study looked at finding
improvement opportunities in the production process and the working environment. Along with
sources of variation, the ―Analysis‖ phase examined and focused on priorities that best represent
the problems of the study.
Cleaning Versus Efficiencies
In order to draw a clear distinction, the General Estimation Equation approach was used
to measure various costs and loss of production time. Within the continual cleaning, the
different areas associated with production included: physically dusting off the raw materials,
wiping off the work-in-process goods and cleaning the finished products. The continual cleaning
increases the total amount of manufacturing time and could be considered wasted production
time.
Planned or scheduled cleaning occurs regularly and involves the physical efforts by the
employees sweeping floors, dusting and moving equipment, and collecting wood dust and wood
chip particles. Typically, the tasks occur at the end of the work shift with a more extensive
cleaning performed at weekly or monthly intervals depending on time availability and amounts
of waste.
34
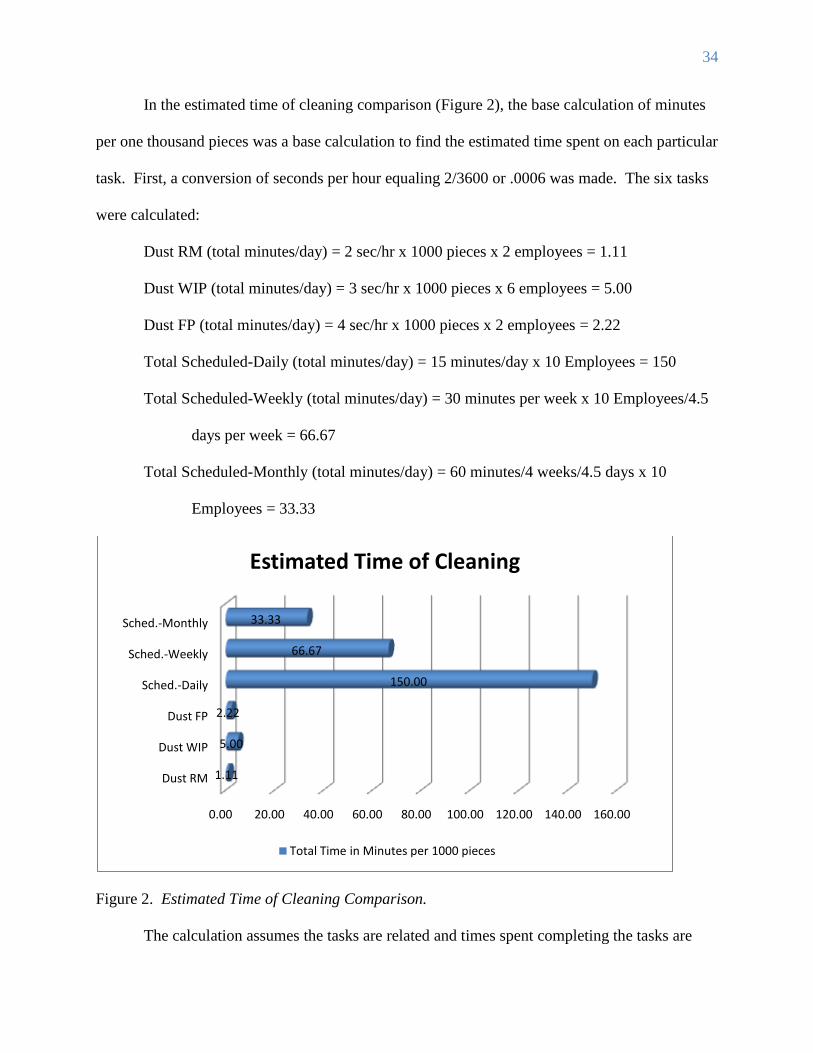
In the estimated time of cleaning comparison (Figure 2), the base calculation of minutes
per one thousand pieces was a base calculation to find the estimated time spent on each particular
task. First, a conversion of seconds per hour equaling 2/3600 or .0006 was made. The six tasks
were calculated:
Dust RM (total minutes/day) = 2 sec/hr x 1000 pieces x 2 employees = 1.11
Dust WIP (total minutes/day) = 3 sec/hr x 1000 pieces x 6 employees = 5.00
Dust FP (total minutes/day) = 4 sec/hr x 1000 pieces x 2 employees = 2.22
Total Scheduled-Daily (total minutes/day) = 15 minutes/day x 10 Employees = 150
Total Scheduled-Weekly (total minutes/day) = 30 minutes per week x 10 Employees/4.5
days per week = 66.67
Total Scheduled-Monthly (total minutes/day) = 60 minutes/4 weeks/4.5 days x 10
Employees = 33.33
Figure 2. Estimated Time of Cleaning Comparison.
The calculation assumes the tasks are related and times spent completing the tasks are
0.00 20.00 40.00 60.00 80.00 100.00 120.00 140.00 160.00
Dust RM
Dust WIP
Dust FP
Sched.-Daily
Sched.-Weekly
Sched.-Monthly
1.11
5.00
2.22
150.00
66.67
33.33
Estimated Time of Cleaning
Total Time in Minutes per 1000 pieces
35
consistent throughout the manufacturing process. With a total of ten production floor employees
working 4-10 hour days and one-half day, the weekly work schedule calculated was 4.5 days.
An estimated one and a half hours of the work day was figured for non-production time, lunches
and breaks. The production output averages approximately one thousand pieces per day.
The calculated areas of dusting raw materials and cleaning the finished product took less
time because in reality, the handling is limited to two employees in each method. The work-in-
process cleaning was only assigned to the tasks of the remaining six employees; while the
scheduled-daily, weekly and monthly cleaning tasks are shared by mostly all the manufacturing
floor employees.
The time taken for scheduled-daily cleaning is considerably greater because the tasks
involved all the employees and occurred more frequently in minutes per one thousand pieces of
production output. While the estimated time per task may vary because of the individual
worker‘s pace, the overall ratio of time spent illustrates the general sum of production loss is
somewhat astonishing.
Air Quality
Using an OSHA on-site evaluation, data analysis information was collected in the four
process areas of the manufacturing floor and identified: cutting/shaping, trimming/shaping,
sanding/trimming and shaping. See Appendix A: Original Layout Map of Sawdust City. High
Level-Mapping the Process ―As Is‖. With an OSHA Exposure Level of 8 hrs Time Weighted
Average (TWA) and a Personal Exposure Limit (PEL) 5 mg/m3, identification of potential
hazards and exposures were sampled and reviewed. Other air contaminants were tested but for
the focus of this study, wood dust particles were considered the tested contaminant particles.
The evaluation was conducted by sampling in the workplace, reviewing records, and talking with

36
employees and managers. The results were found and correspond from the following areas:
Cutting/shaping- Exposure Level 2.5-6.0, PEL 5mg/m3 (TLV = 1mg/m3).
Trimming/shaping- Exposure Level 2.5-7.0 mg/m3, PEL 5mg/m3 (TLV = 1mg/m3).
Sanding/Trimming- Exposure Level 2.5-7.0 mg/m3, PEL 5mg/m3 (TLV = 1mg/m3).
Shaping-Exposure Level 2.5-7.0 mg/m3, PEL 5mg/m3 (TLV = 1mg/m3).
The tested areas of the manufacturing floor had similar air particle results and were
acknowledged to have smaller particle and heavier distribution concentrated around different
equipment in the manufacturing shop. The respirable wood dust continues to present a health
hazard to employees. The equipment that produce the most fine wood dust particles are
categorized as shaping, sanding and finishing.
Figure 3. CFM Ratings on Existing Equipment. Adapted from ―Woodshop Dust Control‖ by S.
Nagyszalanczy, 1996, 136-137).
The vital factors found in the categories of cleaning versus efficiencies and air quality
could be linked to the types of equipment used in production. The existing wood working
equipment in Figure 3 indicates the amount of air volume requirement measured in cubic feet per
minute. It also indicates and relates to the amount of wood dust and wood chip particles
0
100
200
300
400
500
600
700
800
900
CFM
Wood Working Equipment
CFM Ratings
Grizzly Sander
Table Saw
Band Saw
Grizzly Shaper
Grizzly Planner
Drill Press
DeWalt Chop Saw

37
produced. The Grizzly sander and the Grizzly planner have the greatest demands for the amount
of air volume in a dust collection device with the Grizzly shaper also requiring significant
volume.
Improve Phase
The fourth phase, ―Improve‖ is used for further analysis and clarification of the
alternative improvements to be made throughout the project. Also, this part of the process, an
improvement criteria and brainstorming of possibilities are examined to determine pilot projects
and a transition to the ―Control‖ phase.
Cost of Cleaning
The time spent cleaning and dusting the manufacturing floor, equipment, raw materials,
work-in process, and finished products is a collective production loss, and therefore a cost to
production. In calculating costs of cleaning, the time spent was a ratio of minutes per one
thousand pieces of product produced and was the average amount yielded per day. An average
wage cost of $10 per hour gives a cost basis for each of the different cleaning tasks in Table 7. In
order to find the costs of cleaning, the time spent cleaning equations were multiplied by the
average wage of $10 per hour.
Table 7.
Cost of Cleaning.
Dust RM Dust WIP Dust FP Scheduled-
Daily
Scheduled-
Weekly
Scheduled-
Monthly
(2/3600)
hour x1000
pieces. x 2
Employees x
$10/hour =
$11.11 per
day
(3/3600)
hour x1000
pieces. x 6
Employees x
$10/hour =
$50.00 per
day
(4/3600)
hour x1000
pieces. x 2
Employees x
$10/hour =
$22.22 per
day
(1/4) hour x
10
Employees x
$10/hour =
$25 per day
(1/2) hour x 10
Employees x
$10/hour /4.5
days/week =
$11.11 per day
1 hour x 10
Employees x
$10/hour/4.5
days per week/4
weeks = $5.56
per day

38
The estimated total cost of cleaning and dusting at Sawdust City adds up to $125 per day
or $562.50 per week of operations. In a wage to cleaning expense weekly ratio, this equates to
approximately an expenditure of 13%. The actual employee wage amount could be substituted
or modified with an actual hourly and daily labor cost amount figured in the equation. Other
numbers in the equation could also be adjusted in areas of production.
In computing the implementation and savings of the various equipment options, not all
the benefits are easily included and can be somewhat intangible in value such as, tool life,
employee comfort, reduction in fire and combustion, and fewer slips and falls.
Table 8.
Cost/Benefit Analysis of Wood Dust Collection Systems.
Units Details Expenditures ($) Remarks
Shop ventilation Limited, weather
permitting
<$300 Good supplemental
unit
Air-filtration devices Air cleaner $300-500 Circulates & cleans
air
Shop vacuums Flexible, portable $100-500 Versatile for tasks
Portable collectors Existing on site $200-2000 Somewhat efficient
Central dust
collectors
Investment cost >$5000 Lower Operating
Costs
The interesting things found in the cost/benefit analysis were the variety of brands,
models and added features available. The competition of features and sale prices are a good
situation for a buyer in this product market. The costs of the units were also surprising as
compared to the benefits and savings of cleaning costs and air quality enhancement features.
The one year warranties on most of the products were the most common with additional
guarantees on motor parts.
The challenges in a comparative cost/benefit analysis come from testing the benefits of
each of the individual units. A listing of the specifications and general information such as air

39
suction, static pressure, amperage, etc. can give a good contrast between makes and models.
However, that comparison does not illustrate the equipment‘s performance on the production
floor. The final measurements of air quality and costs can be estimated and compared, but an
equipment trial run needs to be executed to gather the final data.
Control Phase
The ―Control‖ phase utilizes the data monitored from the improvements and changes that
were implemented in the project. Because this project is a predecessor to the actual completion,
this phase will focus on process improvements and the physical layout of the existing
manufacturing shop. A layout inspection of the process flow and manufacturing areas was taken
with measurements and design analysis labeled: Appendix A-―As Is‖. With a good production
flow occurring throughout the production floor, areas previously tested for air quality are
adjacent to one another, separated mainly by metal storage racking, bundles of cardboard and
other smaller shelving. The shaping area is physically separated from the rest of the production
areas, but holds mobile storage racks of finished or drying products. The paint area becomes a
vital part of the manufacturing process and is located near several wood dust and particle
producers. The established production process limits the amount of changes within the existing
building; however, there are physical movements that are discussed in Chapter 5 that can yield
improvements to costs and air quality.
Summary
This chapter examined the existing wood dust and wood chip collection equipment, the
tools and equipment used in the wood production, the devices used to measure the dust particles,
and other available wood dust and wood chip collection equipment that are designed to meet
OSHA standards and regulations. Employee health and air quality issues were analyzed and

40
remain deep-rooted issues. The relationship of the costs involved in terms of dollars, and the
hidden lost profits due to wasted production time are significant. The cost/benefit analysis and
comparison of the wood dust collection systems establish a performance metrics, and can be
used for future evaluations and strategy modifications.

41
Chapter IV: Results
A comprehensive wood dust and wood particle strategy is possible in determining
solutions for Sawdust City‘s waste collection problems. Using the DMAIC methodology for a
problem-solving model, the purpose of the study was determining results based on the wide-
ranging data about the scope of wood dust and wood chip particles produced, the amounts of
cleanup time, the levels of airborne particles, and a cost-benefit analysis of implementing
different options in air particle removal systems. The goal of this project was to develop the
comprehensive strategy of wood dust removal, to provide specific information and statistical
data, and to create practical solutions surrounding the problems that faced Sawdust City‘s
production facility and management. This study examined air quality data from established studies
and compared the particles tested to the amount of airborne particles as dictated by OSHA
regulation code case number 9004-34-6 as a baseline reference.
Results: Cleaning versus Efficiencies
In the assessment of cleaning versus efficiencies, the data revealed considerable time and
loss of production due to the several different cleaning tasks. The General Estimation Equation
calculations illustrated significant dedication of employee‘s time for the scheduled-daily cleaning
and the dust-WIP. When converted to a monetary cost, the expense of cleaning and dusting at
Sawdust City adds up to $125 per day or $562.50 per week of operations. The wage-to-cleaning
expense ratio for the week is approximately 13%. In terms of production costs, this is significant
because there is virtually no value added to products from a consumer‘s perspective. While this
ratio will never equal zero, in almost all manufacturing businesses there will always be this
recurring and fixed expense; however, long-term investments in capital structure and
modifications in process improvements can be implemented to reduce that percentage.

42
Results: Air Quality
The topic of air quality was an important issue for this study, and any reductions in wood
dust particles would make a significant difference in the health of the employees. The tests
performed by an OSHA representative became a wakeup call for the air quality standards that
needed to be met or exceeded within Sawdust City‘s manufacturing plant. The results uncovered
the tested data to be at or above the PEL of 5mg/m3 in all the areas around the production floor.
The OSHA standard is below 5mg/m3. The variations in exposure levels were lower, but the
range should bring about considerable concern on the part of management and employees. The
respirable wood dust continues to be monitored and presents the greatest health hazard to
employees; shaping, sanding and finishing are the processes that continue to produce the most
fine wood dust particles.
The findings also obtained the information on wood working equipment and the CFM
specifications for proper wood dust and wood particle removal. With the most potential gains in
upgrading the dust collection around the Grizzly planners and Grizzly sanders, the study found
the additions of air filtration systems or a central collection system could yield tangible results.
Item Analysis
The study showed considerable costs due to the cleaning tasks. The six different tasks
occurred within the multiple areas of the manufacturing process and different times throughout
the production schedule. The cumulative amount of time taken in cleaning reduces the amount
of output yielded in finished product, thus reducing the annual profits. This eventually has
influence on wages, other expenses, capital investment, product prices, and ultimately long-term
growth.
In terms of air quality, affects are much more difficult to analyze. An OSHA

43
representative will eventually return for a random test, and the results could reveal better, worse
or the same numbers. Depending on the production schedule, the cleaning tasks performed and
the ventilation, the tests could vary considerably. The air quality issue remains a constant long-
lasting health concern for the employees.
Limitations of Data
With the cleaning issue, the data had some limitations to the General Estimation Equation
calculation methods, and to the actual daily amounts of final products. The actual employee
wage amount could be modified along with the daily labor cost and changes in production. The
variations in data could also be due to specific time deviations within a cleaning schedule.
Some of the air quality limitations were very subjective in relation to the effects on
employee‘s health. Issues like missed work due to wood dust, increased health care costs, and
overall workplace comforts are very biased or difficult to quantify.
Summary
This study gathered pertinent information in determining an enormous necessity for a
comprehensive waste collection system for the wood dust and wood chip particles. Costs were
calculated to reveal extensive challenges, and options were considered to make equipment
modifications and capital investments. This study also gathered and analyzed research from
health and industry experts that contributed to increasing an overall understanding of the wood
dust and wood chip particle issues. The DMAIC methodology proved to be a thorough and
wide-ranging process, and with a structured development of the problem, the issues were
examined in a complete way that can help the management and employees of Sawdust City.

44
Chapter V: Discussion
The current wood dust and wood chip collection devices are a patchwork of individual
units that provide minimum dust control. The lack of a long-term control strategy leaves daily
problems for the equipment, employees and products at Sawdust City. The challenges that face
Sawdust City in the areas of a healthier work environment for its employees and improvements
in efficiencies are needed to maintain growth. By taking the efforts now in developing and
planning a comprehensive wood dust and wood chip collection strategy, and implementing the
long-term solutions, the many substantial results will position Sawdust City with a competitive
edge. The two areas of focus in this study, cleaning versus efficiencies and air quality are
complimentary and related issues that can be improved upon in one comprehensive wood dust
control strategy. Significant outcomes can occur by correlating the two areas of concern into one
action plan with tangible results. The underlying principle improvements in this project involved
reductions in the amount of time spent cleaning wood dust and wood chip particles, and improve
the air quality in the workplace.
Recommendations
The recommendations within this study are meant to inform and support a comprehensive
wood dust and wood particle control strategy by means of analysis and comparison to the
existing waste control system. Within the two recommendations, the wood dust and wood chip
waste collection devices are designed as an ―As Is‖ system. That is, the existing units were
matched directly to wood working equipment, based on priority criteria of CFM requirements for
optimum collection and existing steps in the production process. It is very important to note that
an implementation of a central waste collection system would be better adapted to either of the
recommended changes rather than to the existing ―As Is‖ system setup. The main reason is the

45
recommended changes would be in adjacent proximate to a central unit setup yielding increased
air suction and better performance. Further planning and analysis would be needed to determine
the specifics of a central collection unit and attachments.
Discussion on “As Is”
Appendix A illustrates the high level ―As Is‖ representation of the existing production
process and workflow direction. The relationships of the wood working equipment and the dust
collection devices are also shown with connections. The existing process was developed over
time and given some noted improvements such as good continuity and efficient product flow.
While this process has historically yielded a strong production output, there are several
observations to be made.
First, the shipping, drying and finish product areas are surrounded by high-level
producers of wood dust and wood chip particles. With storage racks separating the three sides of
the areas, there is a short distance between them and for the dust particles to travel. Another
observation is the paint area; the adjoining area is located next to several high-output wood dust
producers like the sander, table saw and a drill press. There is no physical separation between
the two neighboring areas. The last observation is the small room that is used for shaping and
several other functions. This room is located by screen painting and finish product storage
rooms. With several types of equipment that produce wood dust and wood chip particles,
concentrations of materials and excess dust seems difficult to control.
Discussion on Recommendation #1
In Appendix B-Recommendation #1 includes a process flow that is similar to the existing
process. The storage racks are moved to a more vertical position and act as a type of divider to
the finished product and storage areas. The storage racks would line up with the buildings

46
support beam and divide the room into a third. Note that hanging plastic sheeting from the
ceiling support beam on the wood working side of the storage racking is a viable, but added
expensive option for an improved wood dust barrier. Also, the role within the small shaping
room would be reduced and combine with the other processes in the large production area. This
would produce less wood dust and wood particles, and increase efficiencies.
This recommendation would need to be harmoniously included with additional dust
collection improvements. The real savings to the bottom-line would have to be figured in with
the choices of dust collection devices. The concentrated arrangement of wood working
equipment helps the central dust collection implementation the most. While the cost savings of
cleaning within this recommendation is difficult to calculate, an estimation of 15-25% of the
daily cleaning costs could be saved. With a daily cleaning expense of $125 per day as calculated
in this study, the savings could be between $18 and $31 per day, or $375 to $625 per month of
average operation.
The overall changes for this recommendation would give the production a more
concentrated area to move raw materials and work in process product; therefore increasing
efficiencies, cleaning times and reducing unnecessary employee movement. The real advantages
come from a distinct separation of the areas containing finished products, storage and the paint
areas. The main challenge would be the arrangement of the large production area and
establishing a safe distance for operation of the wood working equipment. One disadvantage
might be the shipping of finished product because of the distance from storage to the shipping
area. There are many advantages to this recommendation, and it could lay the ground work for
an additional central collection unit design plan. The containment of wood dust and wood chip
particles require less duct work with a centralized system as the main woodworking equipment
47
becomes in close proximity.
Discussion on Recommendation #2
The second recommendation, Appendix C-Recommendation #2 illustrates several
changes and rearrangements of the woodworking equipment. The greatest alteration would be a
complete separation of the paint area to the previously small shaping room. This would provide
an essentially wood dust free room for painting, drying and finish product storage; an addition
ventilation unit for paint fumes could be factored into future plans. This design would also
increase the production area, while still keeping the efficiencies within the process developed in
Recommendation #1. The areas of shipping and finish products would be closer in function and
more practically spaced. Within this design there is less of a challenge in establishing a safe
distance of operation of the wood working equipment. As for an addition of a central collection
unit, this recommendation adds a moderate amount of distance and spacing to the wood working
equipment, which increases the duct work depending on the location of the central collection
unit.
Similar to Recommendation #1, this model would need to be implemented with
additional dust collection improvements, and possibly a supplementary paint exhaust system.
The true costs for this recommendation lay in the choices of dust collection devices. The
arrangement of wood working equipment is more spread out and separated. Because of the need
for additional improvements, the cost savings of cleaning and payback become more difficult to
calculate, an estimation of 25-35% of the daily cleaning costs could be saved. With a daily
cleaning expense of $125 per day as calculated in this study, the savings could be between $31
and $43 per day, or $625 to $875 per month of average operation. Proper planning and
implementation of this recommendation would strongly assist in an effective dust control

48
strategy that would yield flexibility in the production process and contribute to long-term growth
for the business.
Within both of the recommendations lies one disadvantage: change. Changing the
structure of an established production process and manufacturing floor plan can be an enormous
task. Finding the time and manpower in a structured and tight production schedule is difficult.
However, the costs of doing nothing or staying the course could be worst. Change involves
leadership; and ―management is doing things right; leadership is doing the right things,‖ (Peter
Drucker quoted from Berger, 2003, 149).
Conclusions and Implications
This study found that wood working manufactures have unique challenges when it comes
to collecting wood dust and wood chip particles; the strategies for control are uniform across the
industry. In terms of efficiencies and long-term employee health, meeting or exceeding the
standards of air quality will ultimately reduce costs, increase profits, and create a healthier
workplace. From the customer‘s perspective, the air quality issues examined have little impact,
unless quality of the finished product is taken into consideration. The research showed tangible
data that lead to the recommendations and other additional advice.
One of the secondary accomplishments of this project was to educate and present
beneficial information to the owners/management of Sawdust City. The challenges and priorities
of this problem can be dealt with proper planning, discussion and implementation. Capital
investment and changes to the existing wood dust and wood chip collection system can be
executed with monetary justifications.
Further Research Recommendations
The recommended changes in the production flow and operational adjustments could lead

49
to further planning and research. After any changes are implemented, future air particle testing
could be done for a contrast assessment. Additional planning and research could be done in the
areas of air ventilation units and air exchange devices. A separate paint and stain vapor removal
system should also be considered. The findings show that any partial or complete changes based
on the recommendations will yield improvements in productivity and air quality.
50
References
Alwis, U., Mandryk, J., & Hocking, A., (1999). Dust Exposures in the Wood Processing
Industry. American Industrial Hygiene Association Journal, 60(5). 641-646.
Berger. A. (2003). Smart Things to Know About Six Sigma. Oxford, United Kingdom: Capstone
Publishing.
Bodger, K. (2003). Fundamentals of Environmental Sampling. Rockville, MD: Government
Institutes.
Boss, M. (2001). Air Sampling and Industrial Hygiene Engineering. Boca Rotan, FL: CRC Press.
Brosseau, L.M., Parker, D., Lazovich, D., Dugan, S., Milton, T., & Pan, W. (2001). Inhalable
Dust Exposures, Tasks, and Use of Ventilation in Small Woodworking Shops: A Pilot
Study. American Industrial Hygiene Association Journal, 62(3), 322-329.
Bureau of Labor Statistics. (2003) A note on the hours-worked to hours-paid ratios from the
employment cost index into hours at work measures. U.S. Department of Labor.
Retrieved October 23, 2010 from http://www.bls.gov/lpc/lprhws/lprhwhp.pdf
Bureau of Labor Statistics. (2009). Illnesses by category of illness-rates and counts. (Table:
SNR07). U.S. Department of Labor. Retrieved October 23, 2010 from
http://www.bls.gov/iif/oshwc/osh/os/ostb2429.txt
Center of Disease Control. (2009) Control of wood dust from horizontal belt sanders. (DHHS
Publication No. 96-121). Retrieved October 25, 2010 from
http://www.cdc.gov/niosh/hc4.html
George, M., Rowlands, D., Price, M., & Maxey, J. (2005). Lean Six Sigma Pocket Toolbook.
New York, New York: McGraw-Hill Press.

51
Grizzly Industrial Inc. (2010) Machine data sheet. Retrieved January 5, 2011 from
http://cdn1.grizzly.com/specsheets/g1029z_ds.pdf
Iwanski, J. (1999). The keys to effective dust collection. Wood & Wood Products. 104(7),
Retrieved October 23, 2010 from
http://ezproxy.lib.uwstout.edu:2048/login?url==http://search.ebscohost.com/login.aspx?d
irect=true&db=f5h&AN=2015465&site=ehost-live
Keith, L. H., editor. (1996). Principles of Environmental Sampling, 2nd
Edition. Washington DC:
American Chemical Society.
Maxwell, Steven. (2001). Dust alert: solutions for controlling dust in your shop. Canadian Home
Workshop, 24(3), 37-41.
Meo, S. (2004). Effects of duration of exposure to wood dust on peak expiratory flow rate among
workers in small scale wood industries. International Journal of Occupational Medicine
and Environmental Health, 17(4), 451-455.
Milanowski J., Gora A., Skorska C., Krysinska-Traczyk E., Mackiewicz B., Sitkowska J.,
...Dutkiewicz, J. (2002). Work-related symptoms among furniture factory workers in
Lublin region (eastern Poland). Ann Agric Environ Med, 9(1), 99–103.
Nagyszalanczy,S. (1996). Woodshop Dust Control. Newton, CT: Tauton Press.
U.S. Department of Labor. (1998) Sanitation: General Environmental Controls. (OSHA
Publication No. 9790). 1910.141(a)(3)(i). Retrieved October 23, 2010 from
http://www.osha.gov/pls/oshaweb/owadisp.show_document?p_table=STANDARDS&p_
id=9790

52
U.S. Department of Labor. (2008). Wood dust: Health recognition. (OSHA Publication: Safety
and Health Topics). Table: Occupational Exposure Levels. Retrieved October 23, 2010
from http://www.osha.gov/SLTC/wooddust/index.html
U.S. Department of Labor. (2009). Limits for air contaminants. (OSHA Publication No. 9992),
Table Z-1. Retrieved October 23, 2010 from
http://www.osha.gov/pls/oshaweb/owadisp.show_document?p_table=STANDARDS&p_
id=9992
U.S. Department of Labor. (2009) Sawmills: Special Industries. (OSHA Publication No. 9861).
1910.265(c)(3)(iv). Retrieved October 23, 2010 from
http://www.osha.gov/pls/oshaweb/owadisp.show_document?p_table=STANDARDS&p_
id=9861
Scott, J. (2010). Explosive: combustible dust issue. Wood & Wood Products. February Issue, 31-
33.
Stamatis, D.H. (2004). Six Sigma Fundamentals. A Complete Guide to the System, Methods and
Tools. New York, NY. Productivity Press.
Walter Meier Manufacturing. (2010). Jet Operating Instructions and Parts Manual. La Vergne,
TN: Author.
Welling, I., Lehtimaki, M., Rautio, S., Lahde, T., Enbom, S., Hynynen, P., & Hameri, K. (2009).
Wood dust particle and mass concentrations and filtration efficiency in sanding of wood
materials. Journal of Occupational and Environmental Hygiene, 6, 90-98.

53
Appendix A: Original Layout Map of Sawdust City.
High Level-Mapping the Process “As Is”
= Doorway
Loading Docks
Dust Collection Equipment Wood Working Equipment
Grizzly G1029Z-Single Bag De Walt Chop Saw
Grizzly G9958-Double Bag Grizzly Sander
Jet 1100cfm Table Saw
Band Saw
Storage Racking/Shelving Drill Press
Sign Racking Grizzly Shaper
Grizzly Planner
Receiving
Paint Area
Finished Product
Drying Area
Shipping
Cutting/Shaping
Area Storage
Racking
Sanding/Shaping Trimming/Shaping
Area Area
Storage Screen Paint
Office
Shaping
Area
Sign Storage
B.R.

54
Appendix B: Recommendation #1. Mapping of Process Flow
= Doorway
Loading Docks
Dust Collection Equipment Wood Working Equipment
Grizzly G1029Z-Single Bag De Walt Chop Saw
Grizzly G9958-Double Bag Grizzly Sander
Jet 1100cfm Table Saw
Band Saw
Storage Racking/Shelving Drill Press
Sign Racking Grizzly Shaper
Grizzly Planner
Paint Area Shipping Receiving
Drying Area
Sanding/Cutting/Shaping
Area
Storage
Racking Trimming/Shaping
Area
Storage Screen Paint
Shaping
Area
Sign Storage
B.R.
Office

55
Appendix C: Recommendation #2. Mapping of Process Flow
= Doorway
Loading Docks
Dust Collection Equipment Wood Working Equipment
Grizzly G1029Z-Single Bag De Walt Chop Saw
Grizzly G9958-Double Bag Grizzly Sander
Jet 1100cfm Table Saw
Band Saw
Storage Racking/Shelving Drill Press
Sign Racking Grizzly Shaper
Grizzly Planner
Shipping Receiving
Additional
Storage Area
Sanding/Cutting/Shaping
Area
Trimming/Shaping
Area
Storage Screen Paint
Paint/Drying
Area
Sign Storage
B.R.
Office
56
Appendix D: Internal Review Board (IRB) Approval
Date: November 24, 2010
To: Todd Kamenick
Cc: Jim Keyes
From: Sue Foxwell, Research Administrator and Human
Protections Administrator, UW-Stout Institutional
Review Board for the Protection of Human Subjects in Research (IRB)
Subject: Protection of Human Subjects
After review of your project, ―Sawdust City Waste Collection Field Problem,‖ I concur that
your protocol is not defined as research as defined by Federal regulations. Therefore,
your project does not need further review and approval of the Institutional Review Board
(IRB) for the Protection of Human Subjects.
Thank you for your cooperation with the IRB and best wishes with your project.
*NOTE: This is the only notice you will receive – no paper copy will be sent.
SF:mt