1 screening for moral hazard and adverse selection: evidence from the home equity market sumit...
TRANSCRIPT
1
Screening for Moral Hazard and Adverse Selection: Evidence from the Home Equity Market
Sumit Agarwal, Federal Reserve Bank of Chicago
Brent W. Ambrose, Penn State UniversitySouphala Chomsisengphet, OCCChunlin Liu, Univ. of Nevada-Reno
2
Theoretical Motivation Stiglitz and Weiss (1981)
Despite the use of interest rate or collateral to screen borrowers, lenders still
face imperfect information and are not able to entirely distinguish borrower
risks.
Overall expected loan profitability declines even when loan rate increases High-risk applicants will accept the higher interest rate while low-risk applicants will exit
the applicant pool.
Adverse selection problem credit rationing
Bester (1985) Menu of contracts containing combinations of interest rate & collateral
Borrowers contract selection reveals their risk level ex ante High-risk borrowers: select lower collateral requirement (higher rates)
Low-risk borrowers: select higher collateral requirement (lower rates)
Impact of adverse selection on credit rationing is then eliminated

3
Theoretical Motivation
Definitions: Adverse selection is an ex ante event that
occurs when potential borrowers respond to credit solicitations offered by banks. Riskier borrowers respond to credit offerings at higher
interest rates and/or lower collateral requirements Moral hazard usually refers to the incentives (or
lack thereof) for borrowers to expend effort to fulfill their contractual obligations.

4
Our Objectives
Research Questions Part 1:
Do borrowers self-select loan contracts designed to reveal information about their risk level (Bester, 1985)?
Conditional on the borrowers’ contract choice, does adverse selection still exist (Stiglitz and Weiss, 1981)?
Part 2: Do lender efforts to mitigate adverse selection and moral hazard
problems effectively reduce default risks ex post?
If so, by how much?
5
Home Equity Credit Market
Home equity represents a large (and growing) segment of the consumer credit market. Market Size (2005): $702 billion
Typical Home Equity Menu: Risk-based pricing according to loan-to-value
Less than 80% LTV 80% to 90% LTV Greater than 90% LTV
Thus, ideal setting for examining adverse selection and moral hazard.

6
Step 1: Primary Screening Consumer chooses a loan contract from a menu of options:
Type: Loan vs. Line LTV: 0-80 vs. 80-90 vs. 90-100 Lien: First vs. Second
Step 2: Credit Rationing
Lender rejects the loan contract application
Counteroffer 1: Moral Hazard Mitigation
Lender lowers LTV and/or changes loan type (loan to line).
Step 3:
Consumer rejects the
counteroffer
Step 4:
Lender issues credit to the accepted applications
Figure 1: HOME EQUITY CREDIT ORIGINATION PROCESS
Step 2: Secondary Screening
Lender screens for moral hazard and adverse selection and
makes a counteroffer
Step 2: Accepting
Lender accepts the loan contract application
Counteroffer 2: Adverse Selection Mitigation
Lender increases LTV and/or changes loan type (line to loan).
Step 3:
Consumer rejects the
counteroffer
Step 3:
Consumer accepts the counteroffer
Step 3:
Consumer accepts the counteroffer
7
Data Home equity contract originations from a large financial institution
108,117 consumers applying for home equity contract from lender’s standardized menu (March - December 2002)
8 Northeastern states: MA, ME, CT, NH, NJ, NY, PA, RI Observe
Borrower’s initial contract choice Lender’s primary screening (accept, reject, or additional screening) Lender’s counteroffer Borrower’s response to counteroffer Borrowers’ repayment behavior (origination - March 2005)
Other observable information Borrower’s credit quality and purpose for the loan Demographics: income, debts, age, occupation
8
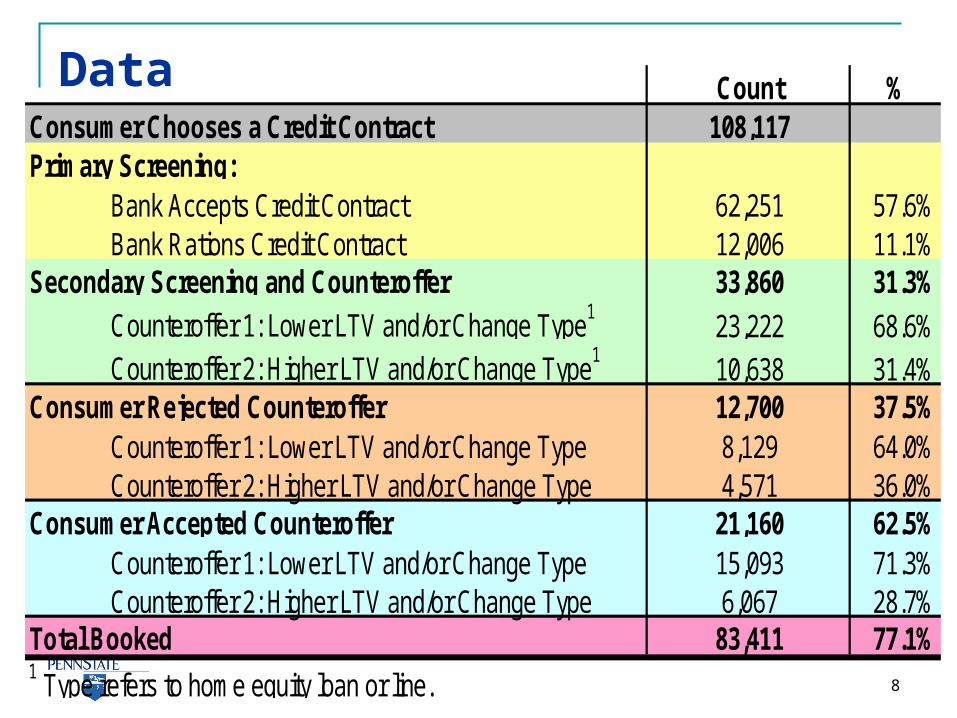
Data Count %Consumer Chooses a Credit Contract 108,117Primary Screening: Bank Accepts Credit Contract 62,251 57.6% Bank Rations Credit Contract 12,006 11.1%Secondary Screening and Counteroffer 33,860 31.3%
Counteroffer 1: Lower LTV and/or Change Type1 23,222 68.6% Counteroffer 2: Higher LTV and/or Change Type1 10,638 31.4%Consumer Rejected Counteroffer 12,700 37.5% Counteroffer 1: Lower LTV and/or Change Type 8,129 64.0% Counteroffer 2: Higher LTV and/or Change Type 4,571 36.0%Consumer Accepted Counteroffer 21,160 62.5% Counteroffer 1: Lower LTV and/or Change Type 15,093 71.3% Counteroffer 2: Higher LTV and/or Change Type 6,067 28.7%Total Booked 83,411 77.1%1 Type refers to home equity loan or line.
9
Empirical Analysis
Part 1: Primary Screening
10
1.1: Contract Choice
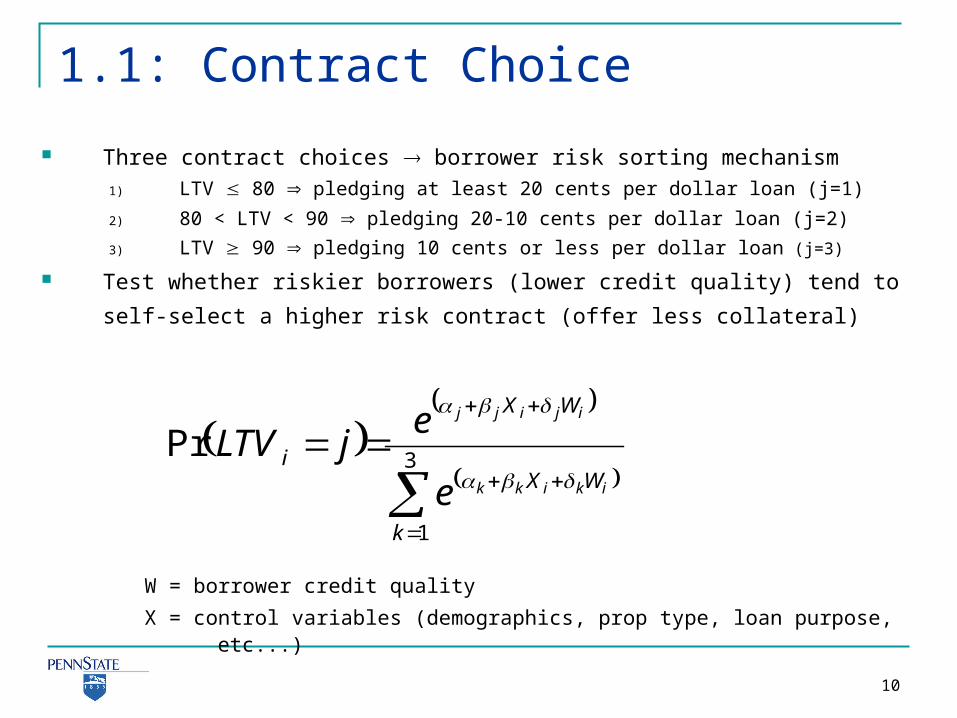
Three contract choices borrower risk sorting mechanism
1) LTV 80 pledging at least 20 cents per dollar loan (j=1)
2) 80 < LTV < 90 pledging 20-10 cents per dollar loan (j=2)
3) LTV 90 pledging 10 cents or less per dollar loan (j=3)
Test whether riskier borrowers (lower credit quality) tend to self-select a higher
risk contract (offer less collateral)
W = borrower credit quality
X = control variables (demographics, prop type, loan purpose, etc...)
3
1
Pr
k
WX
WX
iikikk
ijijj
e
ejLTV
11
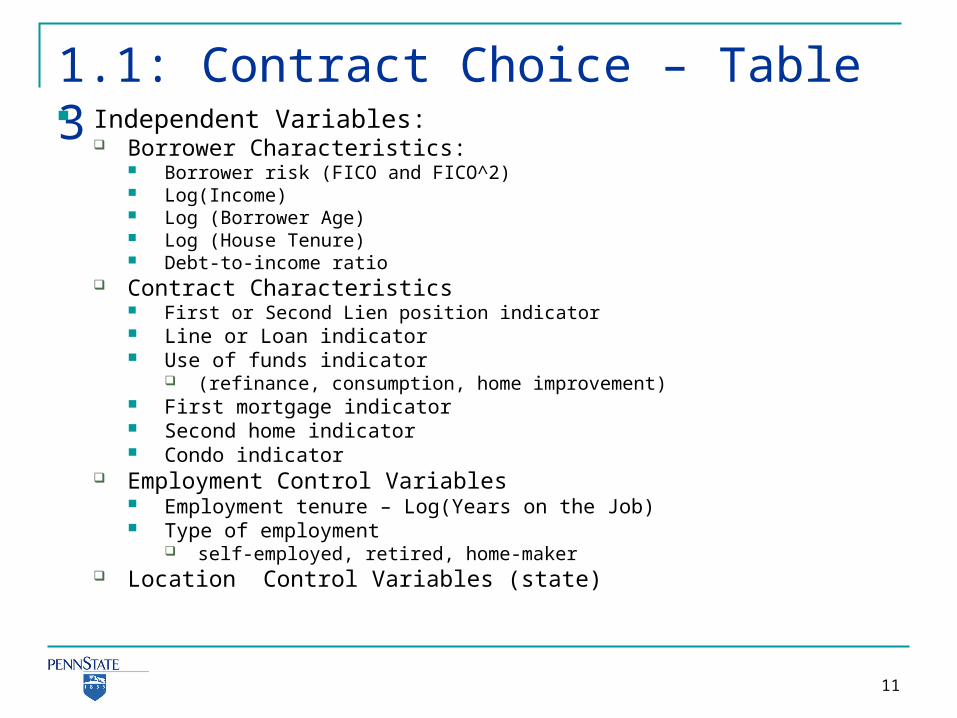
1.1: Contract Choice – Table 3 Independent Variables:
Borrower Characteristics: Borrower risk (FICO and FICO^2) Log(Income) Log (Borrower Age) Log (House Tenure) Debt-to-income ratio
Contract Characteristics First or Second Lien position indicator Line or Loan indicator Use of funds indicator
(refinance, consumption, home improvement) First mortgage indicator Second home indicator Condo indicator
Employment Control Variables Employment tenure – Log(Years on the Job) Type of employment
self-employed, retired, home-maker Location Control Variables (state)

12
1.1. Contract Choice –Table 3 Less credit-worthy borrowers (lower FICO) are more likely to
apply for higher LTV home equity products (pledging less
collateral per dollar).
For example,
(a) Relative to a borrower with a score of 800, a borrower with
FICO score of 700 is 18.4% more likely to select an 80-90
LTV contract than one with LTV 80.
(b) Relative to a borrower with a score of 800, a borrower with
FICO score of 700 is 19.6% more likely to apply for a LTV >
90 than one with LTV 80.
Consistent with predictions by Bester (1985).

13
1.1 Contract Choice
Conclusion: We find evidence that borrowers do select
contracts that reveal information about their risk level.
14
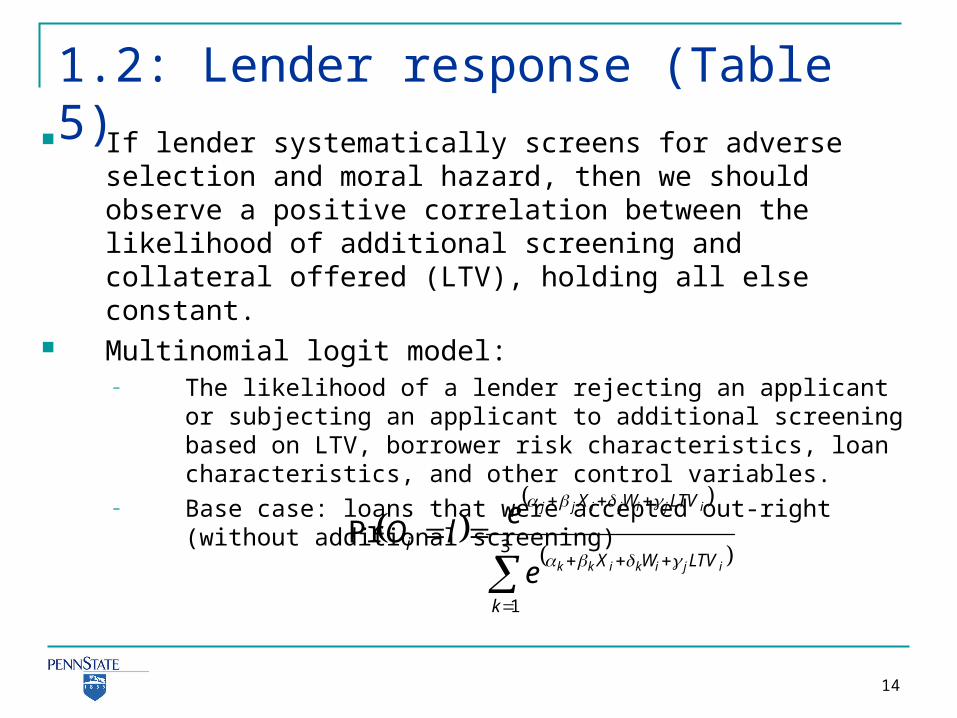
1.2: Lender response (Table 5) If lender systematically screens for adverse selection and moral
hazard, then we should observe a positive correlation between the likelihood of additional screening and collateral offered (LTV), holding all else constant.
Multinomial logit model: – The likelihood of a lender rejecting an applicant or subjecting an
applicant to additional screening based on LTV, borrower risk characteristics, loan characteristics, and other control variables.
– Base case: loans that were accepted out-right (without additional screening)
3
1
Pr
k
LTVWX
LTVWX
iijikikk
ijijijj
e
elO
15
1.2: Lender response (Table 5)
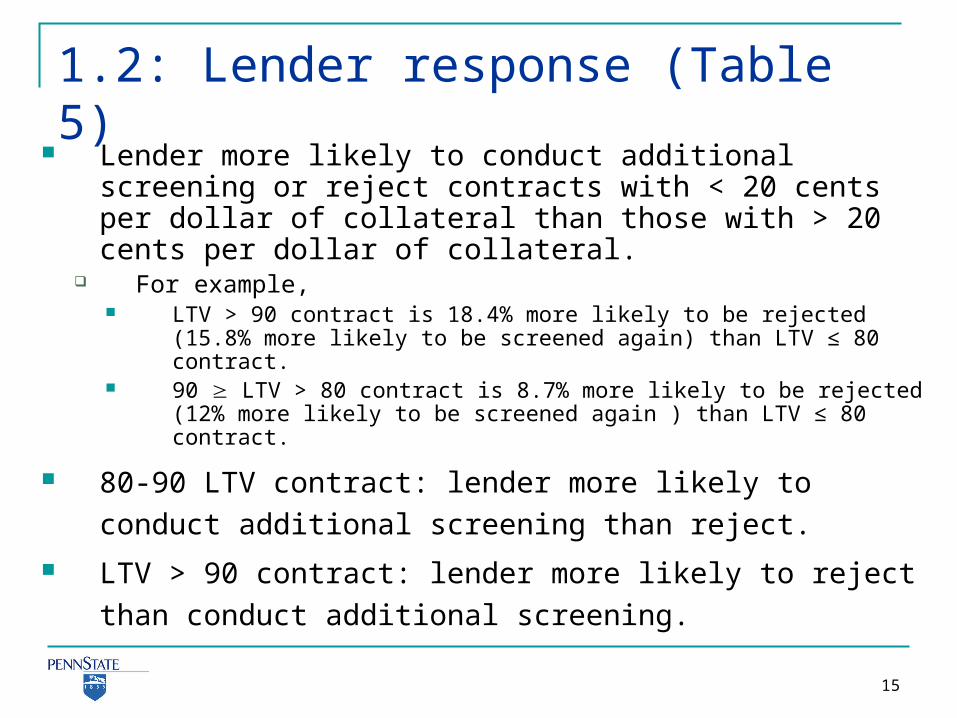
Lender more likely to conduct additional screening or reject contracts with < 20 cents per dollar of collateral than those with > 20 cents per dollar of collateral.
For example, LTV > 90 contract is 18.4% more likely to be rejected (15.8% more
likely to be screened again) than LTV ≤ 80 contract. 90 LTV > 80 contract is 8.7% more likely to be rejected (12% more
likely to be screened again ) than LTV ≤ 80 contract.
80-90 LTV contract: lender more likely to conduct
additional screening than reject.
LTV > 90 contract: lender more likely to reject than
conduct additional screening.
16
1.2: Lender Response
Conclusion: Evidence that lender followed standard
underwriting protocol.

17
1.3: Test for Adverse Selection Test for the presence of adverse selection conditional on the
borrower’s choice of contract type Examine the loan performance of the 62,251 borrowers whose applications
were accepted outright (without additional screening). Competing-Hazard Model of Default & Prepayment:
The time to prepayment, Tp, and time to default, Td, are random variables that have continuous probability distributions, f(tj), where tj is a realization of Tj (j=p,d).
The joint survivor function conditional on time-varying covariates
where gjn(r,H,X) time-varying function of the relevant interest rates, property values, loan characteristics, borrower characteristics
Z macro-economic factors, p and d unobservable heterogeneity factors
),,exp
,,expexp(,,,,,|,
1
'
1
'
d
p
t
nddndnd
t
nppnpnpdpdp
ZXHrg
ZXHrgZXHrttS

18
1.3 Test for Adverse Selection
If adverse selection based on unobserved risk characteristics is present, then we should find a significant relationship between initial LTV and ex post default.
If adverse selection is not present, then we should observe no systematic relationship between initial LTV and default risk.
19
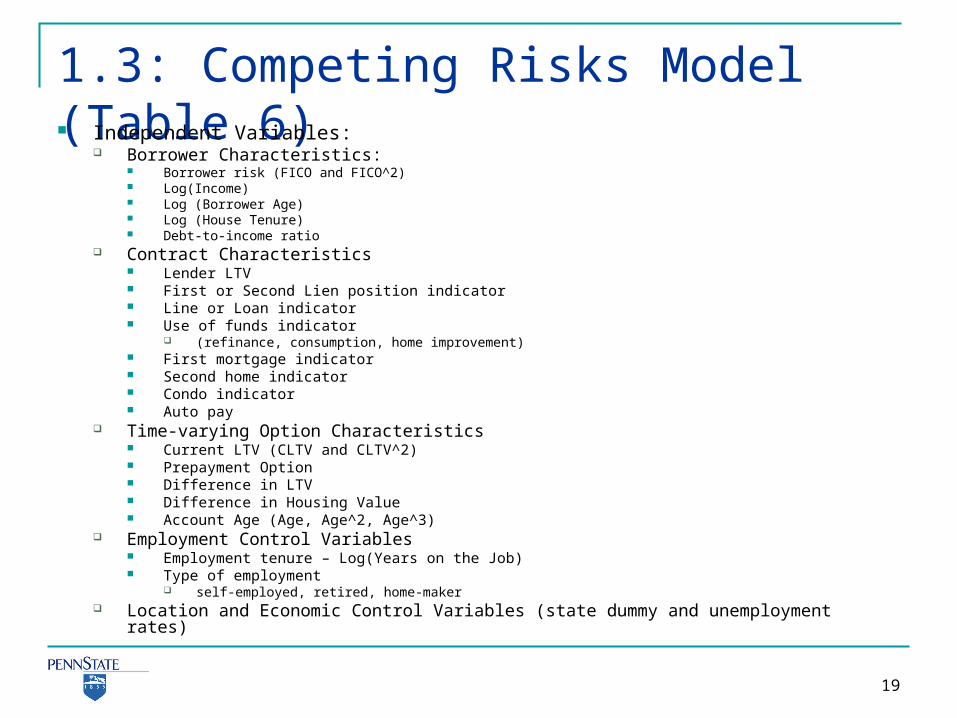
1.3: Competing Risks Model (Table 6) Independent Variables:
Borrower Characteristics: Borrower risk (FICO and FICO^2) Log(Income) Log (Borrower Age) Log (House Tenure) Debt-to-income ratio
Contract Characteristics Lender LTV First or Second Lien position indicator Line or Loan indicator Use of funds indicator
(refinance, consumption, home improvement) First mortgage indicator Second home indicator Condo indicator Auto pay
Time-varying Option Characteristics Current LTV (CLTV and CLTV^2) Prepayment Option Difference in LTV Difference in Housing Value Account Age (Age, Age^2, Age^3)
Employment Control Variables Employment tenure – Log(Years on the Job) Type of employment
self-employed, retired, home-maker Location and Economic Control Variables (state dummy and unemployment rates)

20
1.3: Evidence of Adverse Selection (Table 6) Observable risk characteristics
a) 100 point FICO default risks 43% (prepay 15%)
b) Rate refinancing 3.7% less likely to default (2.8% more
likely to prepay)
c) No first mortgage 6.8% less likely to default (3.1% less
likely to prepay)
d) One percentage point higher DTI 2.1% more likely to default
(2.2% more likely to prepay)
e current LTV (e.g., 1% house price depreciation) 4% more
likely to default (1% less likely to prepay) than borrowers
whose current LTV (i.e., house price appreciation)

21
1.3: Evidence of Adverse Selection (Table 6) After controlling for the observable risk characteristics,
borrowers with higher initial LTV contract (pledging
less collateral per dollar loan) are more likely to
default.
a) Relative to borrowers with LTV ≤ 80, those with 80 <
LTV < 90 are 2.2% more likely to default (4.5%
less likely to prepay)
b) Those with LTV 90 are 5.6% more likely to
default (6.6% less likely to prepay)
22
1.3: Evidence of Adverse
Selection Conclusion:
Evidence consistent with the presence of adverse selection on unobservables in the home equity lending market (Stiglitz & Weiss, 1981).
Evidence also consistent with findings of adverse selection in
the credit card market (Ausubel, 1999).
23
Empirical Analysis
Part II: Secondary Screening
24
2.1: Lender’s Counteroffer Factors that affect the lender’s decision to make one of the two
counteroffers after the secondary screening.
a) Counteroffer to further mitigate moral hazard:
• if lender lowers LTV (increasing collateral required per dollar loan
to induce borrower effort) and/or switches the product from a
home equity loan to a home equity line.
b) Counteroffer to further mitigate adverse selection:
• if lender increases LTV and/or switches the product from a
home equity line-of-credit to a home equity loan (increasing
the APR to induce borrower type).
Estimate a logit model to assess the likelihood of a lender
making a counteroffer designed to mitigate adverse selection.

25
2.1: Adverse Selection Counter (Table 8)
Higher risk borrowers less likely to receive adverse selection counter offer.
Relative to borrower with a score of 800, borrower with a FICO score of 700 is 24.6% less likely to receive a counteroffer designed to mitigate adverse selection than one designed to mitigate moral hazard.
Borrowers who overvalue their property value (relative to the bank’s estimated value)
One percentage point in the lender’s LTV ratio over the borrower’s LTV ratio increases by 3.1% the probability that the lender counteroffers with a contract designed to mitigate adverse selection.

26
2.1: Adverse Selection Counter
Conclusion Lender does systematically screen borrowers for
adverse selection and moral hazard.
27
2.2: Borrower response to counteroffer
2 Logit models of borrower response: the likelihood of a borrower rejecting a “moral hazard” or “adverse selection” counteroffer.
Does secondary screen reintroduce adverse selection?
Do low credit risk applicants reject counteroffer?

28
2.2. Moral hazard counteroffer (Table 10a) Each one percentage point decrease in the
counteroffer interest rate relative to the original interest rate decreases the likelihood of a borrower rejecting the moral hazard counteroffer by 2.4%.
If lender estimates a 10 percentage point higher LTV than borrower, then likelihood of borrower rejecting moral hazard counter increases by 0.65%.
Indicates that counter offer introduces additional adverse selection.

29
2.2. Adverse Selection Counter (Table 10b)
Each one point increase in the counteroffer interest rate over the original interest rate increases the likelihood of a borrower rejecting the counteroffer designed to mitigate adverse selection by 1%.
Less risky borrowers (lower FICO scores) more likely to reject counter offer.
Results confirm that lender’s mitigation efforts introduce additional adverse selection.
30
2.3: Effectiveness of counteroffer (Table 11)
Estimate a competing-risks hazard model Test the effectiveness of the lender’s adverse selection and moral
hazard mitigation efforts Sample
Include all loans accepted following both the primary and secondary screening
83,411 borrowers 2 dummy variables identify
Moral hazard counteroffer Adverse selection counteroffer

31
2.3: Effectiveness of counteroffer (Table 11)
Relative to loans that did not receive additional screening,
the risk of default ex post declines by 12.2 percent for loans that the lender ex ante required additional collateral and/or switched the contract from a home equity loan to a home equity line.
Relative to loans that did not receive additional screening,
the risk of default ex post declines by 4.2 percent for loans where the lender ex ante reduced the required collateral and/or switched the contract from a credit line to a home equity loan.
32
2.3: Effectiveness of counteroffer (Table 11) Considerable difference in the marginal impact
suggests that the lender’s effort to mitigate moral hazard ex ante is more effective than the effort to mitigate adverse selection in reducing the risk of default risk ex post.
consistent with lender being relatively more successful in inducing additional borrower effort ex post.

33
Main Conclusions -- #1 Borrower’s choice of credit contract does reveal
information about her risk level. Less credit-worthy borrowers are more likely to
select a contract requiring less collateral Even after controlling for observable risk
characteristics, lender continues to face adverse selection problems due to unobservable information.
34
Main Conclusions -- #2
Lender’s efforts ex ante to mitigate adverse selection and moral hazard can be effective in reducing credit losses ex post. Secondary screening and counteroffer designed
to mitigate moral hazard reduce default risk ex post by 12%.
Additional screening and counteroffer to mitigate adverse selection reduce default risk ex post by 4%.
35
Main Conclusions -- #3
Mitigation efforts impose costs (higher prepayment rates) Moral hazard mitigation increase the risk of
prepayment by 11%. Adverse selection mitigation increase the risk of
prepayment by 2.9%. Direct impact on secondary market investors and
their ability to predict prepayment speeds on a securitized portfolio.