1 shannon m. lloyd u.s. epa 2004 nanotechnology science to achieve results (star) progress review...
TRANSCRIPT

1
Shannon M. Lloyd
U.S. EPA 2004 Nanotechnology Science to Achieve Results (STAR) Progress Review
Workshop – Nanotechnology and the Environment IIPhiladelphia, Pennsylvania
August 18-20,2004
A Life Cycle Assessment Approachfor Evaluating
Future Nanotechnology Applications

2
Motivation for Applying LCA
• Reduce material and energy consumption
• Reduce environmental discharge
• Use LCD early in product life cycle
• Optimize economic and social value
• Identify regulatory needs
• Address public concerns

3
Technologyassessment
Economicassessment
Life cycleassessment
Value/cost toproducers
Value/cost toconsumers
Value/cost tosociety
Resourcesrequired
Life cyclecost
R&D goals
Currentperformance
Mathematicalmodels
Expertjudgment
Firstprinciples
Productperformance
Technicalchallenges
Performancetradeoffs
Environmentalimpact
Product valuation
Environmentalvaluation
1. Define scope of analysis
2. Model performance
3. Conduct LCA
4. Estimate value
5. Assess projects
Process &design variables
Environmentalmetrics
Availableinformation
Technologyscenarios
Ability tomeet goals
Expectedreturns
Attractivenessof project
Purpose
Scope
Boundaries
Update as necessary

4
LCA Methods Used
• Process-based– developed by SETAC, U.S. EPA and ISO
– quantifies physical flows of energy, resources and environmental effects
– Captures direct effects
• Streamlined software
• EIO-LCA– developed by CMU’s Green Design Initiative
– driven by the interrelationships among 491 sectors of the US economy
– quantifies inputs and effects by relating economic activity to public datasets
– captures direct and indirect effects
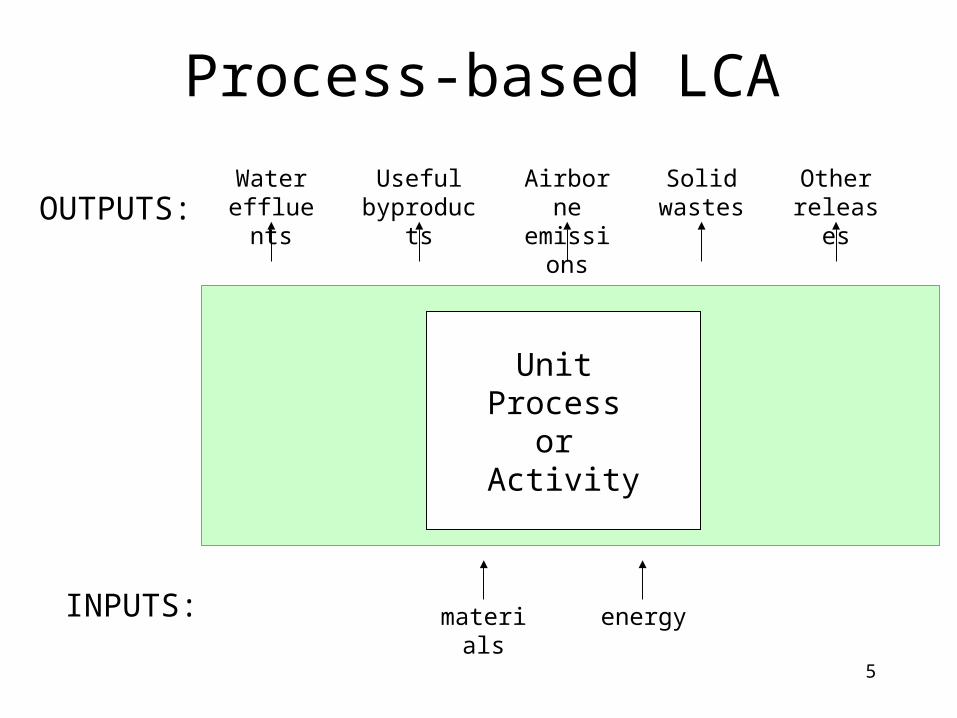
5
Process-based LCA
Unit Process
or Activity
INPUTS:
OUTPUTS:
materials energy
Water effluents
Usefulbyproducts
Airborne emissions
Solid wastes
Other releases

6
Streamlined Software
INPUTS:• Bill of materials• Process details• Product output
LCA Software
Life Cycle Inventory Matrices
OUTPUTS:• Materials used• Energy used• Water effluents• Airborne emissions• Solid waste• Other releases

7
EIO-LCA
Power generation
and supply
All other sectors
Iron and steel mills
Motor vehicle
parts mfg
Auto and light truck
mfg
input economic unit
output talenvironmen unitinput $
output economic unit
output talenvironmen unitoutput $
• Materials used• Energy used• Water effluents• Airborne emissions• Solid waste• Other releases
Publicdatasets
EconomicInput-Output
Matrix

8
Hybrid LCA
EIO-LCA
P o w e r g e n e r a t i o n a n d s u p p l y
A l l o t h e r s e c t o r s
I r o n a n d s t e e l m i l l s
M o t o r v e h i c l e
p a r t s m f g
A u t o a n d l i g h t t r u c k
m f g
input economic unit
output talenvironmen unitinput $
output economic unit
output talenvironmen unitoutput $
• M a t e r i a l s u s e d• E n e r g y u s e d• W a t e r e f f l u e n t s• A i r b o r n e e m i s s i o n s• S o l i d w a s t e• O t h e r r e l e a s e s
Process-based LCA
Process/activityProcess/activity
Process/activityProcess/activity
Process/activityProcess/activity
Process/activityProcess/activity
Process/activityProcess/activity
Process/activityProcess/activity
Process/activityProcess/activity
Process/activityProcess/activity
Process/activityProcess/activity
Process/activityProcess/activity
Standard Materials and Processes
Product Life Cycle
reuseremanufacturerecycle
raw material acquisition
raw material acquisition
material processing
material processing manufacturingmanufacturing useuse
waste management
waste management
LCA Software
Life Cycle Inventory Matrices
LCA Software
Life Cycle Inventory Matrices
Unique Materials and Processes

9
Applications
• Life Cycle Implications of Using Nanocompositesfor Automotive Body Panel Weight Reduction
• Life Cycle Implications of Using Nanofabrication to Position and Stabilize Nanoscale PGM Particlesin Automotive Catalysts

10
Life Cycle Implications of Using Nanocomposites for Automotive Body Panel
Weight Reduction
- Example Results -

11
Modeled Product Performance
0
1
2
3
4
5
6
0 5 10 15 20 25 30
Filler content [wt.%]
Polymer (1 GPa)
Talc-filled
Glass fiber-filled
Nanoclay-filled
MWCNT-filled
SWCNT-filled
Pre
dict
ed M
odul
us o
f Ela
stic
ity
(GP
a)
Predicted elastic modulus vs. filler content based on general Halpin-Tsai model

12
Life Cycle Supply Chain Effects
Relative Change in Supply Chain Environmental Impacts
-70%
-50%
-30%
-10%
10%
30%
50%
70%
1
Aluminum
Nanocomposite - lower
Nanocomposite - upper
Pe
rce
nta
ge
Ch
an
ge
in
En
viro
nm
en
tal I
mp
act
Ele
ctric
ity U
sed
Con
vent
iona
l P
ollu
tant
s R
elea
sed
OS
HA
Saf
ety
Gre
enho
use
Gas
es
Rel
ease
d
Fue
ls U
sed
Ore
s U
sed
Haz
ardo
us W
aste
G
ener
ated
Tox
ic R
elea
ses
and
Tra
nsfe
rs
Wei
ghte
d T
oxic
R
elea
ses
and
Tra
nsfe
rs
Wat
er U
sed
Ene
rgy
Use
d
Source: Lloyd and Lave, ES&T, Vol. 37, No. 15, pp. 3458-3466, 2003
(one year’s fleet of vehicles)

13
Petroleum Production & Combustion
-90
-80
-70
-60
-50
-40
-30
-20
-10
0
10
2005 2010 2015 2020 2025 2030
Steel
Aluminum
Unfilled
Talc
Glass fiber
Nanoclay
MWCNT
Ch
an
ge
in C
O2
Em
issi
on
s (m
illio
n m
etr
ic to
ns)
current mix

14
Value to Producers/Consumers
$-
$0.50
$1.00
$1.50
$2.00
$2.50
$3.003
yr
Life
3 y
rL
ife3
yr
Life
3 y
rL
ife3
yr
Life
3 y
rL
ife3
yr
Life
3 y
rL
ife3
yr
Life
3 y
rL
ife3
yr
Life
3 y
rL
ife3
yr
Life
3 y
rL
ife3
yr
Life
3 y
rL
ife
St Alum Un Talc GF NC MW SW St Alum Un Talc GF NC MW SW
Passenger Cars Light Trucks
Fuel savings
Secondary weight savings

15
Social Value
-90
-80
-70
-60
-50
-40
-30
-20
-10
0
10
2005 2010 2015 2020 2025 2030
-1350
-1150
-950
-750
-550
-350
-150
50
Steel
Aluminum
Unfilled
Talc
Glass fiber
Nanoclay
MWCNT
Ch
an
ge
in C
O2
Em
issi
on
s (m
illio
n m
etr
ic to
ns)
Eco
no
mic V
alu
atio
n ((M
illion
$U
S)
current mix
(using $15/tC)

16
Assessment of LCA Framework
Incorporated:– multiple LCA models.
– technology forecasting to extend beyond current products.
– valuation techniques to extend beyond environmental inventories.
– expert elicitation to characterize expected impacts.
Established a framework that can be used to:– make more informed decisions throughout R&D.
– compare current products to those expected from emerging technologies.
– help address public concerns about emerging technologies.
Contributed:– a new approach for performing anticipatory LCA.

17
Assessment of LCA Framework
Available Information
– General LCA Modeling
– Prospective LCA Modeling
– Nanotechnology LCA Modeling

18
Available Information
General LCA Challenges
• Data management and access• Uncertainty in deterministic LCA • Transparency • Time requirements• Incorporating into nanotechnology risk analysis• Collaborative design• Spatial considerations• Linear relationship• Occupational safety and health

19
Available Information
Prospective LCA Challenges
• Defining relevant future states
• Incorporating learning curves
• Technology adoption
• Technology interactions
• Forecasting life cycle processes and activities
• Radically different technologies
• Gap between scientific knowledge and understanding of environmental and human

20
Available Information
Nanotechnology LCA Challenges
• Establishing an inventory for nanomaterials and nanoprocesses
• Determine if risks are qualitatively/quantitatively different

21
Incorporating LCA product life cycle
0%
10%
20%
30%
40%
50%
60%
70%
80%
90%
100%
Opportunity for Life Cycle Design
Environmental Engineering
Required
Committed
Actual
AppliedR&D
BasicR&D
End-of-Life
ProductPlanning
ProductDev.
Mfg. Use

22
Incorporating LCA in nanotechnology risk assessment
Emissionsfrom
anthropogenicsources
Ambientconcentrationin air, water,
and soil
Exposure Dose
Riskto humanhealth andecosystems
Fate andtransportmodels
Exposureassessment
models
Dose –responsemodels
Life cycle inventory
Life cycle assessment
Technology forecasting
Influence R&D