1 share price reaction to dividend announcements ...7… · business administration, for providing...
TRANSCRIPT

* We wish to thank Mr. Frode Mæland Strand at the Norwegian School of Economics andBusiness Administration, for providing additional data from the Oslo Stock Exchange andMartin Kemmitt for data collection. We also wish to thank two anonymous reviewers for theirvery helpful and insightful comments on earlier drafts. Any remaining errors are theresponsibility of the authors. The views do not represent those of Nordea Bank.
(Multinational Finance Journal, 2004, vol.8, no.1 & 2, pp. 115–139)© Multinational Finance Society, a nonprofit corporation. All rights reserved.
1
Share Price Reaction to DividendAnnouncements: Empirical Evidence on the
Signaling Model from the Oslo StockExchange
John CapstaffUniversity of Strathclyde, U.K.
Audun KlæboeNordea Bank, Norway
Andrew P. MarshallUniversity of Strathclyde, U.K.
This study tests the signaling theory of dividends by investigating the stockprice reaction to dividend announcements on the Oslo Stock Exchange (OSE),and subsequent changes in the cash flows of the firms involved. This paper addsto existing evidence by examining the role of dividends in a market where thecorporate ownership structure is notably different from the U.S. and the U.K.,and where the motivation to use dividends as a signaling mechanism appears tobe stronger. The results indicate significant abnormal stock returns areassociated with announcements of dividend changes. The results are robust toalternative models of dividend expectations, after controlling for the impact ofearnings announcements, and are consistent across sub-periods in the sample.The stock market reaction is most pronounced for large, positive dividendannouncements that are followed by permanent cash flow increases. Thisevidence provides modest support for the signaling theory of dividends inNorway, but it does not support the proposition that corporate ownershipstructure is an important influence on the use of dividends as a signalingmechanism (JEL: G32; G35).
Keywords: dividend announcements, Oslo stock exchange, signaling.

Multinational Finance Journal116
I. Introduction
This study investigates the market reaction to dividend announcementsin Norway and assesses whether this can be explained by signalingtheory. Signaling theory holds that dividends are used to signalmanagement’s expectations of a permanent change in the futureearnings of the firm, and the market reacts by revaluing the firm’sshares. A market reaction could result from either new value relevantinformation in the dividend, or from a change in agency costs. Toconfirm the signaling theory of dividends, therefore, it is necessary thatthe market reaction is followed by a permanent change in futureearnings (or cash flows), in the same direction as the dividend change.
Norway is an interesting environment in which to test the signalinghypothesis due to its corporate ownership structure that serves to reduceagency costs and increase information asymmetries relative to the moreintensively researched U.S. and U.K. markets. The motivation formanagers to use dividends as a signaling mechanism may be stronger insuch an environment. A test of the signaling hypothesis in Norwaycould, therefore, shed light on the importance of ownership structurewhen interpreting evidence on the market reaction to dividend changes.The clear dividend payment process and the neutral tax system inNorway reduce the scope for ‘noise’ in the results.
Using data from 1993 to 1998 we find that significant abnormalstock market returns are associated with announcements of bothdividend increases and dividend decreases. The results are robust todifferent models of dividend expectations, after controlling for theimpact of different earnings announcements, and are consistent oversub-periods in the sample. The stock market reaction is morepronounced for larger dividend changes, and for positive dividendannouncements that are followed by permanent cash flow increases. Weinterpret these results as evidence that dividend changes convey newinformation to market participants, and also as evidence, though lesscompelling, of the dividend signaling theory. The evidence fromNorway does not, however, support the proposition that corporateownership structure is an important influence on the use of dividends asa signaling mechanism.
The remainder of the paper is organized as follows. Section IIdiscusses the previous literature, the motivation for this study, andhypotheses to be tested. Section III describes the data, the classificationof stocks according to dividend announcements, and the testing methods

117Stock Prices Reaction to Dividend Announcements
1. See also the large number of papers from Pettit (1972) to Koch and Shenoy (1999).
2. Norwegian firms typically pay less than one third of their profits to shareholders andthe dividend yield in Norway is lower than in most other European stock markets; Oslo StockExchange (1998).
employed. Section IV discusses the empirical results. Section Vprovides some additional tests that examine the robustness of the resultsand testing methods employed in the study. Finally, the conclusions areprovided in section VI.
II. Literature Review and Hypothesis Development
The extensive literature on the signaling properties of dividends fromBhattacharya (1979) to Benartzi et al. (2002) generally reportssignificant stock market reactions in the same direction as theannounced dividend changes.1 These findings are consistent either withchanges in agency costs or with new information about corporate valueconveyed by the dividend changes. However, evidence that supports thedividend signaling theory is scarce. Allen and Michaely (2003, p.73)express the view that, “The overall accumulated evidence does notsupport the assertion that dividend changes convey information aboutfuture earnings”, whilst La Porta et al. (2000) provide extensiveevidence that agency models are the key to understanding dividendpolicies around the world. One possible reason for the above findingsis that the corporate ownership structure, particularly in the U.S. andU.K. markets, may curtail the use of dividends as a signalingmechanism. This paper aims to add to the evidence by examining therole of dividends in the Norwegian market where the corporateownership structure is notably different, and where the motivation touse dividends as a signaling mechanism may be stronger.
The dividend system in Norway is relatively simple. Firms pay onlyone dividend per year, and cash is the only admissible form ofdisbursement to shareholders, which almost exclusively takes the formof dividends. Bohern et al. (1997) find that stock repurchases areexceptional, and that Norwegian firms pay lower dividends incomparison to the U.K. and U.S. measured relative to both earnings andshare price.2 One partial explanation is that unlike the U.S. and U.K.markets Norwegian corporate law puts a specific quantifiable ceiling onthe amounts of dividends a firm can pay in any given year.

Multinational Finance Journal118
3. The degree of inside ownership in the U.K. and U.S. is less than the Norwegianmarket. The ownership by financial institutions is much more significant in the U.K. and U.S.
4. Norwegian firms also have a high degree of ownership by government and regionalmunicipalities (approximately 17%), significant ownership by foreign investors(approximately 29%) and around 20% of ownership by other Norwegian firms (NorwegianRegistry of Securities, 1999). We do not have data on the ownership breakdown of individualfirms for our sample.
5. Thanks to an anonymous reviewer who made this valid point.
6. This result is based on the 20 largest firms in each country. A similar result isreported for medium sized firms.
The ownership structure of Norwegian firms is different from theU.S. and the U.K. where it is relatively dispersed. In Norway, insideshare ownership was around 15%, on average, over the period of thisstudy from 1993-1998 (Norwegian Registry of Securities, 1999).3
Ownership concentration is also high in Norway. Bohern et al. (1997)report that between 1984 and 1994, the three largest owners held, onaverage, 41% of firms’ shares. Comparable figures for U.K. and U.S.respectively are 21% and 25%; see Prowse (1995).4 The ownershipstructure has implications for agency costs. The agency argument is thatdividends are good news because they reduce agency costs. Ceterisparibus, higher dividend firms require more external finance and will,therefore, be subjected to external scrutiny more often. Dividendpayments also reduce a firm’s free cash flow, which imposes extradiscipline on use of internal funds, thereby reducing wastefulexpenditures. Norwegian firms should have lower agency costs sinceowner-managers face more of the wealth effects of their decisions (seeHolder et al. [1998]), whilst the presence of large external shareholdersis also likely to reduce agency costs, see Shleifer and Vishny (1986) andAllen et al. (2000). Hence the motivation to use dividends to reduceagency costs is weaker in Norway than in the U.S. or the U.K. Althoughcorporate ownership renders dividends less important in reducingagency costs, if outside investors are important for the formation ofshare prices, dividends may have a signaling role to play.5
Ownership structure may also affect the extent of informationasymmetry between managers and the external stock market. La Portaet al. (1999) report that, at the end of 1995, 100% of firms were widelyheld in the U.K., 80% in the U.S., but only 25% in Norway.6 Togetherwith significant family and state involvement, the ownership structurein Norway may curtail the amount of value relevant information that is

119Stock Prices Reaction to Dividend Announcements
available to external users. The quality of financial disclosure is also afactor. According to Ali and Hwang (2000) accounting data is less valuerelevant in: (i) bank oriented countries, (ii) countries where the privatesector is not involved in the setting of accounting standards, (iii)countries where accounting practices follow the continental model, (iv)countries where tax rules have a greater influence on accountingmeasurement, and, (v) countries where spending on audit services islow. Norway fits all of these categories whereas none apply to the U.S.or the U.K. Hence the need to signal information to the market by othermeans, such as dividends, is more apparent in Norway.
Taxation is often thought to be influential in dividend signalingtheory. The personal taxation of dividends make it a costly signal, andinvariably more costly than the alternative of share repurchases. A morecostly signal should convey a stronger management conviction to themarket, and such signals are more difficult to replicate by inferior firms(John and Williams, 1985). Share repurchases, however, are notgenerally an option in Norway (Bohern et al. [1997]), so managers arenot faced with a clear choice between a cheaper and a more costlysignaling mechanism.
The neutrality of the tax system in Norway further implies that taxhas little influence over the firm’s chosen dividend policy. La Porta etal. (2000) devise a ‘dividend tax advantage’ metric where a rating of 1.0is equivalent to tax neutrality. Norway’s rating of 1.08 indicates a verymarginal dividend tax advantage whilst the U.S. rating of 0.58 indicatesan extreme tax disadvantage to dividends (the figure for the U.K. is0.83). In any event, they find no conclusive evidence on the effect oftaxes on dividend policies. The evidence linking tax with signalingmodels is also inconclusive (see Allen and Michaely [2003] for asummary), and some research findings are not consistent with thetheory. For example, Amihud and Murgia (1997) study Germany wherethere is a tax advantage to dividends and find that the stock marketreaction to dividend announcements is similar to U.S. studies wheredividends are tax disadvantaged, implying that ‘inexpensive’ dividendsalso convey information to the market. Hence, there are good reasons tobelieve that the neutrality of taxation in Norway will not deter the useof dividends as a signaling mechanism.
For a number of reasons, therefore, Norway provides a suitableenvironment in which to test the signaling theory of dividends. Themotivation to use dividends as a signaling mechanism is stronger inNorway due to the implications of the corporate ownership structure

Multinational Finance Journal120
both for agency costs and for the extent of information asymmetrybetween managers and external shareholders. The relatively simplesystem of dividend payments and the neutral tax system in Norwayshould help minimize any ‘noise’ in the results due to those factors. Inthe light of the scant support based on U.S. research, evidence of asignaling theory explanation of dividends in Norway would suggest thatcorporate ownership structure is an important influence on the dividendpolicies of firms.
We test for evidence of the signaling theory in two stages. Firstly,we examine the stock market reaction to unexpected dividend changesto assess whether this is consistent with signaling theory. As an agencycost explanation is less likely in Norway, a market reaction in the samedirection as the dividend change suggests that dividend announcementsconvey information to the market about the future prospects of the firm.Secondly, we investigate whether dividend increases are followed bypermanent cash flow increases, as evidence in this respect wouldstrengthen the empirical case for a signaling theory explanation ofdividends.
The following null hypotheses are tested:
Hypothesis 1
H0: Dividend announcements do not provide information to themarket; i.e., there is no stock price reaction on the announcementday.
Hypothesis 2
H0: Positive changes in dividends are not followed by permanentcash flow increases.
III. Data and Testing Methods
A. Data
The data were drawn from Datastream, Worldscope, FTExtel, financialstatements, and the Amadeus database at the Norwegian School ofEconomics and Business Administration. The requirement for data onshare price and dividend announcements provided a final sample of 64

121Stock Prices Reaction to Dividend Announcements
firms over the period 1993-98. To eliminate survivorship bias we didnot require that a firm was in operation for the full sample period. Dataprior to 1993 was not used, as the tax regulation was reformed in 1992.Descriptive statistics on the sample are provided in table 1. The finalsample was found to be a good proxy for the overall OSE market interms of the distribution by industry (table 1, panel A) and by size overthe period of the study (table 1, panel B).
Dividend announcement dates and payment amounts were obtainedfrom FTExtel. Over the six-year period for our 64 firms there were201 dividend announcements. Announcement dates were checked onthe Amadeus database and announced dividend amounts were checked
TABLE 1. Sample Descriptive Characteristics
Panel A- Industry sector
Industry classification No of firms % of firms
Property 2 3%Finance 6 10%Manufacturing 27 42%IT/Communication 4 6%Media/Publishing 2 3%Offshore 5 8%Shipping 15 23%Transport 2 3%Others 1 2%Total 64 100%
Panel B - Size at the beginning and end of the sample period
Years Mean Median Standarddeviation
1993 2,323 1,358 3,7531998 2,975 1,569 3,465
Note: Industry sectors are based on the Oslo Stock Exchange Industry Classification.Finance includes all commercial banks, financial and insurance firms. Shipping and offshorefirms are shown separately due to their prominence in the Norwegian economy. Size isdetermined by market value at the beginning and end of sampling period. Market values aretaken from Datastream International and are expressed in millions of Norwegian Krona. Thetotal market capitalization in 1993 was 210 billion krona and in 1998 352 billion krona. Ourinitial sample represents 71% of the market capitalization of the firms on the Norwegian mainlist in 1993 and 69% in 1998.

Multinational Finance Journal122
against the subsequent dividend payments logged on DatastreamInternational. Non-verified observations were excluded. Observationswith confounding events (such as share issues, bond issues, mergers,fund raising but excluding the announcement of results/earnings) in the20-day period surrounding the dividend announcements were alsoeliminated. These additional criteria reduced the sample of dividendannouncements to 156 (64 firms), as shown in panel A of table 2. PanelB shows that our sample has more dividend announcements in the lateryears as the FTExtel increased its coverage of firm announcements from1995 onwards. Nevertheless, no single year has more than 26% of thesample. We do not have annual dividend announcement data for all 64firms in every sample year but the majority of firms paid regulardividends, particularly in the later years. Shares are placed in portfoliosdepending on whether dividend announcements are positive, negativeor neutral (no change).
TABLE 2. Dividend Announcements
Panel A- Sample
Industry classification No of firms
Initial sample from FTExtel 201Not comparable with Amadeus database for announcement 12 date or Datastream for payment amountConfounding events 33Total sample 156
Panel B - Dividend announcements by year
Years No of announcements % of Total
1993 11 7%1994 19 12%1995 22 14%1996 33 21%1997 39 26%1998 32 20%All years 156 100%
Note: We compared the announcement dates from FTExtel with the Amadeus databaseat the Norwegian School of Economics and Business Administration. Any dates that were notconfirmed were removed from the sample. Any dividend announcements with anyconfounding events on the FTExtel database in the 20 day period surrounding theannouncement were also removed.

123Stock Prices Reaction to Dividend Announcements
7. For our sample the average skewness coefficient was 0.245 which implies that thedistribution has a long right tail. The kurtosis was 7.414 which implies that the distributionis peaked.
8. As an additional check against the potential problems introduced by thin trading wealso calculated abnormal returns using the market adjusted model. This model did not producesignificantly different results from the results presented in section V. Tables are availablefrom the authors on request.
B. Testing Methods
The market model is used to measure risk adjusted returns. The averageR2 value for our sample is 19.78%. Each security was required to haveat least 15 non-missing returns in the event period and no missingreturns in the five pre- and post-announcement days. If non-synchronoustrading is allowed, daily excess returns can exhibit serial dependence;see Brown and Warner (1985). Dimson (1979) demonstrates thatnon-synchronous trading causes the OLS regression estimates of marketmodel parameters to be biased and inconsistent. Securities weretherefore required to have at least 80 non-missing returns in theestimation period. We use an estimation period of 250 days (–261 : –11)and an event window of 21 days (–10 : +10), all relative to the dividendannouncement day 0. A 21-day event window is selected to observe anyeffects prior to or after the announcement day, and to determine whetherthe market reacts efficiently to the announcement.
To determine whether there was asymmetry in the distribution ofreturns, tests of skewness and kurtosis were performed on our sampledata.7 We use log-normal returns to reduce any bias resulting fromskewness.8 Company returns and market returns for the OSE index werecollected from Datastream International. We use t-tests when comparingmeans of the AAR of each of our samples and chi-squared (χ2) tests fordifferences in the numbers of our various classifications/categories.
D. Dividend Expectation and Portfolio Selection
To examine the impact of unexpected dividend announcements on stockreturns, a measure of expected dividend is required. We employ twoalternative models of expected dividend; firstly, the naive ‘no change’expectations model of Aharony and Swary (1980) and, secondly, amodel based on analysts’ forecasts. The ‘analyst’ model is discussed insection V below. The naive model is justified by the assertion thatmanagers do not change dividends unless they expect a significant
Multinational Finance Journal124
change in the future prospects of the firm. Investors therefore expect thedividend to be equal to the previous year’s dividend, and changes areinterpreted as a changes in management’s expectations. The naivemodel of expected dividend is defined in equation (1).
(1)( ), , 1i t i tE D D −=
where E(Di,t) is the expected dividend per share for firm i in year t andDi,t–1 is the dividend per share for the firm in year t–1.
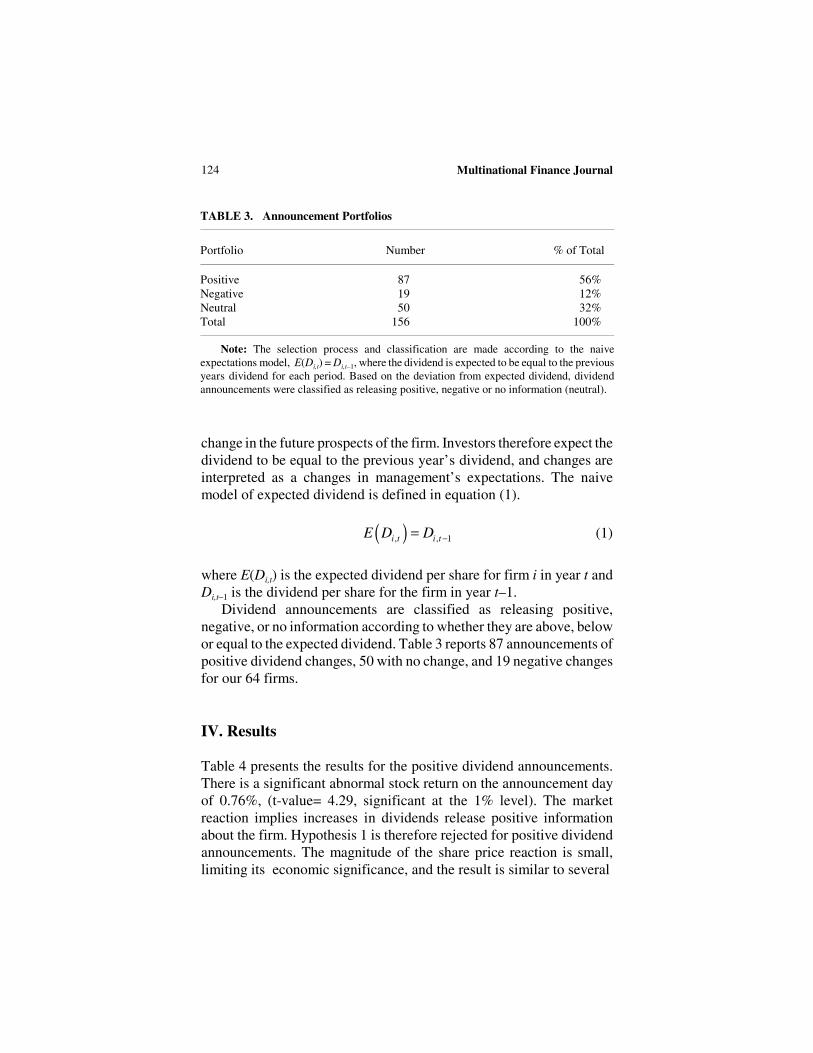
Dividend announcements are classified as releasing positive,negative, or no information according to whether they are above, belowor equal to the expected dividend. Table 3 reports 87 announcements ofpositive dividend changes, 50 with no change, and 19 negative changesfor our 64 firms.
IV. Results
Table 4 presents the results for the positive dividend announcements.There is a significant abnormal stock return on the announcement dayof 0.76%, (t-value= 4.29, significant at the 1% level). The marketreaction implies increases in dividends release positive informationabout the firm. Hypothesis 1 is therefore rejected for positive dividendannouncements. The magnitude of the share price reaction is small,limiting its economic significance, and the result is similar to several
TABLE 3. Announcement Portfolios
Portfolio Number % of Total
Positive 87 56%Negative 19 12%Neutral 50 32%Total 156 100%
Note: The selection process and classification are made according to the naiveexpectations model, E(Di,t) = Di,t–1, where the dividend is expected to be equal to the previousyears dividend for each period. Based on the deviation from expected dividend, dividendannouncements were classified as releasing positive, negative or no information (neutral).

125Stock Prices Reaction to Dividend Announcements
U.S. studies referred to in DeAngelo et al. (1996) who state “…thesestudies typically find an average share price increase of the order of 1%or less.” (p. 344). Over the 21-day event period of this study the CAARof 1.65% is significant at the 5% level. The results do not suggest thatsignaling theory is stronger in Norway than in the U.S..
The results for negative dividend announcements are presented intable 5. There is a significant negative abnormal return of –0.95% on theannouncement day, (t-value= –2.25, significant at 1% level). Hypothesis1 is therefore rejected, as dividend decreases release negativeinformation to the market. The CAAR is negative on the announcementday and declines to –1.7% by the tenth day over the twenty day period,
TABLE 4. Positive Dividend Announcements
Days around AD AAR t-value CAAR t-value
–10 –0.0039 –2.17* –0.0039 –2.17–9 0.0034 1.92 –0.0005 –0.08–8 –0.0014 –0.79 –0.0019 –0.61–7 –0.0003 –0.16 –0.0021 –0.60–6 –0.0004 –0.21 –0.0025 –0.63–5 –0.0004 –0.25 –0.0030 –0.68–4 –0.0007 –0.37 –0.0036 –0.77–3 0.0016 0.90 –0.0020 –0.40–2 0.0031 1.76 0.0011 0.21–1 0.0024 1.36 0.0036 0.63AD 0.0076 4.29** 0.0112 1.901 –0.0026 –1.49 0.0085 1.392 0.0021 1.19 0.0107 1.663 –0.0004 –0.20 0.0103 1.554 0.0022 1.22 0.0125 1.815 0.0009 0.51 0.0134 1.886 0.0037 2.06* 0.0170 2.32**7 0.0000 0.02 0.0171 2.26*8 0.0000 –0.02 0.0170 2.20*9 –0.0007 –0.37 0.0164 2.06*
10 0.0002 0.09 0.0165 2.03*
Note: AD is the dividend announcement date. AAR is the average abnormal return.CARR is the cumulative average abnormal return. t-values are the t-statistics for AAR orCARR (N = 87). The selection process and classification are according to the naiveexpectations model. Daily returns are calculated from the market model. *denotes significanceat the 5% level. **denotes significance at the 1% level.

Multinational Finance Journal126
but it is not statistically significant. The negative announcement effectsare also comparable with the findings of previous research although, aswith the positive announcements, the results derived here are of asmaller magnitude. The market response to bad news is usually morepronounced the greater the extent of information asymmetry, but thisdoes not appear to be the case in Norway.
Overall, these results indicate significant market reactions on theannouncement date to positive and negative dividend changes. Whilstthese results are consistent with signaling theory they are no strongerthan the results reported for U.S. research.
The neutral announcement portfolio results are presented in table 6.
TABLE 5. Negative Dividend Announcements
DaysAround AD AAR t-value CAAR t-value
–10 0.0034 0.81 0.0034 0.81–9 0.0023 0.54 0.0057 0.95–8 0.0028 0.66 0.0085 1.16–7 –0.0010 –0.23 0.0075 0.89–6 –0.0025 –0.59 0.0050 0.53–5 –0.0090 –2.14** –0.0040 –0.39–4 0.0064 1.53 0.0024 0.22–3 0.0006 0.13 0.0030 0.25–2 –0.0009 –0.22 0.0021 0.16–1 0.0036 0.85 0.0057 0.43
AD –0.0095 –2.25** –0.0038 –0.271 –0.0018 –0.44 –0.0056 –0.392 0.0037 0.89 –0.0019 –0.123 –0.0037 –0.87 –0.0056 –0.354 0.0010 0.25 –0.0045 –0.285 0.0033 0.78 –0.0012 –0.076 –0.0010 –0.23 –0.0022 –0.137 –0.0036 –0.86 –0.0059 –0.338 –0.0039 –0.93 –0.0098 –0.539 –0.0049 –1.16 –0.0147 –0.78
10 –0.0023 –0.55 –0.0170 –0.88
Note: AD is the dividend announcement date. AAR is the average abnormal return.CARR is the cumulative average abnormal return. t-values are the t-statistics for AAR orCARR (N = 19). The selection process and classification are according to the naiveexpectations model. Daily returns are calculated from the market model. *denotes significanceat the 5% level. **denotes significance at the 1% level.

127Stock Prices Reaction to Dividend Announcements
9. There is a significant un-explainable positive abnormal return on day +7 of 0.9%.
Hypothesis 1 could not be rejected for this portfolio. No statisticallysignificant share price reaction is observed on the announcement dateimplying that neutral announcements do not convey any newinformation.9 The neutral portfolio is, however, characterized bynegative abnormal returns in the event period. The CAAR is –1.66% forthe 21 days of the event period, although not statistically significant.The negative AAR associated with the neutral announcement could beexplained if, in fact, the market expects some decline in dividends, but
TABLE 6. Neutral Dividend Announcements
DaysAround AD AAR t-value CAAR t-value
–10 –0.9002 –0.96 –0.9002 –0.96–9 0.9000 0.90 –0.9002 –0.94–8 –0.9029 –.87 –0.9031 –0.54–7 0.9003 0.10 –0.9028 –0.41–6 0.9026 0.76 –0.9002 –0.93–5 –0.9056 –1.64 –0.9058 –0.70–4 0.9018 0.54 –0.9040 –0.44–3 –0.9014 –0.41 –0.9054 –0.56–2 –0.9017 –0.51 –0.9071 –0.70–1 –0.9007 –0.22 –0.9078 –0.73
AD –0.9063 –1.86 –0.9141 –1.261 –0.9030 –0.89 –0.9171 –1.462 0.9012 0.37 –0.9159 –1.303 0.9018 0.53 –0.9141 –1.114 –0.9047 –1.40 –0.9188 –1.445 0.9037 1.10 –0.9151 –1.116 –0.9028 –0.83 –0.9179 –1.287 0.9090 2.66** –0.9089 –0.628 0.9017 0.49 –0.9072 –0.499 –0.9028 –0.83 –0.9100 –0.66
10 –0.9066 –1.95 –0.9166 –1.97
Note: AD is the dividend announcement date. AAR is the average abnormal return.CARR is the cumulative average abnormal return. t-values are the t-statistics for AAR orCARR (N = 50). The selection process and classification are according to the naiveexpectations model. Daily returns are calculated from the market model. *denotes significanceat the 5% level. **denotes significance at the 1% level.

Multinational Finance Journal128
10. Although some significant abnormal returns were found subsequent to theannouncement day these were found on day +7, and from some checks of the data it seemsto be the result of extreme observations. The negative trend in the neutral Norwegian portfoliosuggests that there might be some bias present in the data sample. No efforts were made tocorrect for beta bias, from thinly traded stock, as this would reduce the sample significantly;see Solibakke (2000) for a discussion of thinly traded stocks in the Norwegian market.
the naive model does not capture this.10
Brickley (1983) has shown that the size of the dividend change isimportant in explaining the share price reaction. For our portfolios ofpositive and negative dividend announcements we form twosub-samples split at the median level of dividend change. We thencompare the average abnormal returns for these sub-samples on theannouncement date. Table 7 panel A illustrates the magnitude of thedividend change for both the positive and negative dividendannouncements and shows that the increase in dividend is on averagelarger than the decrease, although the median is lower. Panel B of table7 shows that the market reaction is stronger for larger dividend changes,
TABLE 7. Magnitude of Dividend Change
Panel A- Descriptive statistics of size of dividend change due to announcement
Positive dividend Negative dividend (% change, N= 87) (% change, N= 19)
Mean 33% –28%Median 25% –37%Standard deviation 30% 25%
Panel B - Abnormal stock return on dividend announcement date
Positive N Negative N
Dividend change above median 0.0102 43 –0.0679 10Dividend change below median 0.0054 44 –0.1245 9t-value for difference in AARs 2.34** –1.93*
Note: We compare the AAR on the announcement date for dividend changes above andbelow the median for both the positive and negative change portfolios. (For the positiveportfolio the median breakpoint was 25% and for the negative portfolio it was –37%). AARis higher for positive dividend changes that are above the median, and AAR is higher fornegative changes that are below the median (ie more negative). Test of differences are basedon t#tests when comparing means of AAR. *denotes significance at the 5% level. **denotessignificance at the 1% level.

129Stock Prices Reaction to Dividend Announcements
both positive and negative, implying they send a stronger signal.We also tested for consistency across the years of the study,
1993-1998. Table 8 panel A, shows that there is no significantdifference in the numbers of positive, negative and neutral dividendannouncements between the years (χ2 = 9.937, 10 degrees of freedom,p-value =0.55). The low numbers of dividend announcements in theearly years of our sample precludes a rigorous year by year analysis.Therefore we compare the first three years of the sample with the lastthree years. The results in table 8 panel B imply the market reaction is
TABLE 8. Year by year analysis
Panel A - Dividend announcements by year
Years Positive Negative Neutral Total
1993 4 (36%) 2 (19%) 5 (45%) 111994 10 (53%) 3 (15%) 6 (32%) 191995 10 (53%) 4 (18%) 8 (36%) 221996 17 (51%) 5 (15%) 11 (33%) 331997 26 (67%) 0 (0%) 13 (33%) 391998 20 (62%) 5 (16%) 7 (22%) 32All years 87 (56%) 19 (32%) 50 (32%) 156
Panel B - AARs on announcement date
Years Positive Negative Neutral
Years 1993-95N 24 9 19AAR 0.0089 –0.0096 –0.0056
(2.59)** (2.20)* (–1.68)Years 1996-98N 63 10 31ARR 0.0079 –0.0087 –0.0068
(2.13)** (2.09) (–1.88)t-values for differences in AAR (0.20) (0.43) (0.32)
Note: In panel A, χ2 tests test for differences between the numbers of positive, negativeand neutral dividend announcements between the years (χ2 = 9.937, 10 degrees of freedom,p- value = 0.55. AARs are average abnormal return; their t-values are in parentheses. Themean AARs are compared for three portfolios of dividend announcements classified aspositive, negative and neutral using the naive expectations model for our sample split betweenthe early years 1993-95 and the later years 1996-98. *denotes significance at the 5% level.**denotes significance at the 1% level.

Multinational Finance Journal130
not time specific as there is no significant difference between thesub-periods and the total sample period.
V. Robustness Tests
A. Alternative Method for Identifying Unanticipated Dividend Changes
The naive model may not fully capture the impact of a dividendannouncement, especially as investors’ expectations are influenced byinformation throughout the year. Therefore, we also consider dividendforecasts made by financial analysts as these should reflect all theavailable information at the time of the forecasts. Expected dividend isspecified as:
(2)( ) ,, ti tE D AF=
where E(Di,t) is the expected dividend per share for firm i in year t.
and is the average analysts’ forecast of dividend per share for the,i tAFfirm in year t.
The average analysts’ forecasts were collected from the NorwegianSchool of Economics and Business Administration and were availablefor 45 dividend announcements in our sample (for 35 companies).Announcements are classified into portfolios according to how theydeviate from the analysts’ average forecasts, providing 14 positiveannouncements, 24 no change announcements and 7 negativeannouncements. The majority of the dividend announcements are nowneutral which could indicate the analyst model provides more up to dateforecasts than the naive model (chi-squared tests show significantdifferences in the numbers of positive, negative and neutralannouncements in the two models, χ2 = 8.8304, 2 degrees of freedom,p-value= 0.02). Despite this, we found that the classifications ofdividend announcements generated from the analyst model as positive,neutral and negative were the same as the naive model for 36 (82%) ofthe dividend announcements (10 for positive, 6 for negative and 20 forno change). This finding provides some support for our earlier resultsbased on the naive expectations model.
Panel A of table 9 reports the AAR for the analyst model on theannouncement day (we do not provide the results for ±10 days as these

131Stock Prices Reaction to Dividend Announcements
were not significantly different from the naive model). Consistent withthe naive model, the positive portfolio had a significant AAR on theannouncement day whilst the neutral portfolio did not. However, theannouncement day AAR for the negative portfolio is now insignificant,probably due to the small number of events in this portfolio. Thedifference between the naive and analyst models is only significant forpositive dividend announcements (see table 9, panel B). The positivemarket reaction is greater for firms whose dividend exceeds theanalysts’ prediction, implying that these provide the most information.
B. Dividend Increases and Cash Flows
Overall, the results on the market reaction to dividend announcementsin Norway, as reported in tables 4 to 9, are consistent with signalingtheory. Whilst we have argued that an agency explanation is less likelyin Norway, a second test is necessary to confirm a signaling theoryexplanation. We therefore test hypothesis 2 to ascertain whetherpositive dividend announcements signal permanent changes in the future
TABLE 9. Alternative Analyst Model
Panel A- Average abnormal returns
Positive Negative Neutral
N 14 7 24AAR 0.0122 –0.046 –0.040t-value 2.72** –0.77 –1.29
Panel B - Abnormal stock return on dividend announcement
Positive Negative Neutral
N 87 19 50Naive model 0.076 –0.0095 –0.063N 14 7 24Analysts model 0.0122 –0.046 –0.040t-value 2.18** –1.40 –0.32
Note: Average abnormal returns (AAR) and t-statistics are shown for positive, negativeand neutral dividend announcements using portfolios determined by the analyst model.Abnormal returns are calculated using the market model adjusted to log-normal returns. Wedo not present the results for the ±10 days around AD, but these are available upon request.*denotes significance at the 5% level. **denotes significance at the 1% level.

Multinational Finance Journal132
cash flows of the firm. Brook et al. (1998) found that U.S. firms that are
TABLE 10. Cash Flow Analysis
Panel A - Positive dividend announcements and subsequent cash flows
Number % of Total
Permanent increase 24 31%temporary increase 16 28%No increase 37 48%Total 77 100%
Panel B - Average abnormal returns on announcement day
N ARR t-value
Permanent increase 24 0.0125 2.62**temporary increase 16 0.067 1.77No increase 37 0.078 2.19*
Panel C - Differences between average abnormal returns of cash flow portfolios
N ARR t-value
Permanent increase 24 0.0125 2.10**temporary increase 16 0.067 0.45No increase 37 0.078 1.79*
Note: 87 positive dividend announcements were considered based on the naiveexpectations model for the 64 sample firms during 1993-98. Data were not available for 6firms reducing the number of announcements to 77. The ‘permanent increase’ sample has fouryears of cash flow each at least 30% higher than the year of the dividend announcement. The‘temporary increase’ sample has cash flows 40% higher in the year following the dividendannouncement but no more than 20% higher in either years 2 or 3. The ‘no increase’ samplehas four years of flat cash flows following the year of the dividend announcement. Cash flowis defined as operating income less interest and taxes per share normalized by cash flow in theyear of the dividend announcement. Cash flow data between 1994 and 2002 were obtainedfrom Worldscope Global Access/FTExtel. AAR is the average abnormal return for positiveannouncements using portfolios determined by the subsequent cash flow profile of the positivedividend announcing firm. Daily returns and event period abnormal returns are calculatedusing the market model adjusted to log-normal returns. In panel C we compare the meanabnormal return on the dividend announcement date for our three portfolios of positivedividend announcements using the naive expectations model classified according to theirsubsequent four years cash flow as permanent, temporary and no cash flow. Tests ofdifferences are based on t#tests when comparing means of AAR each sample against the othertwo samples. *denotes significance at the 5% level. **denotes significance at the 1% level.

133Stock Prices Reaction to Dividend Announcements
11. When we relax the strict assumption of permanent cash flow increases and look atthe cash flows patterns before and after the positive dividend announcements we do findevidence that the cash flows following positive dividend changes are higher than the predividend cash flows. However, this test has problems as our sample is cross sectional andtherefore we were considering in some cases the same firms’ cash flow patterns for different
about to experience large, permanent cash flow increases following fouryears of stable cash flows announce higher dividends, and generatelarge significant abnormal stock market returns. Our sample size of 64firms does not permit the imposition of a similar constraint on prior cashflows, and we consider the time series of dividend announcementsbetween 1993 and 1998 rather than take a cross sectional approach.However, we adopt their approach in considering the pattern of cashflows in the four years following our 87 positive dividendannouncements. We employ a measure of operating cash flow per share,defined as operating income before extraordinary items and depreciationless interest and taxes, normalized by cash flow in the year of thedividend announcement. Data for 1994-2002 were obtained fromWorldscope Global Access/FTExtel (four years data after the sampleperiod were required). We group dividend announcements into threecategories based on the cash flow profile used in Brook et al. (1998).That is, (a) Permanent increase: the cash flows in the four subsequentyears remain at least 30% above the cash flow in the positive dividendannouncement year, (b) Temporary increase: the cash flow in the yearafter the positive dividend announcement is 40% above the cash flowin the year of the dividend announcement but falls to less than 20%higher in years 2, 3 and/or 4 and (c) No increase: the cash flow increaseis less than 30% in total between the year of the dividend increase andthe subsequent 4 years, and by less than 15% in each of these years. Wealso include in this sub-sample any firm whose cash flow declinedfollowing the positive dividend announcement.
The results in panel A of table 10 show that 52% of firmsexperienced either a permanent or temporary increase in cash flows inthe four years following the positive dividend announcement. Ourresults are not as strong as Brook et al. (1998) in suggesting that firmssignal large and permanent cash flow increases when they raise theirdividends. This result may be due to our inability to impose the stablecash flow restriction on the sample prior to the positive dividendannouncement, and/or our use of multiple dividend announcements forthe same firms and/or the strict definition of permanent cash flows forfour years.11

Multinational Finance Journal134
dividend announcements.
The results in panel B of table 10 show a significantly positive stockmarket reaction for firms that subsequently experienced permanent cashflow increases, and also for firms with no cash flow increase. There isan insignificant positive reaction for firms with temporary cash flowincreases. The magnitude of the AAR is greatest for firms withpermanent cash flow increases, and this is statistically significantlygreater than the AAR for firms with temporary or no cash flowincreases (table 10 panel C).
On the basis of this evidence we cannot unambiguously rejectHypothesis 2 that positive dividend changes are not followed bypermanent cash flow increases. It appears that Norwegian managers donot use positive dividend announcements solely to signal permanentcash flow increases. However, the market correctly discriminatesbetween positive dividend changes followed by permanent cash flowimprovements and those positive announcements with any othersubsequent cash flow profile. The positive market reaction to dividendincreases is consistent with dividend changes containing usefulinformation but in some cases are not signals of a future permanent cashflow increase. In these cases they may convey positive informationabout current or recent performance to confirm management’s view thatcurrent good performance is not transitory. Allen and Michaely (2003)suggest that existing empirical tests are not able to distinguish betweenthese alternative interpretations, and we have the same problem. Miller(1987) argued that (empirically) dividends are better described aslagging rather than leading earnings, whilst Grullon et al. (2002) suggestthat dividends may be used to signal a change in the firm’s risk. Bothare possible explanations of our mixed results.
Overall the evidence presented here offers modest support for thesignaling theory of dividends but it is no more compelling than thereported evidence for the U.S. market, despite the notable differencesin ownership structures. Ownership structure does not, therefore, appearto be an important factor in motivating managers to use dividends as asignaling mechanism.
C. Interaction with Earnings Announcements
An enduring problem when testing the information content of dividendsis the proximity of dividends and earnings announcements (see, Baker,

135Stock Prices Reaction to Dividend Announcements
1999). Earnings figures are generally released during the same periodas dividends are declared. Stock price adjustments could be due to eitheror both of these announcements. Using FTExtel, we found that for 71%(111) of our sample, dividends and earnings were announced on thesame day. For the remaining 29% (45) of dividend announcements we
TABLE 11. Alternative Analyst Model
Panel A- AARs for dividend announcements without earnings announcements
Positive Negative Neutral
N 19 9 17AAR 0.0096 –0.0079 –0.0029t-value (2.78)** (–2.02)* (–0.92)
Panel B - Dividend announcement and the related earnings announcement
Dividend announcementsEarningsannouncements Positive Negative Neutral Total
Positive 46 (53%) 3 (16%) 23 (46%) 72Negative 15 (17%) 7 (37%) 9 (18%) 31Neutral 26 (30%) 9 (47%) 18 (36%) 53Total 87 19 50 156
Panel C - AARs and their t-values for dividend/earnings portfolios
Dividend announcementsEarningsannouncements Positive Negative Neutral
Positive 0.0079 0.0065 0.0085(–2.61)** (1.89) (3.23)**
Negative – –0.0110 –0.0089– (–2.36)** (–2.04)**
Neutral –0.0021 –0.0062 –0.0069(–0.61) (–1.49) (–1.70)
Note AAR is for average abnormal return. Parentheses in panels A and C include thet-values for AARs. Positive, negative and neutral dividend announcements usingportfolios determined by the naïve expectations model are shown. The earnings surpriseas positive, negative and neutral is defined by a model of the change in earnings per shareof firm i from time (t–1) to time t, the dividend announcement date (or closest date to thedividend announcement date.*denotes significance at the 5% level. **denotessignificance at the 1% level.

Multinational Finance Journal136
repeated our analysis of the share price reaction. The 45 announcements(for 30 companies) were split into portfolios of positive, negative andneutral according to the naive expectations model, providing 19positive, 9 negative and, 17 neutral announcements. As the abbreviatedresults in panel A of table 11 are similar to those reported in tables 4, 5and 6, our findings on dividend announcements are robust to the impactof concurrent earnings announcements.
Nevertheless, even for these 45 dividend announcements themajority of the earnings announcements occurred within a one-monthperiod of the dividend announcements. The impact of the earningsannouncement could still influence the results for market reaction to thedividend announcements for this group so an additional test was carriedout. We grouped our total sample of dividend announcements intocategories associated with positive, negative or neutral earningssurprises. We use a naive earnings expectation model similar to thenaive dividend expectations model to define our earnings surprise, asΔEPSi,t, that is the change in earnings per share of firm I from time (t–1)to time t, where t is the dividend announcement date. The earningsannouncement date closest to t is used in the analysis.
For our sample of 156 dividend announcements 46% of the firmshad positive earnings increases and only 20% had earnings decreases.Panel B of table 11 shows all the possible combinations of dividend andearnings announcements. There is a significant difference in thebreakdown of positive, negative and neutral dividend announcementsand the related earnings announcements (chi-squared tests showsignificant differences between the various dividend/earnings portfoliosχ2 = 9.2835, 4 degrees of freedom, p-value = 0.06). Over half of thepositive dividend announcements were accompanied by a positiveearnings announcement and very few were combined with negativeearnings. Also, few negative dividend announcements wereaccompanied by positive earnings surprises. For the neutral dividendannouncements there was no defined pattern. We tested for anysignificant difference between the market reactions to dividendannouncements when they are classified according to the accompanyingearnings release. The results in panel C of table 11 shows there are noparticular dividend/earnings combinations that have significantlydifferent AARs on the announcement date when compared with thefindings for dividend announcements alone as reported in tables 4, 5,and 6. Positive (negative) AAR accompanies all positive (negative)dividend announcements, irrespective of the associated earnings

137Stock Prices Reaction to Dividend Announcements
announcements. Neutral dividend announcements have no significantAAR for any of the earnings announcement portfolios. Whilst there isno significant difference between any of the dividend/earningscombinations for each category of dividend announcements, there wasa larger market reaction to negative dividend announcements combinedwith negative earnings announcements, and for neutral dividendannouncements combined with negative earnings. Hence we areconfident that our overall findings on the market reaction to dividendannouncements are robust.
VII. Conclusions
This study investigates the dividend signaling hypothesis by examiningthe stock market reaction to dividend announcements on the Oslo StockExchange (OSE). The ownership structure in Norway, with itsimplications for agency costs and information asymmetry, increases thelikelihood of a signaling theory explanation of dividends. Significantabnormal stock price returns are present on the announcement day forboth the positive and negative portfolios of dividend announcementswhilst neutral announcements are associated with insignificant negativereturns. The market reaction is greater the larger the change in dividend.
There is no significant difference in our results using a dividendexpectations model based on analysts’ predictions, and our results arerobust to the possible confounding effects when dividend and earningsannouncements occur close together.
The most significant market reactions occur for positive dividendannouncements that are followed by permanent cash flow increases, andthis is supportive of signaling theory. However, positive dividendannouncements do not always signal permanent cash flow increases soour evidence does not provide unequivocal support of the signalingtheory of dividends. An alternative explanation is that dividends conveypositive information about current or recent performance but, as otherresearch papers have also found, the existing empirical tests are not ableto distinguish between the alternative interpretations.
Overall the results of this study support the first stage of thesignaling hypothesis that announced changes in dividends conveyinformation to the market, but the evidence on subsequent cash flows isless strong. The findings are of particular interest given the distinctdifferences in corporate ownership characteristics between Norway and

Multinational Finance Journal138
the U.S., where the majority of the previous research has taken place.Our results, however, are no stronger than those found in U.S. research,implying that ownership structure is not an important influence onfirms’ use of dividends. More specifically, the evidence from Norwaysuggests that lower agency costs and greater information asymmetry donot increase the likelihood that managers will use dividends as asignaling mechanism.
References
Ali, A., and Hwang, L. 2000. Country specific factors related to financialreporting and the value relevance of accounting data. Journal of AccountingResearch 38: 1-21.
Aharony, J., and Swary, I. 1980. Quarterly dividend and earningsannouncements and stockholder returns: an empirical analysis. Journal ofFinance 35: 1-12.
Allen, F.; Bernardo, A. E.; and Welch, I. 2000. A theory of dividends based ontax clientele. Journal of Finance 5: 2499-2536.
Allen, F., and Michaely, R. 2003. Payout Policies. In G. Constantinedes, M.Harris, and R. Stulz. Handbook of the Economics of Finance,North-Holland. (forthcoming).
Amihud, Y., and Murgia, M. 1997. Dividends, taxes and signaling: Evidencefrom Germany. Journal of Finance 52:397-408.
Baker, H. K. 1999. Dividend policy issues in regulated and unregulated firms:A managerial perspective. Managerial Finance 25: 1-20.
Benartzi, S.; Grullon, G.; Michaely, R.; and Thaler, R. 2002. Changes individends (still) signal the past. Working paper. Cornell University.
Bhattacharya, S. 1979. Imperfect information, dividend policy, and the “bird inthe hand” fallacy. Bell Journal of Economics 10: 259-270.
Bohern, O.; Haug, J.; and Michalsen, D. 1997. Consolidation policy andmanagerial discretion: Accounting for intercorporate shareholdings.Research report. Norwegian School of Management.
Brickley, J. 1983. Shareholder wealth, information signaling, and the speciallydesignated dividend: An empirical study. Journal of Financial Economics12: 187-209.
Brook, Y.; Charlton, W. T.; and Hendershott, R. J. 1998. Do firms usedividends to signal large future cash flow increases? Financial Management27: 46-57.
Brown, J., and Warner, J. 1985. Using daily stock returns: The case of eventstudies. Journal of Financial Economics 14: 3–31.
DeAngelo, H.; DeAngelo, L.; and Skinner, D. J. 1996. Reversal of fortune:Dividend signaling and the disappearance of sustained earnings growth.

139Stock Prices Reaction to Dividend Announcements
Journal of Financial Economics 40: 341-371.Dimson, E. 1979. Risk measurement when shares are subject to infrequent
trading, Journal of Financial Economics 7: 197-226.Grullon, G.; Michaely, R.; and Swaminathan, B. 2002. Are dividend changes
a sign of firm maturity? Journal of Business 75: 387-424.Holder, M. E.; Langreher, F. W.; and Hexter, J. L. 1998. Dividend policy
determinants: An investigation of the influences of stakeholder theory.Financial Management 27: 73-82.
John, K. and Williams, J. 1985. Dividends, dilution, and taxes: A signalingequilibrium. Journal of Finance 40: 1053-1070.
Koch, P. D., and Shenoy, C. 1999. The information content of dividends andcapital structure policies. Financial Management 28: 16-35.
La Porta, R.; Lopez-de-Silanes, F.; and Shleifer, A. 1999. Corporate ownershiparound the world. Journal of Finance 54: 471-517.
La Porta, R.; Lopez-de-Silanes, F.; Shleifer, A.; and Vishny, R. W. 2000.Agency problems and dividend policies around the world. Journal ofFinance 55: 1-33.
Miller, M. 1987. The information content of dividends. In J. Bossons, R.Dornbush and S. Fischer (Eds) Macroeconomics: Essays in Honor ofFranco Modigliani. MIT Press, Cambridge, MA.
Norwegian Registry of Securities. 1999. Norwegian Company Statistics.Oslo Stock Exchange. 1998. Dividends in companies listed on the Oslo Stock
Exchange. Statistics from the Oslo Stock Exchange. Research DepartmentOslo Bourse, Number 3.
Pettit, R. R. 1972. Dividend announcements, security performance and capitalmarket efficiency. Journal of Finance 5: 993-1007.
Prowse, S. 1995. Corporate governance in an international perspective: Asurvey of corporate control mechanisms among large firms in the U.S.,U.K., Japan and Germany. Financial Markets, Institutions and Instruments4:1-63.
Shleifer, A., and Vishney, R. 1986. Large shareholders and corporate control.Journal of Political Economy 94: 461-488.
Solibakke, P. B. 2000. Stock return volatility in thinly traded markets: Anempirical analysis of trading and non-trading processes for individual stocksin the Norwegian thinly traded equity market. Applied Financial Economics10: 299-310.
