1 social and economic inequality in the usa you will be able to : identify economic and social...
TRANSCRIPT

1
Social and Economic Inequality in the USAYou will be able to :
Identify economic and social inequalities between the main ethnic groups in the USA.
Explain why these inequalities exist.
Explain what action the Government has taken to reduce these inequalities.
Evaluate how successful Government policies have been.
2
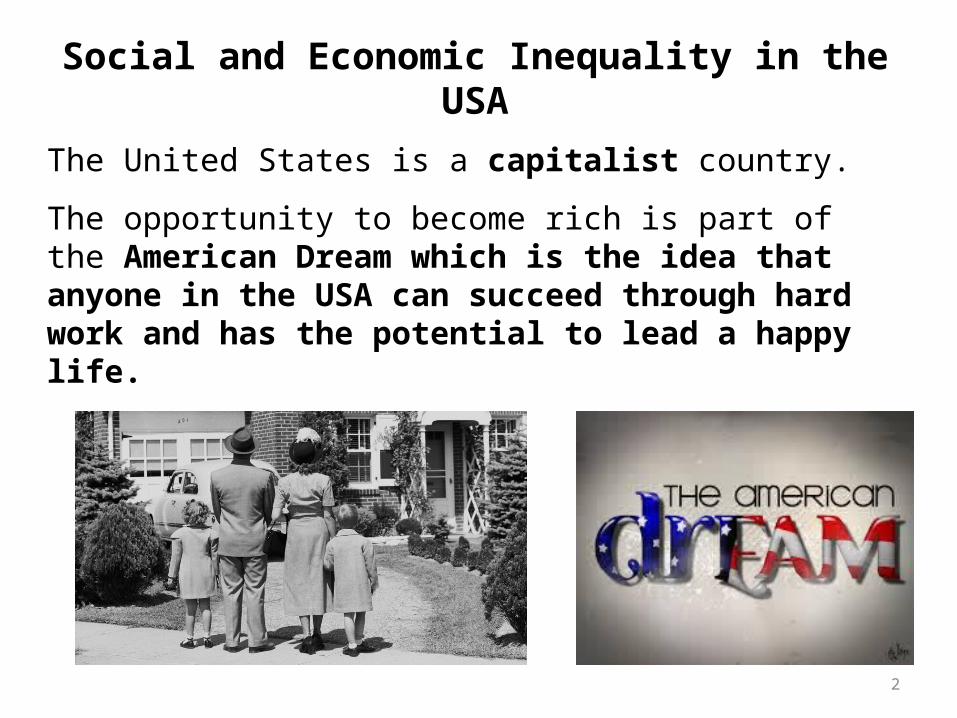
Social and Economic Inequality in the USA
The United States is a capitalist country.
The opportunity to become rich is part of the American Dream which is the idea that anyone in the USA can succeed through hard work and has the potential to lead a happy life.
3
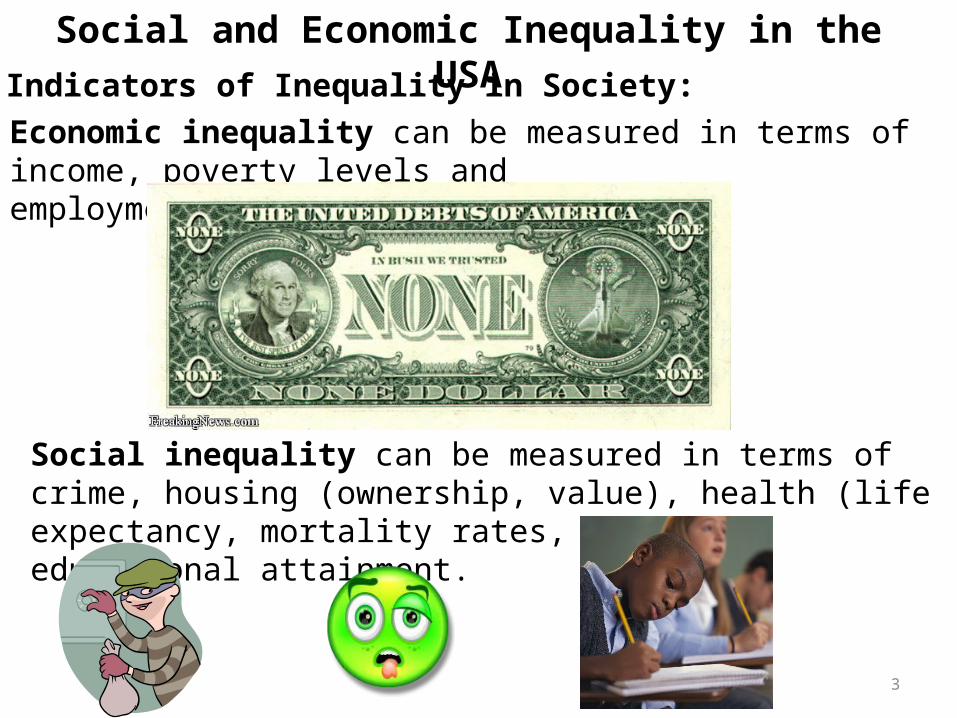
Indicators of Inequality in Society:
Economic inequality can be measured in terms of income, poverty levels and employment/unemployment levels.
Social inequality can be measured in terms of crime, housing (ownership, value), health (life expectancy, mortality rates, etc.) and educational attainment.
Social and Economic Inequality in the USA
4
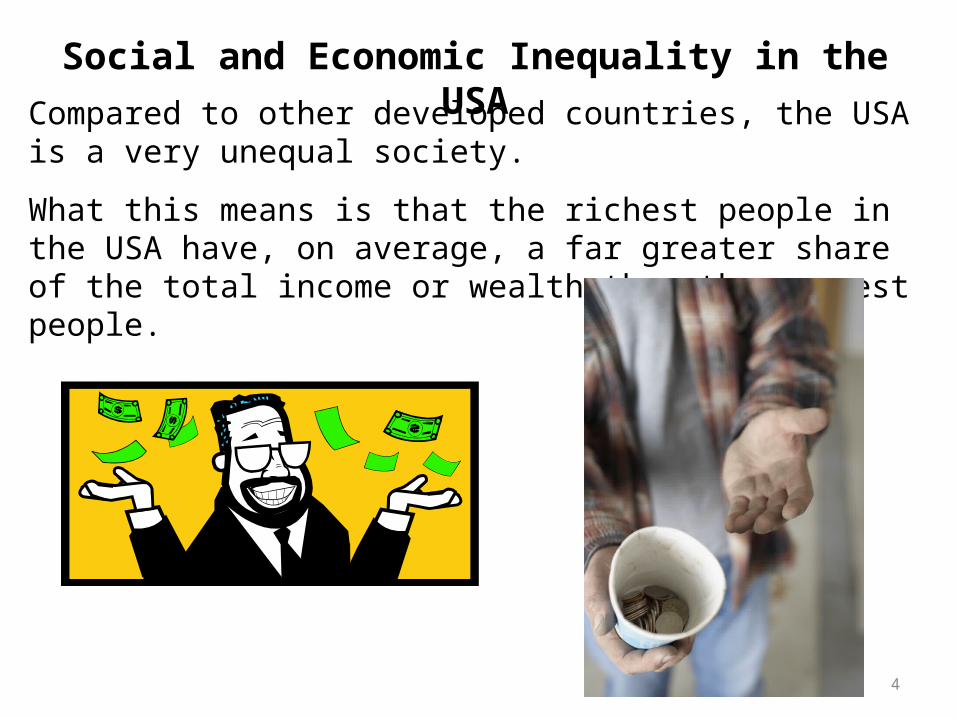
Social and Economic Inequality in the USACompared to other developed countries, the USA is a
very unequal society.
What this means is that the richest people in the USA have, on average, a far greater share of the total income or wealth than the poorest people.

• Gini-coefficient of inequality: This is the most commonly used measure of inequality. The coefficient varies between 0, which reflects complete equality and 100, which indicates complete inequality (one person has all the income or consumption, all others have none).
5
COUNTRY DATE GINI COEFFICIENT
LESOTHO 1995 63.2
SOUTH AFRICA 2005 63.1
ZAMBIA 2004 50.8
MEXICO 2008 48.3
CHINA 2012 47.4
USA 2007 45.0
UK 2009 40.0
MALAWI 2004 39.0
JAPAN 2008 37.6
BANGLADESH 2005 33.2
CANADA 2005 32.1
ETHIOPIA 2000 30.0
SWEDEN 2005 23.0

6
7
Social and Economic Inequality in the USA
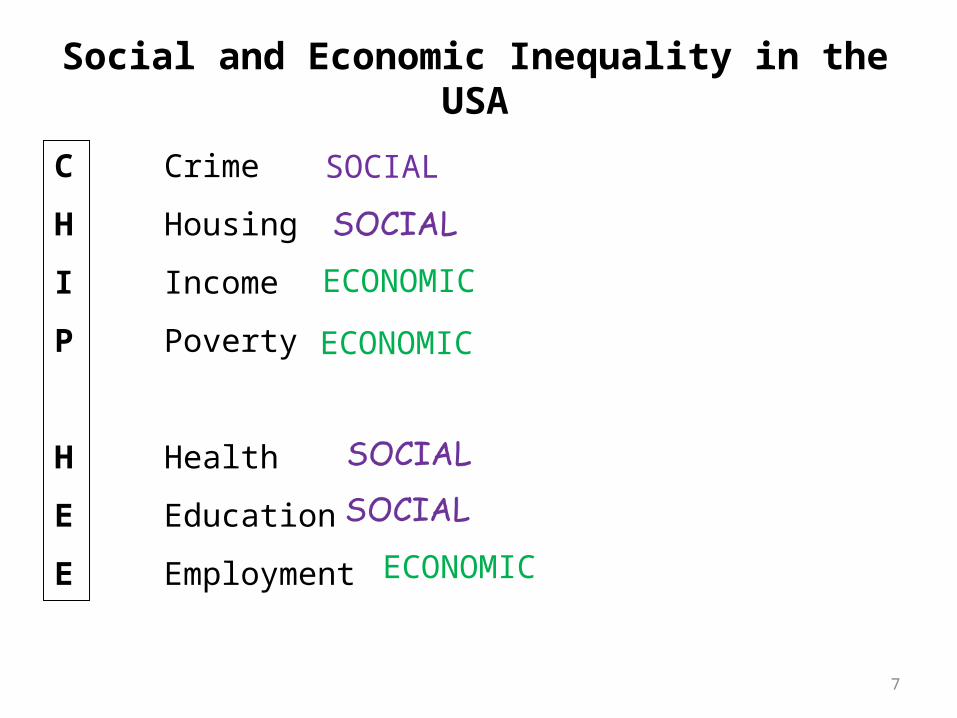
C
H
I
P
H
E
E
Crime
Housing
Income
Poverty
Health
Education
Employment
ECONOMIC
ECONOMIC
ECONOMIC
SOCIAL
8
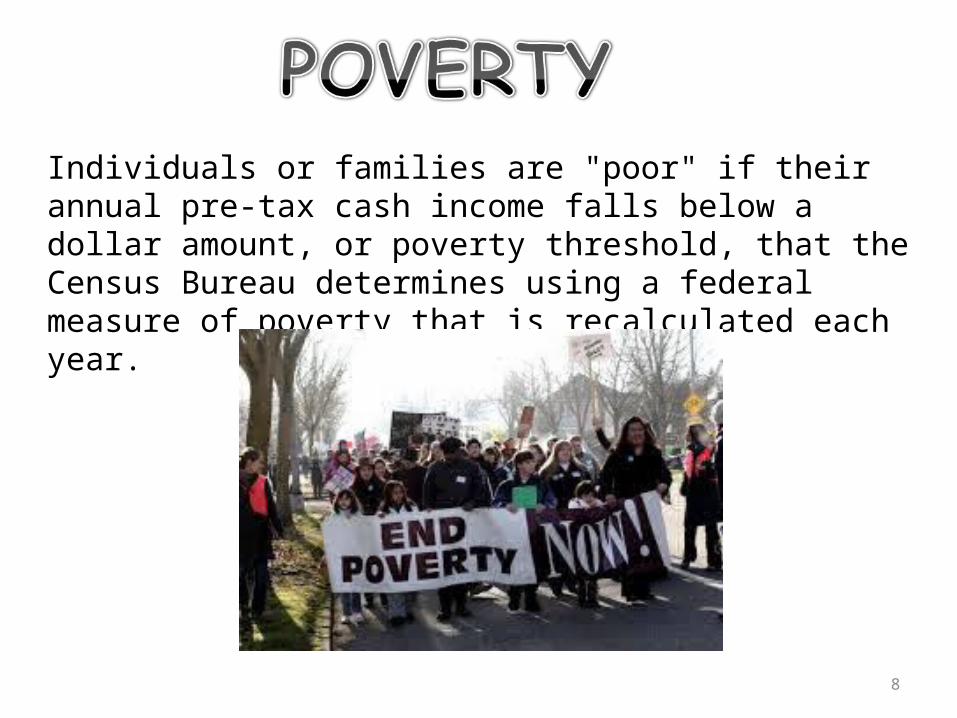
Individuals or families are "poor" if their annual pre-tax cash income falls below a dollar amount, or poverty threshold, that the Census Bureau determines using a federal measure of poverty that is recalculated each year.
9
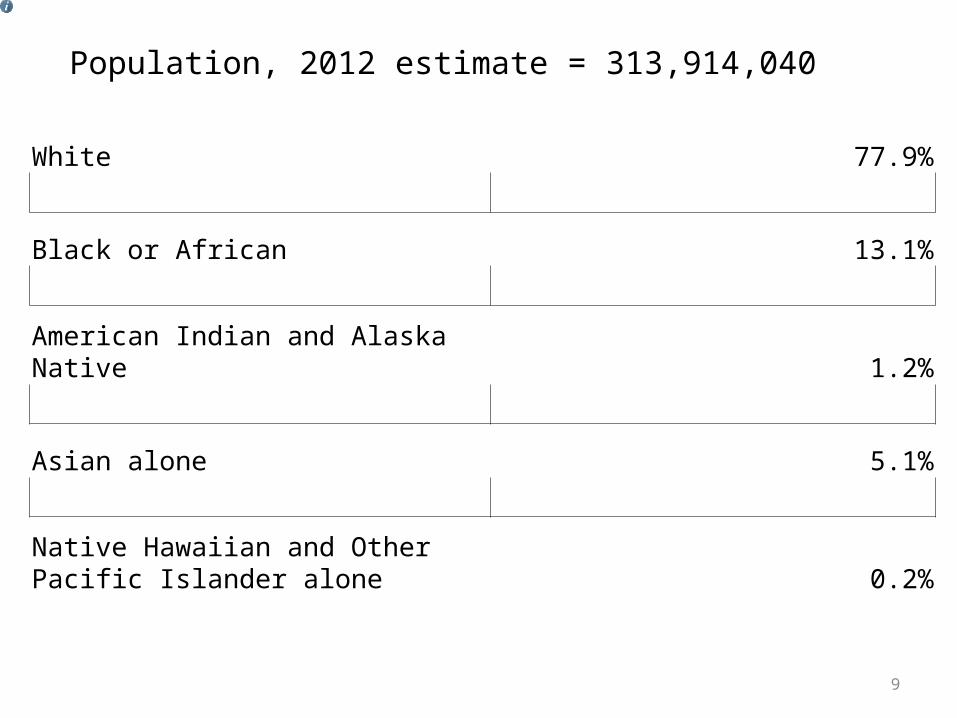
White 77.9%
Black or African 13.1%
American Indian and Alaska Native 1.2%
Asian alone 5.1%
Native Hawaiian and Other Pacific Islander alone 0.2%
Population, 2012 estimate = 313,914,040
10
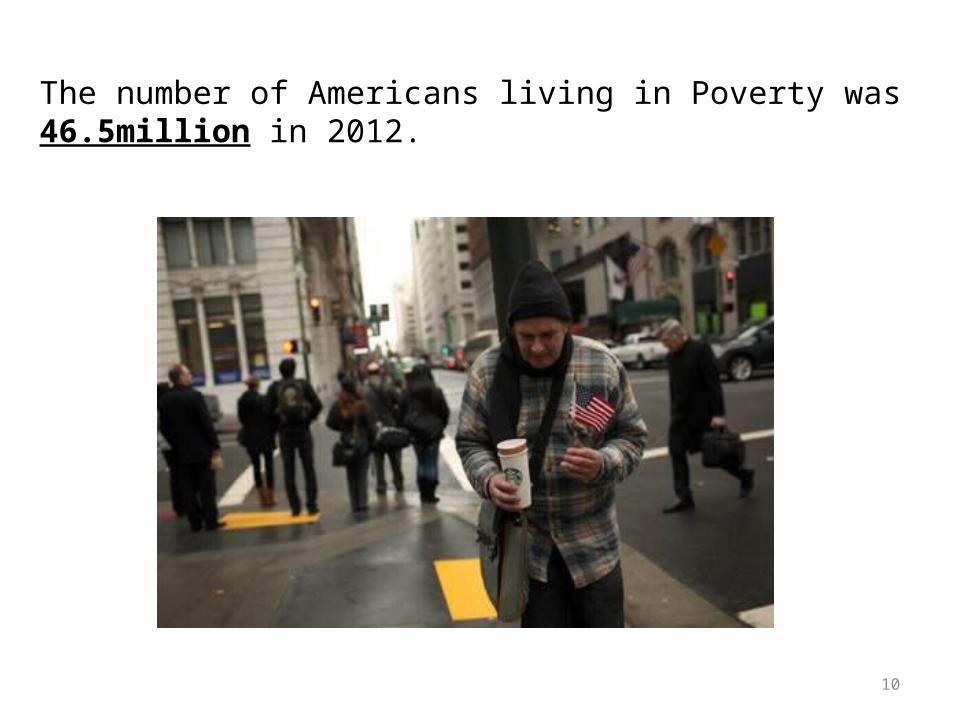
The number of Americans living in Poverty was 46.5million in 2012.
11
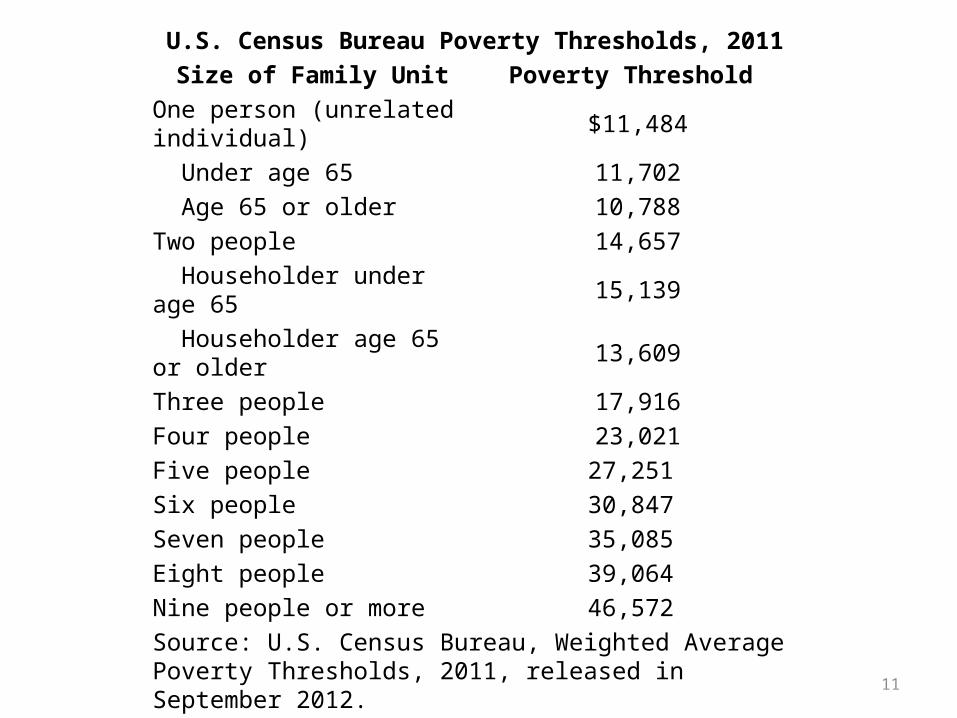
U.S. Census Bureau Poverty Thresholds, 2011Size of Family Unit Poverty Threshold
One person (unrelated individual) $11,484
Under age 65 11,702 Age 65 or older 10,788Two people 14,657
Householder under age 65 15,139
Householder age 65 or older 13,609
Three people 17,916Four people 23,021Five people 27,251 Six people 30,847 Seven people 35,085 Eight people 39,064 Nine people or more 46,572
Source: U.S. Census Bureau, Weighted Average Poverty Thresholds, 2011, released in September 2012.

12
U.S. Department of Health and Human Services Poverty Guidelines, 2013
Persons in Family/Household
Annual Income: 48 Contiguous States
and D.C.
Annual Income: Alaska
Annual Income: Hawaii
1 $11,490 $14,350 $13,2302 15,510 19,380 17,8503 19,530 24,410 22,4704 23,550 29,440 27,0905 27,570 34,470 31,7106 31,590 39,500 36,3307 35,610 44,530 40,9508 39,630 49,560 45,570
>8 persons Add $4,020 for each additional person
Add $5,030 for each additional person
Add $4,620 for each additional person
Source: Federal Register, Vol. 78, January 24, 2013, pp. 5182-5183.
Notes: Separate guidelines for Alaska and Hawaii reflect the Office of Economic Opportunity (OEO) administrative practice beginning in the late 1960s. The poverty guidelines are designated by the year in which they are issued and are updated to account for the last calendar year's increase in prices as measured by the Consumer Price Index.
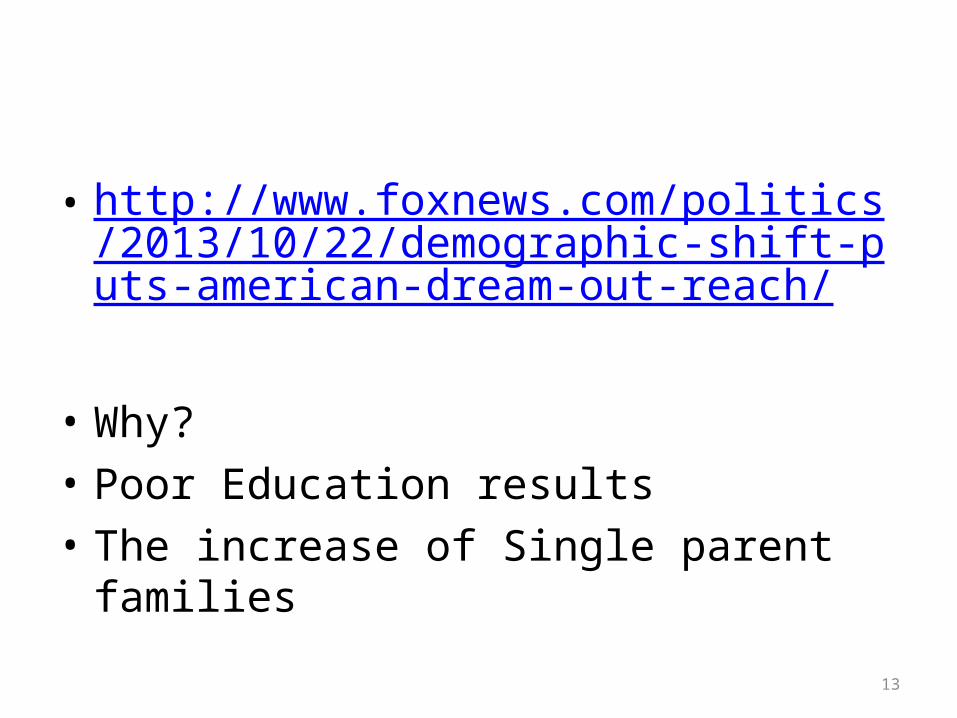
• http://www.foxnews.com/politics/2013/10/22/demographic-shift-puts-american-dream-out-reach/
• Why?• Poor Education results• The increase of Single parent families
13
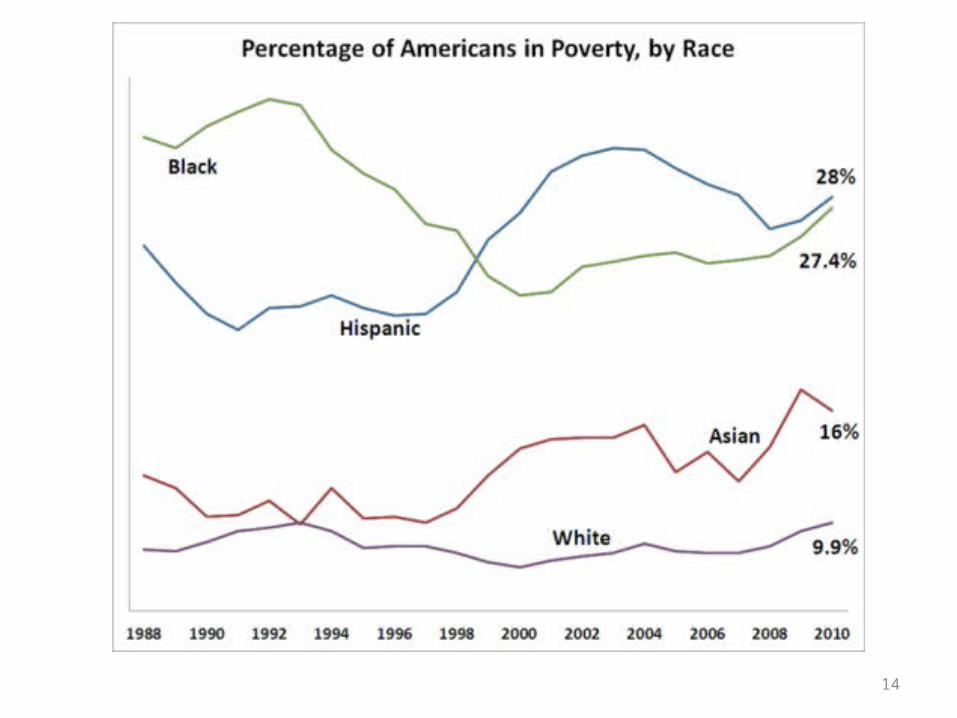
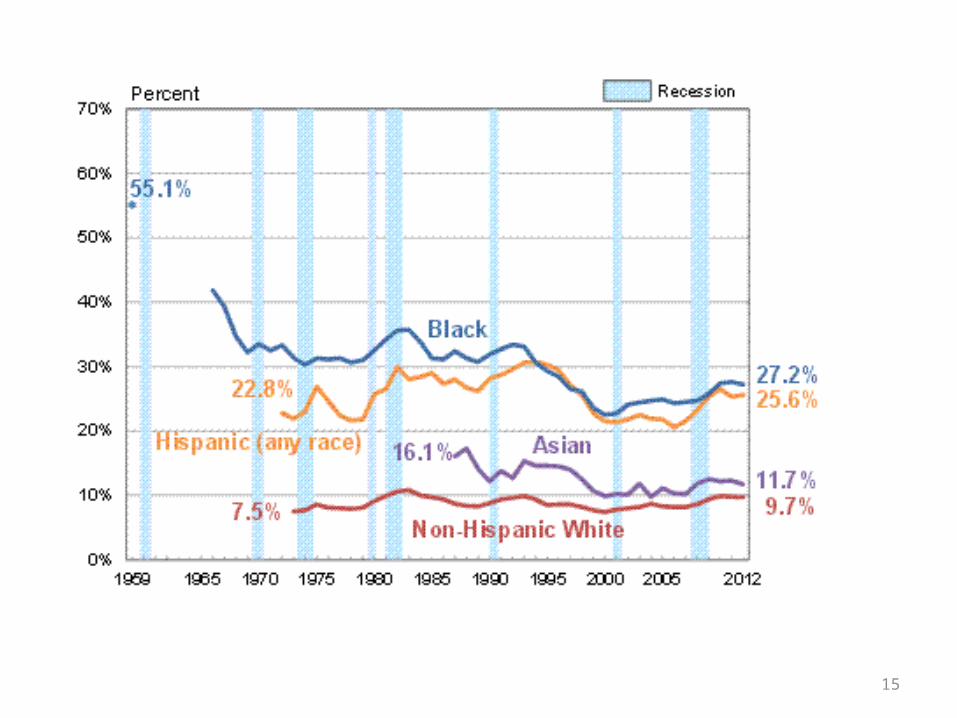
14
15
• Riverbend Food Bank in Moline, IllinoisThe Riverbend Foodbank is a non–profit organisation that collects wholesome donations of food from the food industry for distribution to more than 300 charitable community organisations that support the hungry.
• Compass Family Services in San Francisco, CaliforniaCompass Family Services is a private non-profit organization located in San Francisco, California. The agency's seven programmes provide services to more than 3,000 parents and children each year.
“Compass Family Services breaking the cycle of homelessness and poverty”.
• Unreported World - 4oD - Channel 4#3108162#3108162

Answer the following questions while watching the Film:
1. What is the St Columbanus Church and what does it do?
2. Why do some people not qualify for Government help?
3. How many Americans receive either state or private food assistance?
4. Which state has the highest debt in the USA?
17
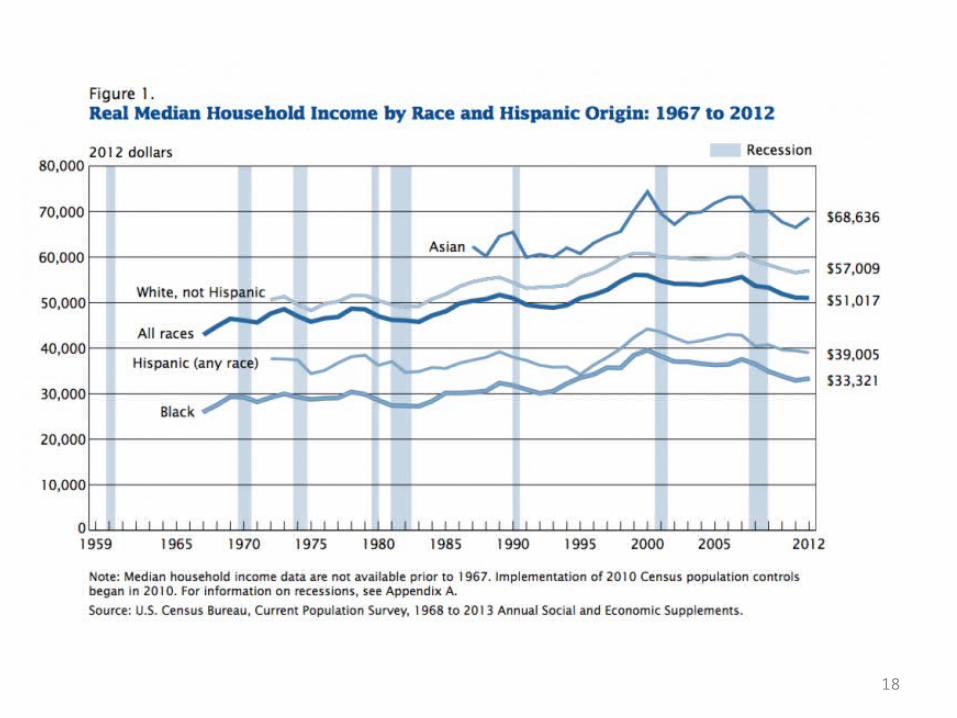
18
19
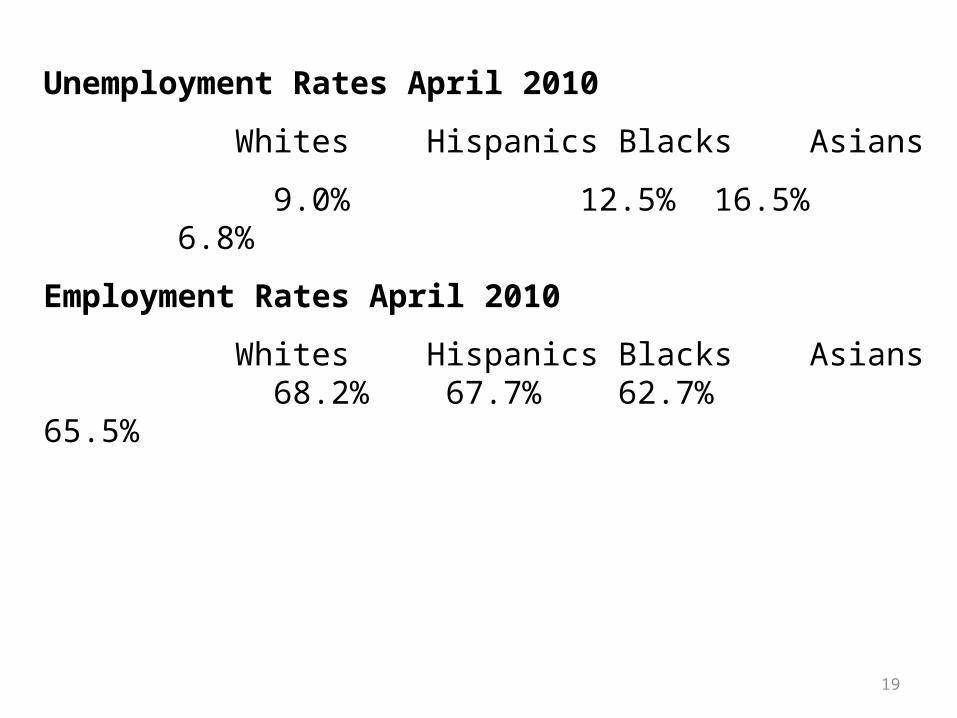
Unemployment Rates April 2010
Whites Hispanics Blacks Asians
9.0% 12.5% 16.5% 6.8%
Employment Rates April 2010
Whites Hispanics Blacks Asians 68.2% 67.7% 62.7%
65.5%
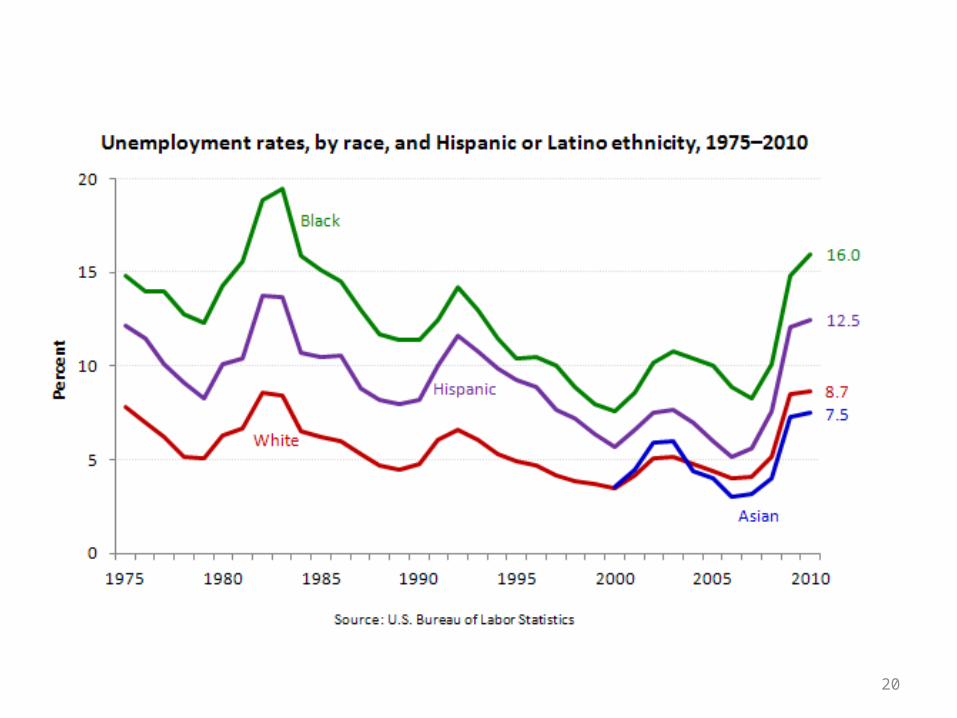
20