1. social media utilization - indocement.co.id · slide 2 - august 2017 q2 results - indocement...
TRANSCRIPT

INDOCEMENT

Slide 2 - August 2017
Q2 Results - Indocement
INDOCEMENT Indonesia Macroeconomic Overview
World Bank anticipates Indonesia’s economy to grow by 5.3% in 2017 and 5.5% in 2018
and 2019 supported by resilient domestic demand and improvement in private investment
IMF: In 2017, growth is expected to rise modestly to 5.1%, led by a gradual pickup in
private investment in response to stronger commodity prices, low interest rates, and a
recovery in external demand on the back of a pickup in global growth and trade
Bank Indonesia reaffirmed its estimate of 5.0% - 5.4% growth rate in the economy for
2017
Overall, we see the cautious early signs of green shoots – where Consumer Confidence
Index remain robust at the end of Q2 2017 with income boosted by Tunjangan Hari Raya,
end of elections, S&P rating upgrade for Indonesia (the last of the three key credit ratings
agencies to give investment grade status).
Source: Indonesia Statistic
Gross Domestic Product %

Slide 3 - August 2017
Q2 Results - Indocement
INDOCEMENT
Indonesian Cement Industry 2017 Landscape
Lafarge Indonesia
1.5 mio ton
0.2 mio ton (g)
Semen Baturaja
2.2 mio ton
0.7 mio ton (g) Semen Indonesia
15.2 mio ton
0.7 mio ton (g)
Semen Puger
0.5 mio ton
Semen Kupang/Merah Putih
0.4 mio ton
Jui Shin
1.8 mio ton
Holcim Indonesia
12.1 mio ton
Semen Indonesia
7.2 mio ton
0.9 mio ton (g)
Merah Putih
4.9 mio ton
2.8 mio ton (g)
Indocement
24.9 mio ton
Total Cement Capacity in 2017 of 103.8* mio tons,
from 98.5 mio tons in 2016
Source: ASI and internal estimation
Anhui Conch
4.5 mio ton
Panasia
1.8 mio ton
Siam Cement
1.8 mio ton
Semen Bosowa
4.4 mio ton
3.0 mio ton (g)
Semen Indonesia
7.4 mio ton
Anhui Conch
2.2 mio ton (g) * Total capacity in 2017 includes Finished Mills from Hao Han (0.6 mt), Semen
Jakarta (1.5 mt), and Sun Fook (0.6 mt)
Slide 4 - August 2017
Q2 Results - Indocement
INDOCEMENT
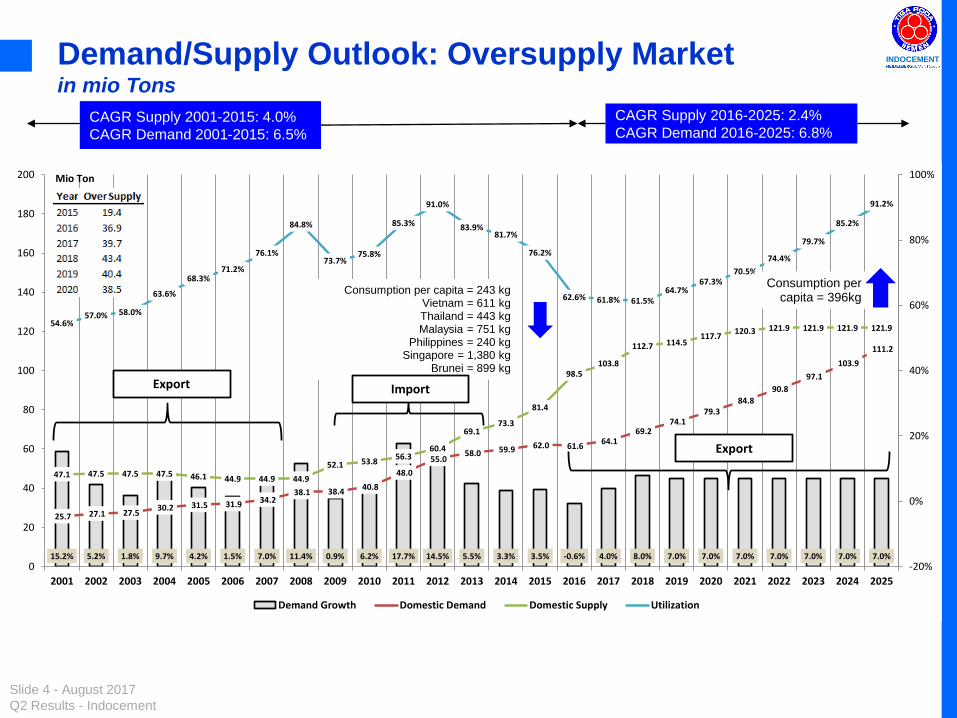
CAGR Supply 2001-2015: 4.0%
CAGR Demand 2001-2015: 6.5%
CAGR Supply 2016-2025: 2.4%
CAGR Demand 2016-2025: 6.8%
Demand/Supply Outlook: Oversupply Market in mio Tons
15.2% 5.2% 1.8% 9.7% 4.2% 1.5% 7.0% 11.4% 0.9% 6.2% 17.7% 14.5% 5.5% 3.3% 3.5% -0.6% 4.0% 8.0% 7.0% 7.0% 7.0% 7.0% 7.0% 7.0% 7.0%
25.7 27.1 27.5 30.2 31.5 31.9 34.2
38.1 38.4 40.8
48.0
55.0 58.0 59.9 62.0 61.6
64.1 69.2
74.1 79.3
84.8
90.8
97.1
103.9
111.2
47.1 47.5 47.5 47.5 46.1 44.9 44.9 44.9
52.1 53.8 56.3
60.4
69.1 73.3
81.4
98.5 103.8
112.7 114.5 117.7
120.3 121.9 121.9 121.9 121.9 54.6%
57.0% 58.0%
63.6%
68.3% 71.2%
76.1%
84.8%
73.7% 75.8%
85.3%
91.0%
83.9% 81.7%
76.2%
62.6% 61.8% 61.5% 64.7%
67.3% 70.5%
74.4%
79.7%
85.2%
91.2%
-20%
0%
20%
40%
60%
80%
100%
0
20
40
60
80
100
120
140
160
180
200
2001 2002 2003 2004 2005 2006 2007 2008 2009 2010 2011 2012 2013 2014 2015 2016 2017 2018 2019 2020 2021 2022 2023 2024 2025
Mio Ton
Demand Growth Domestic Demand Domestic Supply Utilization
Consumption per capita = 243 kg Vietnam = 611 kg Thailand = 443 kg Malaysia = 751 kg
Philippines = 240 kg Singapore = 1,380 kg
Brunei = 899 kg
Export
Export
Import
Consumption per capita = 396kg
Slide 5 - August 2017
Q2 Results - Indocement
INDOCEMENT
25.7 27.1 27.5 30.2 31.5 31.9 34.2 38.1 38.4 40.8
48.0 55.0
58.0 59.9 62.0 61.6
29.4 29.0
3.3% 4.5% 4.8% 5.0% 5.7% 5.5% 6.3% 6.0%
4.6% 6.2% 6.2% 6.0% 5.6% 5.0% 4.7% 5.0% 5.2% 5.1%
15.2%
5.2%
1.8%
9.7%
4.2% 1.5%
7.0% 11.4%
0.9%
6.2%
17.7%
14.5%
5.5% 3.3% 3.5%
-0.6%
2.7%
-1.3%
2001 2002 2003 2004 2005 2006 2007 2008 2009 2010 2011 2012 2013 2014 2015 2016 H12016
H12017
Domestic Demand (mio T) GDP Growth Demand Growth
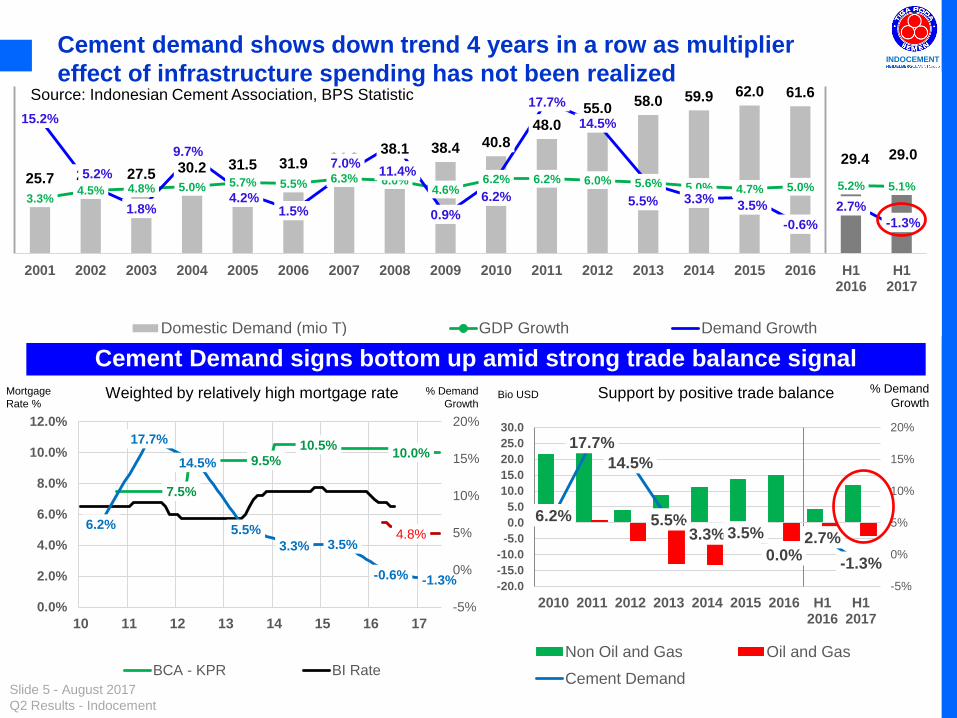
Cement demand shows down trend 4 years in a row as multiplier
effect of infrastructure spending has not been realized
Cement Demand signs bottom up amid strong trade balance signal
Bio USD % Demand
Growth Mortgage
Rate %
% Demand
Growth Support by positive trade balance Weighted by relatively high mortgage rate
Source: Indonesian Cement Association, BPS Statistic
7.5%
9.5% 10.5%
10.0%
4.8% 6.2%
17.7%
14.5%
5.5%
3.3% 3.5%
-0.6% -1.3%
-5%
0%
5%
10%
15%
20%
0.0%
2.0%
4.0%
6.0%
8.0%
10.0%
12.0%
10 11 12 13 14 15 16 17
BCA - KPR BI Rate
6.2%
17.7%
14.5%
5.5% 3.3% 3.5%
0.0% 2.7%
-1.3%
-5%
0%
5%
10%
15%
20%
-20.0
-15.0
-10.0
-5.0
0.0
5.0
10.0
15.0
20.0
25.0
30.0
2010 2011 2012 2013 2014 2015 2016 H12016
H12017
Non Oil and Gas Oil and Gas
Cement Demand
Slide 6 - August 2017
Q2 Results - Indocement
INDOCEMENT
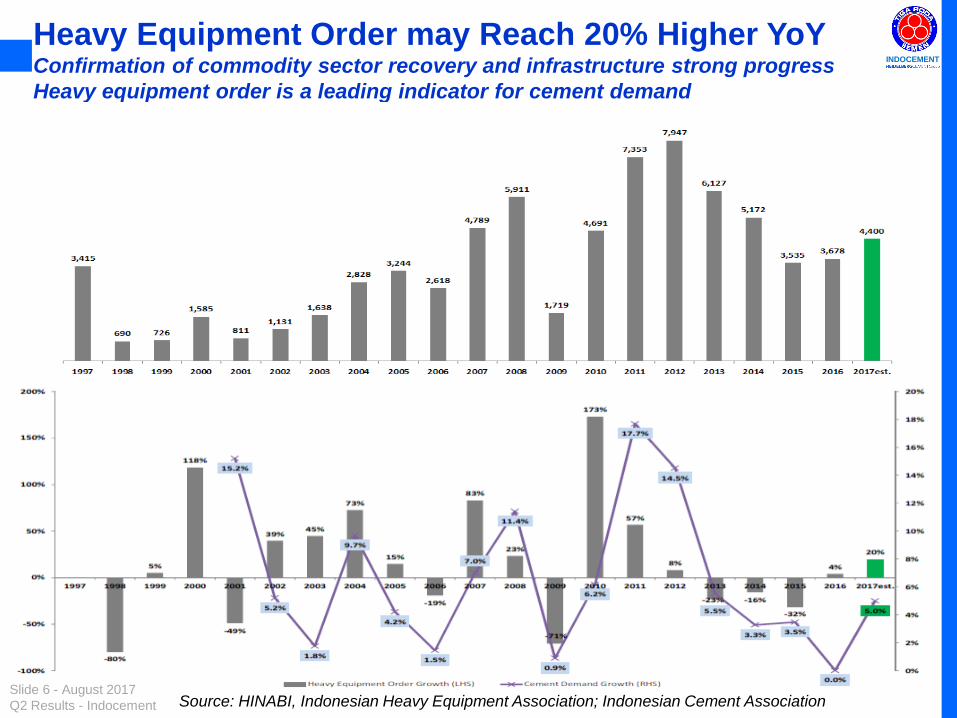
Heavy Equipment Order may Reach 20% Higher YoY Confirmation of commodity sector recovery and infrastructure strong progress
Heavy equipment order is a leading indicator for cement demand
Source: HINABI, Indonesian Heavy Equipment Association; Indonesian Cement Association

Slide 7 - August 2017
Q2 Results - Indocement
INDOCEMENT
Market Growth:
>15%
5-10%
0-5%
<0%
10-15%
Domestic Consumption Growth & Market Share per region YTD June 2017
Source: Indonesia Cement Association
Source: Indonesia Statistic (processed)
Note:
- Lebaran season in June 2017 corrected
the market growth +4.1% in Ytd May
2017.
- Contrary, prior year Lebaran that hit the
market was occurred in July 2016.
- In general Western Part of Java still
having sluggish demand while mid and
east significantly boosted by infra project.
- Outside java is mixture to slightly on
corrective growth (commodity recovery
still not translated to demand).

Slide 8 - August 2017
Q2 Results - Indocement
INDOCEMENT
73% 74% 75% 72% 73% 70% 74% 71% 72% 72% 73% 74%
27%
26%
25%
28%
27%
30%
26%
29%
28% 28%
27%
26%
22%
23%
24%
25%
26%
27%
28%
29%
30%
31%
67%
68%
69%
70%
71%
72%
73%
74%
75%
76%
Q1 '15 Q2 '15 Q3 '15 Q4'15 FY 2015 Q1 '16 Q2 '16 Q3 '16 Q4 '16 FY 2016 Q1 '17 Q2 '17
Java (LHS) Outside Java (RHS)
Java is still key market area in delivering strong results
• On absolute terms Java remains the dominant factors in delivering strong
results
• Indocement is able to protect home market and maintain stable sales, however
declining sales from outside Java brought down total domestic sales
Geographic composition of Sales

Slide 9 - August 2017
Q2 Results - Indocement
INDOCEMENT
14,459 14,568 12,943 12,518
6,068 5,820
3,517 3,931
4,109 3,860
1,838 1,740
-
2,000
4,000
6,000
8,000
10,000
12,000
14,000
16,000
18,000
20,000
2013 2014 2015 2016 H1 '16 H1 '17
In thousand tons
Bag Bulk
The importance of bulk sales continues
• Portion of bag sales is lower than bulk due to declining sales especially in outside Java
for H1 2017
• Composition of bag vs bulk sales in H11 2017 is 77.0% vs. 23.0%
• Indocement positions itself as a reliable partner for infrastructure projects providing
quality bulk cement and concrete at timely delivery
• Stronger focus on increasing
bulk sales
• High bulk volume in Jakarta
• Indocement benefits from
proximity to Jakarta
Bag/Bulk sales composition Jan - Dec
20% 21%
24% 24%
23% 23%

Slide 10 - August 2017
Q2 Results - Indocement
INDOCEMENT
Continuous focus on cost control with disciplined
spending on promotional activities
• Increase in coal price caused increase in fuel and power cost due to gain in running the most
efficient kilns.
• Manufacturing Overhead portion decreases due to cost savings activities including repairs.
• Ramping up of P14 kiln in H1 already starts to deliver savings; full savings expected starting in H2.
• Increase in SG&A relates to additional cost to support end user program and Rajawali promotion.
Fixed Cost Control – bio IDR Composition of Manufacturing Cost as %
Trend
25.4% 10.5% 42.8% 21.3%
25.7%
10.3%
40.9%
23.1%
23.2%
11.4%
44.4%
21.0%
0%
10%
20%
30%
40%
50%
Raw Materials Direct labor Fuel andPower
Man.Overhead
Jan - Jun 2015 Jan - Jun 2016 Jan - Jun 2017
1,095
965 1,027
340 319 326
-
200
400
600
800
1,000
1,200
H1 2015 H1 2016 H1 2017
Selling Expense G&A Expense
-7%
+7%
-12%
-6%
+6%
+2%

Slide 11 - August 2017
Q2 Results - Indocement
INDOCEMENT
Continue in Cost Leadership to maintain a decent margin
in H1 2017
Continue competitive environment, Management focus on taking respective initiatives early on during
the year:
Operational Excellence program
Fixed cost reduction program
Managing efficient kiln utilization
INTP EBITDA margin development
New market entrants leading to higher competition and pricing pressure
but Indocement maintains better margin compared to peers
INTP Gross margin development
44.5% 45.0% 44.6% 44.4%
43.2% 41.8% 41.7% 41.2%
34.5% 34.2%
0.0%
10.0%
20.0%
30.0%
40.0%
50.0%
Jan-Mar Jan-Jun Jan-Sep Jan-Dec
2015 2016 2017
34.8% 34.5% 34.0% 33.8%
33.9% 31.8% 31.1% 30.3%
22.3% 22.0%
0.0%
5.0%
10.0%
15.0%
20.0%
25.0%
30.0%
35.0%
40.0%
Jan-Mar Jan-Jun Jan-Sep Jan-Dec
2015 2016 2017

Slide 12 - August 2017
Q2 Results - Indocement
INDOCEMENT
H1 2017 H1 2016
Bio IDR Bio IDR %
Total Sales Volume (thousand tons) 7,932 8,129 -196.1 -2.4%
Domestic Sales Volume (thousand tons) 7,829 7,938 -109.2 -1.4%
Export Sales Volume (thousand tons) 103 190 -86.9 -45.7%
Net Revenues 6,543.7 7,741.9 -1,198.2 -15.5%
Cost of Revenues -4,302.5 -4,507.0 204.5 4.5%
GROSS PROFIT 2,241.2 3,234.9 -993.7 -30.7%
% of Net Revenues 34.2% 41.8%
Operating Expenses -1,352.7 -1,283.7 -69.0 -5.4%
Other Operating Income - Net 6.1 16.7 -10.6 -63.3%
OPERATING INCOME 894.6 1,967.9 -1,073.3 -54.5%
% of Net Revenues 13.7% 25.4%
EBITDA 1,438.8 2,460.6 -1,021.8 -41.5%
% of Net Revenues 22.0% 31.8%
Finance Income - Net 238.0 266.8 -28.8 -10.8%
Equity in Net Earnings of Associated Companies - Net 4.2 12.3 -8.1 -66.2%
INCOME BEFORE FINAL TAX AND INCOME TAX EXPENSE 1,136.8 2,247.0 -1,110.2 -49.4%
Final Tax -0.3 -0.4 0.0 11.9%
INCOME BEFORE INCOME TAX EXPENSE 1,136.5 2,246.7 -1,110.2 -49.4%
Income Tax Benefit (Expense) - Net -234.7 182.5 -417.2 -228.6%
INCOME FOR THE PERIOD 901.8 2,429.2 -1,527.3 -62.9%
Other Comprehensive Income (Loss) for the Period, Net of Tax 0.7 -6.2 6.9 110.7%
TOTAL COMPREHENSIVE INCOME FOR THE PERIOD 902.5 2,422.9 -1,520.4 -62.8%
VarianceDescription
Bio IDR
Financial Result Consolidated Statement of Comprehensive Income
• Operating margin reduction from 25.4% to 13.7% contributed by lower revenues by -15.5% due to strong competition on weak
demand situation which impact was reduced by cost efficiency in production (+4.5%) amidst cost pull from current soaring coal price.
• Active end user program initiated at beginning of year to support the volume performance.

Slide 13 - August 2017
Q2 Results - Indocement
INDOCEMENT Balance Sheet Consolidated Statement of Financial Position
• Outside dividend payment impact, inventories balance increased to anticipate peak volume in 2nd half.
Inline with production, payable balance slightly higher.
• Increase in Non-Current Assets compare to same period last year was mainly due to spending in capital
expenditures.
• Dividend Payment history:

Slide 14 - August 2017
Q2 Results - Indocement
INDOCEMENT Our P14 in Citeureup has already started
• Kiln line already fully operational starting end of last year and savings already started with full
benefit expected in H2.
• Currently its benefit USD 4-5/t.
A new Tiga Roda cement plant, with annual
installed production capacity of 4.4 million
cement at Citeureup, Bogor - Indonesia.
IDR ~6 Trillion investment.
A production line that equipped with modern and energy efficient facility.
Designed to utilized alternative fuels and materials and owns state-of-art emission system and
environment-friendly production facility with bag filter as effective dust filter in all production lines.
Slide 15 - August 2017
Q2 Results - Indocement
INDOCEMENT
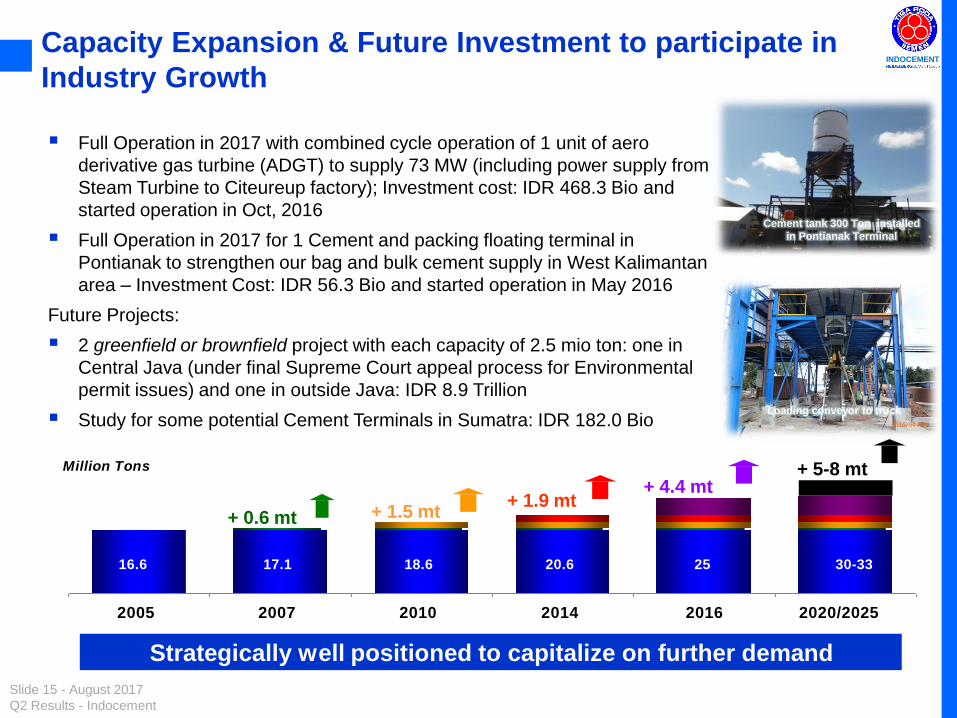
Full Operation in 2017 with combined cycle operation of 1 unit of aero
derivative gas turbine (ADGT) to supply 73 MW (including power supply from
Steam Turbine to Citeureup factory); Investment cost: IDR 468.3 Bio and
started operation in Oct, 2016
Full Operation in 2017 for 1 Cement and packing floating terminal in
Pontianak to strengthen our bag and bulk cement supply in West Kalimantan
area – Investment Cost: IDR 56.3 Bio and started operation in May 2016
Future Projects:
2 greenfield or brownfield project with each capacity of 2.5 mio ton: one in
Central Java (under final Supreme Court appeal process for Environmental
permit issues) and one in outside Java: IDR 8.9 Trillion
Study for some potential Cement Terminals in Sumatra: IDR 182.0 Bio
16.6 30-33 17.1 18.6 20.6 25
2005 2007 2010 2014 2016 2020/2025
Million Tons
+ 0.6 mt + 1.5 mt + 1.9 mt
+ 4.4 mt + 5-8 mt
Strategically well positioned to capitalize on further demand
Capacity Expansion & Future Investment to participate in
Industry Growth
Cement tank 300 Ton installed
in Pontianak Terminal
Loading conveyor to truck

Slide 16 - August 2017
Q2 Results - Indocement
INDOCEMENT
Ready Mix Concrete and Aggregates Expansion • Strengthening Ready-Mix Concrete business particularly high-
grade quality in order to meet the increase demand of
infrastructure development in Indonesia.
• Current focus is on infrastructure projects and its domino-effect on
development of residential, industrial area and high rise building.
• H1 2017 sales volume decreased by 27.1% due to slowing down
construction activities across Indonesia and lower economic growth
in general as well as heavy competition.
• Pionirbeton, a subsidiary, is one of market leaders in RMC
business.
• Secured concrete market by signing exclusive and long-term
contract of andesite and sand supply from Ketapang and Belitung.
800 630 683
930 956
1,221
2,429
3,517
4,430
3,947
3,377
2,988
1,483
1,081
0
300
600
900
1,200
1,500
1,800
2,100
2,400
2,700
3,000
3,300
3,600
3,900
4,200
4,500
4,800000m3
RMC Sales Volume AGG Sales Volume

Slide 17 - August 2017
Q2 Results - Indocement
INDOCEMENT CEMENT MARKET Outlook for 2017
Market Condition
• National cement consumption growth started to turn positive and expected to
grow around 4-5% in 2017 (versus negative growth of -0.6% in 2016)
• Consumption in 2017 will increase in line with higher Government’s projects and
some commercial and residential projects after Tax Amnesty, decrease of
mortgage (KPR) interest, loosened regulation on LTV ratio, second mortgage
availability for “off-plan” properties, reduction in tax for transfer of ownership,
clarity in property ownership by foreigners, and simplification of regulations.
• Strong concrete and bulk cement demand anticipated in outside Java and more
spread area in Java due to faster Government’s infrastructure projects in 2017
Expansion in Cement Terminals and Batching Plants are required.
• Over supply of about 36.9 mio tons in 2016 and up to 39.7 mio tons in 2017 will
change the cement market outlook and we expect the continuing tight
competition among 19 brands from 15 players (from 9 brands and 9 players
previously)
• Recent hike in coal price will curb the potential further drop in prices in near
future and possible consolidation. Coal price has slide back to $75.5 in June
2017 from peak of $102 in December 2016 however, remain considerably higher
than last year.

Slide 18 - August 2017
Q2 Results - Indocement
INDOCEMENT Indocement’s Action Plan in 2017
• Run P14 production (10,000 tpd) in full-swing in 2017 will help to reduce further
production cost by about USD 4-5 per ton
• Optimize product mix from 13 line of cement production will bring competitive
advantages of Indocement to introduce different types of cement (OPC, PCC,
PPC, TR Rapid, PCC Industry and future products- slag cement)
• Clinker exports and domestic clinker sales will be done more during
oversupply. (2016: cement export 72,000 ton, clinker export 319,000 ton; target
2017: cement export 168,000 ton, clinker export 333,000 ton)
• Strengthen our Pull demand in bagged cement segment from end-user
customers and Retail/ Distribution channel to strengthen our Brand, TIGA
RODA Cement
• Using RAJAWALI brand as fighting brand to get some volume for customer
who perceive cement as “commodity” product and in low-price cement
segment - in competition with 2nd tier brands out of new players
• Develop new business line of prefabricated affordable housing products
“Rumah Pabrikasi Indocement” through new subsidiary
• Strong balance sheet with no gearing is an important winning factor in
competition and in future consolidation phase if happen in near future

Slide 19 - August 2017
Q2 Results - Indocement
INDOCEMENT New Brand of “RAJAWALI” as “fighting brand”
• Through its existing distribution
channel, Rajawali was initially
launched on Oct 10, 2016 with
presence in three cities in 2016
and already available in 30 cities,
like: Jakarta, 15 cities in West
Java, 6 Cities in Banten, and 8
Cities in Central Java.
Sticky, Strong & More
environmentally cement
product!!!
• Quality assurance from Indocement.
• Produced with Indocement standard
technology, equipment and materials,
• Semen Rajawali has a very consistent
quality.
• Not easy to crack.
• Specially designed for easy builders as it
suitable for any building type from
structural work, plaster, acian and others.
• Manufactured with environmentally
friendly technology.
• … Affordable prices!
Video:
https://youtu.be/Q9DXnCHEH3U

Slide 20 - August 2017
Q2 Results - Indocement
INDOCEMENT End User Program
source: www.sementigaroda.com

INDOCEMENT
42 Years Building Indonesia KOKOH
THANK YOU

Slide 22 - August 2017
Q2 Results - Indocement
INDOCEMENT Important Notice Disclaimer
This presentation contains general information which provided without any representations or warranties, express or implied and does not
constitute or form part of, and is not made in connection with, any offer for sale or subscription of or solicitation, recommendation, or invitation of
any offer to buy or subscribe for any securities nor shall it or any part of it form the basis of or be relied on in connection with any contract,
commitment, or investment decision whatsoever.
Terms of Use
Slides prepared in this presentation are strictly confidential and have been prepared as a support for verbal discussions only. The information
contained in this presentation is being presented to you solely for your information and may not be reproduced or redistributed to any other person,
in whole or in part. You acknowledge that, because of the limited nature of communication through our presentation features, any assistance you
may receive using any such features is likely to be incomplete and may even be misleading.
Forward-Looking Statements
This presentation includes forward-looking statements, which are based on the expectation or forecast about future events, formed by Indocement
after reviewing existing data and research. Such statements involve known and unknown risks including factors such as: (i)Global macroeconomic
and geopolitical situations; (ii) Indonesia macroeconomic and geopolitical situation; (iii) Competition from incumbents and new players; (iii)
Changes in laws, regulation, taxation, or accounting standards or practices; (iv) Acquisitions, divestitures, and various business opportunities that
we may pursue; (v)Force majeure; (vi)Labor unrest or other similar situations; (vii)Outcome of pending or threatened litigation
Indocement does not give assurance that such outcome will be attained. If you have any specific questions about any legal, financial or tax matter,
you should consult your lawyer/financial/tax Consultant or other professional legal services provider.
For further information please contact
PT Indocement Tunggal Prakarsa Tbk.
Wisma Indocemen, 8th Floor
Jl. Jend. Sudirman Kav 70 - 71
Jakarta 12910, Indonesia
Phone : +62 21 2512121
e-mail: [email protected].
©2017, PT Indocement Tunggal Prakarsa Tbk. All rights reserved.