1. survey design issues and child outcome measures in the millennium cohort study lisa calderwood...
TRANSCRIPT

1

Survey design issues and child outcome measures in the Millennium Cohort Study
Lisa CalderwoodSenior Survey ManagerCentre for Longitudinal Studies
Sub-brand to go here
CLS is an ESRC Resource Centre based at the Institute of Education

Introduction to the Millennium Cohort Study
Methodological and design issues
Child outcome measures
Outline of presentation
An introduction to the Millennium Cohort Study

Millennium Cohort Study (MCS)• Longitudinal birth cohort study following over 19,000
children born in the UK in 2000/2001• Four sweeps so far at 9 months, 3 years, 5 years
and 7 years, next planned for 11 years• Funded by UK Economic and Social Research
Council (ESRC) and UK government departments• Over sampled places in Scotland, Wales and
Northern Ireland, areas with high child poverty and in England areas with higher minority ethnic populations
• One of four British Birth Cohort Studies

British Birth Cohort Studies
MCS: the first national birth cohort study for 30 years
Previous UK/GB National Studies:
1946: MRC National Survey of Health & Development
1958: National Child Development Study (NCDS)
1970: 1970 British Birth Cohort Study
1958, 1970 & MCS based at CLS
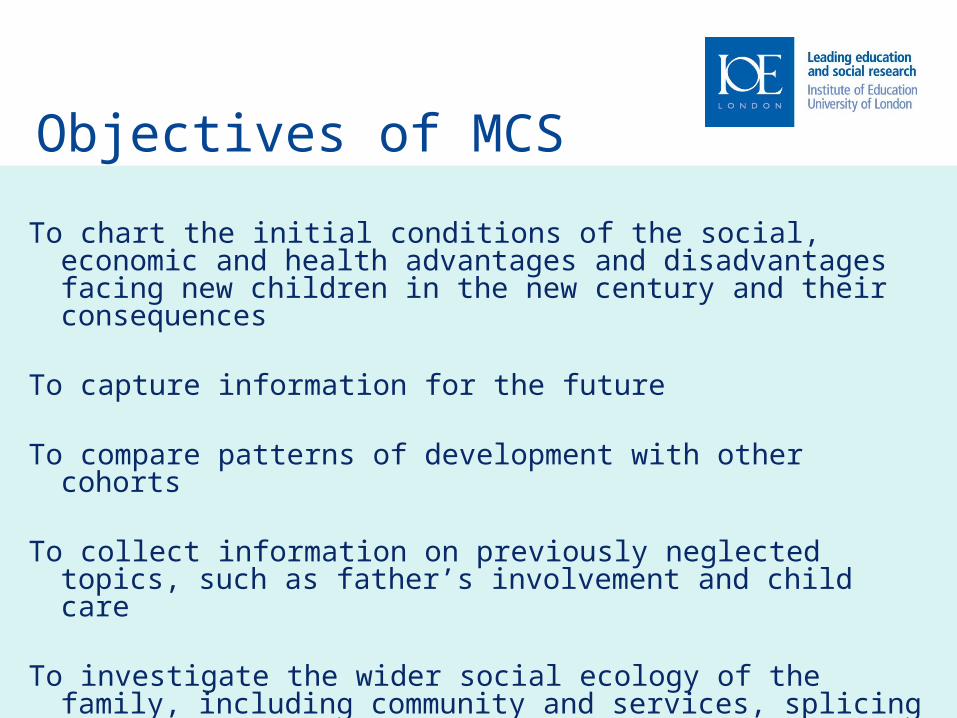
Objectives of MCS
To chart the initial conditions of the social, economic and health advantages and disadvantages facing new children in the new century and their consequences
To capture information for the future
To compare patterns of development with other cohorts
To collect information on previously neglected topics, such as father’s involvement and child care
To investigate the wider social ecology of the family, including community and services, splicing in geo-coded data
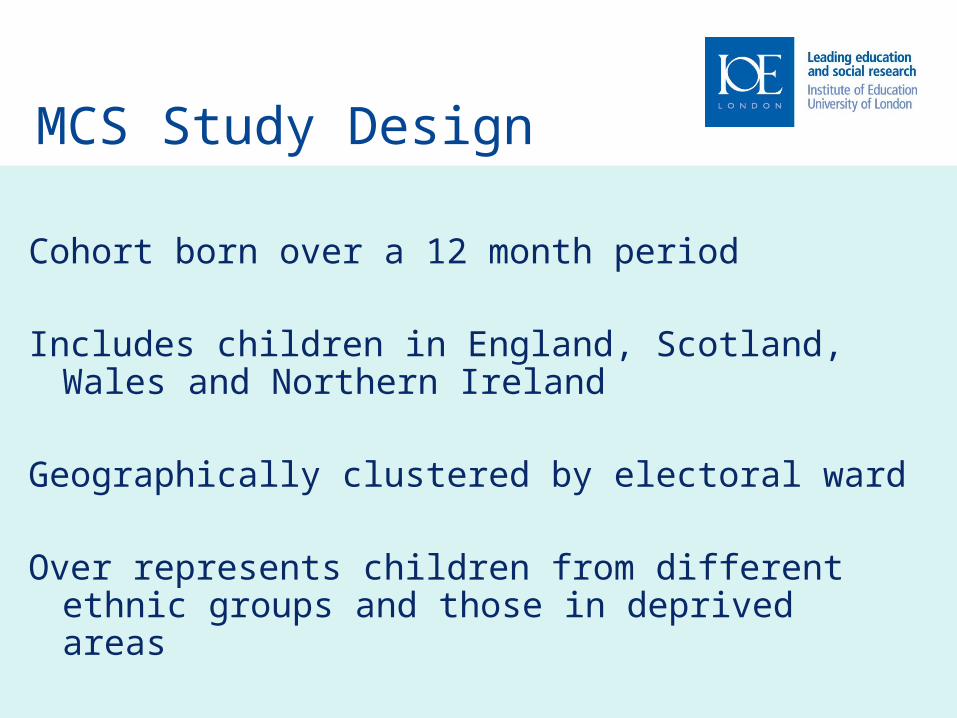
MCS Study Design
Cohort born over a 12 month period
Includes children in England, Scotland, Wales and Northern Ireland
Geographically clustered by electoral ward
Over represents children from different ethnic groups and those in deprived areas

MCS Sample Design
Stage 1: Selection of electoral wards (398)oEthnicoDisadvantagedoAdvantaged
Stage 2: Selection of families (27201)oFrom child benefit records held by Department of Work
and Pensionso18,552 families recruited at 9 months + 692 families at 3
years = 19,244 families

MCS: Number of interviewed families by sweep
COUNTRYTotal
Cohort
MCS1 Achieved Sample
(Total)
MCS2 Achieved Sample (Total)
MCS3 Achieved Sample (Total)
MCS4
Achieved Sample
(Total)
ENGLAND 12,225 11,532 10,050 9,717 8,839
WALES 2,760 2,761 2,261 2,181 2,018
SCOTLAND 2,336 2,336 1,814 1,814 1,628
N IRELAND 1,923 1,923 1,465 1,534 1,372
TOTAL UK 19,244 18,552 15,590 15,246 13,857

MCS Sponsors
UK Economic & Social Research CouncilONS consortium of UK Government Departments:oOffice for National StatisticsoDepartment for Children, Schools and FamiliesoDepartment for Work and PensionsoDepartment of HealthoWelsh Assembly GovernmentoScottish GovernmentoNI ExecutiveSureStart - National Evaluation in EnglandChildren’s Fund - National Evaluation in England

Content of MCS Surveys9m Age 3 Age 5 Age 7 Age 11
Interview (and self-completion) with both resident parents
Cognitive assessments
Physical measurements
Child self-completion
Older Siblings
Interviewer Observations
Teacher Survey
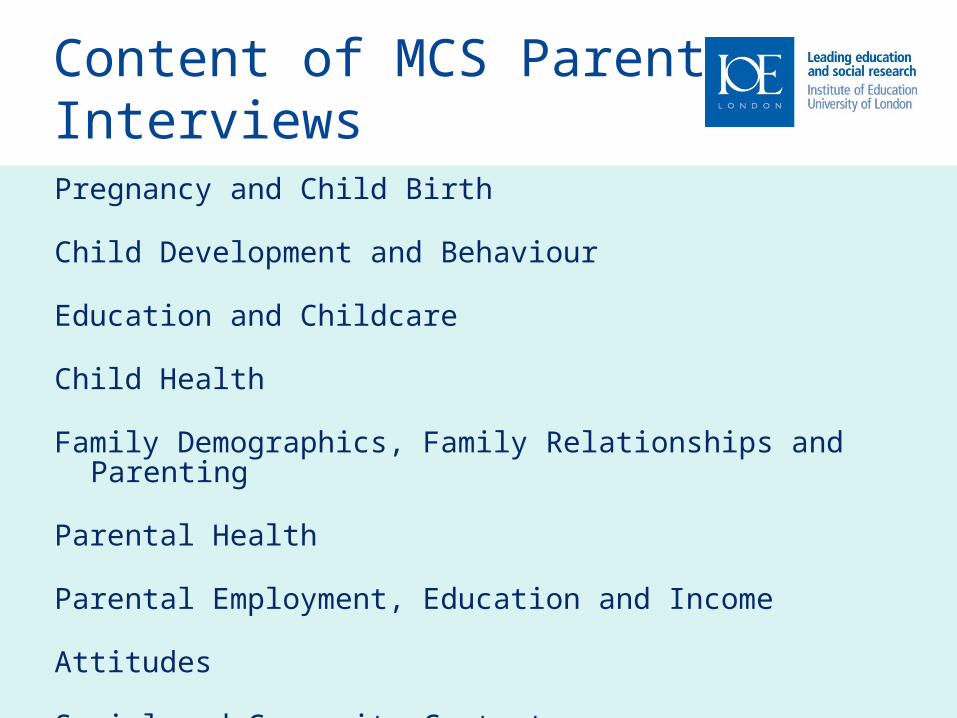
Content of MCS Parent InterviewsPregnancy and Child Birth
Child Development and Behaviour
Education and Childcare
Child Health
Family Demographics, Family Relationships and Parenting
Parental Health
Parental Employment, Education and Income
Attitudes
Social and Community Context

Administrative data linkage on MCS
Cohort Member
Siblings Parents
Health
Education
Economic

MCS Add on studiesCollection of bio-markers
• Oral fluid sample for exposure to infections at age 3• Shed milk teeth for lead from age 6 upwards• Saliva samples for DNA from mothers, fathers and
children at age 11? Physical activity monitoring at age 7 Sub-studies
• Mothers who had assisted fertility treatment• Nursery observations at age 3
Methodological studies• Predicting and preventing non-response

Methodological and design issues

Theoretical framework
Groves at al. (1989): Total Survey Error
Non-observational Observational
Coverage Measurement
Sampling
Non-response
18
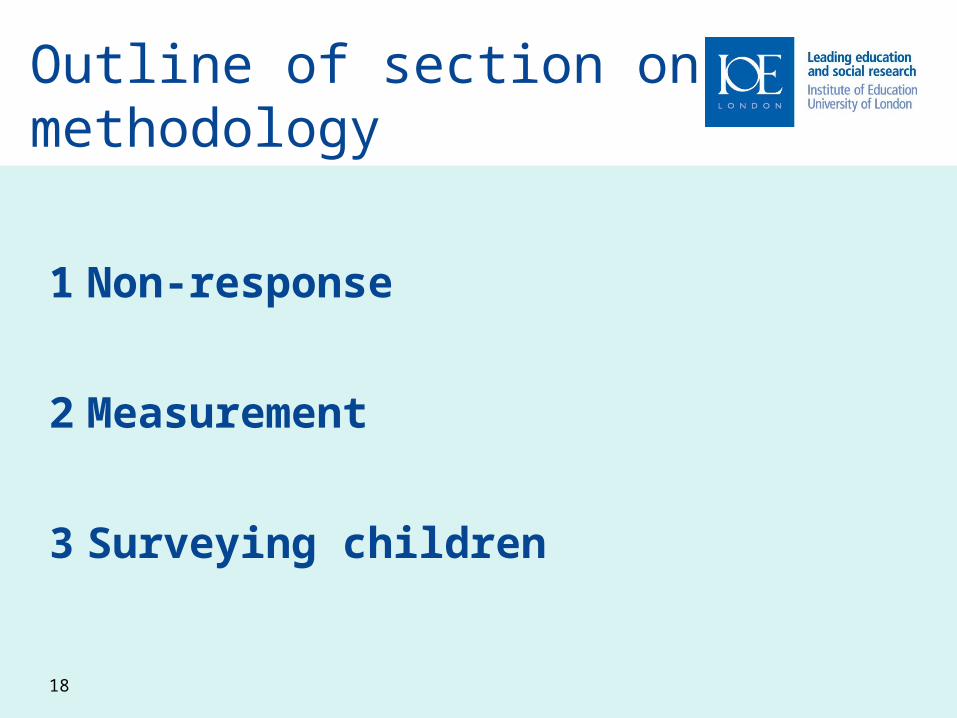
1 Non-response
2 Measurement
3 Surveying children
Outline of section on methodology
Methodology 1: Non-response

Non-response in longitudinal surveys
• Different sources of attrition: location, contact and co-operation e.g. Lepkowski and Couper (2002), Lynn et al. (2002)
• Many longitudinal surveys have developed highly successful strategies to minimise attrition through failure to locate and failure to co-operate

• Response rate at baseline sweep was 72%
• Response rate differed by country:– lowest in Northern Ireland (66%)
• Response rate differed by ward type: – lowest in ethnic areas (66%)– lower in disadvantaged than advantaged (72% vs.
76% in England)
Response rates at MCS1(Baseline)
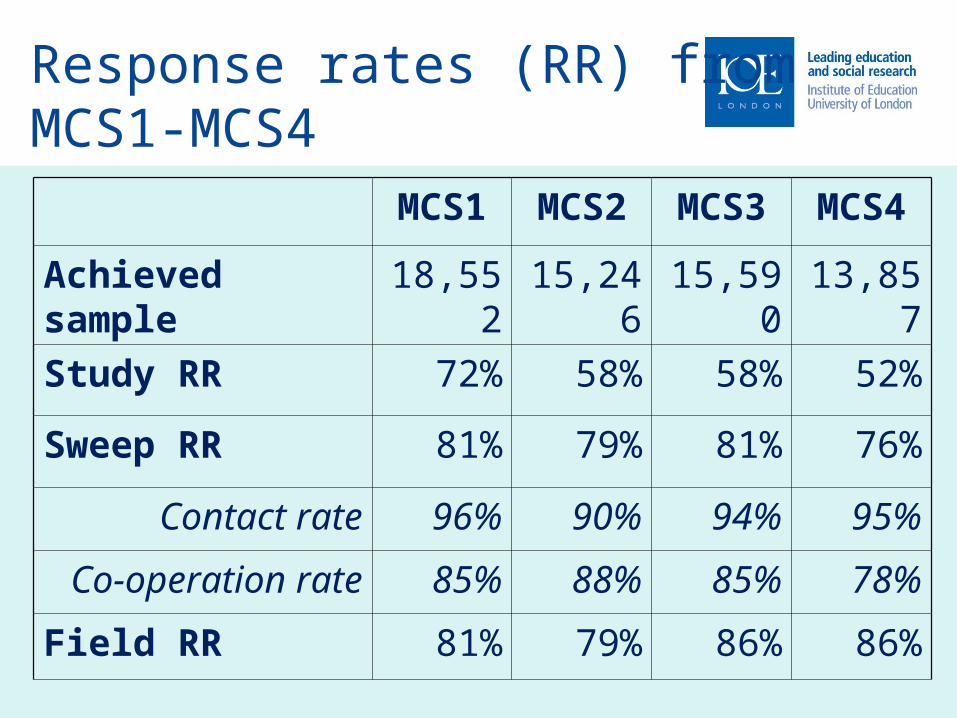
Response rates (RR) from MCS1-MCS4
MCS1 MCS2 MCS3 MCS4
Achieved sample 18,552 15,246 15,590 13,857
Study RR 72% 58% 58% 52%
Sweep RR 81% 79% 81% 76%
Contact rate 96% 90% 94% 95%
Co-operation rate 85% 88% 85% 78%
Field RR 81% 79% 86% 86%
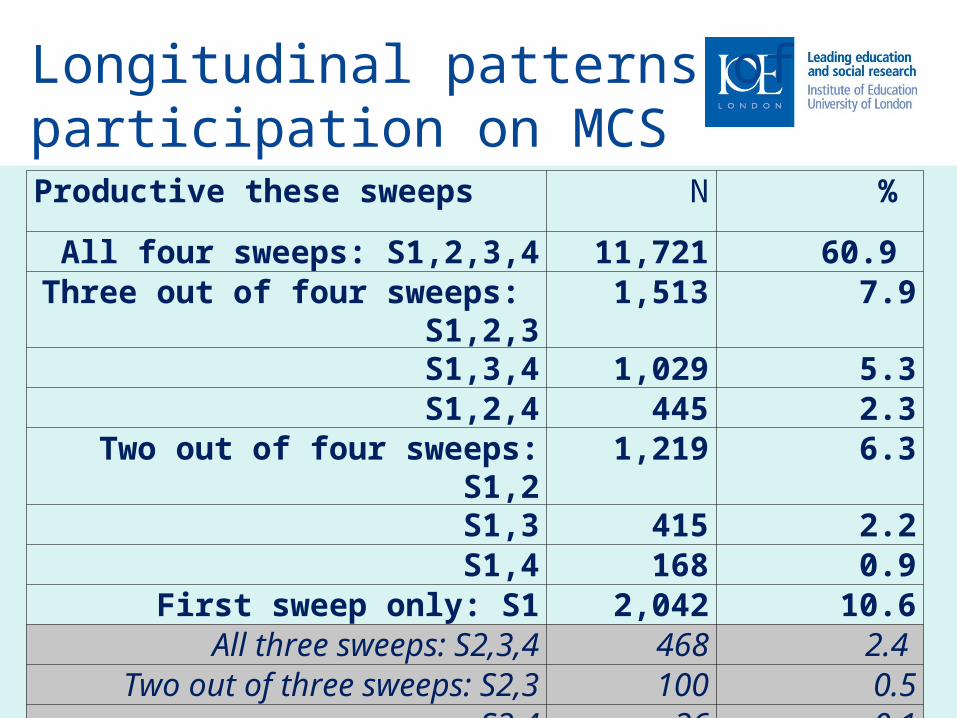
Longitudinal patterns of participation on MCSProductive these sweeps N %
All four sweeps: S1,2,3,4 11,721 60.9 Three out of four sweeps: S1,2,3 1,513 7.9
S1,3,4 1,029 5.3S1,2,4 445 2.3
Two out of four sweeps: S1,2 1,219 6.3S1,3 415 2.2S1,4 168 0.9
First sweep only: S1 2,042 10.6All three sweeps: S2,3,4 468 2.4
Two out of three sweeps: S2,3 100 0.5S2,4 26 0.1
Sweep two only: S2 98 0.5

Response to individualelements
9m Age 3 Age 5 Age 7
Main respondent (mother) interview and self-completion
99% 99% 99% 99%
Partner respondent (father) interview and self-completion
85% 83% 88% 84%
Cognitive assessments - ~78% 98% 99%
Physical measurements - ~90% 99% 99%
Child self-completion - - - 94%
Teacher Survey 68% 70%

Fieldwork

Instrument realisation
Instrument Design
Data processing
Data documentatio
n
Science
Data collection
Study design
Division of responsibilities Between CLS and Agency
Calderwood, 2009

Fieldwork procedures: securing informed consent • Advance letter and general information leaflet
• Additional leaflets with more detailed information e.g. child elements, teacher survey, data linkage
• Information leaflet for child introduced at age 7
• Written consent from parents for own and child’s participation, teacher survey and data linkage
• Verbal assent from child at age 11

Fieldwork procedures:response maximisation• Telephone contact (for some) at MCS3 and MCS4
• Minimum requirements for call attempts • Refusal conversion • Multiple visits and interviewer flexibility
MCS3 MCS4
Telephone contact attempted 68% 66%
Telephone contact made 48% 52%
Appointment made by telephone 44% 47%
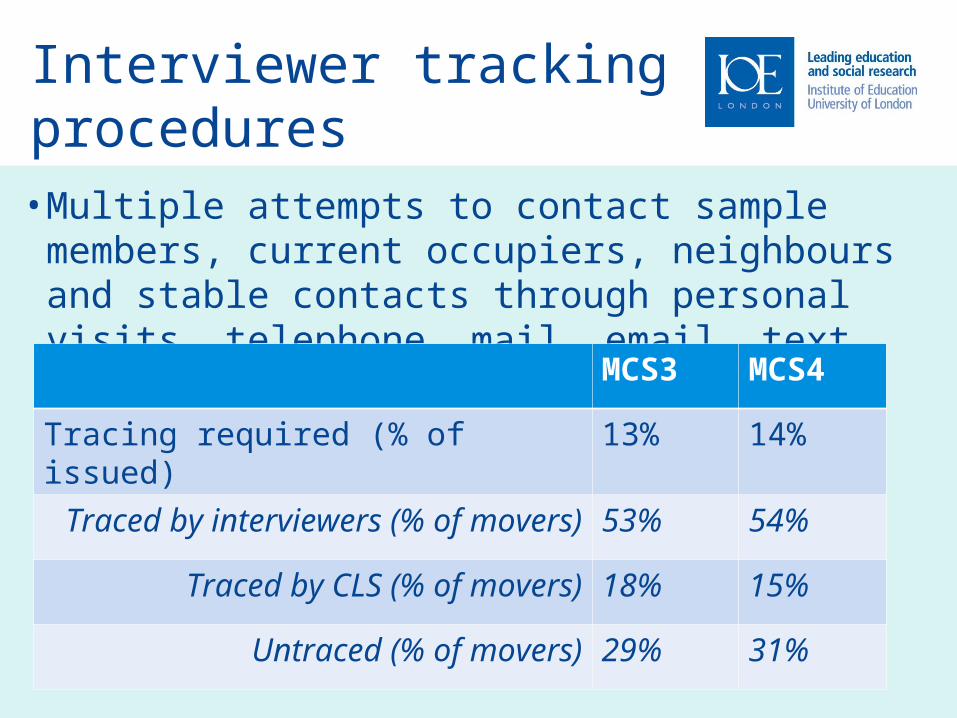
Interviewer tracking procedures• Multiple attempts to contact sample members,
current occupiers, neighbours and stable contacts through personal visits, telephone, mail, email, text
MCS3 MCS4
Tracing required (% of issued) 13% 14%
Traced by interviewers (% of movers) 53% 54%
Traced by CLS (% of movers) 18% 15%
Untraced (% of movers) 29% 31%

Cohort maintenance
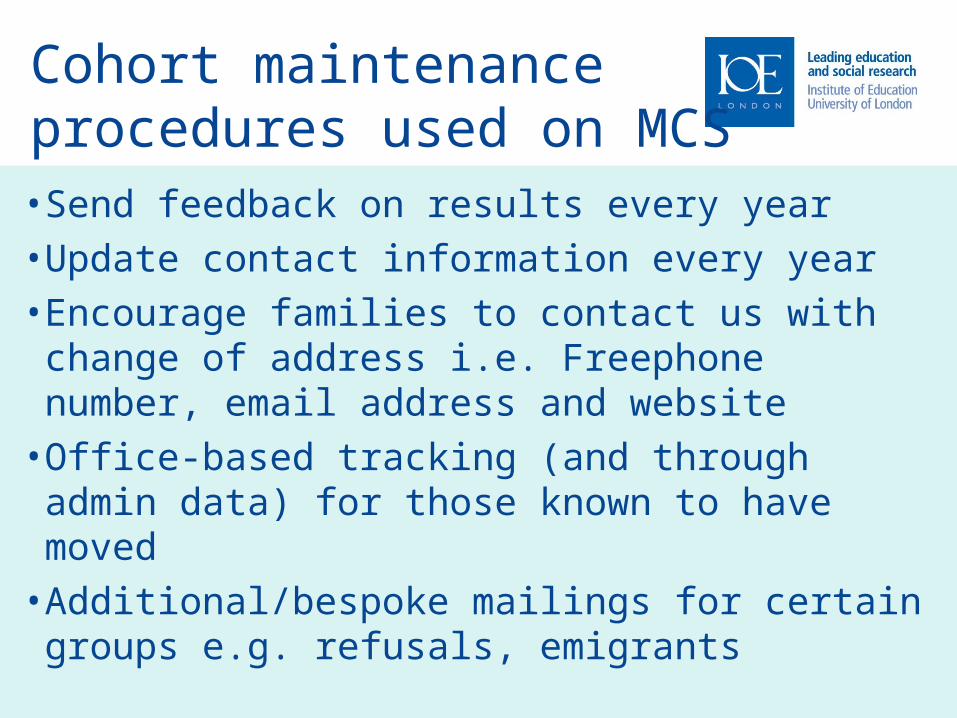
Cohort maintenance procedures used on MCS• Send feedback on results every year
• Update contact information every year
• Encourage families to contact us with change of address i.e. Freephone number, email address and website
• Office-based tracking (and through admin data) for those known to have moved
• Additional/bespoke mailings for certain groups e.g. refusals, emigrants
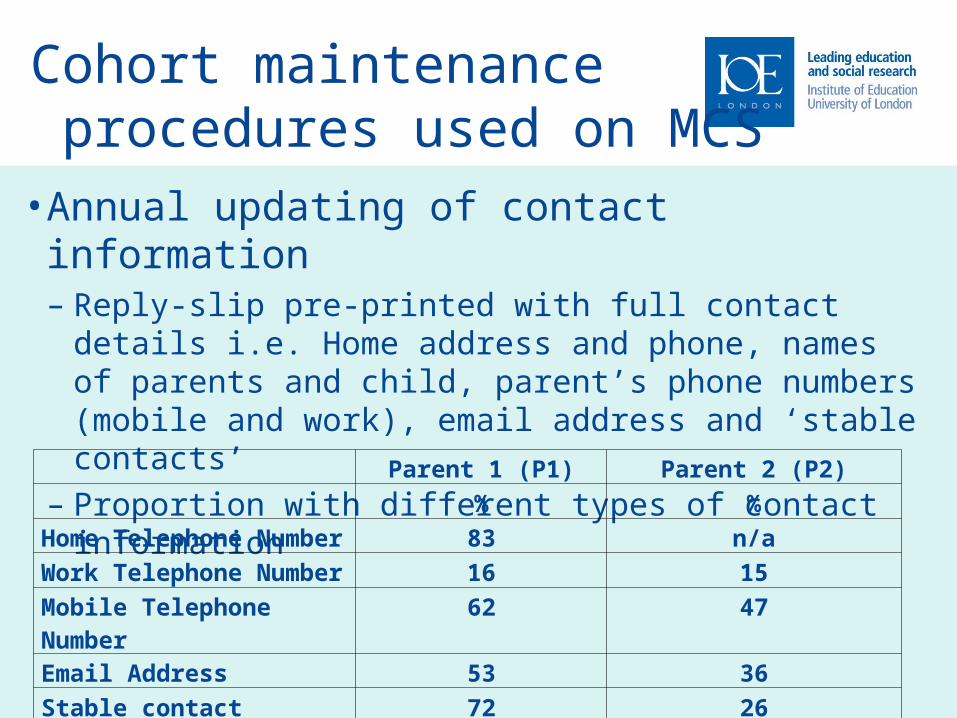
Cohort maintenance procedures used on MCS• Annual updating of contact information
– Reply-slip pre-printed with full contact details i.e. Home address and phone, names of parents and child, parent’s phone numbers (mobile and work), email address and ‘stable contacts’
– Proportion with different types of contact information
Parent 1 (P1) Parent 2 (P2)
% %
Home Telephone Number 83 n/a
Work Telephone Number 16 15
Mobile Telephone Number 62 47
Email Address 53 36
Stable contact 72 26
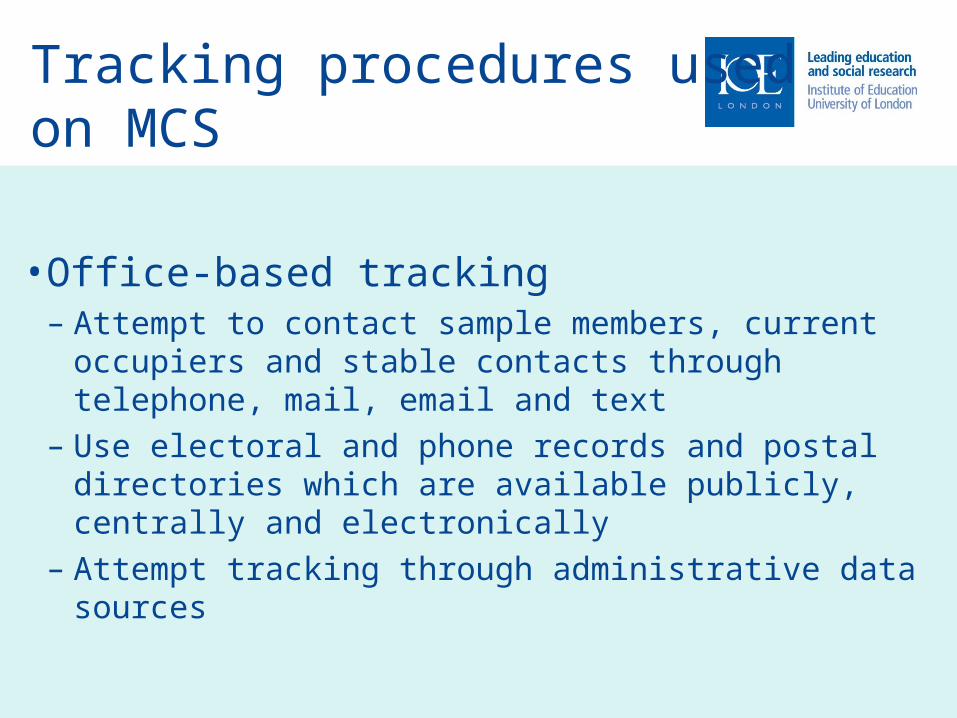
Tracking procedures used on MCS
• Office-based tracking– Attempt to contact sample members, current occupiers and
stable contacts through telephone, mail, email and text– Use electoral and phone records and postal directories
which are available publicly, centrally and electronically– Attempt tracking through administrative data sources

Residential mobility, trackingand non-response on MCS
• Conditional on successful location, mobile families in MCS are no less likely to co-operate at next sweep than non-mobile families (Plewis et al., 2008, Calderwood, 2009)
• Tracking methods used on MCS are successful: over 90% of mobile families are successfully located at next sweep (Calderwood, 2009)
• Comparable to other major longitudinal studies (Couper and Ofstedal, 2009)

Methodology 2: Measurement

Measurement in longitudinal surveys
• Measurement of change and the contribution of dependent interviewing e.g. Moore et al., 2009, Jackle, 2009
• Panel conditioning e.g. Sturgis et al. 2009
• Mode changes between sweeps e.g. Dillman, 2009
• Uses of administrative data e.g. Calderwood et al, 2009
• Role of interviewers e.g. Lynn, 2008

Methodology 3: Researching children
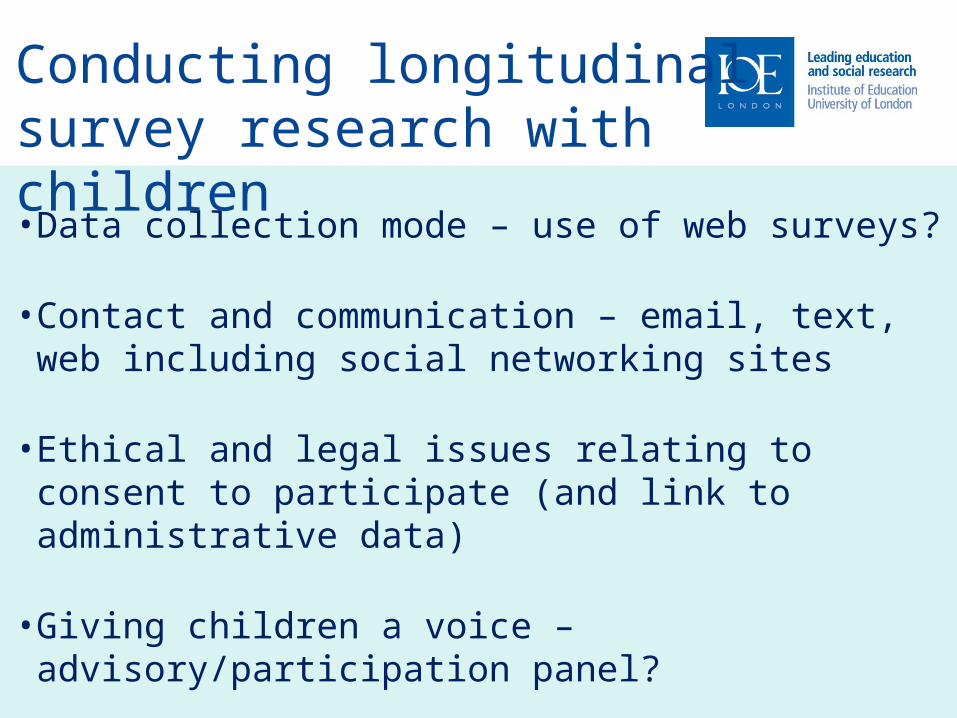
• Data collection mode – use of web surveys?
• Contact and communication – email, text, web including social networking sites
• Ethical and legal issues relating to consent to participate (and link to administrative data)
• Giving children a voice – advisory/participation panel?
Conducting longitudinal survey research with children


Child outcome measures

44
1 Cognitive development
2 Behavioural development
3 Physical growth and development
Outline of section on child outcome measures

Child outcomes 1: Cognitive development
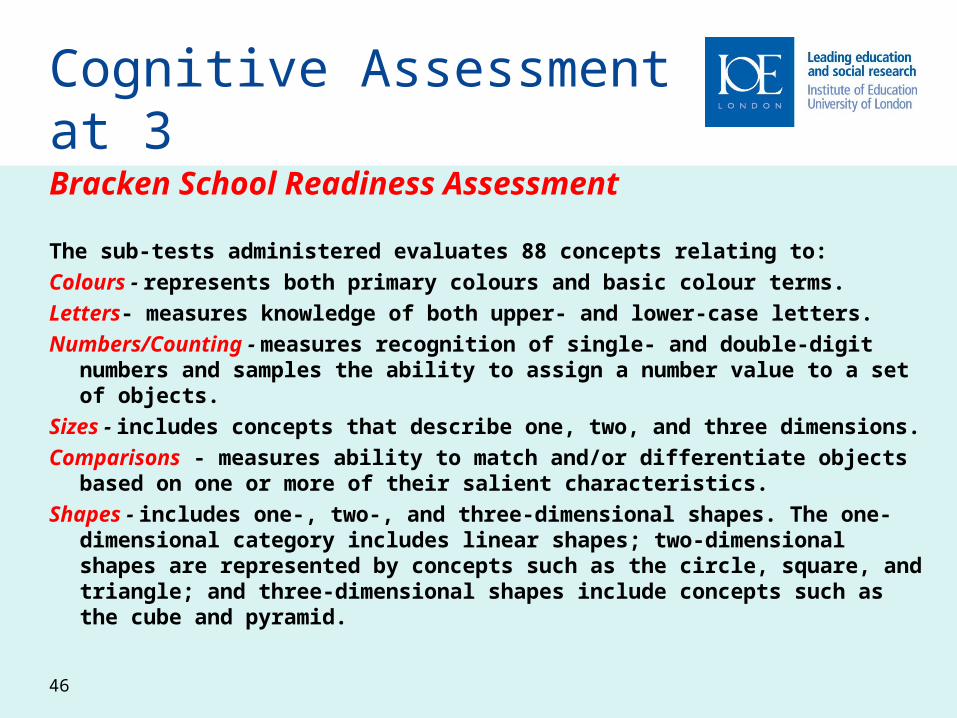
Cognitive Assessment at 3
Bracken School Readiness Assessment
The sub-tests administered evaluates 88 concepts relating to:
Colours - represents both primary colours and basic colour terms.
Letters- measures knowledge of both upper- and lower-case letters.
Numbers/Counting - measures recognition of single- and double-digit numbers and samples the ability to assign a number value to a set of objects.
Sizes - includes concepts that describe one, two, and three dimensions.
Comparisons - measures ability to match and/or differentiate objects based on one or more of their salient characteristics.
Shapes - includes one-, two-, and three-dimensional shapes. The one-dimensional category includes linear shapes; two-dimensional shapes are represented by concepts such as the circle, square, and triangle; and three-dimensional shapes include concepts such as the cube and pyramid.
46
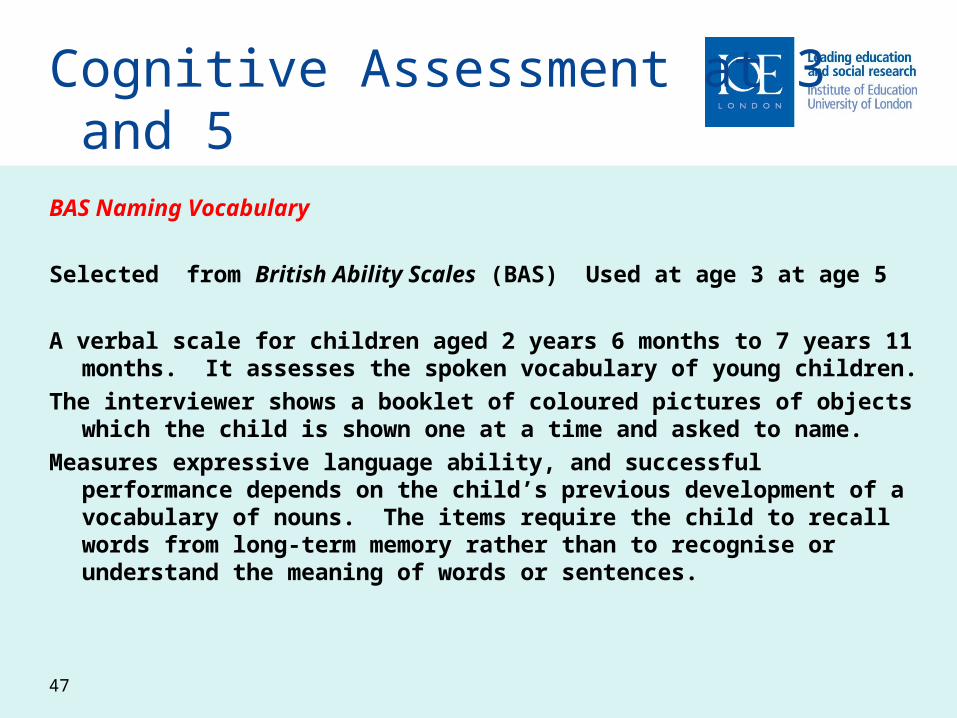
Cognitive Assessment at 3 and 5BAS Naming Vocabulary
Selected from British Ability Scales (BAS) Used at age 3 at age 5
A verbal scale for children aged 2 years 6 months to 7 years 11 months. It assesses the spoken vocabulary of young children.
The interviewer shows a booklet of coloured pictures of objects which the child is shown one at a time and asked to name.
Measures expressive language ability, and successful performance depends on the child’s previous development of a vocabulary of nouns. The items require the child to recall words from long-term memory rather than to recognise or understand the meaning of words or sentences.
47

Practical problems in administering assessment
Anyone else present during Assessment?
If so who – mother, father, children, other?
Effect on child's performance of this presence.
What was child’s energy level during Assessment?
Language
Vocab cannot be assessed if child speaks another language
Child may be too shy, or too young at 3 to attempt the assessment
Ca 2500 missing cases, ca 16% at age 3
48
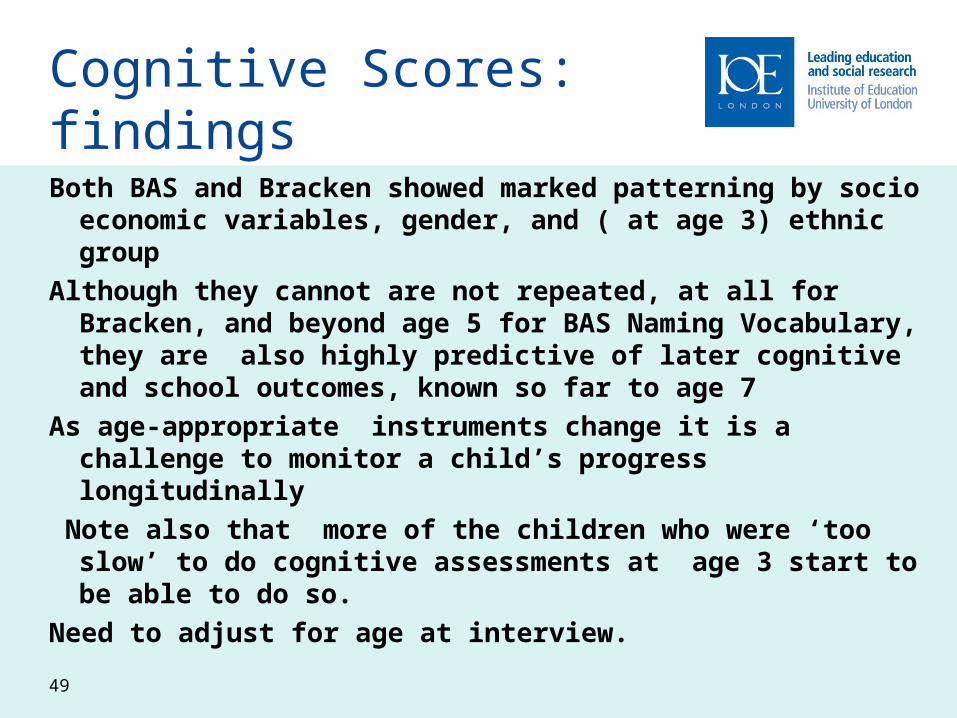
Cognitive Scores: findingsBoth BAS and Bracken showed marked patterning by socio
economic variables, gender, and ( at age 3) ethnic group
Although they cannot are not repeated, at all for Bracken, and beyond age 5 for BAS Naming Vocabulary, they are also highly predictive of later cognitive and school outcomes, known so far to age 7
As age-appropriate instruments change it is a challenge to monitor a child’s progress longitudinally
Note also that more of the children who were ‘too slow’ to do cognitive assessments at age 3 start to be able to do so.
Need to adjust for age at interview.
49

Child outcomes 2: Behavioural development

Behavioural Development
Since age 3, the surveys have included the Strengths and Difficulties Questionnaire
In the main self-completion instrument, mother report
25 items form 5 subscales: 1. Emotion Symptoms Scale 2. Conduct problems 3. Hyperactivity 4. Peer Problems 5. Pro-social Scale
This standard instrument, author Goodman, who insists it is used in its entirety, is also put to teachers at age 7 and 11
51
Scoring the SDQ
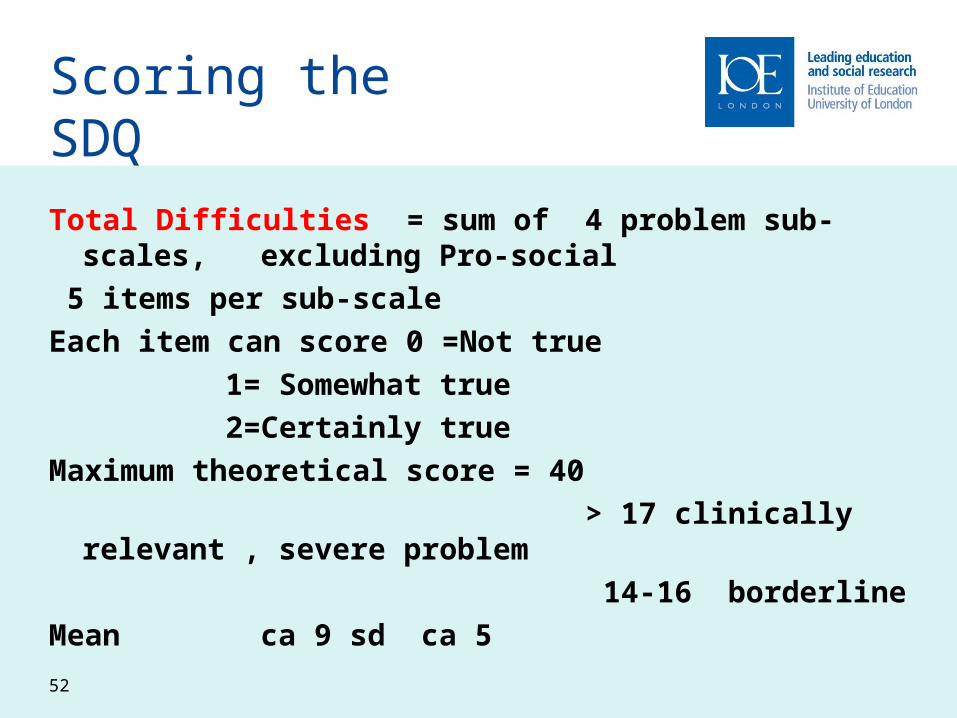
Total Difficulties = sum of 4 problem sub-scales, excluding Pro-social
5 items per sub-scale
Each item can score 0 =Not true
1= Somewhat true
2=Certainly true
Maximum theoretical score = 40
> 17 clinically relevant , severe problem
14-16 borderline
Mean ca 9 sd ca 5
52
Behaviour: findings
More attention has been paid to Total Difficulties than Pro social or other individual subscale.
Score is sometimes treated a continuous variable and sometimes as dichotomy
It has strong patterns , not only with socio-economic indicators, but also parental relationships and parental health
It is mildly predictive of the child’s cognitive outcomes and is expected to be predictive of delinquency.
53
Child outcomes 3: Physical growth and development

Anthropometry
A direct measurement of body size is a record of growth, and also of great interest in the context of obesity
Child’s height and weight was successfully measured by generalist interviewers at age 3, 5, 7 and is planned for age 11. Parent needs to be present . Yields BMI = weight( kg)/height(m)2
Measurements have also included waist circumference (age 5,7,11), fat mass (age 7 and 11) and accelerometry (age 7) to record physical activity.
55

Anthropometry: findings

Anthropometry: findings
Only a minority of children were found to be obese but, by age 7 the obesity rate of MCS children, 6%, was double that recorded a decade earlier for 7 year olds in ALSPAC. Evidence of advancing ‘obesity epidemic’.
IOTF ( international Obesity Task Force) definitions used for the obesity and overweight thresholds, which should facilitate international comparison.
57

Website
www.cls.ioe.ac.ukFollow CLS on Twitter
www.twitter.com/CLScohorts

References
Calderwood, L. (2009). The relationship between survey quality and survey processes in longitudinal studies. CLS Working Paper (forthcoming)
Calderwood., L. (2009). Keeping in touch with mobile families in the UK Millennium Cohort Study. Proceedings of the XXV International Methodology Symposium Statistics Canada (forthcoming)
Calderwood, L, and Lessof, C. (2009) Enhancing Longitudinal Surveys by Linking to Administrative Data. In P.Lynn (ed.) Methodology of Longitudinal Surveys, London: John Wiley & Sons, Inc
Couper, M.P. and Ofstedal, M.B. (2009). Keeping in Contact with Mobile Sample Members. In P.Lynn (ed.) Methodology of Longitudinal Surveys, London: John Wiley & Sons, Inc
Dillman, D.A. (2009) Some Consequences of Survey Mode Changes in Longitudinal Surveys. In P.Lynn (ed.) Methodology of Longitudinal Surveys, London: John Wiley & Sons, Inc

References
Groves, R. M. (1989) Survey Errors and Survey Costs. New York: John Wiley
Groves, R. M., and Heeringa, S., (2006) Responsive design for household surveys: tools for actively controlling survey errors and costs. Journal of the Royal Statistical Society Series A: Statistics in Society, 169, 439-457 Part 3.
Jäckle, A. Dependent Interviewing: A Framework and Application.
to Current Research In P.Lynn (ed.) Methodology of Longitudinal Surveys, London: John Wiley & Sons, Inc
Lepkowski, J.M. and Couper, M.P. (2002) Non-response in longitudinal household surveys. In R.M. Groves, D.Dillman, J.Eltinge, and R.J.A.Little (Eds.), Survey Nonresponse New York: John Wiley & Sons, Inc
Lynn, P. (2001). A Quality Framework for Longitudinal Studies. (Draft) Last update 26-9-2001.

References
Lynn, P. and Clarke, P, (2002) Separating Refusal Bias from Non-contact Bias: evidence from UK National Surveys Journal of the Royal Statistical Society Series D (The Statistician) edition: 3, vol:51, 319 - 333, 2002
Lynn, P. (2008) The effect of interviewer continuity on measurement error in panel surveys Seminar on the Role of Interviewers in Ensuring Quality in Longitudinal Surveys, Royal Society Edinburgh Foundation
Moore, J., Bates, N., Pascale, J. and Okon, A. (2009) Tackling Seam Bias Through Questionnaire Design. In P.Lynn (ed.) Methodology of Longitudinal Surveys, London: John Wiley & Sons, Inc
Plewis, I, Ketende, S, Joshi, H., Hughes, G (2008) The Contribution of Residential Mobility to Sample Loss in a Birth Cohort Study: Evidence from the First Two Waves of the UK Millennium Cohort Study Journal of Official Statistics 24. 365-385
References
Plewis, I. (2007) Non-response in a birth cohort study: the case of the Millennium Cohort Study International Journal of Social Research Methodology 10. 325-334
Statistics Canada (1998) Statistical Quality Guidelines (3rd Edition). Ottawa: Statistics Canada
Sturgis,P., Allum, N. and Brunton-Smith, I. (2009) Attitudes Over Time: The Psychology of Panel Conditioning In P.Lynn (ed.) Methodology of Longitudinal Surveys, London: John Wiley & Sons, Inc