1 systems analysis & design process modeling is 431: lecture 4 csun information systems...
TRANSCRIPT
1
Systems Analysis & Design
ProcessModeling
IS 431: Lecture 4
CSUN Information Systems
http://www.csun.edu/~dn58412/IS431/IS431_SP15.htm

IS 431 : Lecture 4 2
System Modeling
Process Modeling with Data Flow Diagram (DFD)– what’s the system doing
Data Modeling with Entity Relationship Diagram (ERD)– what’s data of the system
Object Modeling with Unified Modeling Language (UML)– what and why (logic of the system)

IS 431 : Lecture 4 3
Why System Modeling
To better understand the system: opportunities for simplification, optimization (BPR)
To communicate the desired structure and behavior of the system (business requirements: data/information & functions/processes)
To visualize and control the system architecture (blueprint)
To manage risks in development process

IS 431 : Lecture 4 4
When Process Modeling
Strategic systems planning– Enterprise process models illustrate important business functions.
Business process redesign– “As is” process models facilitate critical analysis (Current System).– “To be” process models facilitate improvement (Proposed System).
Systems analysis– Model the existing/current system including its limitations (logical
DFD)– Model the target/proposed system’s logical requirements
(processes and data flows needed regardless of how the system will be implemented- logical DFD)
– Model candidate technical solutions (physical DFD)– Model the target technical solution (physical DFD)

IS 431 : Lecture 4 5
Process Modeling
Logical vs. Physical ModelsSystem and Process ConceptsData Flow Diagrams (DFD)Elements of a DFDRules and Procedures in DFD Examples and Case Studies

IS 431 : Lecture 4 6
Logical vs. Physical Models
Logical models show WHAT a system is or does. They are independent of any technical implementation.
Physical models show not only what a system is or does, but also HOW the system is (to be) physically and technically implemented. They reflect technology choices.

IS 431 : Lecture 4 7
Why Logical System Models
Logical models remove (political, emotional) biases resulted from the way the system is currently implemented, or the way that any one person thinks the system might be implemented.
Logical models reduce the risk of missing business requirements in cases one is too preoccupied with technical results (premature technical solutions).
Logical models allow the communication with end-users in nontechnical or less technical languages (charts, diagrams).

IS 431 : Lecture 4 8
Process Modeling with DFD
Process Modeling is a technique for organizing and documenting the structure and flow of data through a system’s processes, and the logic, policies, and procedures to be implemented by a system’s processes.
A Data Flow Diagram (DFD) is a graphical tool to depict the flow of data through a system and the work or processing performed by that system.

IS 431 : Lecture 4 9
Why DFD
Language description is subject to interpretation, it may omit crucial info.
Graphical description of the flow of data within an organization with DFD.

IS 431 : Lecture 4 10
System Concept
A system exits by taking input from the environment , transforming (processing) this input, and release an output
A system may be decomposed (exploded) into subsystems
A subsystem has its own input and outputOutput of one subsystem may become the input of
other subsystems

IS 431 : Lecture 4 11
Systems & Subsystems
INPUT OUTPUT

IS 431 : Lecture 4 12
Systems & Processes A system is a process. It addresses a business function.A process is work / action performed on, or in response to, incoming data flows or conditions. A process (function) can be decomposed into sub-processes (sub-functions, tasks)
TheSystem
is aProcess
input output
input
input output
output
Feedack andControl Loop
The System's Environment(constantly changing)

IS 431 : Lecture 4 13
System Decomposition

IS 431 : Lecture 4 14
Decomposition Diagram
IS 431 : Lecture 4 15
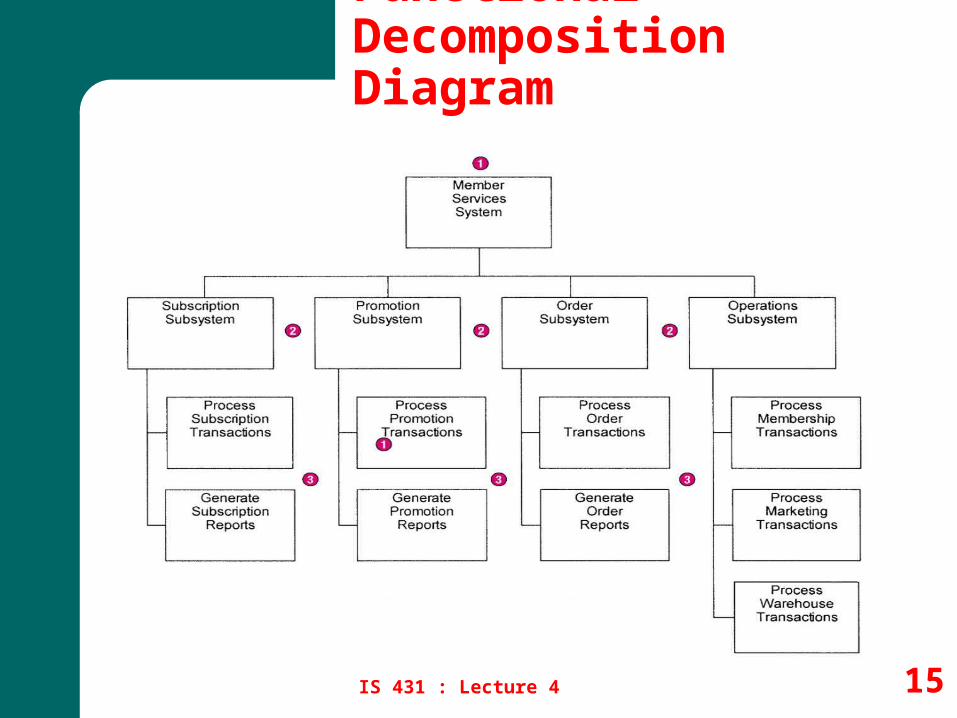
Functional Decomposition Diagram

IS 431 : Lecture 4 16
Event Decomposition Diagram

IS 431 : Lecture 4 17
Data Flow Diagrams
DFD documents a business function/activity/task of a system as a process.
DFD describes how data is manipulated within and at the boundaries of the system.
DFD shows detail of the interdependency among processes of the system, movements of data or info among the processes.

IS 431 : Lecture 4 18
Data Flow Diagrams ... Logical DFD describes the flow of information of a system Physical DFD describes how an information system is
physically implemented (who does what by what means)Gane/Sarson vs. Demarco/Yourdon NotationsGane/Sarson set define clearly logical and physical symbolsGane/Sarson set considering process performance in terms of
input/output, could be used in BPR.Don’t mix up 2 sets of notations

IS 431 : Lecture 4 19
Elements of a DFD
External Entity
Data Flow
Process
Data Store
DE MARCO & YOURDON NOTATIONS

IS 431 : Lecture 4 20
Elements of a DFD
External Entity
Data Flow
Process
Data Store
GANE & SARSON NOTATIONS
Pay Bill
AP Clerk
3
Pay Bill
3
(Logical) (Physical)

IS 431 : Lecture 4 21
External Entities
An External Entity is a provider (source) or receiver (sink) of data and info of the system.
An External Entity is NOT part of the system: the externality depends on how the system is defined.
SUPPLIER

IS 431 : Lecture 4 22
External Entities …An external entity (agent) defines a person,
organization unit, or other organization that lies outside of the scope of the project but that interacts with the system being studied. – External agents define the “boundary” or scope of a
system being modeled.
– As scope changes, external agents can become processes, and vice versa.
– Almost always one of the following: Office, department, division inside the business but outside the
system scope. An external organization or agency. Another business or another information system. One of system’s end-users or managers

IS 431 : Lecture 4 23
Data Stores
A Data Store is a storage of data: it contains information
Physical storage is immaterial : it can be a filing cabinet, book, computer file
D1 Accounts Receivable

IS 431 : Lecture 4 24
Data Stores …A data store is an inventory of data.
– A data store is “data at rest” compared to a data flow that is “data in motion.”
– Almost always a data store for one of the following: Persons (or groups of persons): e.g., customer Places: e.g, cash register Objects: e.g., product Events (about which data is captured): e.g., sales Concepts (about which data is important): e.g., discount
– One can identify data stores with REAL (Resources-Events-Agents-Locations) framework
– Data stores depicted on a DFD store all instances of data entities (depicted on an ERD)

IS 431 : Lecture 4 25
Data Flows
A Data Flow represents a movement of data (info) among processes or data stores
A Data Flow does NOT represent a document or a physical good: it represents the exchange of information in the document or about the good
A Data Flow represents an input of data to a process, or the output of data from a process.– A data flow may also be used to represent a Creation,
Reading, Updating, or Deletion (CRUD) of data in a file or database (called a data store).
– A composite data flow (packet) is a data flow that consists of other data flows (delivery slip has customer info, address, product info etc.)
DELIVERY SLIP

IS 431 : Lecture 4 26
Processes
A Process is a work or action performed on input data flow to produce an output data flow
Use a verb to label the action performed by the process (not the name of person or department who does it as in physical DFD)
A Process must have at least one input data flow and at least one output data flow.
1
Pay Bill

IS 431 : Lecture 4 27
Types of Logical Processes
Function: a set of related and ongoing activities of a business: e.g., sales.
Event (or transaction, activity): a logical unit of work that must be completed as a whole (as part of a function): e.g., collect payment.
Elementary Process (or primitive process, task): a discrete, detailed activity or task required to respond to an event. Usually, several such tasks must be completed to respond to an event, e.g, update new info, calculate payment, create notice…

IS 431 : Lecture 4 28
Context Diagram
Define the boundary of the systemIdentify the external entitiesNo detail on processes and data stores of the system

IS 431 : Lecture 4 29
Decomposition of Context Diagram
M
N
P
M
N
P
Context Diagram
Level-0 Diagram
Level-1 Diagram
1 3
2
0
D1

IS 431 : Lecture 4 30
DFD Building Procedure
Context Diagram– Identify the system and its boundaries (the context)
– Identify external entities (providers, receivers of system info)
– Identify external data flows (input, output)
– Note: the whole system itself is a process (it receives input and transforms it into output) doing a business function
– Doesn’t show processes and/or data stores here

IS 431 : Lecture 4 31
DFD Building Procedure …Level-0 DFD
– Identify what is being done between each input and its corresponding output
– Identify the processes (functions of the system)– Identify external data flows between external entities and
processes– Identify information storages for reference/record keeping
(data stores)– Identify internal data flows between processes and data stores
Level-1 DFD’s– Sub-processes (activities or tasks) of Level-0 processes
(system functions)

IS 431 : Lecture 4 32
Rules in DFD Building
Rule 1 : Unique label for each symbol to avoid confusion
Rule 2 : Use an action VERB to label a process (because a process is an action !!!)

IS 431 : Lecture 4 33
Rules in DFD Building ...
Rule 3 : Must be one process associated with each data flow …
M
M

IS 431 : Lecture 4 34
Rules in DFD Building ...
Rule 3 : Must be one process associated with each data flow …
M N
M N

IS 431 : Lecture 4 35
Rules in DFD Building ...
Rule 3 : Must be one process associated with each data flow.

IS 431 : Lecture 4 36
Rules in DFD Building ...
Rule 4 : Shaded corner must appear in ALL occurrences of a duplicated symbol in a same diagram on the same page.
CUSTOMER
CUSTOMER
D3
D3
Accounts Receivable
Accounts Receivable
1.0
3.0

IS 431 : Lecture 4 37
Rules in DFD Building ...
Rule 5 : No process without output data flow (black hole !!!)
IS 431 : Lecture 4 38
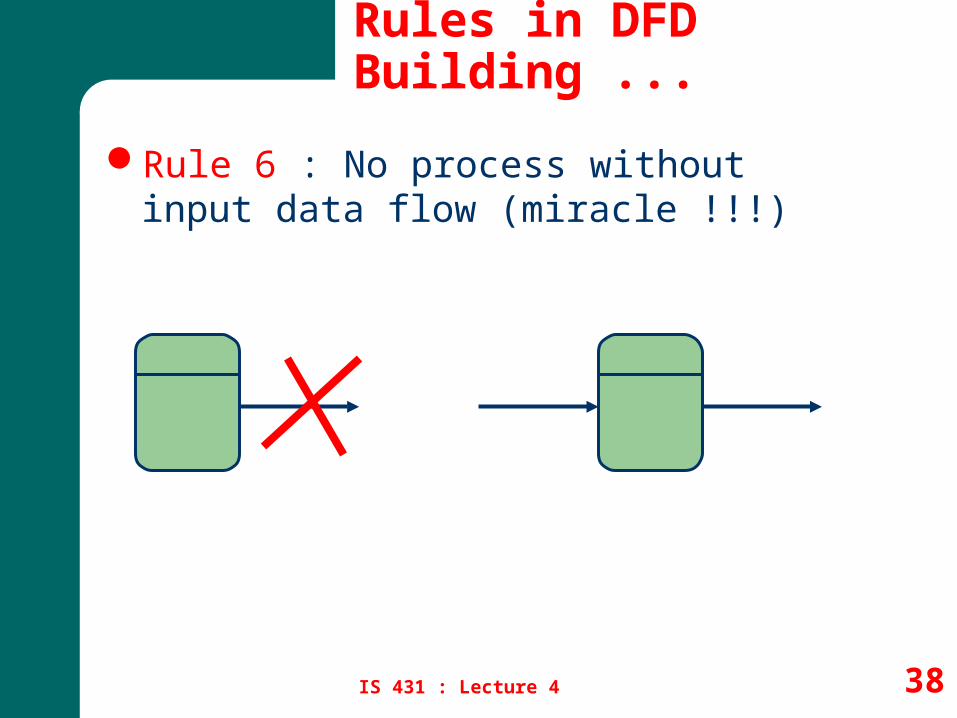
Rules in DFD Building ...
Rule 6 : No process without input data flow (miracle !!!)

IS 431 : Lecture 4 39
Rules in DFD Building ...
Rule 7 : No need for routing (without transforming) a data flow with a process (non value-added activity !!!)
Info A Info A

IS 431 : Lecture 4 40
Rules in DFD Building ...
Rule 8 : Identical input, output data flows for parent and child processes (but the child processes can have their own throughputs) . Balance Check.

IS 431 : Lecture 4 41
Rules in DFD Building ...
M
N
P
1 2
3
M
N
P
Context Diagram
Level-0 Diagram

IS 431 : Lecture 4 42
Rules in DFD Building ...
Rule 9 : Data flows cannot split by themselves

IS 431 : Lecture 4 43
Rules in DFD Building ...
Rule 9 : Data flows cannot split …

IS 431 : Lecture 4 44
Rules in DFD Building ...
Rule 10 : A data packet can combine many data elements being transmitted at the same time to the same destination
IS 431 : Lecture 4 45
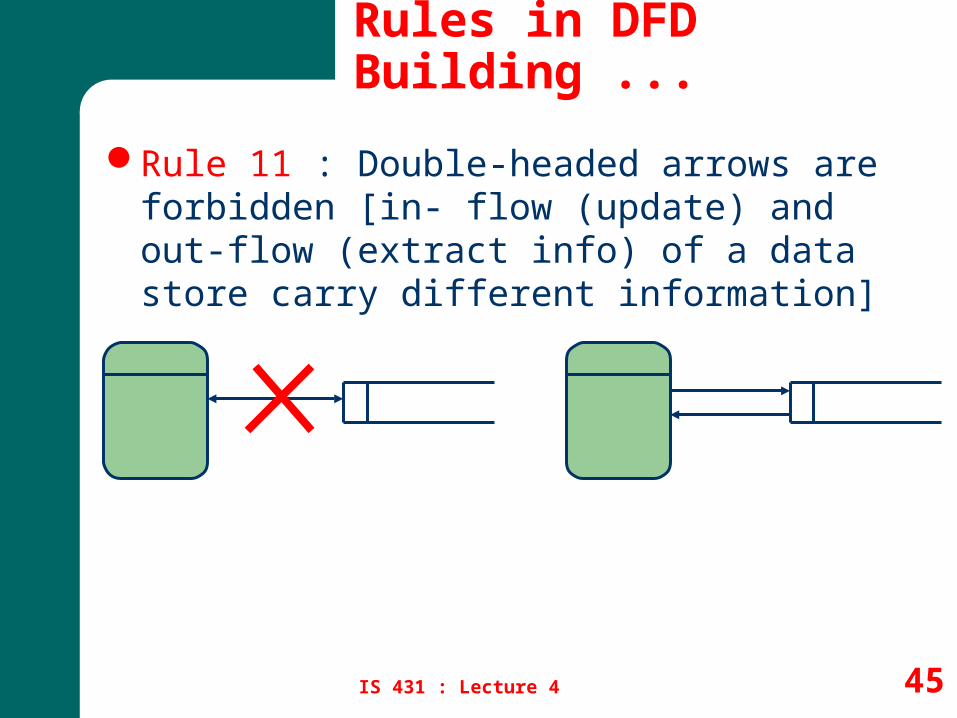
Rules in DFD Building ...
Rule 11 : Double-headed arrows are forbidden [in- flow (update) and out-flow (extract info) of a data store carry different information]

IS 431 : Lecture 4 46
Rules in DFD Building ...
Rule 12 : Data flow can NOT go backward to a previous process in Level-0 (Today’s output can’t go back to yesterday’s work !!!)
Notes: Show any branching decision / loop in Level-1

IS 431 : Lecture 4 47
DFD Example
Personal Finance System

IS 431 : Lecture 4 48
Classical / Top-Down Structured Analysis
1. Draw top-down physical DFDs to represent the current physical implementation of the system including its limitations.
2. Convert the physical DFDs to their logical equivalents.3. Draw top-down logical DFDs that represent an
improved system.4. Describe all data flows, data stores, policies, and
procedures in a data dictionary or encyclopedia.5. Optionally, mark up copies of the logical DFDs to represent
alternative physical solutions.6. Draw top-down physical DFDs that represent the target
solution.
Draw top-down logical DFDs of current system

IS 431 : Lecture 4 49
Event-driven / Bottom-Up Structured Analysis
1. Draw a context DFD to establish initial project scope.
2. Draw a functional decomposition diagram to partition the system into subsystems.
3. Create an event-response or use-case list for the system to define events for which the system must have a response.
4. Draw an event DFD (or event handler) for each event.
5. Merge event DFDs into a system diagram (or, for larger systems, subsystem diagrams).
6. Draw detailed, primitive DFDs for the more complex event handlers.
7. Document data flows and processes in the data dictionary.

IS 431 : Lecture 4 50
Structured Analysis Diagram Progression …

IS 431 : Lecture 4 51
Structured Analysis Diagram Progression …

IS 431 : Lecture 4 52
Structured Analysis Diagram Progression

IS 431 : Lecture 4 53
Differences Between DFDs and Flowcharts
Processes on DFDs can operate in parallel (at-the-same-time)– Processes on flowcharts execute one at a time
DFDs show the flow of data through a system– Flowcharts show the flow of control (sequence and
transfer of control)
Processes on a DFD can have different timing (daily, weekly, on demand)– Processes on flowcharts are part of a single program with
consistent timing

IS 431 : Lecture 4 54
Data Conservation
Data conservation – the practice of ensuring that a data flow contains only data needed by the receiving process.– New emphasis on business process redesign to identify
and eliminate inefficiencies.
– Simplifies the interface between those processes.
– Must precisely define the data composition of each data flow, expressed in the form of data structures (in Data Modeling).

IS 431 : Lecture 4 55
Data to Process Matrix

IS 431 : Lecture 4 56
Process to Location Association Matrix

IS 431 : Lecture 4 57
DFD Case Studies
WEPAY payroll processing Personnel Evaluation at Perks Travel Co.Accounts Receivable at Harper PrintingReceiving Function at Globe Appliances
To be discussed in-class

© 2010 D.Nguyen @ CSUN
IS 431 : Lecture 4 58
Architecture Blueprints
Street Location Context Diagram
0
E1 E2
N

IS 431 : Lecture 4 59
Architecture Blueprints
F1
F2
F3
Building Plan Level-0 DFD
1.0
2.0
3.0
E1
E2
The building has 3 floors The system has 3 functions
© 2010 D. Nguyen @ CSUN

IS 431 : Lecture 4 60
Floor Plan for F1 Level-1 DFD for 1.0
Architecture Blueprints
Floor 1 has a big space for parking Function 1 has a single task
1.0
No need for Level-1 (can get from Level-0)No need for detail blueprint
© 2010 D. Nguyen @ CSUN

IS 431 : Lecture 4 61
2.1
2.3
2.2
Floor Plan for F2 Level-1 DFD for 2.0
2.1
2.2
2.3
(3.0)
Architecture Blueprints
Floor 2 has 3 suites
Function 2 has 3 activities
(1.0)
© 2010 D. Nguyen @ CSUN

IS 431 : Lecture 4 62
2.1.2 2.1.1
Suite Plan for 2.1 Level-2 DFD for 2.1
2.1.1
2.1.2
(2.2)
Architecture Blueprints
Suite 2.1 has 2 rooms Activity 2.1 has 2 tasks
© 2010 D. Nguyen @ CSUN
(1.0)

IS 431 : Lecture 4 63
Linked Processes
1.0
2.0
1.0
2.0
D1
1.0 sends data to 2.01.0 and 2.0 share the same data store D1
IS 431 : Lecture 4 64
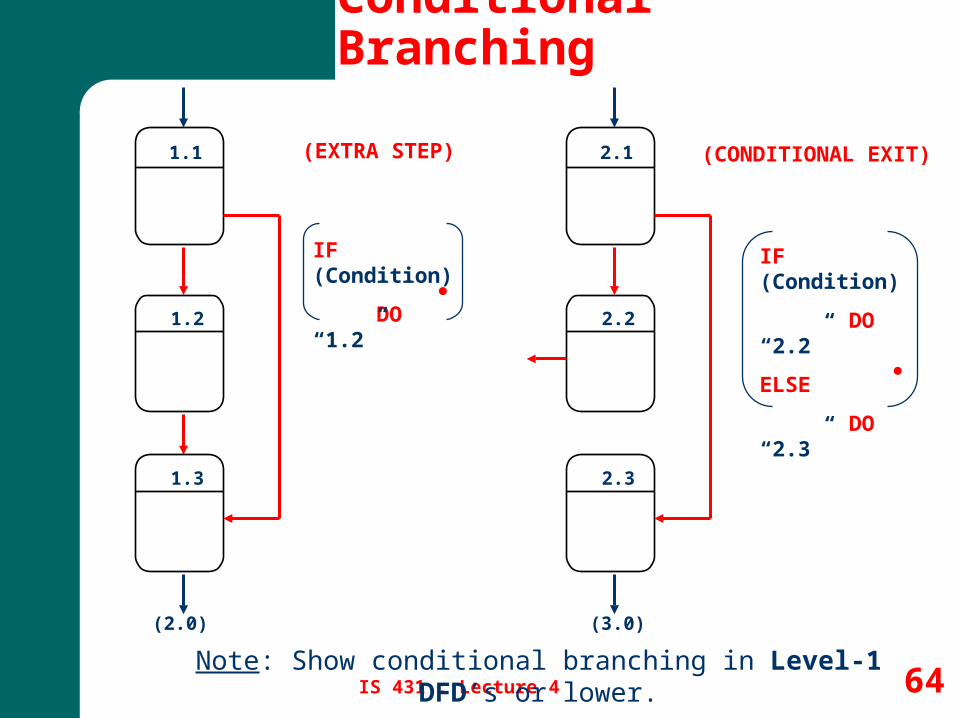
Conditional Branching
1.1
1.2
1.3
2.1
2.2
2.3
(EXTRA STEP) (CONDITIONAL EXIT)
IF (Condition)
DO “1.2”
IF (Condition)
DO “2.2”
ELSE
DO “2.3”
(2.0) (3.0)
Note: Show conditional branching in Level-1 DFD’s or lower.

IS 431 : Lecture 4 65
DFD Deliverables for a System Development Project
Current System (as-is)– Context Diagram– Logical Level-0 DFD– Logical Level-1 DFD’s (for multi-task functions)(No Physical DFD for current system, unless the focus of
the project is in security & control)Proposed System (to-be)
– Context Diagram– Logical Level-0 DFD Level-0– Logical Level-1 DFD’s (for multi-task functions)– Physical Level-0 DFD Level-0– Physical Level-1 DFD’s (for multi-task functions)

“System” Flowchart aka. Document Flowchart
IS 431 : Lecture 4 66

Logical DFD using De-Marco Notations
IS 431 : Lecture 4 67

Physical DFD using De-Marco Notations
IS 431 : Lecture 4 68