1 the evolutionary relationship between beak shape
TRANSCRIPT

The evolutionary relationship between beak shape, mechanical advantage, 1
and feeding ecology in modern birds 2
3
4
Guillermo Navalón1,2,*, Jen A. Bright3,4, Jesús Marugán-Lobón2,5 & Emily J. Rayfield1 5
1. School of Earth Sciences, University of Bristol, Life Sciences Building, Bristol, UK 6
2. Unidad de Paleontología, Departamento de Biología, Universidad Autónoma de Madrid, Madrid, Spain. 7
3. School of Geosciences, University of South Florida, Tampa, FL 33620, USA. 8
4. Centre for Virtualization and Applied Spatial Technologies, University of South Florida, Tampa, FL 33620, USA 9
5. Dinosaur Institute, Natural History Museum of Los Angeles County, Los Angeles, CA, USA. 10
*Corresponding author. Email: [email protected]. 11
12
13
Author’s contributions: GN, JAB, JML and EJR designed the project. GN conducted the analyses. 14 GN, JAB, JML and EJR co-wrote the manuscript. 15
16
Acknowledgements 17
The authors are grateful to Melissa Tallman for important insights on shape analysis. We are 18 grateful to Gavin H. Thomas and Mark N. Puttick for advice on phylogenetic comparative 19 methods. We want to thank Luis Porras, Matteo Fabbri and Francisco J. Serrano for 20
enlightening discussion on the implications of our results. We are grateful to Miriam L. 21 Zelditch and three anonymous reviewers for their valuable comments that further improved the 22 quality of this research. GN is supported by a PG Scholarship/Studentship from The Alumni 23 Foundation, University of Bristol, UK. JML is supported by the Spanish MINECO, Project 24 CGL-2013-42643. EJR and JAB were supported by BBSRC grant BB/I011668/1. 25
26
27
Data available at: doi:10.5061/dryad.67nf3vp. 28
29
30
31
This is the peer reviewed version of the following article: Navalón, G., Bright, J. A., Marugán‐Lobón, J., & Rayfield, E. J.
(2018). The evolutionary relationship among beak shape, mechanical advantage, and feeding ecology in modern birds.Evolution, 73(3), 422-435 which has been published in final form at https://doi.org/10.1111/evo.13655, This article may be used for non-commercial purposes in accordance with Wiley Terms and Conditions for Use of Self-Archived Versions.
ABSTRACT 32
Extensive research on avian adaptive radiations has led to a presumption that beak 33
morphology predicts feeding ecology in birds. However, this ecomorphological 34
relationship has only been quantified in a handful of avian lineages, where associations 35
are of variable strength, and never at a broad macroevolutionary scale. Here, we used 36
shape analysis and phylogenetic comparative methods to quantify the relationships 37
between beak shape, mechanical advantage, and two measures of feeding ecology (feeding 38
behaviour and semi-quantitative dietary preferences) in a broad sample of modern birds, 39
comprising most living orders. We found a complex relationship, with most variables 40
showing a significant relationship with feeding ecology but little explanatory power, for 41
example, diet accounts for less than 12% of beak shape variation. Similar beak shapes 42
are associated with disparate dietary regimes, even when accounting for diet-feeding 43
behaviour relationships and phylogeny. Very few lineages optimize for stronger bite 44
forces, with most birds exhibiting relatively fast, weak bites, even in large predatory taxa. 45
The extreme morphological and behavioural flexibility of the beak in birds suggests that, 46
far from being an exemplary feeding adaptation, avian beak diversification may have 47
been largely contingent on trade-offs and constraints. 48
49
Keywords: birds, beak shape, feeding ecology, diet, mechanical advantage, adaptation 50
51
52
53
54

1. Introduction 55
In birds, a strong link between the shape of the beak and dietary habits is assumed as a 56
truism (e.g.: Gill 1995), likely arising from the central role that the study of Darwin’s finches 57
played in the conception (Darwin and Wallace 1858; Darwin 1859) and further development 58
of natural selection in evolutionary theory (e.g. Lack 1940; Hamilton and Rubinoff 1963; 59
Schluter and Grant 1984; Grant and Grant 1993, 2002, 2006; Lamichhaney et al. 2018). 60
However, feeding selective pressures do not necessarily produce a simple match between beak 61
phenotype and ecology. For instance, pleiotropic interactions during development might 62
impose restrictions to trophic selection (Lieberman 2011), or ‘specialized’ beak phenotypes 63
might be retained if they are efficient for processing non-favoured resources, particularly if the 64
favoured resource is periodically limited (i.e. Liem’s paradox; Liem 1980; Tebbich et al. 2004). 65
Furthermore, in addition to feeding and foraging, birds use their beaks for a plethora of other 66
tasks, such as preening (Moyer et al. 2002; Clayton et al. 2005), vocal modulation (Podos 2001; 67
Herrel et al. 2009), thermoregulation (Tattersall et al. 2009; van De Ven et al. 2016) and water 68
balance (Greenberg et al. 2012), tool use (Weir et al. 2002; Wimpenny et al. 2009; Laumer et 69
al. 2017), nest construction (Hansell 2000), and as a display structure (Navarro et al. 2009). 70
This functional and behavioural flexibility implies that multiple selective pressures likely 71
played important roles in shaping beak evolution. Understanding the relative importance of 72
trophic adaptation to beak morphological diversification in modern birds is therefore vital to 73
understanding avian evolution, and to make accurate ecological inferences in extinct taxa 74
(Lauder and Thomason 1995; Rubega 2000). 75
Although the main patterns of beak shape evolution at a broad macroevolutionary scale 76
in birds have been effectively characterized (Cooney et al. 2017), the extent to which such 77
patterns are related to feeding ecology, or to biomechanically relevant traits such as the 78
mechanical advantage of the jaws, remains largely unexplored. Besides Darwin’s ground 79
finches (e.g. Grant and Grant 2006), quantitative evidence evaluating the link between feeding 80
ecology and beak shape in birds is limited to a handful of avian clades (Rubega 2000). These 81
few studies have found strong associations in several families of passerines (Gosler 1987; 82
Benkman 1988; Price 1991; Peterson 1993; Bardwell et al. 2001), anseriforms (Olsen 2017), 83
and a few charadriforms (Barbosa and Moreno 1999), but weak associations among birds of 84
prey (Bright et al. 2016). Biomechanical modelling is similarly limited taxonomically, but in 85
Darwin’s finches, it has been shown that skull and beak shapes are adapted to the mechanical 86
demands of feeding (Soons et al. 2010; Soons et al. 2015). 87
Here, we use geometric morphometrics (GM) to quantify beak shape variation and its 88
relationship with feeding ecology in a broad sample of birds. Shape analysis based on GM 89
provides the analytical tools to partition the sources of beak shape evolutionary variance, as 90
well as to test the strength and pattern of correlation with independent variables (Monteiro, 91
1999; Rohlf and Corti, 2000; Marugán-Lobón et al., 2013). Ecology is characterised by three 92
components of feeding: we quantify the mechanical advantage (MA) of the jaws as a functional 93
trait related to the ability to transfer force or movement through the skull system (high MA 94
describes efficient force transfer, low MA defines less efficient force transfer but faster jaw 95
movement (1); tabulate biological role by documenting use of the beak during feeding (2); and 96
recompile detailed semi-quantitative dietary data (3) for each of the studied species. We use 97
multivariate statistics and phylogenetic comparative methods to test for correlations between 98
these variables, while also accounting for the effect of size (i.e. evolutionary allometry) on beak 99
shape, force transfer, and diet. 100
101
2. Material and methods 102
2.1. Database, trophic information, and phylogenetic hypothesis 103

Our study includes 175 species from 94 families of extant birds, encompassing 38 of 104
the 39 living orders, excluding only Mesitornithiformes, a Madagascan clade of three species 105
(Hackett et al. 2008; Del Hoyo et al. 2017) (SM. Table 1). A maximum clade credibility 106
phylogeny of the 175 species was generated using TreeAnnotator (Rambaut and Drummond 107
2013) from a population of 10,000 “Hackett’s backbone ‘stage 2’ trees” downloaded from 108
www.birdtree.org (Jetz et al. 2012) (Fig. 1). Branch lengths were set equal to ‘Common 109
ancestor’ node heights. 110
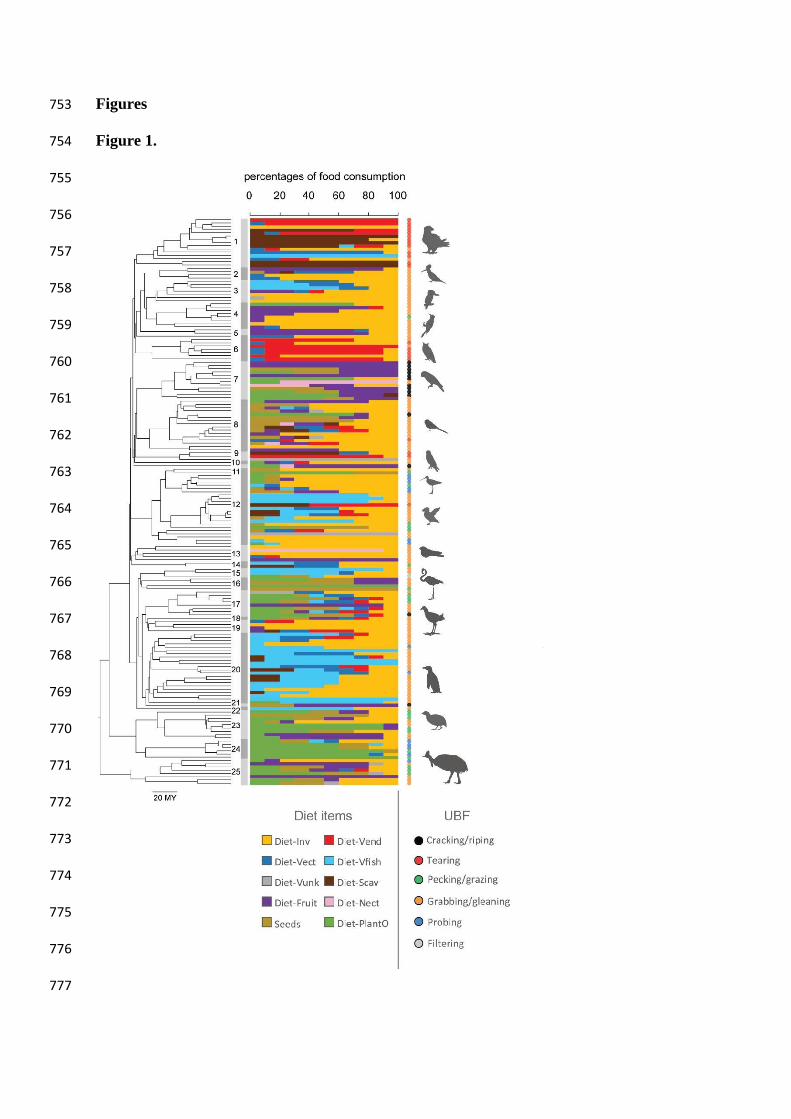
The feeding autecology (the presumed main biological role of the beak) of each species 111
was characterized using two sources of ecological information, namely, semi-quantitative 112
dietary preferences, and the use of the beak during feeding (UBF) (Fig. 1). The dietary data for 113
each species were sourced from EltonTraits 1.0 (Wilman et al. 2014). This data was coded as 114
a matrix of estimations of the relative importance of ten main dietary categories translated from 115
species-level dietary descriptions in the literature (Fig. 1, SM. Table 1) to the overall diet of 116
each species. These estimations were coded as bins of 10 units of percentage (i.e. 0, 10, 20, 117
30…100%) (Fig.1, SM. Table 1). A detailed description of the specific food items included in 118
each category is included in the metadata archives in Wilman et al. (2014). To obtain a 119
Euclidean representation of this non-continuous data we calculated a symmetric 120
similarity/distance matrix (Euclidean distances) from the original 175 (species) x 10 (dietary 121
items) matrix to conduct Principal Coordinates Analysis (PCoA) in PAST v.3.15 (Hammer et 122
al. 2009) and used the scores from the PCoA for downstream analyses (following Legendre 123
and Anderson 1999). 124
The use of the beak during feeding (UBF), was categorised by applying a simple 125
dichotomous key (SM. Fig. 1) to published observations of foraging and feeding behaviour of 126
each of the studied species (Del Hoyo et al. 2017). This allowed us an alternative means to 127
subdivide feeding autecology given that dietary categories at such a wide phylogenetic scale 128

often include very different foraging and feeding behaviours. For instance, the Atlantic puffin 129
(Fratercula arctica) and the osprey (Pandion haliaetus) both feed almost entirely on fish 130
(Wilman et al. 2014; Del Hoyo et al. 2017), but while the former feeds by underwater pursuit-131
diving and grabs individual fish directly with the beak, the latter plucks fish from the water 132
with the talons, and uses the beak instead to tear off chunks of meat before consumption (Del 133
Hoyo et al. 2017). The UBF categories for these examples are therefore scored as 134
‘Grabbing/gleaning’ and ‘Tearing’ respectively (SM. Table 1). Every species in our dataset 135
except the American flamingo (Phoenicopterus ruber, a specialized filter feeder) fits in to one 136
of five categories (tearing, cracking/biting, pecking/grazing, grabbing/gleaning, and probing; 137
Fig. 1; SM. Fig. 1). 138
139
2.2. Beak shape and size 140
The skull of each species (without the rhamphotheca, the corneal sheath that covers the 141
bony beak, which is commonly missing in museum specimens) was photographed in lateral 142
view (SM. Table 1), and the complete outline of the beak was digitized using a set of 3 fixed 143
landmarks and 2 curves (Fig. 2), the latter comprising 50 evenly-spaced semilandmarks (25 144
along the dorsal profile of the bill (culmen), and 25 the left dorsoventral edge of the beak 145
(tomium)). The landmarks and semilandmarks were digitized in tpsDig2 (Rohlf 2006). The 146
Minimum Bending Energy sliding method (Bookstein 1996, Bookstein 1997) was used to slide 147
the semilandmarks in tpsRelw (Rohlf 2010), as this is more reliable when morphological 148
variation is large (Perez et al. 2006; Fernández-Montraveta and Marugán-Lobón 2017). Shape 149
data (i.e. Procrustes coordinates) was extracted using a full Procrustes fit and imported to 150
MorphoJ (Klingenberg 2008), PAST v.3.15 (Hammer et al. 2009) and the R package geomorph 151
v. 3.0.6 (Adams et al. 2018), where all the subsequent analyses were performed. Preliminary 152
analyses revealed that slender, straight beaks are consistently associated with higher values of 153

log-centroid size (CS; SM. Figure 3, SM. Table 5). This is undesirable as it may erroneously 154
exaggerate allometric effects particularly when, variance is very skewed towards one direction, 155
impeding our ability to reliably test for allometry using centroid size (Bookstein, 1991). Beak 156
allometry was therefore assessed using species-average body mass data (BM) taken from 157
Wilman et al. (2014). 158
159
2.3. Biting mechanical advantage 160
Mechanical Advantage (MA) is a metric derived from lever mechanics (e.g. Uicker et 161
al. 2011) and a well-established functional trait describing the trade-off between bite force 162
transmission and jaw closing speed during biting in vertebrates (e.g., Westneat, 1994; 163
Anderson et al. 2008; Sakamoto 2010). Given the same force input, a high MA indicates a 164
relatively more forceful bite; low MA indicates a relatively less forceful but faster bite. MA is 165
calculated as the ratio of the length of the in-lever divided by the length of the out-lever (Uicker 166
et al. 2011) and was determined for each species’ skull at two different bite points (Fig. 2). The 167
in-lever arm here is defined as the orthogonal distance from the mandibular articular facet of 168
the quadrate (the fulcrum) to the intersection point with the midline of the fossa temporalis 169
between the postorbital and zygomatic processes of the skull, where the midline of the adductor 170
mandibulae group lies, which is the main adductor muscle group in modern birds (i.e. m. 171
adductor mandibulae externus medialis/superficialis (m. AMEM/S), Sustaita 2008; 172
Lautenschlager et al. 2014)(Fig. 2). 173
The out-lever arms are defined as the linear distance from the articular facet of the 174
quadrate to the tip of the bony beak (i.e. landmark 1; anterior out-lever) or to the midpoint on 175
the tomial curve bisecting landmarks 1 and 3 (posterior out-lever; Fig. 2). This approximates 176
the mechanics of avian jaw closure as a 2D, third-class lever system, although the three-177
dimensional lever system is often more complex than this (Olsen and Westneat 2016). Lever 178

arm measurements were taken for each species using ImageJ (Rasband 1997). As anterior and 179
posterior MA values (as defined here) show a strong correlation (SM. Fig. 2), for simplicity 180
we only used anterior MA for all the subsequent analyses. 181
182
2.4. Statistics 183
A Principal Component Analysis (PCA) on the Procrustes shape data was performed in 184
MorphoJ to explore the main patterns of beak shape variation. We mapped the phylogeny onto 185
the PC scores in MorphoJ using the weighted squared-change parsimony method (Maddison 186
1991) to visualize changes in beak shape along the phylogeny (i.e., in the terminals and internal 187
nodes). The phylogeny was also mapped over the anterior MA values to visually explore the 188
changes in MA in MorphoJ using the weighted squared-change parsimony method. Anterior 189
MA values were also mapped as isoclines over the PC1-3 phylomorphospace plots using the 190
software MATLAB (Grant et al. 2008). 191
We used phylogenetically informed (Phylogenetic Generalized Least Squares, PGLS) 192
regressions to test for potential correlations between our trophic data, MA, size, and beak shape 193
variation using the R package geomorph v. 3.0.6 (Adams et al. 2018). Specifically, we tested 194
six pairwise relationships (Fig. 2): 1) beak shape variation and log-BM, to test if beak shape 195
variation is allometric; 2) MA and log-BM, to test if MA variation is allometric; 3) the 196
relationship between beak shape and MA; 4) the relationship between beak shape and dietary 197
preferences; 5) the relationship between MA and dietary preferences; and 6) the relationship 198
between BM and dietary preferences. PGLS regressions with dietary preferences as the 199
independent variables also included UBF categories as a factor to account for the complex 200
relationship between the dependent variables (i.e., beak shape, MA and log-BM), dietary 201
preferences (i.e., matrix of diet), and feeding behaviour (i.e., UBF categories). 202

Phylogenetic MANOVAs were conducted in the R package geomorph v. 3.0.6 to test for 203
pairwise differences in: 1) beak shape; 2) MA; and 3) body mass between UBF group means. 204
Because our variables are unevenly dispersed across our phylogeny (e.g., specialized 205
piscivorous taxa belong mostly within particular clades, Fig. 1), which can severely reduce 206
statistical power of linear models (Adams & Collyer, 2018), we used randomizing residuals in 207
a permutation procedure (10,000 iterations implemented in geomorph v.3.0.6, Adams et al. 208
2018) to assess statistical significance for all PGLS regressions and Phylogenetic MANOVAs, 209
as this has been shown to be more robust to group-clade aggregations (Adams and Collyer, 210
2018). Furthermore, because dietary preferences and UBF categories covary with each other 211
(R2 = 0.05547, F = 1.9848, Z = 2.2061, P = 0.023; e.g., taxa who use the beak for tearing tend 212
to consume a higher percentage of vertebrates (e.g. raptors), Fig. 1) we used type II 213
(conditional) sums of squares to assess the statistical significance of those PGLS linear models 214
including both dietary preferences and UBF groups (Adams and Collyer, 2018). 215
Current implementations of PGLS regressions assume a Brownian Motion mode of evolution. 216
To test if our data meets this requirement, we compared the relative fit of the estimated 217
residuals of shape, MA, and body mass to three different models of evolution: Brownian 218
Motion, Ornstein–Uhlenbeck, and Early-Burst. We used the residuals of the PGLS linear 219
models conducted in this study and the AICc criterion to ascertain which model best fits the 220
data in each case (the one yielding the lowest AICc value). For shape data, fitting these models 221
requires reducing its dimensionality, therefore we used the first nine PCs (accounting for ~99% 222
of the variancein all the PGLS models where shape is the independent variable). Brownian 223
Motion is only preferred over the other models in the PGLS model of mechanical advantage as 224
a function of diet. For the remaining PGLS models, the Ornstein–Uhlenbeck model is 225
preferred, and only a small difference in AICc value in all the cases (except for the two PGLS 226
allometric models which are either non-significant, or significant but explain little shape 227

variance in our sample; Table 1; SM. Table 6). We therefore interpret that our data do not 228
greatly deviate from a Brownian Motion model of evolution, and thus meet the expectations of 229
the PGLS linear models. Nevertheless, these results must be taken cautiously, as recent 230
research suggests current model-fitting methods based on maximum likelihood are prone to 231
exhibit ill-conditioned covariance matrices that could lead to errors of interpretation (Adams 232
and Collyer, 2017). The implementation of more complex evolutionary models for analyses of 233
high dimensional data is not fully developed (Monteiro, 2013), therefore, it is a methodological 234
endeavour that goes beyond the scope of this paper. 235
236
Variation along shape vectors is displayed as thin-plate spline deformations of an 237
outline diagram based on the lateral beak outline of the plush-crested jay (Cyanocorax 238
chrysops, Corvidae, Passeriformes), the species which is most similar to the Procrustes mean. 239
The coefficients from the PGLS regressions with shape as the dependent variable were used to 240
calculate the beak shape differences along the regression vectors. The R code used for all the 241
analyses is provided in the Supplementary Materials. 242
243
3. Results 244
3.1. Beak shape, mechanical advantage, and allometry 245
The first three principal components (PCs) explain 92.54% of the total shape variance 246
in our sample, implying that few dimensions underlie beak shape variation. The main axes of 247
beak shape recovered in this study (Fig. 3 & 4, and Supplementary Materials) are roughly 248
equivalent to those recovered by a crowd-sourced study encompassing the 3D beak shapes of 249
more than 2,000 species of modern birds (Cooney et al. 2017), suggesting that discarding the 250
third dimension and rhamphotheca produces comparable patterns of avian beak disparity at this 251
macroevolutionary level. Namely, our PC1 describes the same lateral shape change (thin and 252

straight, to deep and down-curved). Similarly, our PC2 (thin and curved, to deep and straight) 253
and PC3 (down-curved to slightly upturned) explain similar shape changes to Cooney et al.’s 254
PCs 2 and 4. While some groups of birds cluster within restricted areas associated with deeper 255
and curved beak shapes (e.g. Accipitriformes, Strigiformes, Falconiformes, and 256
Psittaciformes), several species or clades widely diverge from their sister groups to different 257
areas of the PC-space (e.g. Semnornis, Piciformes; Podargus, Caprimulgiformes; 258
Phoenicopterus, Phoenicopteriformes; the family Anatidae) or to cluster within the deep and 259
curved scatter (e.g. Carduelis, Passeriformes; Musophaga, Cuculiformes; Figs. 3 & 4). PGLS 260
regression of beak shape on log-BM is not significant (P = 0.362) (Table 1, SM. Figure 5) 261
revealing that beak shape allometry across birds as a whole is negligible. 262
Mechanical advantage varies from low force/high speed transmission values of 0.02 263
(anterior MA) to 0.035 (posterior MA) in the Eurasian curlew (Numenius arquata), to more 264
forceful values of 0.44 (anterior MA) - 0.55 (posterior MA) in the Finch’s pygmy parrot 265
(Micropsitta finschii; Figs. 3 & 5, and SM. Table 1). However, MA values are generally low, 266
and 80% of the taxa possess anterior MA values < 0.14 (Figs. 3B & 5 and SM. Table 1). Plotting 267
MA over the PC1-3 space (Fig. 3A) reveals a broad trend between shape and MA: low MA 268
values in positive PC1 (thinner, straighter beaks) and higher MA values in negative PC1 269
(deeper, more curved beaks). However, the trend is not linear, and there are islands of high 270
MA, meaning that two taxa separated by small Procrustes distances may have quite different 271
MA values. This biomechanical decoupling is particularly noticeable between tearing (i.e. 272
mostly raptors) and cracking birds (i.e. mostly parrots). For instance, the boreal owl (Aegolius 273
funereus, Strigiformes) and the hyacinth macaw (Anodorhynchus hyacinthus, Psittaciformes) 274
show a Procrustes distance of only 0.073 between their beak shapes but they show extremely 275
different anterior MA values (Fig. 3). Anterior MA values show a significant but weak 276
(R2=0.03479, P=0.014) correlation with body mass (Table 1; SM. Fig. 5). 277
Although mechanical advantage data shows a statistically significant phylogenetic 278
structure (P < 0.0001), most internal nodes are constrained to a narrow range of relatively low 279
MA (Fig. 3B). Only two lineages clearly diverge from this: parrots (Psittaciformes), which 280
explore more than half of the upper range of MA values; and sandpipers, snipes, and phalaropes 281
(Scolopacidae), with extremely low MA values (Fig. 3B & SM. Table 1). Some pheasants (e.g. 282
Perdix) also exhibit high values of MA within the range of Psittaciformes, along with some 283
specialized cracking/biting passerines such as the Northern cardinal (Cardinalis cardinalis) 284
(Figs. 3 & 5). Clustering near the Psittaciformes with lower values of MA are mainly 285
herbivorous taxa such as the snow goose (Chen caerulescens), the common linnet (Carduelis 286
cannabina), the Western capercaillie (Tetrao urogallus), and the least seedsnipe (Thinocorus 287
rumicivorus), as well as the Andean condor (Vultur gryphus). The latter represents a clear 288
deviation from the general low MA values of Accipitriformes (Figs. 3 & 5), due to a ventral 289
deflection of the beak tip that shortens the out-lever of New World vultures (Cathartidae) 290
relative to the Old World vultures (Accipitridae). 291
PGLS regression of beak shape on anterior MA values exhibits a significant (R2= 0.133, 292
P < 0.0001) correlation (Fig. 5). The shape differences described by this regression vector are 293
remarkably similar to those described by PC1: thin, straight, long beaks (positive PC1) show 294
the lowest values of MA, while deep, curved beaks (negative PC1) show the highest. Deviating 295
from this general trend with much lower values of MA than predicted by the regression is the 296
majority of the tearing group, composed of the Accipitriformes; the northern crested caracara 297
(Caracara cheriway, Falconiformes); and Strigiformes (Figs.1 & 5), which do not comprise a 298
monophyletic assemblage (Hackett et al. 2008; Jarvis et al. 2014; Prum et al. 2015; Fig. 1). The 299
remaining Falconiformes cluster closer to parrots than to other raptors, exhibiting higher values 300
than the rest of raptors (Fig. 5). 301
3.2. Beak shape and feeding ecology 302

PGLS regression of beak shape as a function of dietary preferences and UBF revealed 303
a significant but weak correlation between beak shape and overall dietary habits (R2=0.1156, 304
P=0.001; Table 2). The effect of UBF groups in beak shape variation is also statistically 305
significant but the correlation is not strong (R2=0.0923, P=0.001) (Table 2). Such results are 306
largely congruent with visual inspection of the PC1-3 plot, where the main dietary groups 307
overlap without any clear separation, and UBF groups exhibit only slightly clearer 308
regionalization (Fig. 4). For instance, tearing and cracking/biting birds tend to occupy the same 309
areas of the morphospace, being restricted to deep and curved shapes in the negative extreme 310
of PC1 (Fig. 4). Probing birds are restricted to the positive side of PC1, exhibiting relatively 311
thin and straight shapes. Pecking/grazing taxa are restricted to approximately 0.0 - 0.1 on PC3, 312
exhibiting relatively straight and flat beaks (Fig. 4). However, Phylogenetic MANOVA shows 313
that none of the UBF group mean beak shapes are significantly different to any others (SM. 314
Table 3) when phylogeny is accounted for. 315
Thin straight beaks tend to be associated with a higher percentage of invertebrate 316
consumption in birds, and deeper curved beaks are associated with consumption of more 317
mechanically demanding food items such as vertebrates and seeds (Fig. 6). Thin and slightly 318
curved beaks are also associated with highly piscivorous taxa (SM. Figs. 5 & 7), which together 319
with visual inspection of shape vectors associated with other axes of dietary variations 320
underlines that similar beak shapes are associated with disparate dietary regimes (SM. Figs. 5 321
& 7). Furthermore, regressions show that the relationship between beak shape and dietary 322
preferences differs between UBF groups (Table 2; SM. Figs. 6 & 7), and that while there are 323
diet-dependent allometric relationships in our data, these are not affected by UBF behavioural 324
groups(SM. Table 4). 325
3.3. Biting mechanical advantage and feeding ecology 326

PGLS regression of anterior MA values as a function of dietary preferences and UBF 327
groups reveal a statistically significant correlation (R2=0.1692, P=0.001; Table 2) that is 328
stronger than the relationship between beak shape and those measures of dietary ecology. 329
Higher values of MA are consistently associated with cracking/biting taxa, and those whose 330
diets rely heavily on plant matter, with large proportions of items such as fruits and drupes, 331
seeds, bulbs, shoots, grass or leaves (Fig. 6). Phylogenetic MANOVA revealed no pairwise 332
differences between any of the groups based on MA values (SM. Table 3). We found a strong 333
significant interaction between dietary preferences and UBF groups (R2=0.26376, P=0.001) 334
revealing that the relationship between diet and MA varies depending on the feeding behaviour 335
(Table 2; SM. Fig. 6). 336
3.4. Body mass and feeding ecology 337
PGLS regression of log-body mass as a function of dietary preferences and UBF groups 338
reveals a stronger correlation of body size with feeding ecology than that of both beak shape 339
and MA with feeding ecology, with dietary variations explaining as much as 25% of log-body 340
mass variation (Table 2). Visual inspection of the regression scores of log-body mass 341
associated with the first axis of diet variation (PCo1) reveal that taxa with large amounts of 342
invertebrates in their diet tend to be smaller, while some dietary groups such as scavengers tend 343
to be associated with bigger sizes (Fig. 6). 344
UBF groups are only weakly associated with log-BM and none of the UBF groups are 345
statistically different to any other in log-BM (SM. Table 2), although significant diet/UBF 346
interactions reveal that different behavioural groups exhibit different body size to diet 347
relationships (Table 2; SM. Fig. 6). 348
349
4. Discussion 350

Our analyses aimed to quantitatively test the common wisdom that feeding adaptation 351
is one of the main drivers of beak morphological diversification in modern birds. Our results 352
suggest that adaptation to dietary composition is not as fine-tuned as generally perceived, and 353
there is not a close to one-to-one mapping of beak shape on feeding ecology. At a broad 354
macroevolutionary scale, we found a more complex but weak overall covariation between beak 355
shape and diet, with other factors such as biting mechanical advantage and body size being 356
stronger covariates for feeding autecology. Similar beak shapes are associated with the 357
increased consumption of different food items (i.e. a one-to-many relationship between shape 358
and ecology) and the relationship between beak shape and dietary preferences is different 359
within different UBF groups, likely owing to the ecological heterogeneity of feeding behaviour 360
groups (i.e. many-to-one ecology to behaviour relationships). For instance, probing birds in our 361
sample are composed primarily of two very ecologically different groups: longirostrine waders 362
(e.g. Numenius, Gallinago, Limosa) and the kiwi (Apteryx), and anseriforms (e.g. Aythya, Anas, 363
Cygnus), which both use the beak during feeding as a probing tool in (mostly) soft substrates 364
(SM. Figs. 1 & 6). 365
Our results suggest that the beak is generally used as a versatile, tweezer-like clamp. 366
Mechanical pre-processing of food (i.e. tearing and cracking/biting feeding behaviours) is 367
generally associated with deep and curved beaks, which are able to accommodate 368
comparatively higher stresses than thinner, straighter beaks (Soons et al. 2010; Soons et al. 369
2015). Similarly, beaks well-suited for sensing and probing in fluid or soft soils tend to be long 370
and thin (Barbosa and Moreno 1999). While such shapes represent the ends of a clear 371
ecomorphological spectrum it is difficult to predict where a given species should fall upon it, 372
as species well-suited for performing a certain feeding behaviour may not actually use their 373
beaks in the way we would expect given their morphology (e.g. the kakapo, Strigops, has a 374
typically parrot-like beak well suited for cracking/biting, yet chooses to feed on soft leafy 375

vegetation rather than fruits or seeds). Most of the species studied fell between these extremes 376
in ecomorphology, using the beak for grabbing/gleaning or pecking/grazing, and exhibiting a 377
broad range of beak morphologies therein (i.e. many-to-one mapping of shape and behaviour). 378
Furthermore, the majority of bird taxa show values of anterior MA congruent with fast gapes 379
and low bite force transmission, and many of these belong to the grabbing/gleaning behavioural 380
group, which occupies virtually all of beak shape and functional space 381
We found a significant relationship between beak shape and mechanical advantage: 382
increased values of anterior MA are strongly correlated with increased beak depth/length ratio, 383
driven, in part, by shortening of the beak, and suggesting that enhanced biting force 384
transmission requires a deeper beak to accommodate higher stresses and avoid fracture (Soons 385
et al. 2010; Soons et al. 2015). However, this relationship differs between taxa, and thus 386
indicates a many-to-one relationship between shape and this functional trait. Raptorial birds 387
are interesting, as they have much lower anterior MA values than predicted by the general 388
regression. Initially this may be surprising, given the predatory nature of raptors, yet this result 389
is congruent with previous research showing that Strigiformes and Accipitriformes rely heavily 390
on talon adaptations to kill their prey (Sustaita 2008; Sustaita and Hertel 2010; Del Hoyo et al. 391
2017; Madan et al. 2017). Deep beak morphologies are, however, associated with enhanced 392
biting MA in the two taxa representing falconin falconiformes (Falconinae, Falconidae; Falco 393
and Herpetotheres). Falcons dispatch prey with their beaks rather than their talons (Sustaita 394
2008; Sustaita and Hertel 2010; Del Hoyo et al. 2017), which may explain why both falconid 395
taxa differ from the other raptors and instead follow the general regression trend for all avians. 396
The evolution of faster gapes and comparatively weaker bite force advantage happen 397
primarily within the Charadriiformes (i.e. Scolopacidae). Unique modes of cranial kinesis, such 398
as distal and double rhynchokinesis (i.e., avian cranial kinesis characterized by additional 399
bending areas in the tip of the beak, and in both the tip and the base of the beak, respectively 400

(Zusi 1993; Estrella et al. 2007)), appear in this clade of mainly probing taxa, and could further 401
enhance gape speed. In contrast, comparatively slower gapes and enhanced biting force 402
transmission evolve less frequently. Parrots (Psittaciformes) are the most notable and extreme 403
example, especially when we consider that their mechanical advantage values here may be 404
underestimated, thanks to novel adductor muscles and skeletal adaptations which may enhance 405
lever efficiency in some parrots (Zusi 1993; Tokita et al. 2007). Our results suggest that dietary 406
transitions towards increased herbivory are correlated with evolutionary changes towards 407
higher anterior MA, implying that herbivory imposes higher performance demands on the beak. 408
This observation is congruent with previous ecomorphological studies on waterfowl (Olsen 409
2017) 410
The transfer of grasping and manipulation behaviours from the forelimbs to the beak in 411
bird evolution has necessitated that bird beaks be highly versatile, used in virtually every aspect 412
of their biology, not just feeding and foraging (Bhullar et al. 2016). The complex evolutionary 413
scenario demonstrated by our results suggests that diverse and multidirectional selective 414
pressures were involved in beak morphological diversification, reflective of functional and 415
behavioural multitasking. In this evolutionary context, a fast, generic grabbing tool could most 416
easily fit the required compromise of functional versatility (i.e. trade-off between varied beak 417
functions), explaining the prevalence of thin and straight beak shapes and optimization for low-418
force transmission high-speed gapes in our sample. More nuanced relationships between 419
feeding adaptation and beak shape may be operating, with variable strength, within lower 420
taxonomic levels, in order to accommodate different macroevolutionary regimes and trade-421
offs. For example, while a strong association between feeding ecology and beak shape 422
characterizes the diversification patterns within waterfowl (Olsen 2017), skull centroid size, 423
not diet, is a major driver of beak shape in diurnal raptors (Bright et al. 2016). Nevertheless, 424
our data support the idea that beak shape and mechanical advantage reflect the mechanical 425
demands of specific feeding and foraging strategies (Bowman 1961; Schwenk 2000). This 426
relationship may be best envisioned as a threshold rather than a one-to-one connection, with 427
certain shapes and mechanical properties critically needed to perform certain functions and 428
feeding behaviours (e.g., in order to avoid fracture). In agreement with these views, some 429
species of Darwin’s finches show dietary habits and feeding strategies that are more flexible 430
than previously thought; their specialized beak phenotypes (e.g. cracking/biting) are still 431
efficient in processing many other dietary resources, which might lead to the evolutionary 432
retention of these phenotypes (i.e. Liem’s paradox; Tebbich et al. 2004). 433
In conclusion, our results imply that the relationship between beak shape and feeding 434
ecology at a broad macroevolutionary scale may be more complex than usually assumed. This 435
is particularly important in fossil taxa, where trophic hypotheses are rarely testable (e.g., 436
fossilised gut contents). In light of these results, it is important to evaluate the strength of the 437
relationships between form, functional traits, and feeding behaviour within a taxonomic 438
context, before drawing trophic assumptions based solely on beak morphology. In doing so, 439
we will open pathways for a more detailed understanding of the role of trophic adaptation in 440
shaping avian diversity. 441
442
443
References 444
Adams, D. C., F. J. Rohlf, and D. E. Slice. 2013. A field comes of age: geometric 445
morphometrics in the 21st century. Hystrix 24:7. 446
Adams, D.C. and Collyer, M.L., 2018. Phylogenetic ANOVA: Group‐clade aggregation, 447
biological challenges, and a refined permutation procedure. Evolution. 448
Adams, D.C. and Collyer, M.L., 2017. Multivariate phylogenetic comparative methods: 449
evaluations, comparisons, and recommendations. Systematic biology, 67(1), pp.14-31. 450
Adams, D. C., M. L. Collyer, and A. Kaliontzopoulou. 2018. Geomorph: Software for 451
geometric morphometric analyses. R package version 3.0.6. https://cran.r-452
project.org/package=geomorph. 453
Anderson, R. A., L. D. McBrayer, and A. Herrel. 2008. Bite force in vertebrates: opportunities 454
and caveats for use of a nonpareil whole‐animal performance measure. Biological 455
Journal of the Linnean Society 93:709-720. 456
Baab, K. L., J. M. Perry, F. J. Rohlf, and W. L. Jungers. 2014. Phylogenetic, ecological, and 457
allometric correlates of cranial shape in Malagasy lemuriforms. Evolution 68:1450-458
1468. 459
Barbosa, A. and E. Moreno. 1999. Evolution of foraging strategies in shorebirds: an 460
ecomorphological approach. The Auk 1:712-725. 461
Bardwell, E., C. W. Benkman, and W. R. Gould. 2001. Adaptive Geographic Variation in 462
Western Scrub‐jays. Ecology 82:2617-2627. 463
Benkman, C. W. 1988. Seed handling ability, bill structure, and the cost of specialization for 464
crossbills. The Auk 1:715-719. 465
Bhullar, B.-A. S., M. Hanson, M. Fabbri, A. Pritchard, G. S. Bever, and E. Hoffman. 2016. 466
How to make a bird skull: major transitions in the evolution of the avian cranium, 467
paedomorphosis, and the beak as a surrogate hand. Integrative and Comparative 468
Biology 56:389-403. 469
Bookstein, F.L., 1991, July. Thin-plate splines and the atlas problem for biomedical images. 470
In Biennial International Conference on Information Processing in Medical 471
Imaging (pp. 326-342). Springer, Berlin, Heidelberg. 472
Bookstein, F.L. 1996. Applying landmark methods to biological outline data. In Image Fusion 473
and Shape Variability (eds. Mardia KV, Gill CA, Dryden IL), pp. 79–87. University of 474
Leeds Press, Leeds, U.K. 475

Bookstein, F.L. 1997. Landmark methods for forms without landmarks: localizing group 476
differences in outline shape. Med. Image Anal. 1: 225–243. 477
Bowman, R. 1961. Morphological differentiation and adaptation in the galápagos finches. 478
Diferenciación morfológica y adaptación en los pinzones de las galápagos. University 479
of California Publications in Zoology 58:1-302. 480
Bright, J. A., J. Marugán-Lobón, S. N. Cobb, and E. J. Rayfield. 2016. The shapes of bird beaks 481
are highly controlled by nondietary factors. Proceedings of the National Academy of 482
Sciences 113(19):201602683. 483
Clayton, D. H., B. R. Moyer, S. E. Bush, T. G. Jones, D. W. Gardiner, B. B. Rhodes, and F. 484
Goller. 2005. Adaptive significance of avian beak morphology for ectoparasite control. 485
Proceedings of the Royal Society B: Biological Sciences 272:811-817. 486
Cooney, C. R., J. A. Bright, E. J. Capp, A. M. Chira, E. C. Hughes, C. J. Moody, L. O. Nouri, 487
Z. K. Varley, and G. H. Thomas. 2017. Mega-evolutionary dynamics of the adaptive 488
radiation of birds. Nature 542:344-347. 489
Darwin, C. 1859. On the origin of the species by natural selection. John Murray, London. 490
Darwin, C. and A. Wallace. 1858. On the tendency of species to form varieties; and on the 491
perpetuation of varieties and species by natural means of selection. Zoological Journal 492
of the Linnean Society 3:45-62. 493
Del Hoyo, J., A. Elliot, J. Sargatal, D. A. Christie, and E. de Juana (eds.). 2017a. Handbook of 494
the Birds of the World Alive. Lynx Editions, Barcelona. 495
Estrella, S. M., J. A. Masero, and A. Pérez-Hurtado. 2007. Small-prey Profitability: Field 496
Analysis of Shorebird’s use of Surface Tension of Water to Transport Prey. The Auk 497
124:1244-1253. 498
Felice, R. N. and A. Goswami. 2018. Developmental origins of mosaic evolution in the avian 499
cranium. Proceedings of the National Academy of Sciences 115:555-560. 500
Felsenstein, J. 1985. Phylogenies and the comparative method. The American Naturalist 125:1-501
15. 502
Fernández-Montraveta, C. and J. Marugán-Lobón. 2017. Geometric morphometrics reveals 503
sex-differential shape allometry in a spider. PeerJ 5:e3617. 504
Gill, F. B. 1995. Ornithology (2nd edition). Freeman, New York. 505
Gosler, A. 1987. Pattern and process in the bill morphology of the Great Tit Parus major. Ibis 506
129:451-476. 507
Grant, B. R. and P. R. Grant. 1993. Evolution of Darwin's finches caused by a rare climatic 508
event. Proceedings of the Royal Society of London B: Biological Sciences 251:111-509
117. 510
Grant, P. R. and B. R. Grant. 2002. Unpredictable evolution in a 30-year study of Darwin's 511
finches. Science 296:707-711. 512
Grant, P. R. and B. R. Grant. 2006. Evolution of character displacement in Darwin's finches. 513
Science 313:224-226. 514
515
Grant, M., S. Boyd, and Y. Ye. 2008. CVX: Matlab software for disciplined convex 516
programming. Web page and software available at http://stanford. edu/∼ boyd/cvx. 517
Greenberg, R., V. Cadena, R. M. Danner, and G. Tattersall. 2012. Heat loss may explain bill 518
size differences between birds occupying different habitats. PLoS One 7:e40933. 519
Hackett, S. J., R. T. Kimball, S. Reddy, R. C. Bowie, E. L. Braun, M. J. Braun, J. L. 520
Chojnowski, W. A. Cox, K.-L. Han, and J. Harshman. 2008. A phylogenomic study of 521
birds reveals their evolutionary history. Science 320:1763-1768. 522
Hamilton, T. H. and I. Rubinoff. 1963. Isolation, endemism, and multiplication of species in 523
the Darwin finches. Evolution 17:388-403. 524
Hammer, Ø., D. Harper, and P. Ryan. 2009. PAST-PAlaeontological STatistics, ver. 1.89. 525
University of Oslo, Oslo. 526
Hansell, M. 2000. Bird nests and construction behaviour. Cambridge University Press, 527
Cambridge, U.K. 528
Herrel, A., J. Podos, B. Vanhooydonck, and A. P. Hendry. 2009. Force–velocity trade‐off in 529
Darwin's finch jaw function: a biomechanical basis for ecological speciation? 530
Functional Ecology 23:119-125. 531
Jarvis, E. D., S. Mirarab, A. J. Aberer, B. Li, P. Houde, C. Li, S. Y. Ho, B. C. Faircloth, B. 532
Nabholz, and J. T. Howard. 2014. Whole-genome analyses resolve early branches in 533
the tree of life of modern birds. Science 346:1320-1331. 534
Jetz, W., G. Thomas, J. Joy, K. Hartmann, and A. Mooers. 2012. The global diversity of birds 535
in space and time. Nature 491:444-448. 536
Klingenberg, C. 2008. MorphoJ. Faculty of Life Sciences, University of Manchester. 3:75-77. 537
Klingenberg, C. P. 2013. Cranial integration and modularity: insights into evolution and 538
development from morphometric data. Hystrix 24:43-58. 539
Klingenberg, C. P. and J. Marugán-Lobón. 2013. Evolutionary covariation in geometric 540
morphometric data: analyzing integration, modularity, and allometry in a phylogenetic 541
context. Systematic Biology 62(4):591-610. 542
Kulemeyer, C., K. Asbahr, P. Gunz, S. Frahnert, and F. Bairlein. 2009. Functional morphology 543
and integration of corvid skulls–a 3D geometric morphometric approach. Frontiers in 544
Zoology 6:1. 545
Lachenbruch, P. A. 1967. An almost unbiased method of obtaining confidence intervals for the 546
probability of misclassification in discriminant analysis. Biometrics 1:639-645. 547
Lack, D. 1940. Evolution of the Galapagos finches. Nature 146:324-327. 548

Lamichhaney, S., F. Han, M. T. Webster, L. Andersson, B. R. Grant, and P. R. Grant. 2018. 549
Rapid hybrid speciation in Darwin’s finches. Science 359:224-228. 550
Lauder, G. V. 1995. On the inference of function from structure. 1:1-18. In J. J. Thomason 551
(ed.), Functional Morphology in Vertebrate Paleontology. Cambridge University Press, 552
New York. 553
Laumer, I., T. Bugnyar, S. Reber, and A. Auersperg. 2017. Can hook-bending be let off the 554
hook? Bending/unbending of pliant tools by cockatoos. Proc. R. Soc. B. The Royal 555
Society 284(1862):20171026 556
Lautenschlager, S., J. A. Bright, and E. J. Rayfield. 2014. Digital dissection–using contrast‐557
enhanced computed tomography scanning to elucidate hard‐and soft‐tissue anatomy in 558
the Common Buzzard Buteo buteo. Journal of Anatomy 224:412-431. 559
Legendre, P. and Anderson, M.J., 1999. Distance‐based redundancy analysis: testing 560
multispecies responses in multifactorial ecological experiments. Ecological 561
monographs, 69(1), pp.1-24. 562
Lieberman, D. 2011. The evolution of the human head. Harvard University Press, Cambridge, 563
MA. 564
Liem, K. F. 1980. Adaptive significance of intra-and interspecific differences in the feeding 565
repertoires of cichlid fishes. American Zoologist 20:295-314. 566
Madan, M. A., E. J. Rayfield, and J. A. Bright. 2017. Scaling and functional morphology in 567
strigiform hind limbs. Scientific Reports 7:44920. 568
Maddison, W.P., 1991. Squared-change parsimony reconstructions of ancestral states for 569
continuous-valued characters on a phylogenetic tree. Systematic Biology, 40(3), 570
pp.304-314. 571

Martín-Serra, A., B. Figueirido, and P. Palmqvist. 2014. A three-dimensional analysis of 572
morphological evolution and locomotor performance of the carnivoran forelimb. PLoS 573
One 9:e85574. 574
Marugán-Lobón, J., D. Blanco-Miranda, B. Chamero, and H. Martín-Abad. 2013. On the 575
importance of examining the relationship between shape data and biologically 576
meaningful variables. An example studying allometry with geometric morphometrics. 577
[Importancia de investigar la relación entre la forma y variables con sentido biológico. 578
Un ejemplo estudiando la alometría con morfometría geométrica]. Spanish Journal of 579
Palaeontology 28 (2):139-148. 580
Monteiro, L.R., 2013. Morphometrics and the comparative method: studying the evolution of 581
biological shape. Hystrix, the Italian Journal of Mammalogy, 24(1), pp.25-32. 582
Moyer, B. R., A. T. Peterson, and D. H. Clayton. 2002. Influence of bill shape on ectoparasite 583
load in Western Scrub-Jays. The Condor 104:675-678. 584
Navarro, J., A. Kaliontzopoulou, and J. González-Solís. 2009. Sexual dimorphism in bill 585
morphology and feeding ecology in Cory's Shearwater (Calonectris diomedea). 586
Zoology 112:128-138. 587
Olsen, A. M. 2017. Feeding ecology is the primary driver of beak shape diversification in 588
waterfowl. Functional Ecology 31(10):1985-1995. 589
Olsen, A. M. and M. W. Westneat. 2016. Linkage mechanisms in the vertebrate skull: Structure 590
and function of three‐dimensional, parallel transmission systems. Journal of 591
Morphology 277:1570-1583. 592
Olson, E. C. and R. L. Miller. 1999. Morphological integration. University of Chicago Press, 593
Chicago. 594

Perez, S. I., V. Bernal, and P. N. Gonzalez. 2006. Differences between sliding semi‐landmark 595
methods in geometric morphometrics, with an application to human craniofacial and 596
dental variation. Journal of Anatomy 208:769-784. 597
Peterson, A. T. 1993. Adaptive geographical variation in bill shape of scrub jays (Aphelocoma 598
coerulescens). The American Naturalist 142:508-527. 599
Podos, J. 2001. Correlated evolution of morphology and vocal signal structure in Darwin's 600
finches. Nature 409:185. 601
Price, T. 1991. Morphology and ecology of breeding warblers along an altitudinal gradient in 602
Kashmir, India. The Journal of Animal Ecology :643-664. 603
Prum, R. O., J. S. Berv, A. Dornburg, D. J. Field, J. P. Townsend, E. M. Lemmon, and A. R. 604
Lemmon. 2015. A comprehensive phylogeny of birds (Aves) using targeted next-605
generation DNA sequencing. Nature 526(7574):569 606
Rambaut, A. and A. Drummond. 2013. TreeAnnotator v1. 7.0. Available as part of the BEAST 607
package at http://beast.bio.ed.ac.uk. 608
Rasband, W. 1997. ImageJ. US National Institutes of Health, Bethesda, MD. 609
Rohlf, F. 2006. tpsDig, version 2.10. Department of Ecology and Evolution, State University 610
of New York, Stony Brook. 611
Rohlf, F. 2010. tpsRelw, relative warps analysis. Department of Ecology and Evolution, State 612
University of New York at Stony Brook, Stony Brook, NY. 613
Rohlf, F. J. and M. Corti. 2000. Use of two-block partial least-squares to study covariation in 614
shape. Systematic Biology :740-753. 615
Rubega, M. A. 2002. Feeding in birds: approaches and opportunities. In Schwenk, K. (ed.) 616
Feeding: Form, function and evolution in tetrapod vertebrates :395–408. Academic 617
Press, New York. 618
619

Sakamoto, M., 2010. Jaw biomechanics and the evolution of biting performance in theropod 620
dinosaurs. Proceedings of the Royal Society of London B: Biological 621
Sciences, 277(1698), pp.3327-3333. 622
Schluter, D. and P. R. Grant. 1984. Determinants of morphological patterns in communities of 623
Darwin's finches. The American Naturalist 123:175-196. 624
Schwenk, K. 2000. Feeding in lepidosaurs. In Schwenk, K. (ed.) Feeding: Form, function and 625
evolution in tetrapod vertebrates :175-291. Academic Press, New York. 626
Soons, J., A. Genbrugge, J. Podos, D. Adriaens, P. Aerts, J. Dirckx, and A. Herrel. 2015. Is 627
Beak Morphology in Darwin’s Finches Tuned to Loading Demands? PLoS One 628
10:e0129479. 629
Soons, J., A. Herrel, A. Genbrugge, P. Aerts, J. Podos, D. Adriaens, Y. De Witte, P. Jacobs, 630
and J. Dirckx. 2010. Mechanical stress, fracture risk and beak evolution in Darwin's 631
ground finches (Geospiza). Philosophical Transactions of the Royal Society of London 632
B: Biological Sciences 365:1093-1098. 633
Stayton, C. T. 2006. Testing hypotheses of convergence with multivariate data: morphological 634
and functional convergence among herbivorous lizards. Evolution 60:824-841. 635
Sustaita, D. 2008. Musculoskeletal underpinnings to differences in killing behavior between 636
North American accipiters (Falconiformes: Accipitridae) and falcons (Falconidae). 637
Journal of Morphology 269:283-301. 638
Sustaita, D. and F. Hertel. 2010. In vivo bite and grip forces, morphology and prey-killing 639
behavior of North American accipiters (Accipitridae) and falcons (Falconidae). The 640
Journal of Experimental Biology 213:2617-2628. 641
Sustaita, D. and M. A. Rubega. 2014. The anatomy of a shrike bite: bill shape and bite 642
performance in Loggerhead Shrikes. Biological Journal of the Linnean Society 643
112:485-498. 644

Tattersall, G. J., D. V. Andrade, and A. S. Abe. 2009. Heat exchange from the toucan bill 645
reveals a controllable vascular thermal radiator. Science 325:468-470. 646
Tebbich, S., M. Taborsky, B. Fessl, M. Dvorak, and H. Winkler. 2004. Feeding behavior of 647
four arboreal Darwin's finches: adaptations to spatial and seasonal variability. The 648
Condor 106:95-105. 649
Temeles, E. J. and W. J. Kress. 2003. Adaptation in a plant-hummingbird association. Science 650
300:630-633. 651
Tokita, M., T. Kiyoshi, and K. N. Armstrong. 2007. Evolution of craniofacial novelty in parrots 652
through developmental modularity and heterochrony. Evolution & Development 9:590-653
601. 654
Tokita, M., W. Yano, H. F. James, and A. Abzhanov. 2017. Cranial shape evolution in adaptive 655
radiations of birds: comparative morphometrics of Darwin's finches and Hawaiian 656
honeycreepers. Phil. Trans. R. Soc. B 372:20150481. 657
Uicker, J.J., Pennock, G.R. and Shigley, J.E., 2011. Theory of machines and mechanisms (Vol. 658
1). New York, NY: Oxford University Press. 659
van De Ven, T., R. Martin, T. Vink, A. E. McKechnie, and S. Cunningham. 2016. Regulation 660
of heat exchange across the hornbill beak: Functional similarities with toucans? PLoS 661
One 11:e0154768. 662
Weir, A. A., J. Chappell, and A. Kacelnik. 2002. Shaping of hooks in New Caledonian crows. 663
Science 297:981-981. 664
Westneat, M.W., 1994. Transmission of force and velocity in the feeding mechanisms of labrid 665
fishes (Teleostei, Perciformes). Zoomorphology, 114(2), pp.103-118. 666
Wilman, H., J. Belmaker, J. Simpson, C. de la Rosa, M. M. Rivadeneira, and W. Jetz. 2014. 667
EltonTraits 1.0: Species‐level foraging attributes of the world's birds and mammals. 668
Ecology 95:2027-2027. 669

Wimpenny, J. H., A. A. Weir, L. Clayton, C. Rutz, and A. Kacelnik. 2009. Cognitive processes 670
associated with sequential tool use in New Caledonian crows. PLoS One 4:e6471. 671
Young, N. M., M. Linde-Medina, J. W. Fondon, B. Hallgrímsson, and R. S. Marcucio. 2017. 672
Craniofacial diversification in the domestic pigeon and the evolution of the avian skull. 673
Nature Ecology & Evolution 1:0095. 674
Zelditch, M. L., D. L. Swiderski, and H. D. Sheets. 2012. Geometric morphometrics for 675
biologists: a primer. Elsevier Academic Press, San Diego, CA. 676
Zusi, R. L. 1993. Patterns of Diversity in the Avian Skull. In Hanken J, Hall BK, (eds.) The 677
skull, Vol. 2: Patterns of Structural and Systematic Diversity :391-437. University of 678
Chicago Press, Chicago, IL. 679
Tables 680
Table 1. Allometric relationships between beak shape, anterior MA, and log-body mass. 681
Summary of the PGLS linear models for Procrustes coordinates (beak shape) and 682
anterior MA (functional trait) as a function of log-body mass (body size). Cells in bold 683
indicate statistical significance (P < 0.05). 684
685
686
687
688
689
Table 2. Summary of the PGLS linear models for Procrustes coordinates (beak shape), 690
anterior MA (functional trait), log-body mass (body size) as a function of dietary 691
preferences, and UBF categories (including main effects of both independent variables 692
and their interaction). Cells in bold indicate statistical significance (P < 0.05). Effect sizes 693
(Z) are computed as standard deviates of the F values’ randomized sampling 694
Allometry
Beak shape Anterior MA
Statistic log-BM log-BM
R2 0.00559 0.03479
F 0.9727 6.2363
Z 0.37606 1.3826
P 0.362 0.014

distributions. P values are calculated for the F values’ randomized sampling 695
distributions. 696
697
698
699
700
701
702
Type II (conditional SS)
Beak shape Mechanical advantage log BM
Statistic Diet UBF Diet:UBF Diet UBF Diet:UBF Diet UBF Diet:UBF
R2 0.1156 0.0923 0.22625 0.1692 0.0697 0.26376 0.2548 0.03927 0.21506
F 2.6229 4.1873 1.2837 4.7547 3.9192 1.8533 5.9806 1.8431 1.2619
Z 3.7041 3.8639 2.9112 3.4418 2.4523 3.0463 3.9382 1.4838 2.2405
P 0.001 0.001 0.002 0.001 0.005 0.001 0.001 0.042 0.01
Figure captions 703
Figure 1. Species-level trophic variables and phylogenetic hypothesis. The dietary 704
preferences for each species are quantified as the proportions of 10 food items that comprise 705
taxon diet. UBF are categorical variables that reflect mechanical differences in use of the beak 706
during feeding (SM. Figure 1). Numbers correspond to clades as detailed in SM. Table 2. 707
708
Figure 2. Schematic overview of the main ecomorphological and functional associations 709
explored in this study by means of PGLS regressions and Phylogenetic MANOVA. 710
Concepts of biological role, behaviour, performance, and structure follow Lauder (1995). 1-3 711
= position of homologous landmarks; red line = in-lever; blue line = posterior out-lever; green 712
line = anterior out-lever. 713
714
Figure 3. Morpho-functional landscape. A) Anterior MA values (a functional trait related 715
with bite force/gape speed transmission) overlaid as heat-map isozones over the 716
phylomorphospace of the first three Principal Components (phylogeny mapped over the scores 717
of PC1-3 by means of minimum least squares) of beak shape variation. B) Anterior MA values 718
mapped over our phylogenetic hypothesis, species labelled by use of beak during feeding 719
(UBF) category. Outlines for the extreme shapes along PC1 correspond to -0.25 and 0.25 720
scores; outlines for the extreme shapes along PC2 and PC3 correspond to scores of -0.15 and 721
0.15. 722
723
Figure 4. Relationship between beak shape, diet, and use of beak during feeding (UBF). 724
PC1-3 plots with species labelled by main component of diet (categorical). Convex hulls 725
indicate the morphospace occupancy of each of the use of beak during feeding (UBF) groups: 726
dark grey (filled) = cracking/biting; red (filled) = tearing; blue (filled) = probing; orange 727

(dashed) = grabbing/gleaning; green (dashed) = pecking/grazing; light grey (filled) = filtering. 728
For the purposes of visualization every species is labelled with the categories reflecting the 729
main component of diet (sourced from Wilman et al. 2014). These categories were honed from 730
the original (Willman et al. 2014) for taxa where a single food component made up ≥ 50% of 731
the diet composition and no other single food component made up the remaining 50%. For 732
instance, the Eurasian sparrowhawk (Accipiter nisus) is estimated by Wilman et al. (2014) to 733
feed on endothermic vertebrates 100% of the time and is scored therein as ‘VertFishScav’; 734
here, it was re-scored as ‘VertEnd’ (SM. Table 1). 735
736
Figure 5. Relationship between beak shape and function. PGLS regression of Procrustes 737
coordinates on anterior mechanical advantage values (anterior MA). Decoupling between beak 738
shapes and mechanical advantage from the general trend is more noticeable in deep and curved 739
beaks. Grey shaded area represents the lower 20% of anterior MA values, where 80% of the 740
species fall (80 percentile indicated by grey line). Bird species labelled by UBF category. 741
742
Figure 6. Dietary preferences and their relationships with beak shape, anterior MA, and 743
body size. PGLS regression plots of the main axis of dietary variation in our sample (PCo1) 744
and regression scores for (from top to bottom): Procrustes coordinates (beak shape), Anterior 745
MA, and log-BM. Main component of diet categories are the same as Figure 3. See SM.Fig. 6 746
for the same relationships labelled by UBF group. 747
748
749
750
751
752
Figures 753
Figure 1. 754
755
756
757
758
759
760
761
762
763
764
765
766
767
768
769
770
771
772
773
774
775
776
777

Figure 2. 778
779
780
781
782
783
784
785
786
787
788
789
790
791
792
793
794
795
796
797
798
799
800
801
802
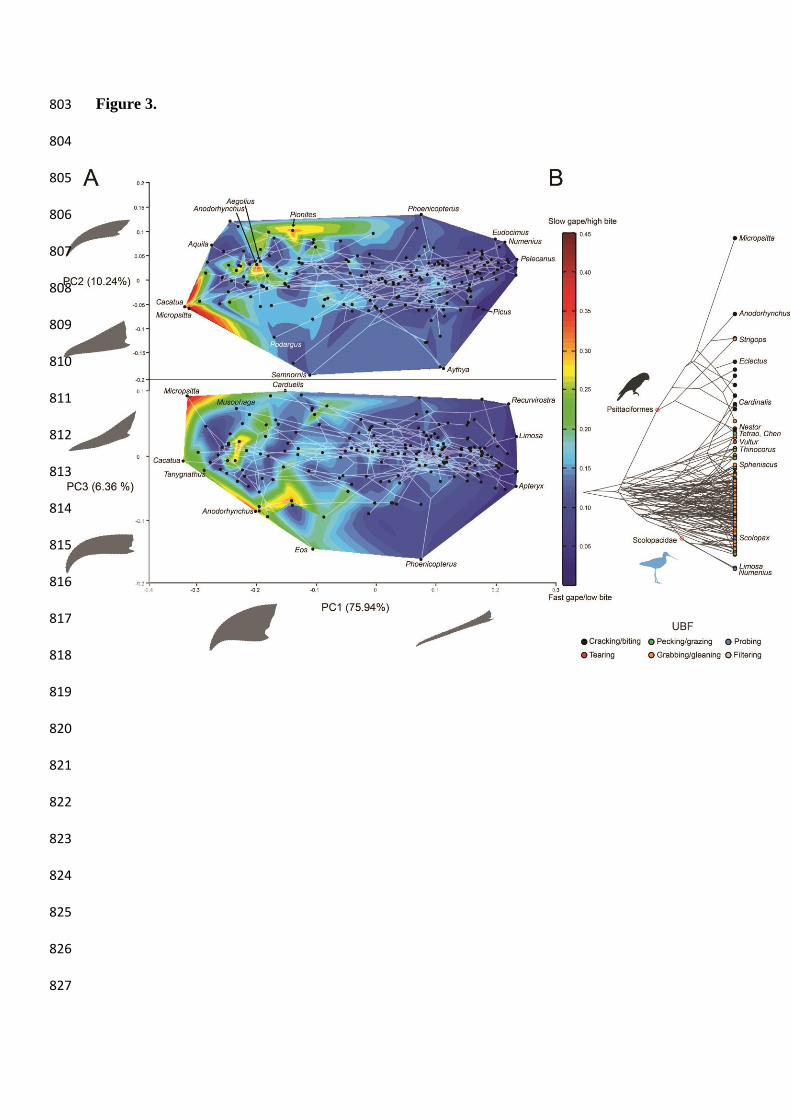
Figure 3. 803
804
805
806
807
808
809
810
811
812
813
814
815
816
817
818
819
820
821
822
823
824
825
826
827
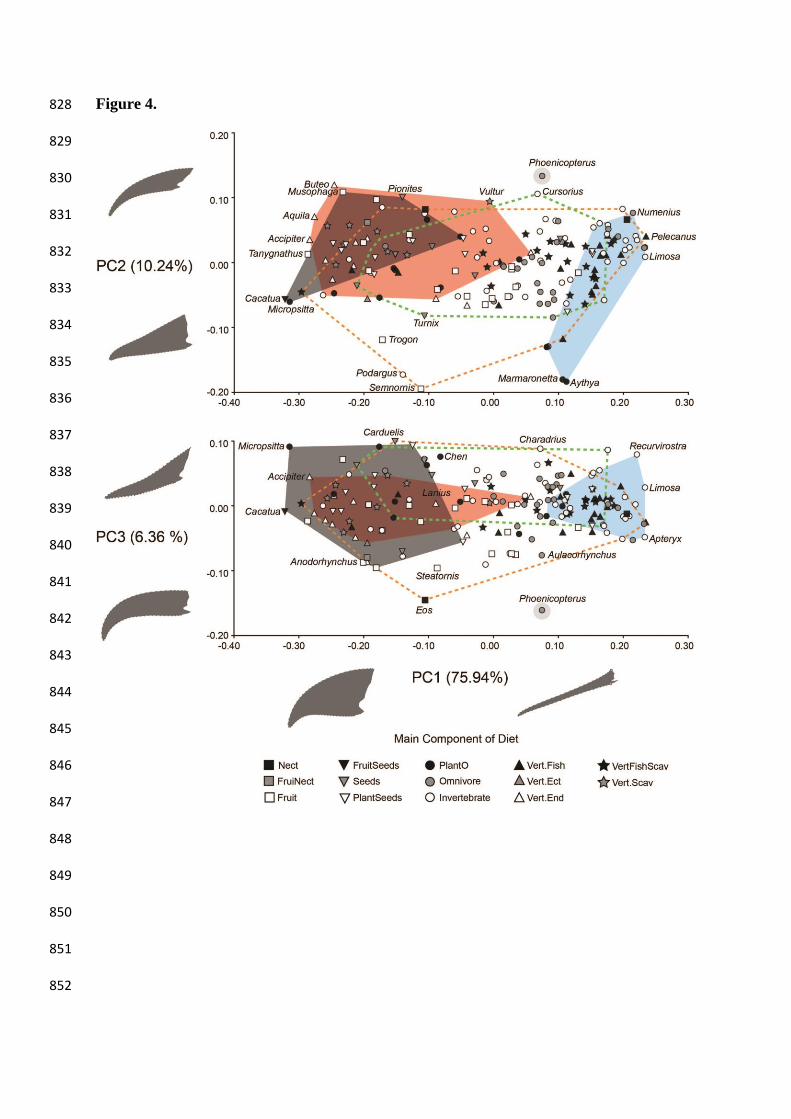
Figure 4. 828
829
830
831
832
833
834
835
836
837
838
839
840
841
842
843
844
845
846
847
848
849
850
851
852

Figure 5. 853
854
855
856
857
858
859
860
861
862
863
864
865
866
867
868
869
870
871
872
873
874
875
876
877

Figure 6. 878
879
880
881
882
883
884
885
886
887
888
889
890
891
892
893
894
895
896
897
898
899
900
901