1 the impact of alcohol misuse: a northern territory perspective ama national alcohol summit...
TRANSCRIPT
1
The Impact of Alcohol Misuse: a Northern Territory Perspective
AMA National Alcohol Summit Canberra, 28-29 October 2014
Howard BathNorthern Territory Children’s Commissioner
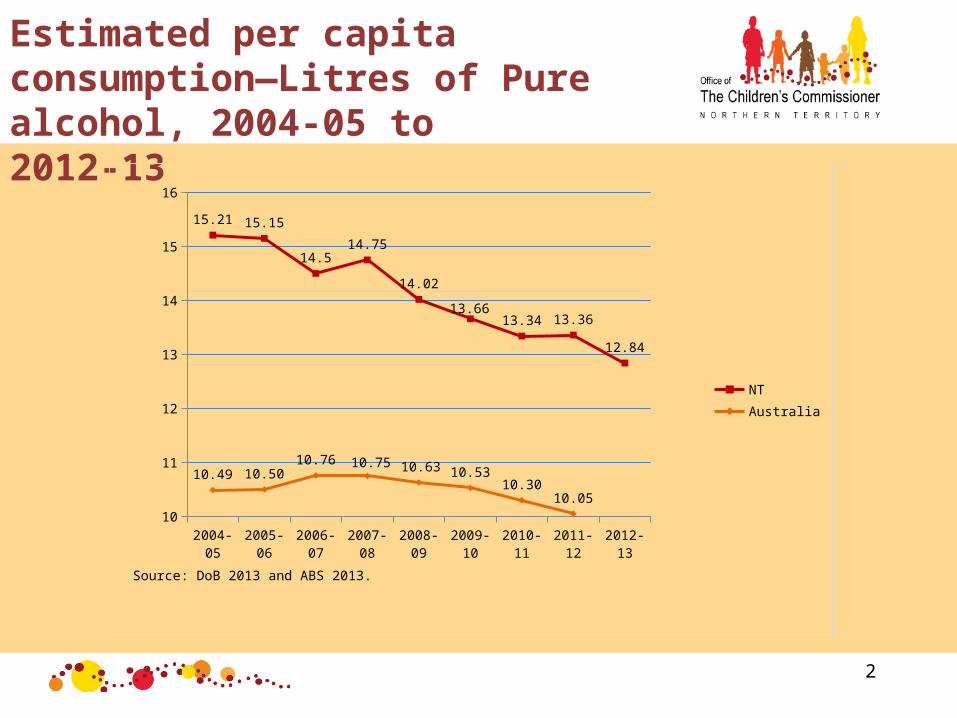
Estimated per capita consumption—Litres of Pure alcohol, 2004-05 to 2012-13
2
2004-05 2005-06 2006-07 2007-08 2008-09 2009-10 2010-11 2011-12 2012-1310
11
12
13
14
15
16
15.21 15.15
14.514.75
14.02
13.6613.34 13.36
12.84
10.49 10.5010.76 10.75 10.63 10.53
10.3010.05
NT Australia
Source: DoB 2013 and ABS 2013.
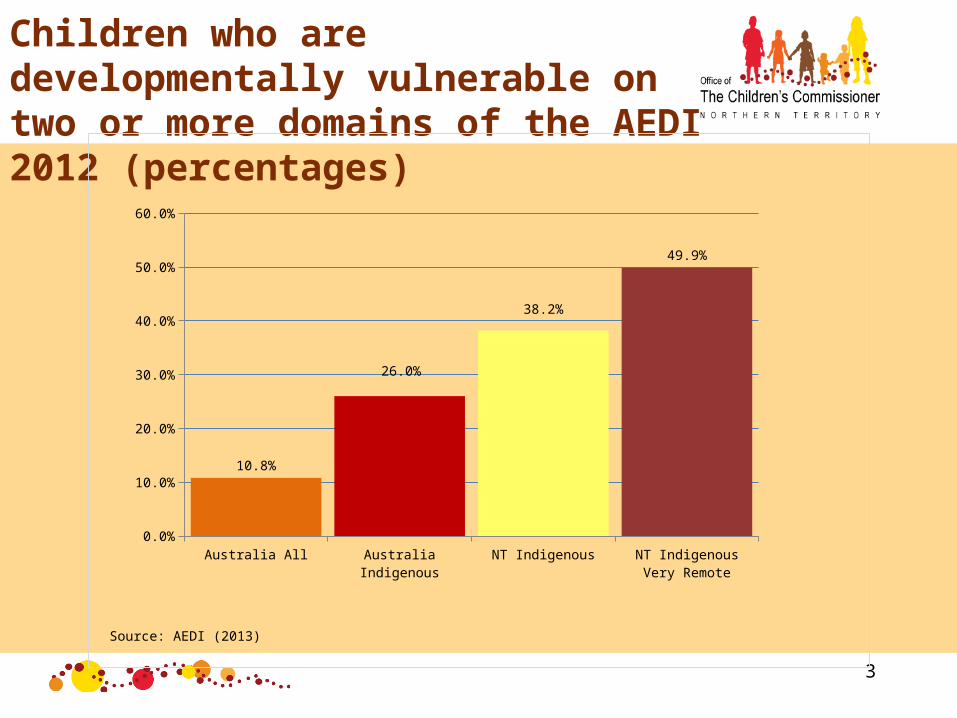
Children who are developmentally vulnerable on two or more domains of the AEDI 2012 (percentages)
3
Australia All Australia Indigenous NT Indigenous NT Indigenous Very Remote
0.0%
10.0%
20.0%
30.0%
40.0%
50.0%
60.0%
10.8%
26.0%
38.2%
49.9%
Source: AEDI (2013)
4
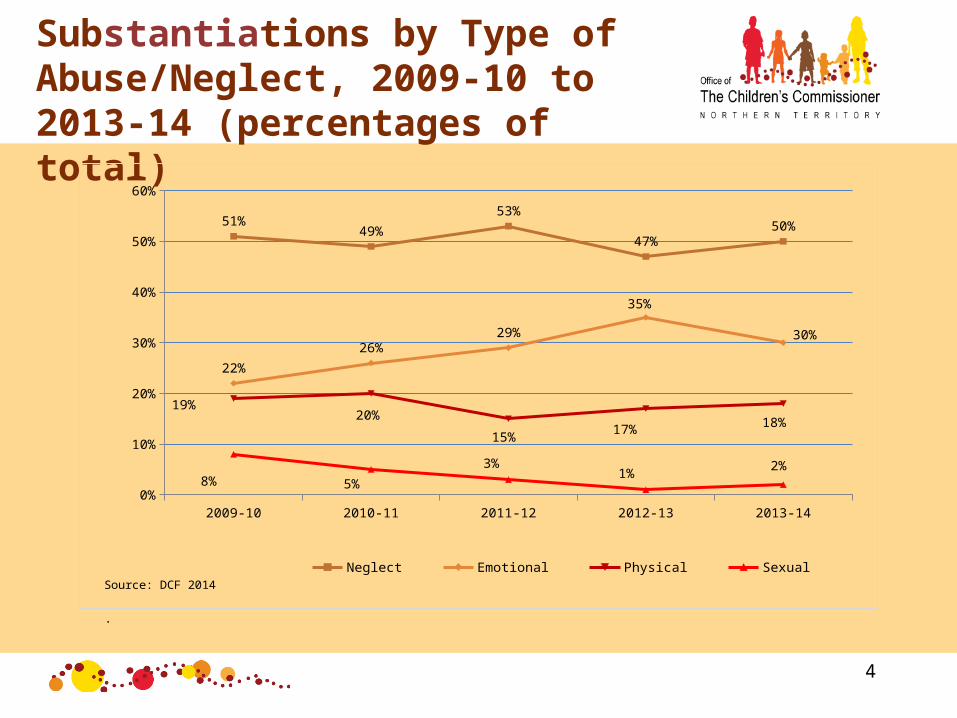
Substantiations by Type of Abuse/Neglect, 2009-10 to 2013-14 (percentages of total)
2009-10 2010-11 2011-12 2012-13 2013-140%
10%
20%
30%
40%
50%
60%
51%49%
53%
47%50%
22%
26%29%
35%
30%
19%20%
15% 17% 18%
8% 5%
3%1% 2%
Neglect Emotional Physical SexualSource: DCF 2014
.
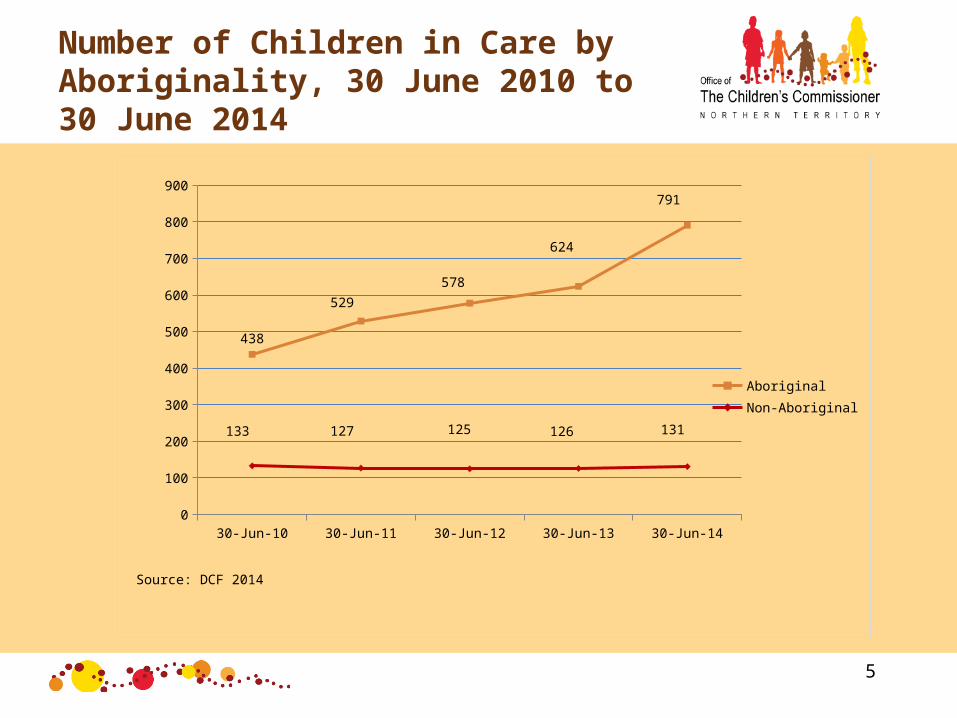
Number of Children in Care by Aboriginality, 30 June 2010 to 30 June 2014
5
30-Jun-10 30-Jun-11 30-Jun-12 30-Jun-13 30-Jun-140
100
200
300
400
500
600
700
800
900
438
529578
624
791
133 127 125 126 131
AboriginalNon-Aboriginal
Source: DCF 2014
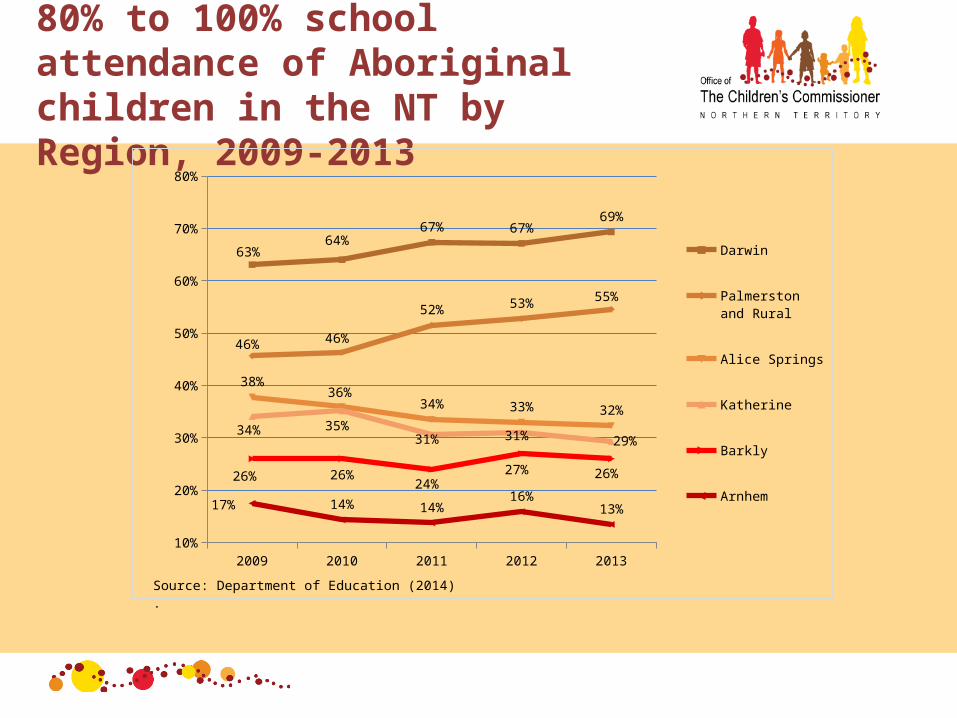
80% to 100% school attendance of Aboriginal children in the NT by Region, 2009-2013
2009 2010 2011 2012 201310%
20%
30%
40%
50%
60%
70%
80%
63%64%
67% 67%69%
46% 46%
52% 53%55%
38%36%
34% 33% 32%34% 35%
31% 31% 29%
26% 26%24%
27% 26%
17% 14% 14%16%
13%
Darwin
Palmerston and Rural
Alice Springs
Katherine
Barkly
Arnhem
Source: Department of Education (2014).
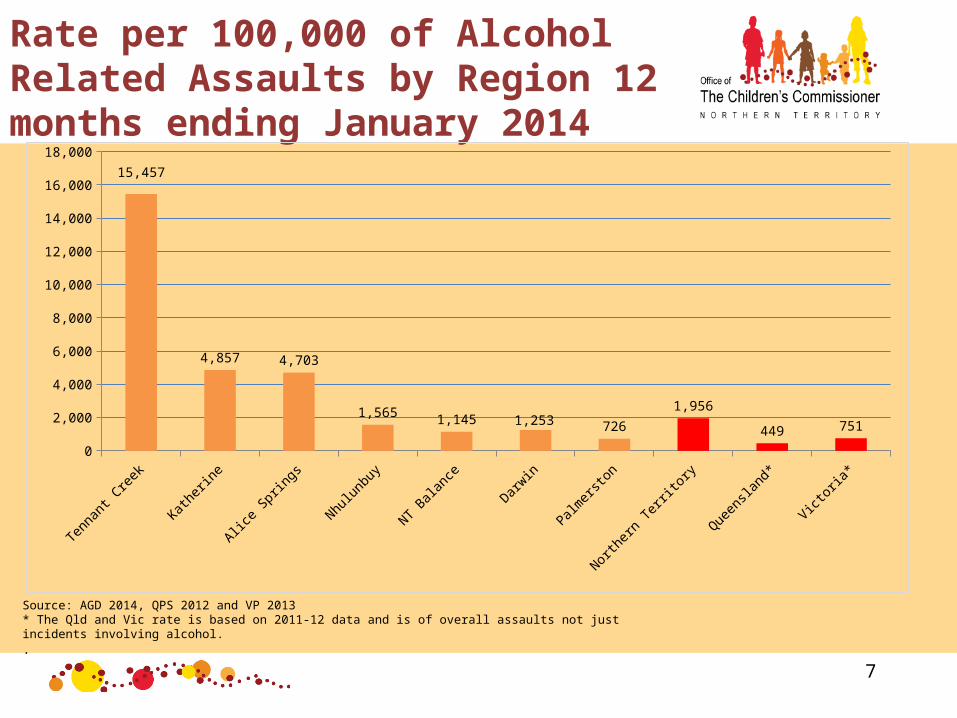
Rate per 100,000 of Alcohol Related Assaults by Region 12 months ending January 2014
7
Source: AGD 2014, QPS 2012 and VP 2013* The Qld and Vic rate is based on 2011-12 data and is of overall assaults not just incidents involving alcohol..
Tennant Creek Katherine Alice Springs Nhulunbuy NT Balance Darwin Palmerston Northern Territory
Queensland* Victoria*0
2,000
4,000
6,000
8,000
10,000
12,000
14,000
16,000
18,000
15,457
4,857 4,703
1,5651,145 1,253
726
1,956
449 751
Violence in the Northern Territory
• Aboriginal people in the NT are twice as likely to be hospitalised for assault as are Aboriginal people in the rest of Australia (AIHW).
• The latest Closing the Gap report revealed that the night patrols which were set up as a first response to violence or potential violence, dealt with over 84,700 incidents in the last 6 month reporting period, or 160,000 incidents p.a. – that is in a target area of around 30,000 adults.
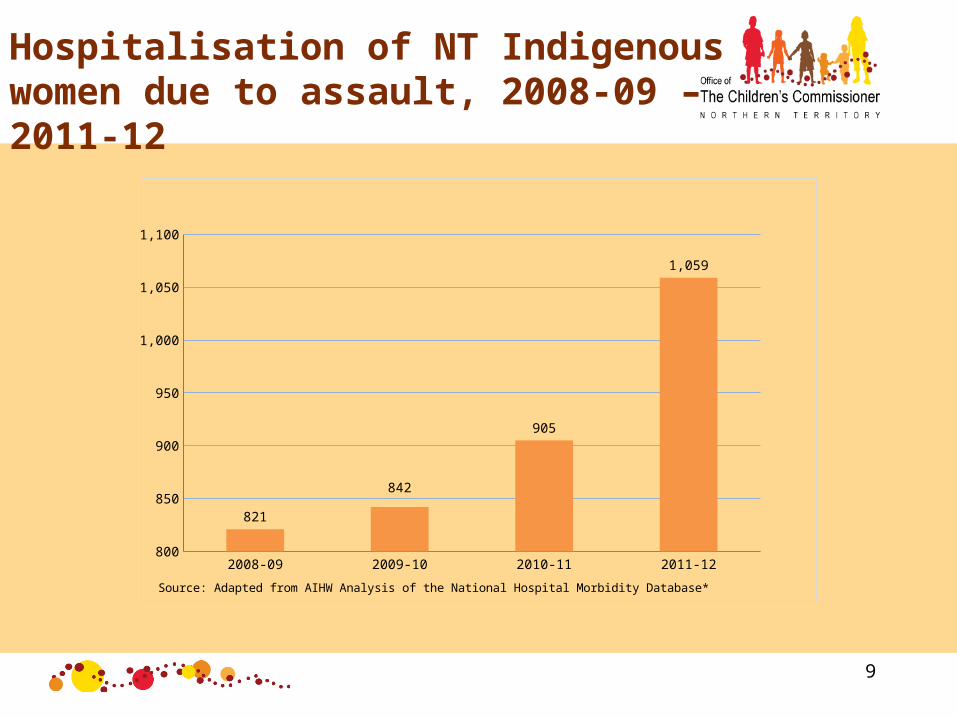
Hospitalisation of NT Indigenous women due to assault, 2008-09 – 2011-12
9
2008-09 2009-10 2010-11 2011-12800
850
900
950
1,000
1,050
1,100
821
842
905
1,059
Source: Adapted from AIHW Analysis of the National Hospital Morbidity Database*
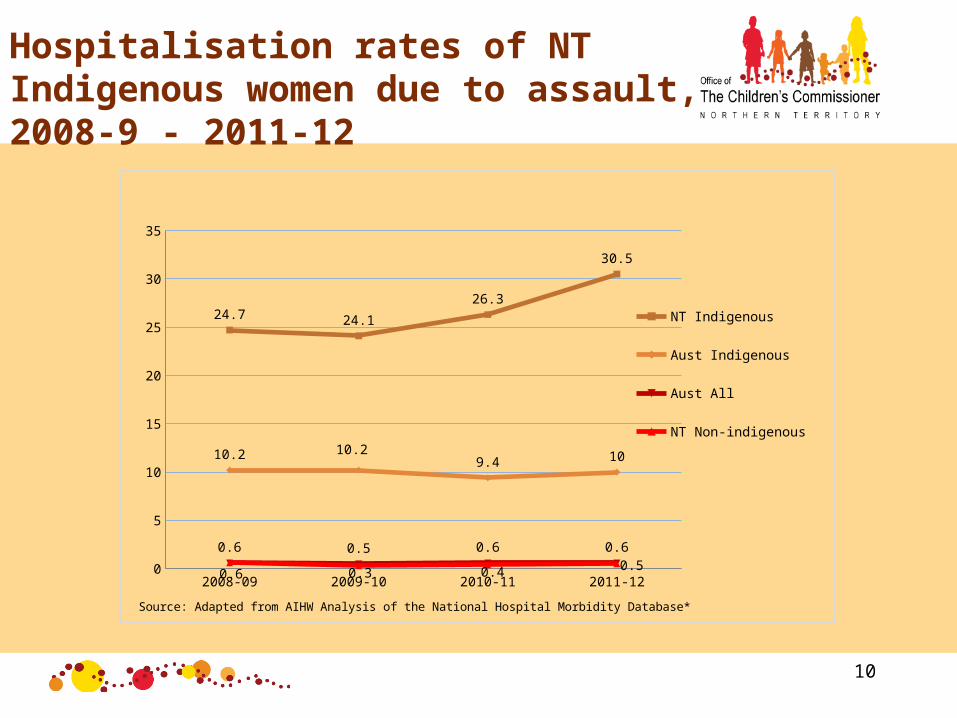
Hospitalisation rates of NT Indigenous women due to assault, 2008-9 - 2011-12
10
2008-09 2009-10 2010-11 2011-120
5
10
15
20
25
30
35
24.7 24.1
26.3
30.5
10.2 10.29.4 10
0.6 0.5 0.6 0.6
0.6 0.3 0.4 0.5
NT Indigenous
Aust Indigenous
Aust All
NT Non-indigenous
Source: Adapted from AIHW Analysis of the National Hospital Morbidity Database*
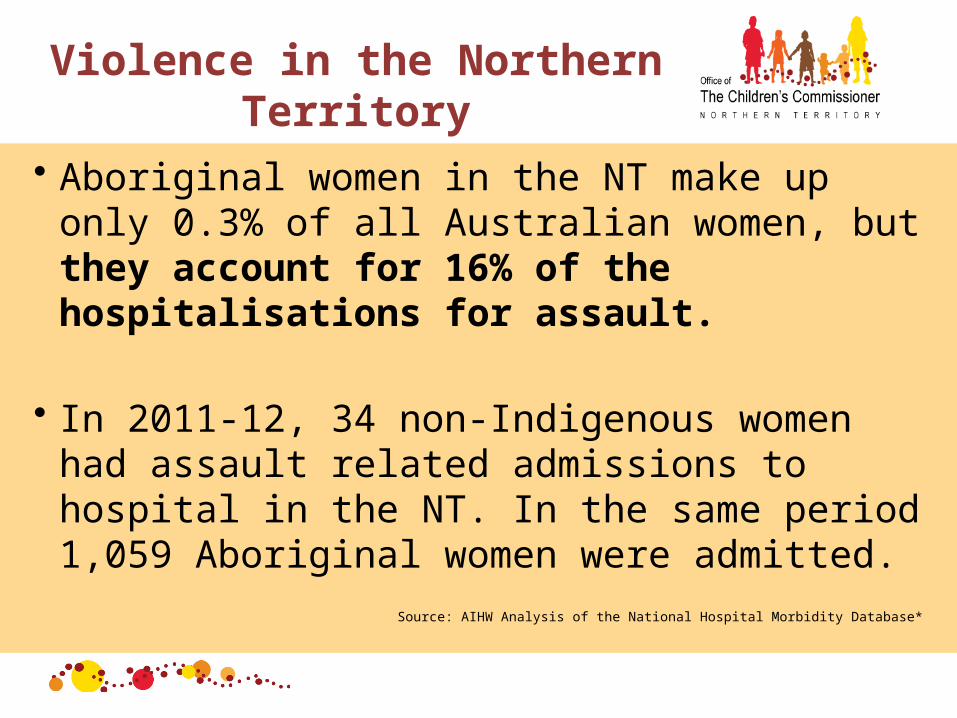
Violence in the Northern Territory
• Aboriginal women in the NT make up only 0.3% of all Australian women, but they account for 16% of the hospitalisations for assault.
• In 2011-12, 34 non-Indigenous women had
assault related admissions to hospital in the NT. In the same period 1,059 Aboriginal women were admitted.
Source: AIHW Analysis of the National Hospital Morbidity Database*
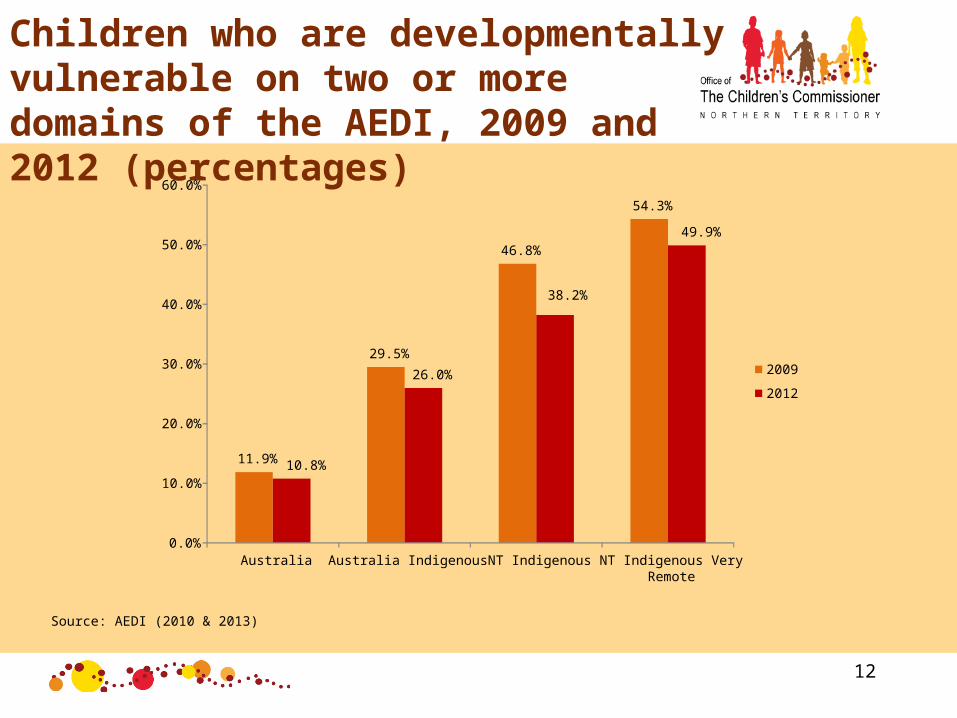
Children who are developmentally vulnerable on two or more domains of the AEDI, 2009 and 2012 (percentages)
12
Source: AEDI (2010 & 2013)
11.9%
29.5%
46.8%
54.3%
10.8%
26.0%
38.2%
49.9%
0.0%
10.0%
20.0%
30.0%
40.0%
50.0%
60.0%
Australia Australia Indigenous NT Indigenous NT Indigenous VeryRemote
2009
2012
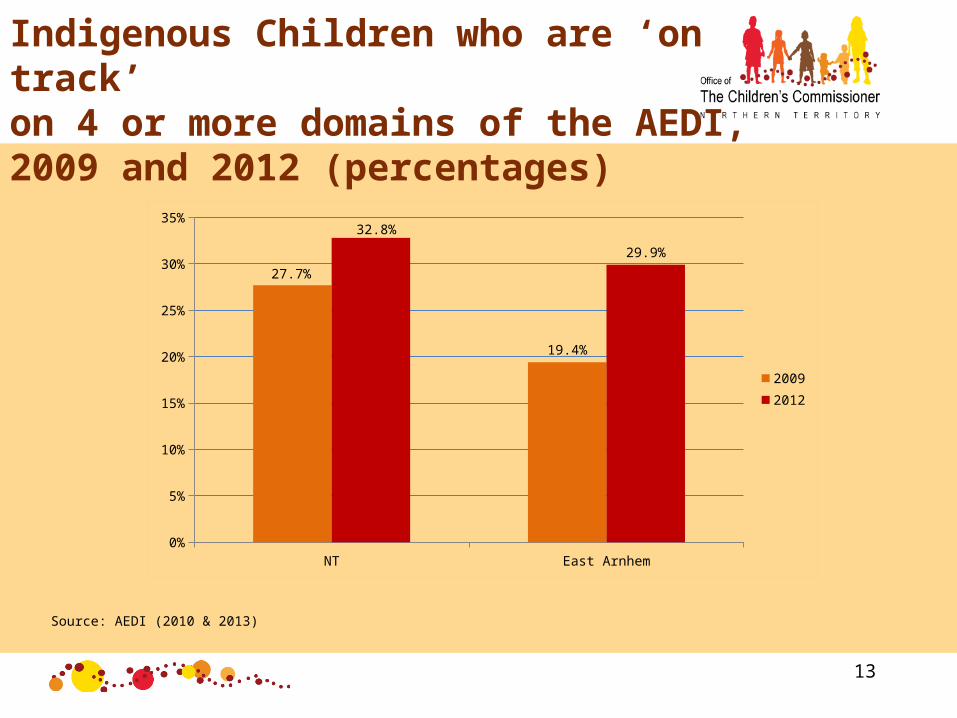
Indigenous Children who are ‘on track’ on 4 or more domains of the AEDI, 2009 and 2012 (percentages)
13
Source: AEDI (2010 & 2013)
NT East Arnhem0%
5%
10%
15%
20%
25%
30%
35%
27.7%
19.4%
32.8%
29.9%
20092012
14
In my beginning is my endT.S. Eliot