1 water pollution. 2 water pollution water pollution- any physical, biological, or chemical change...
TRANSCRIPT

1
Water PollutionWater Pollution

2
WATER POLLUTIONWATER POLLUTION Water pollution-Water pollution- Any physical, biological, or Any physical, biological, or
chemical change in water quality that chemical change in water quality that adversely affects living organisms adversely affects living organisms • Point SourcesPoint Sources
Factories, Power plants oil tankersFactories, Power plants oil tankers
• Non-Point SourcesNon-Point Sources (runoff) (runoff) Agricultural fields, FeedlotsAgricultural fields, Feedlots
3
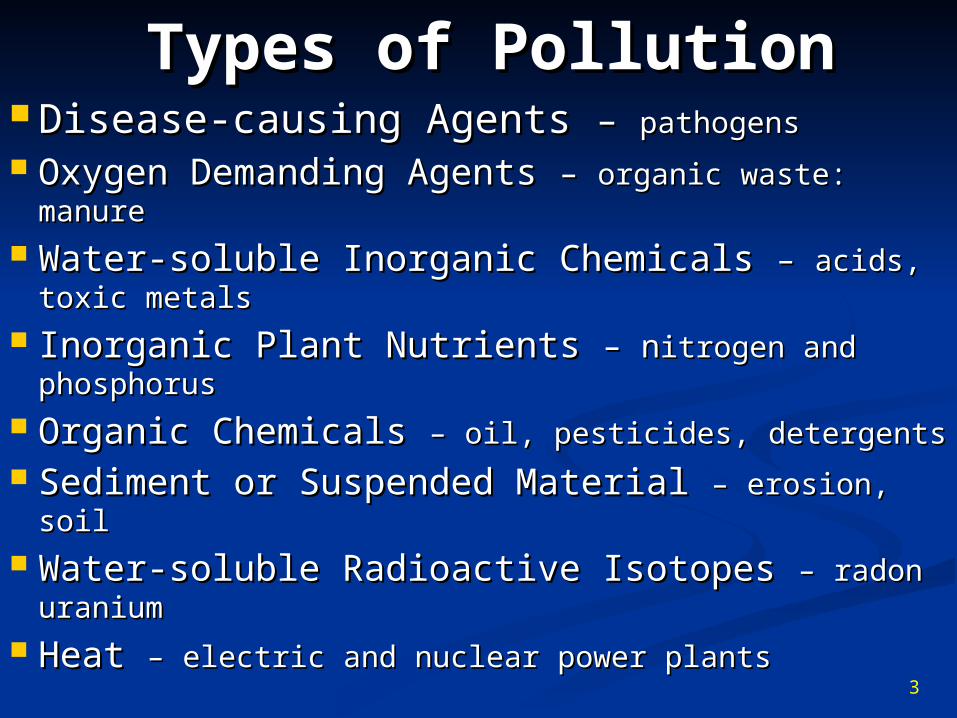
Types of PollutionTypes of Pollution Disease-causing Agents Disease-causing Agents – – pathogenspathogens Oxygen Demanding Agents Oxygen Demanding Agents – – organic waste: organic waste:
manuremanure Water-soluble Inorganic Chemicals Water-soluble Inorganic Chemicals – – acids, acids,
toxic metals toxic metals Inorganic Plant Nutrients Inorganic Plant Nutrients – n– nitrogen and itrogen and
phosphorusphosphorus Organic Chemicals Organic Chemicals – oil, pesticides, detergents– oil, pesticides, detergents Sediment or Suspended Material Sediment or Suspended Material – erosion, soil– erosion, soil Water-soluble Radioactive Isotopes Water-soluble Radioactive Isotopes – radon – radon
uraniumuranium Heat Heat – electric and nuclear power plants– electric and nuclear power plants

4
TYPES AND EFFECTS OF TYPES AND EFFECTS OF WATER POLLUTIONWATER POLLUTION
Infectious Agents-Infectious Agents- waterborne diseases waterborne diseases Main source-untreated or improperly treated Main source-untreated or improperly treated
human and animal wasteshuman and animal wastes Effects-diseasesEffects-diseases
typhoid fever, cholera, dysenterytyphoid fever, cholera, dysentery
E. Coli Hepatitis A
5
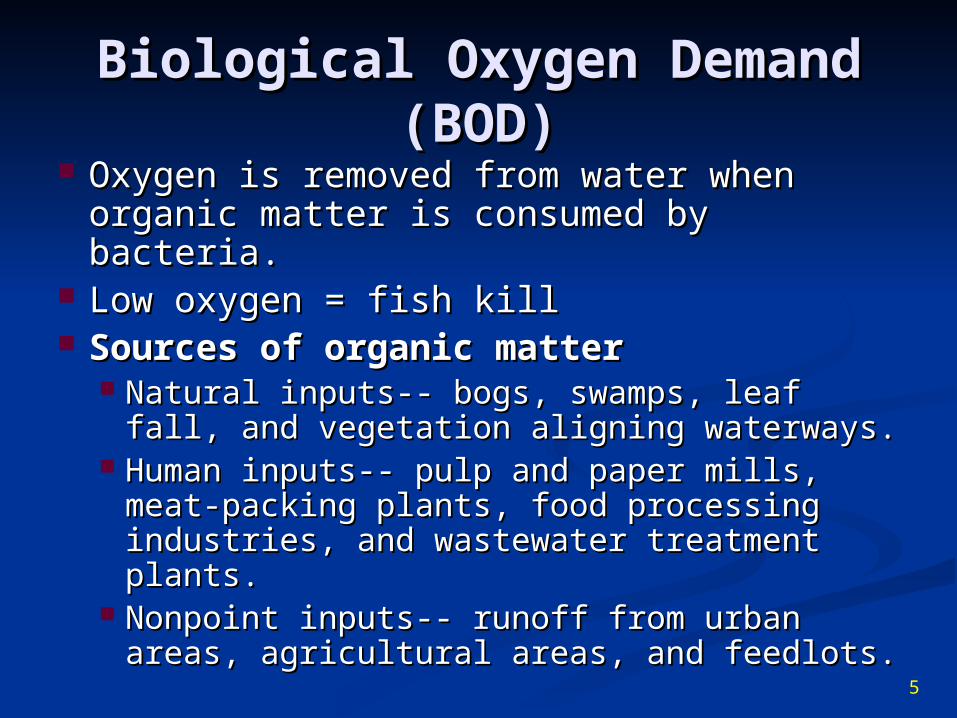
Biological Oxygen Demand (BOD)Biological Oxygen Demand (BOD) Oxygen is removed from water when organic Oxygen is removed from water when organic
matter is consumed by bacteria. matter is consumed by bacteria. Low oxygen = fish killLow oxygen = fish kill Sources of organic matterSources of organic matter
Natural inputs-- bogs, swamps, leaf fall, and Natural inputs-- bogs, swamps, leaf fall, and vegetation aligning waterways. vegetation aligning waterways.
Human inputs-- pulp and paper mills, meat-Human inputs-- pulp and paper mills, meat-packing plants, food processing industries, and packing plants, food processing industries, and wastewater treatment plants. wastewater treatment plants.
Nonpoint inputs-- runoff from urban areas, Nonpoint inputs-- runoff from urban areas, agricultural areas, and feedlots. agricultural areas, and feedlots.

6
Fish DieFish Die

7
BOD Effects on Water QualityBOD Effects on Water Quality
All streams have some capability to degrade organic waste. Problems occur when stream is overloaded with biochemical oxygen-demanding waste.
8
Water Soluble: Inorganic PollutantsWater Soluble: Inorganic Pollutants
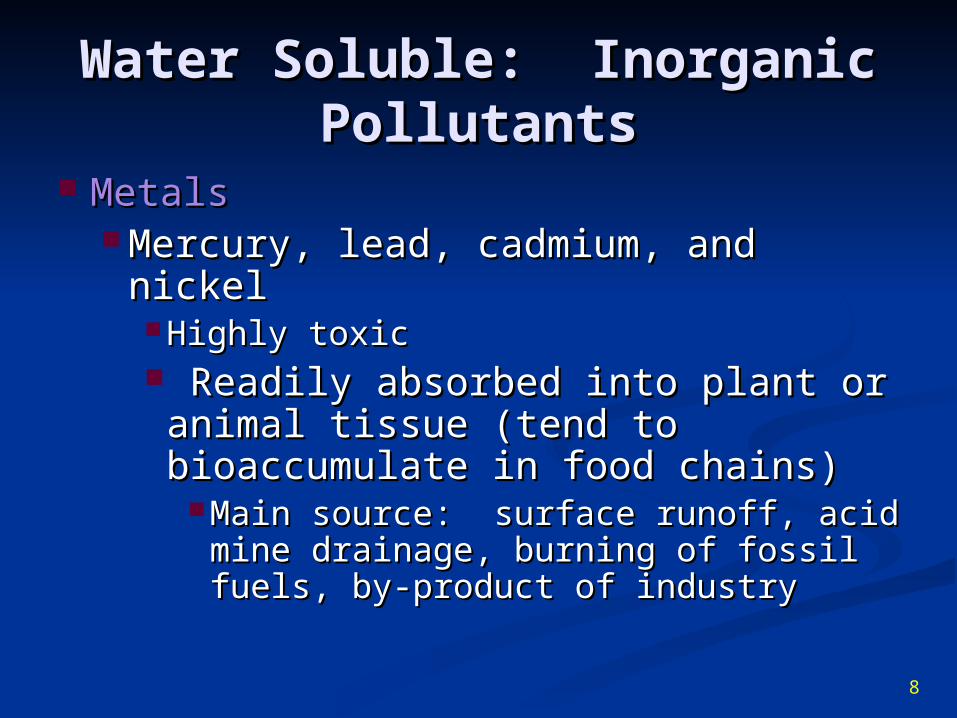
Metals Metals Mercury, lead, cadmium, and nickelMercury, lead, cadmium, and nickel
Highly toxicHighly toxic Readily absorbed into plant or animal Readily absorbed into plant or animal
tissue (tend to bioaccumulate in food tissue (tend to bioaccumulate in food chains)chains)
Main source: surface runoff, acid mine Main source: surface runoff, acid mine drainage, burning of fossil fuels, by-product drainage, burning of fossil fuels, by-product of industryof industry

9
Water Soluble: Inorganic PollutantsWater Soluble: Inorganic Pollutants
Nonmetallic SaltsNonmetallic Salts Reaching toxic levels through irrigation and Reaching toxic levels through irrigation and
concentrated by evaporationconcentrated by evaporation Leaching of road saltsLeaching of road salts
Acids and BasesAcids and Bases Often released as by-products of industrial Often released as by-products of industrial
processes.processes.
10
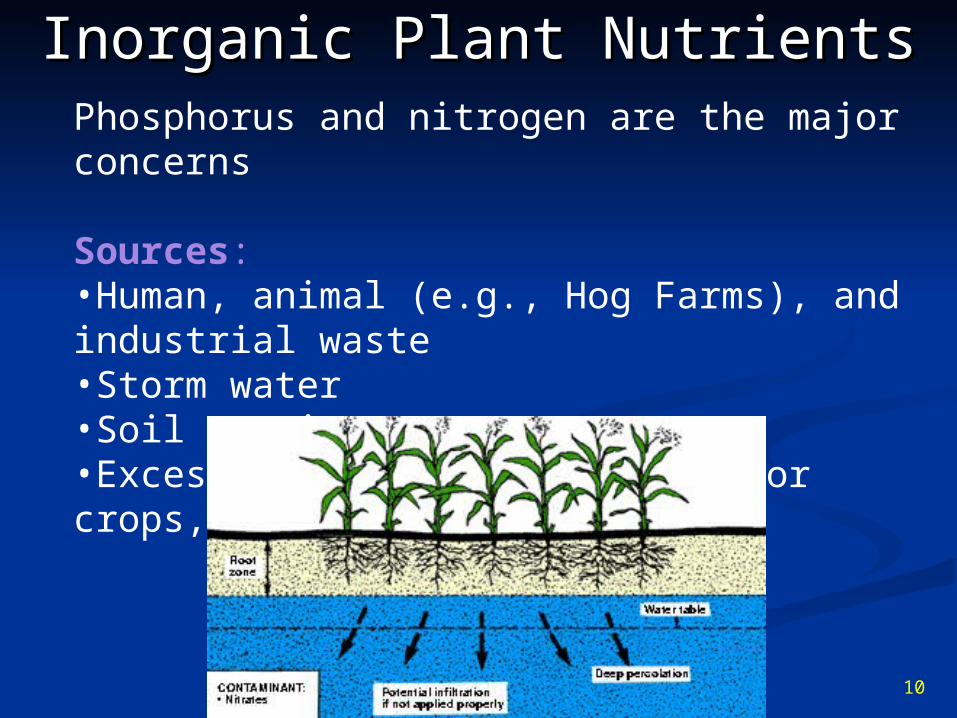
Inorganic Plant NutrientsInorganic Plant NutrientsPhosphorus and nitrogen are the major concerns
Sources:•Human, animal (e.g., Hog Farms), and industrial waste •Storm water•Soil erosion •Excessive use of fertilizers for crops, lawns, and home gardens

11
Inorganic Plant NutrientsInorganic Plant Nutrients
Eutrophication-rapid increase in plant life.
•Ex. Algae bloom•Blocks sunlight so plants below die. •Decomposition of dead plants consumes oxygen. •Low oxygen conditions may kill fish etc. •Aesthetics (color, clarity, smell)
High nutrient concentrations can cause Eutrophication (“well-fed” in Greek) of water bodies
12
Organic ChemicalsOrganic Chemicals
Main source: household cleansers, surface Main source: household cleansers, surface runoff from farms and yards, industryrunoff from farms and yards, industry Improper disposal of industrial and household Improper disposal of industrial and household
wastes.wastes. Runoff of pesticides from high-use areas.Runoff of pesticides from high-use areas.
Fields, roadsides, golf coursesFields, roadsides, golf courses Runoff from oil from roadsRunoff from oil from roads

13
Pesticide RunoffPesticide Runoff

14
SedimentSediment
Examples-soil, siltExamples-soil, silt Major human sources-land erosionMajor human sources-land erosion Harmful effectsHarmful effects
Reduce photosynthesisReduce photosynthesis Disrupt aquatic food websDisrupt aquatic food webs
Destroy spawning grounds of benthic speciesDestroy spawning grounds of benthic species Clog harbors and lakesClog harbors and lakes

15
Radioactive MaterialsRadioactive Materials
Radioactive isotopes of iodine, radon, uraniumRadioactive isotopes of iodine, radon, uraniumMain source: nuclear and coal burning Main source: nuclear and coal burning
power plants, mining, nuclear weapon power plants, mining, nuclear weapon productionproduction
Effects: genetic mutations, birth defects, Effects: genetic mutations, birth defects, cancercancer

16
Objectives and Warmup: Objectives and Warmup: Objectives:Objectives:
Explain the human causes of groundwater Explain the human causes of groundwater pollution and the negative side effects.pollution and the negative side effects.
Warmup:Warmup: Calculate how much savings a water heater Calculate how much savings a water heater
blanket might provide over a year given the blanket might provide over a year given the following data. In 1997, an average household following data. In 1997, an average household used 2,835 kWh per year in water heater used 2,835 kWh per year in water heater electricity; assume that you have the same usage. electricity; assume that you have the same usage. The water heater blanket used increases the The water heater blanket used increases the efficiency of the heater by 15%. You pay efficiency of the heater by 15%. You pay $0.08/kWh of electricity.$0.08/kWh of electricity.
2,835 kWh * .15 = 425.25 kWh saved. 425.25 kWh 2,835 kWh * .15 = 425.25 kWh saved. 425.25 kWh * $0.08/kWh = $34.02 saved. Interesting note: * $0.08/kWh = $34.02 saved. Interesting note: Water heater blankets cost about $15-20.Water heater blankets cost about $15-20.

17
Thermal PollutionThermal Pollution
Occurs when water is withdrawn and then Occurs when water is withdrawn and then heated water is returned to its original sourceheated water is returned to its original source Lowers dissolved oxygen levelsLowers dissolved oxygen levels An increase in temperature, even a few degrees, An increase in temperature, even a few degrees,
may significantly alter some aquatic ecosystemsmay significantly alter some aquatic ecosystems Human sources-water cooling of electric Human sources-water cooling of electric
power plantspower plants

18
Surface Water PollutionSurface Water Pollution
RiversRivers• Easy targets for dumping of sewage and
industrial wastes Lakes, reservoirs and ponds more
vulnerable to contamination than streams and rivers because of less mixing and aeration.

19
• Basin contains >95% of fresh surface water in U.S. and 20% of world
• Severe cultural eutrophication in 1960s (e.g., Lake Erie)
• $20 billion pollution–control program improved water quality since 1972
Case Study: Great Case Study: Great LakesLakes
Fig. 12–22© Brooks/Cole Publishing Company / ITP Water Resources and Water Pollution by Paul Rich

20
Groundwater PollutionGroundwater Pollution About half the U.S. population, and 95% of rural About half the U.S. population, and 95% of rural
residents, depend on underground aquifers for residents, depend on underground aquifers for drinking water.drinking water.
Sources include: leaky septic tanks, fertilizers, Sources include: leaky septic tanks, fertilizers, pesticides, landfills, hazardous waste dumps, pesticides, landfills, hazardous waste dumps, underground storage tanksunderground storage tanks
Groundwater is renewed slowly, such that pollution Groundwater is renewed slowly, such that pollution lingers for long periods of timelingers for long periods of time
Extremely difficult to cleanup contaminated Extremely difficult to cleanup contaminated groundwater; prevention of contamination more groundwater; prevention of contamination more effectiveeffective

21
Groundwater PollutionGroundwater Pollution

22
Prevention of Groundwater Prevention of Groundwater ContaminationContamination
Reduce sources of water pollution that feed into Reduce sources of water pollution that feed into the aquiferthe aquifer
Monitor aquifers near landfills & underground Monitor aquifers near landfills & underground storage tanksstorage tanks
Require leak detection devices for underground Require leak detection devices for underground tankstanks
Banning disposal of hazardous wastes in deep Banning disposal of hazardous wastes in deep wells and landfillswells and landfills
Storing hazardous wastes above groundStoring hazardous wastes above ground

23
Ocean PollutionOcean Pollution
Half of world's population lives within 100 km Half of world's population lives within 100 km (60 miles) of oceans and 14 of 15 largest cities (60 miles) of oceans and 14 of 15 largest cities are coastalare coastal
Approximately 80% of debris originates onshore and 20% from offshore sources.
About 35% of U.S. municipal sewage discharged virtually untreated in ocean waters
Estimated somewhere 3 and 6 million metric Estimated somewhere 3 and 6 million metric tons of oil are discharged into the world’s tons of oil are discharged into the world’s oceans.oceans. Transport creates opportunities for major spills.Transport creates opportunities for major spills.

24
Marine ImpactsMarine Impacts
Degrades the quality and health of our oceans and marine habitats
Poses risks to human health and safety
Harms marine life

25
Main Types of Ocean Main Types of Ocean PollutionPollution
Petroleum (oil) Sewage sludge DDT and PCBs
PCBs: used as liquid coolants, electrical equipment, insulation, etc.
Mercury (industry) Marine Debris Point source (municipal and
industrial facilities, oil tanker spills)
Non-point source (material washed down storm drain: fertilizers, pesticides, oil, trash)
bss.sfsu.edu/ehines/geog600/ Freshwater%20and%20ocean%20Pollution.ppt

26
Ocean Pollution: Ocean Pollution: PetroleumPetroleum
Oil spills can be caused by: Tanker accidents Intentional dumping Drilling/ pumping
operations

27
• Floating oil
• Heavy oil sinks
• Oil slicks on beaches
Effects of Oil SpillsEffects of Oil Spills
© Brooks/Cole Publishing Company / ITP Water Resources and Water Pollution by Paul Rich

28
Oil Pollution in the Oil Pollution in the OceanOcean

29
Marine DebrisMarine Debris
Transported by currents on the surface or in the water column…
Other debris sinks and remains on the sea floor.

30
How Marine Debris AffectsHow Marine Debris Affects Marine Life Marine Life
EntanglementEntanglement IngestionIngestion SmotheringSmothering

31
Pollution in Coastal Pollution in Coastal WatersWaters
Highly affected by pollution:Highly affected by pollution: Heavily usedHeavily used Close to sources of pollutionClose to sources of pollution Shallow-water bodies Shallow-water bodies Not as well circulated as the open Not as well circulated as the open
oceanocean
bss.sfsu.edu/ehines/geog600/ Freshwater%20and%20ocean%20Pollution.ppt

32
• Largest estuary in U.S.
• Severely degraded by water pollution from 6 states
• Deposition of air pollutants
Case Study: Chesapeake Case Study: Chesapeake BayBay
Fig. 12–24
© Brooks/Cole Publishing Company / ITP Water Water Resources and Water Pollution Resources and Water Pollution by Paul Rich

33
WATER POLLUTION WATER POLLUTION CONTROLCONTROL
Source ReductionSource Reduction avoid producing it or releasing it avoid producing it or releasing it
Studies show as much as 75-90% less road salt Studies show as much as 75-90% less road salt can be used without significantly affecting can be used without significantly affecting winter road safety.winter road safety.
Monitor aquifers near landfills and underground storage tanks;
Require leak detection systems and liability insurance for existing and new underground tanks that store hazardous liquids;
Ban or more strictly regulate disposal of hazardous wastes in deep injection wells and landfills;
Store hazardous liquids aboveground with more safeguards.

34
Water Pollution Control Water Pollution Control Cont.Cont.
Soil conservation methods Soil conservation methods Applying only needed amounts of Applying only needed amounts of
fertilizers, water, pesticidesfertilizers, water, pesticides Preserving wetlands (natural filters)Preserving wetlands (natural filters) Reduce materials carried away by storm Reduce materials carried away by storm
runoffrunoff

35
• Much of the world's drinking water is contaminated and poses serious health threats
• Most drinking water is purified by storage in reservoir (suspended matter settles), and treated by sand filters, activated charcoal, and addition of chlorine
• U.S. Safe Drinking Water Act of 1974 requires EPA to establish national drinking water standards
• Bottled water and home filters usage has increased
Drinking Water QualityDrinking Water Quality
© Brooks/Cole Publishing Company / ITP Water Resources and Water Pollution Water Resources and Water Pollution by Paul Rich

36
Water Quality StandardsWater Quality Standards
•The EPA sets Maximum Contaminant Levels (MCLs) for drinking water
•There are standards for numerous contaminants, two of which cause an immediate health threat if exceeded
•Coliform bacteria - because they may indicate presence of disease causing organisms
•Nitrate - can cause ‘blue baby syndrome”—nitrate reacts with blood and blood can’t carry as much oxygen

37
Municipal Water Municipal Water Purification PlantPurification Plant

38
Wastewater Treatment Wastewater Treatment ObjectivesObjectives
Purpose is to produce water suitable to Purpose is to produce water suitable to return to aquatic environment.return to aquatic environment. Removing physical, chemical, and Removing physical, chemical, and
biological biological In some cases, wastewater can be clean In some cases, wastewater can be clean
enough for reuse for particular enough for reuse for particular purposes.purposes.
Wastewater treatment systems use the Wastewater treatment systems use the same processes of purification that same processes of purification that would occur in a natural aquatic system would occur in a natural aquatic system faster and controlled faster and controlled
isis.csuhayward.edu/alss/Geography/ mlee/geog4350/4350c4f01.ppt

39
Sewage or Wastewater Sewage or Wastewater TreatmentTreatment
Sewage or wastewater is Sewage or wastewater is composed of sewage or composed of sewage or wastewater from:wastewater from: Domestic used water and toilet Domestic used water and toilet
wasteswastes RainwaterRainwater Industrial effluent Industrial effluent ((Toxic industrial Toxic industrial
water is pretreatedwater is pretreated))
Livestock wastesLivestock wastes

40
Wastewater TreatmentWastewater Treatment Types of treatment systems include: Septic
Tanks or Wastewater Treatment Plants (WWTPs).• Septic Tanks
•single household• WWTPs
•Municipal or industrial waste.

41
Septic TanksSeptic Tanks• Approx. 22 million systems in operation ( 30% of US)• Suitability determined by soil type, depth to water table, depth
to bedrock and topography• Commonly fail due to poor soil drainage• Potential contaminants: bacteria, heavy metals, nutrients,
synthetic organic chemicals

42
So What Happens After We So What Happens After We Flush?Flush?

43
Municipal Sewage Municipal Sewage TreatmentTreatment Primary TreatmentPrimary Treatment
Solids separated using grates, screens, and Solids separated using grates, screens, and settling tanks. settling tanks.
Secondary TreatmentSecondary Treatment - Aeration - Aeration Effluent (waste stream) from primary treatment Effluent (waste stream) from primary treatment
goes through aeration tankgoes through aeration tank Bacteria degrade organic materials Bacteria degrade organic materials Kills pathogens Kills pathogens
Sludge from primary and secondary Sludge from primary and secondary treatment is incinerated, composted or treatment is incinerated, composted or used in soilused in soil

44

45

46
Municipal Sewage Municipal Sewage TreatmentTreatment Tertiary TreatmentTertiary Treatment - - Removal of plant Removal of plant
nutrients (nitrates and phosphates) nutrients (nitrates and phosphates) from secondary effluent.from secondary effluent.
FiltrationFiltration Chlorination (or ozone)Chlorination (or ozone) Treated water is discharged to waterwaysTreated water is discharged to waterways Used for irrigationUsed for irrigation

47
Water Pollution LegislationWater Pollution Legislation
• Clean Water Act 1977Clean Water Act 1977• Regulates discharge of pollutants into Regulates discharge of pollutants into
waterwater• Safe Drinking Water Act, 1974, Safe Drinking Water Act, 1974,
amended 1996amended 1996• Ocean Dumping Ban Act 1988Ocean Dumping Ban Act 1988
• Prohibited dumping of sewage and Prohibited dumping of sewage and industrial wasteindustrial waste
bss.sfsu.edu/ehines/geog600/ Freshwater%20and%20ocean%20Pollution.ppt

48