1 what is in our water?. background slides for the whole unit the water cycle nutrients...
TRANSCRIPT
1
What is in Our Water?
Background slides for the whole unit
• The water cycle• Nutrients• Eutrophication
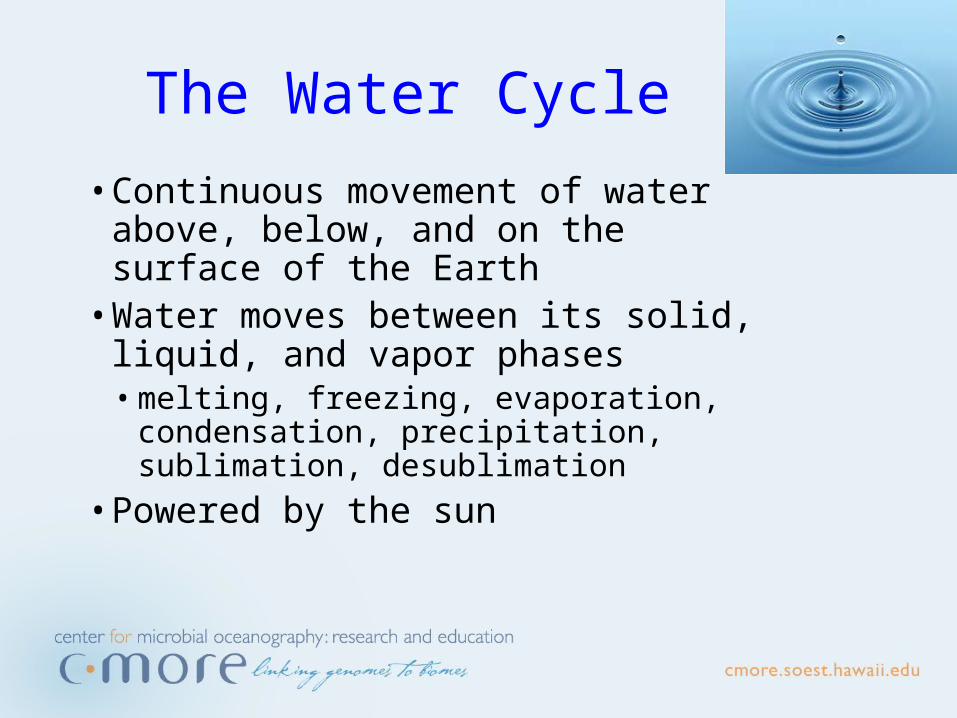
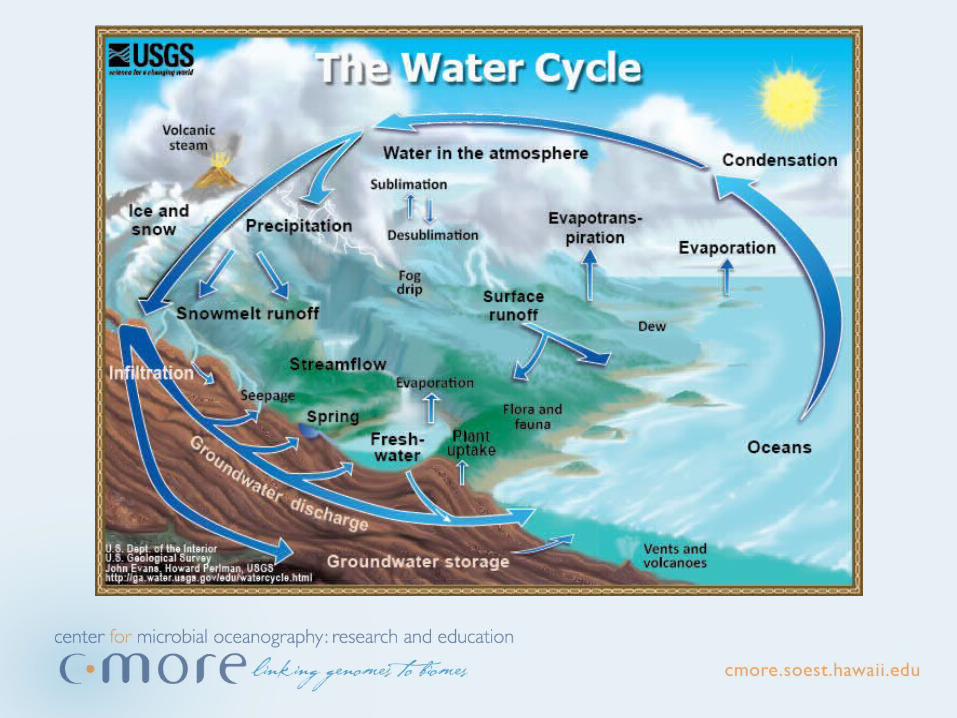
The Water Cycle
• Continuous movement of water above, below, and on the surface of the Earth
• Water moves between its solid, liquid, and vapor phases• melting, freezing, evaporation,
condensation, precipitation, sublimation, desublimation
• Powered by the sun
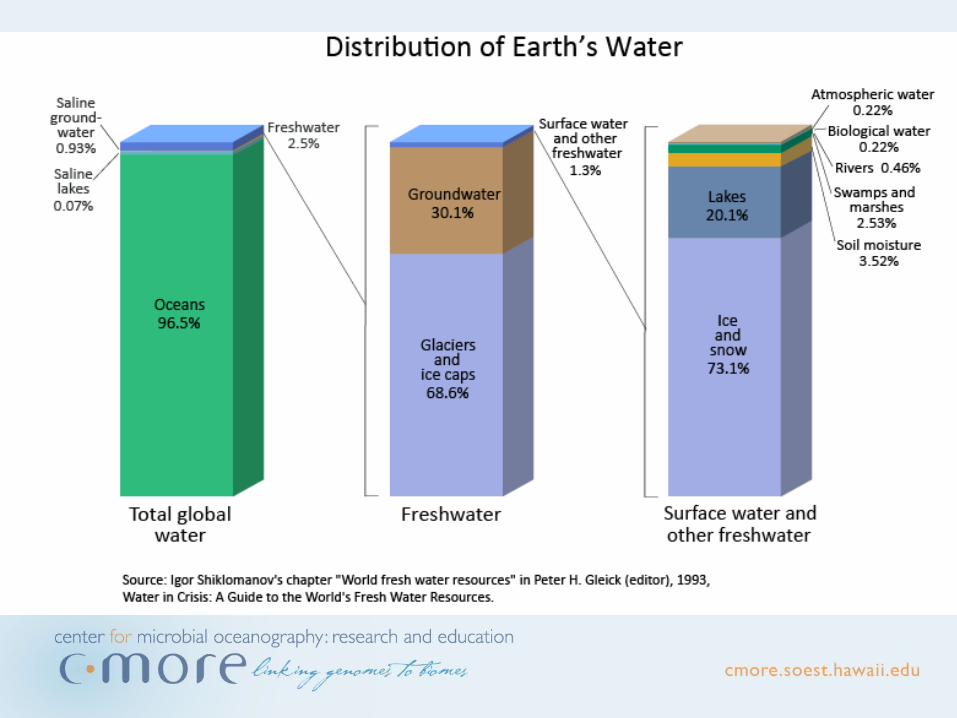
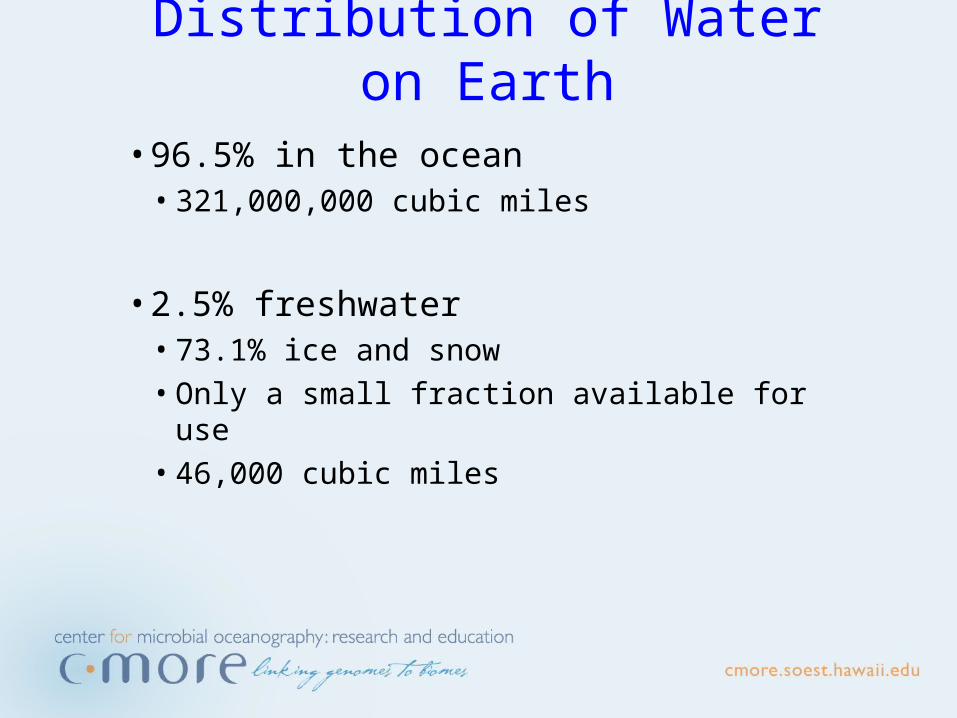
Distribution of Water on Earth• 96.5% in the ocean
• 321,000,000 cubic miles
• 2.5% freshwater• 73.1% ice and snow• Only a small fraction available for use • 46,000 cubic miles
Nutrients• Chemical components necessary to sustain life
– Humans: carbohydrates, proteins, fats, vitamins, minerals– Marine organisms: nitrate, ammonia, phosphate, silicate,
iron, manganese
• Often broken down into two categories:– Macronutrients: nutrients needed in relatively large
quantities– Micronutrients: compounds that are essential to life, but only
needed in very small amounts
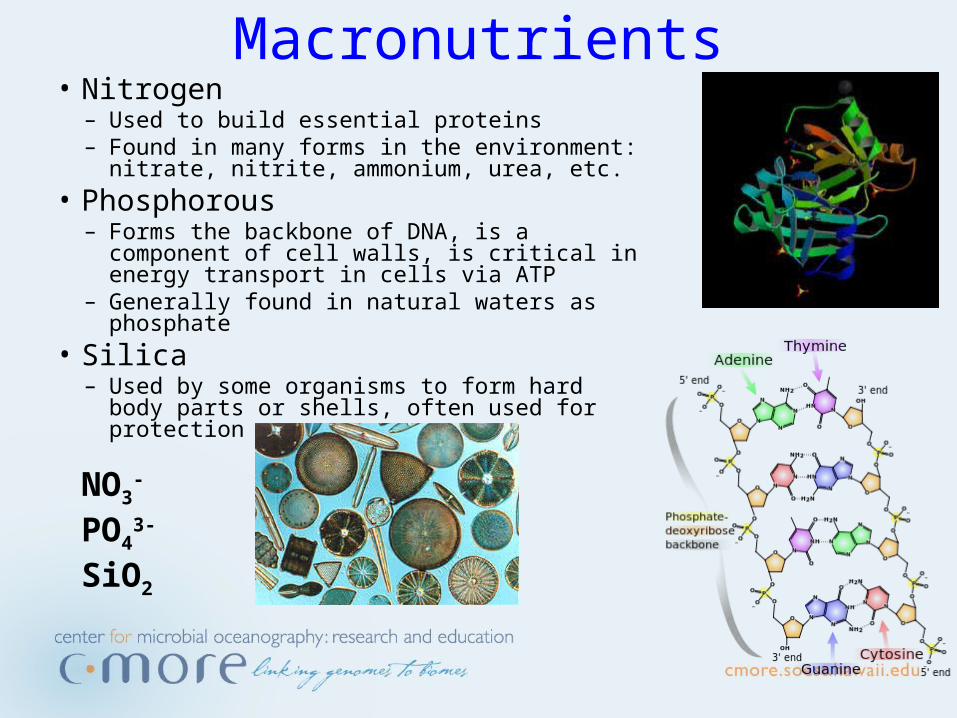
Macronutrients• Nitrogen
– Used to build essential proteins– Found in many forms in the environment: nitrate,
nitrite, ammonium, urea, etc.• Phosphorous
– Forms the backbone of DNA, is a component of cell walls, is critical in energy transport in cells via ATP
– Generally found in natural waters as phosphate• Silica
– Used by some organisms to form hard body parts or shells, often used for protection
NO3-
PO43-
SiO2
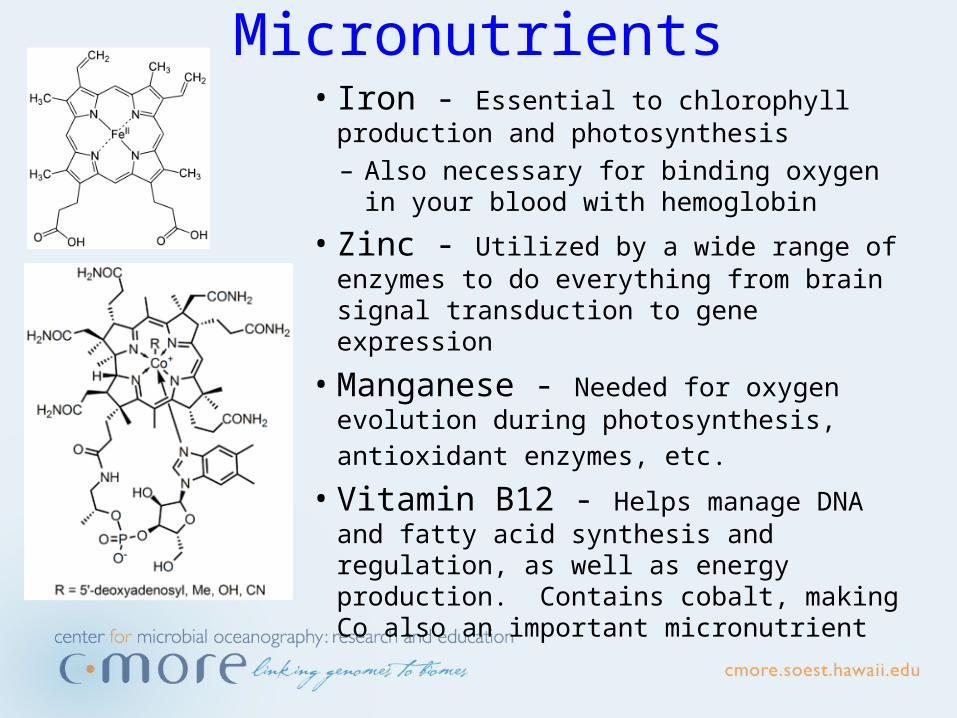
Micronutrients• Iron - Essential to chlorophyll production and
photosynthesis– Also necessary for binding oxygen in your
blood with hemoglobin
• Zinc - Utilized by a wide range of enzymes to do everything from brain signal transduction to gene expression
• Manganese - Needed for oxygen evolution during photosynthesis, antioxidant enzymes, etc.
• Vitamin B12 - Helps manage DNA and fatty acid synthesis and regulation, as well as energy production. Contains cobalt, making Co also an important micronutrient
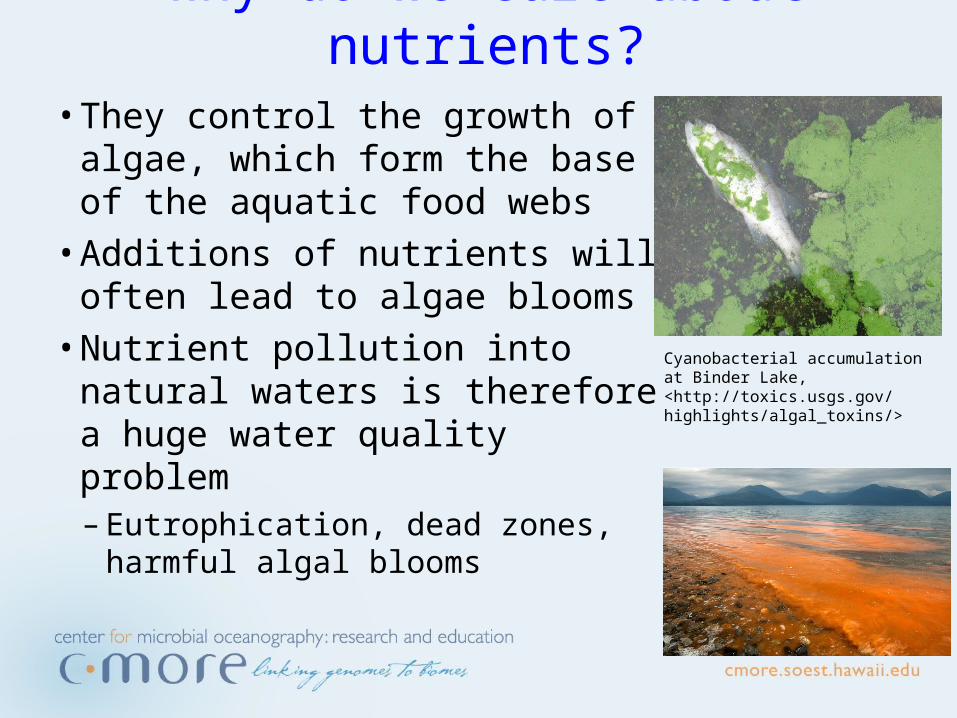
Why do we care about nutrients?• They control the growth of
algae, which form the base of the aquatic food webs
• Additions of nutrients will often lead to algae blooms
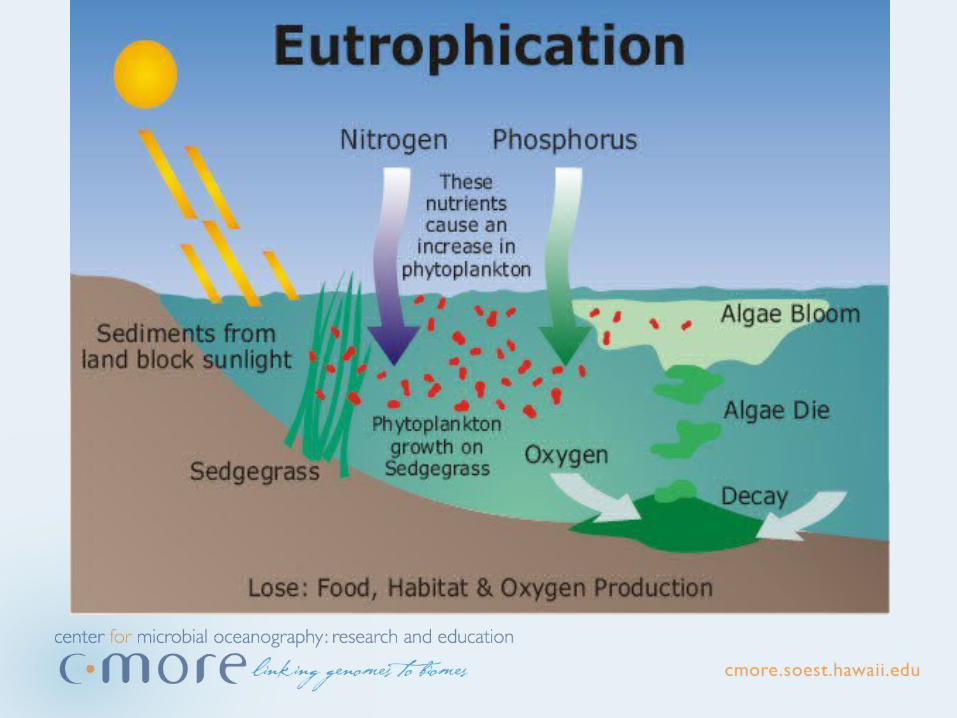
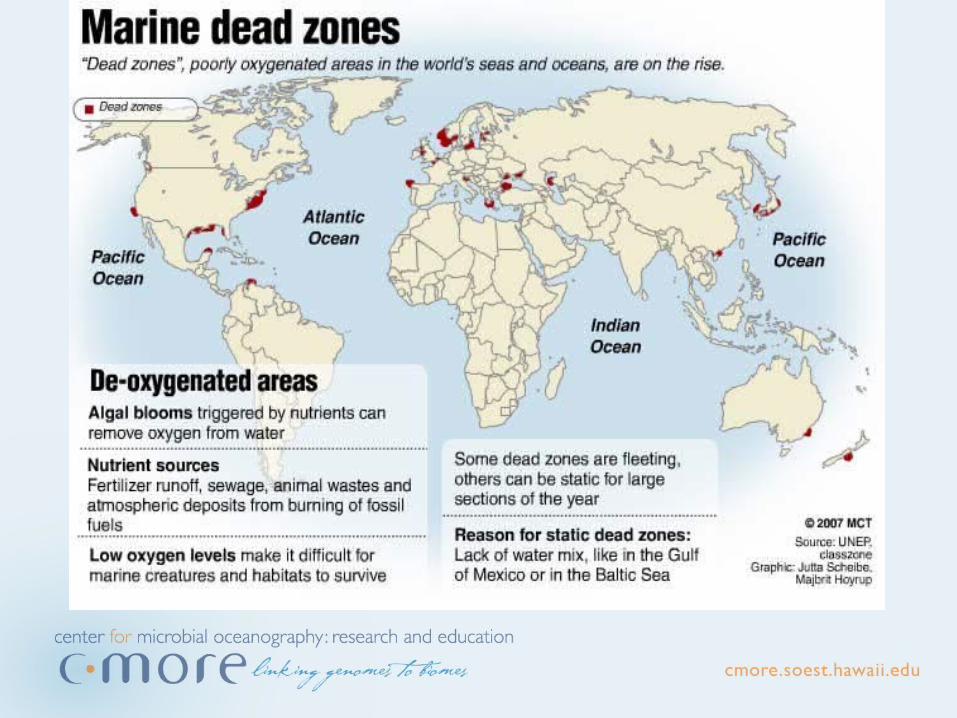
• Nutrient pollution into natural waters is therefore a huge water quality problem– Eutrophication, dead zones,
harmful algal blooms
Cyanobacterial accumulation at Binder Lake,<http://toxics.usgs.gov/highlights/algal_toxins/>
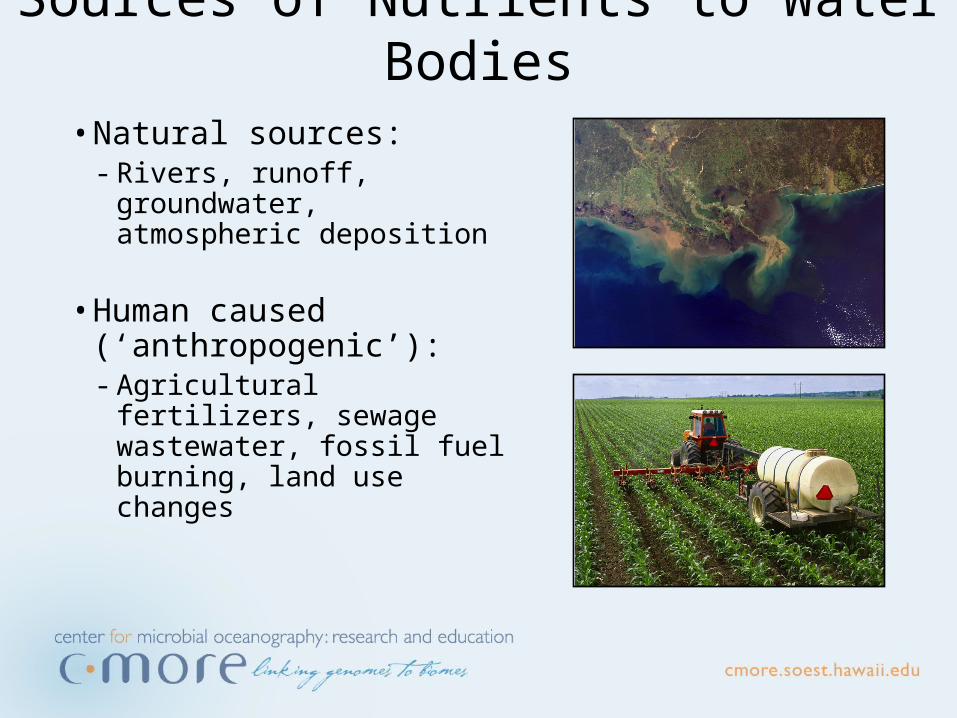
Sources of Nutrients to Water Bodies• Natural sources:
- Rivers, runoff, groundwater, atmospheric deposition
• Human caused (‘anthropogenic’):- Agricultural fertilizers,
sewage wastewater, fossil fuel burning, land use changes
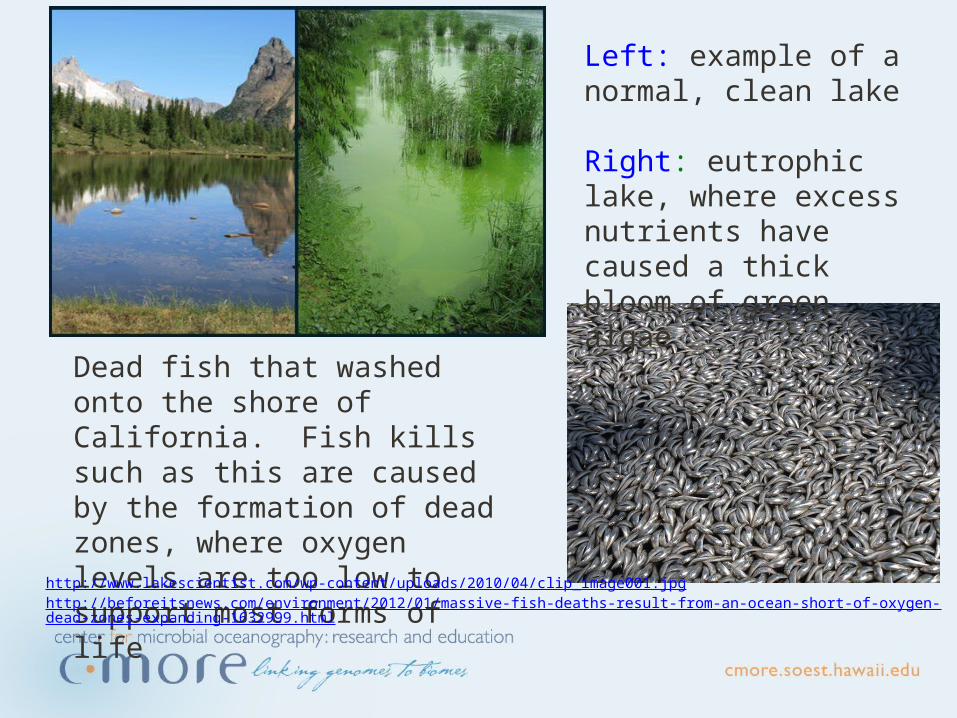
Left: example of a normal, clean lake
Right: eutrophic lake, where excess nutrients have caused a thick bloom of green algae
Dead fish that washed onto the shore of California. Fish kills such as this are caused by the formation of dead zones, where oxygen levels are too low to support most forms of lifehttp://www.lakescientist.com/wp-content/uploads/2010/04/clip_image001.jpg
http://beforeitsnews.com/environment/2012/01/massive-fish-deaths-result-from-an-ocean-short-of-oxygen-dead-zones-expanding-1632999.html
Slides to accompany Lesson 1
• Spectrophotometry
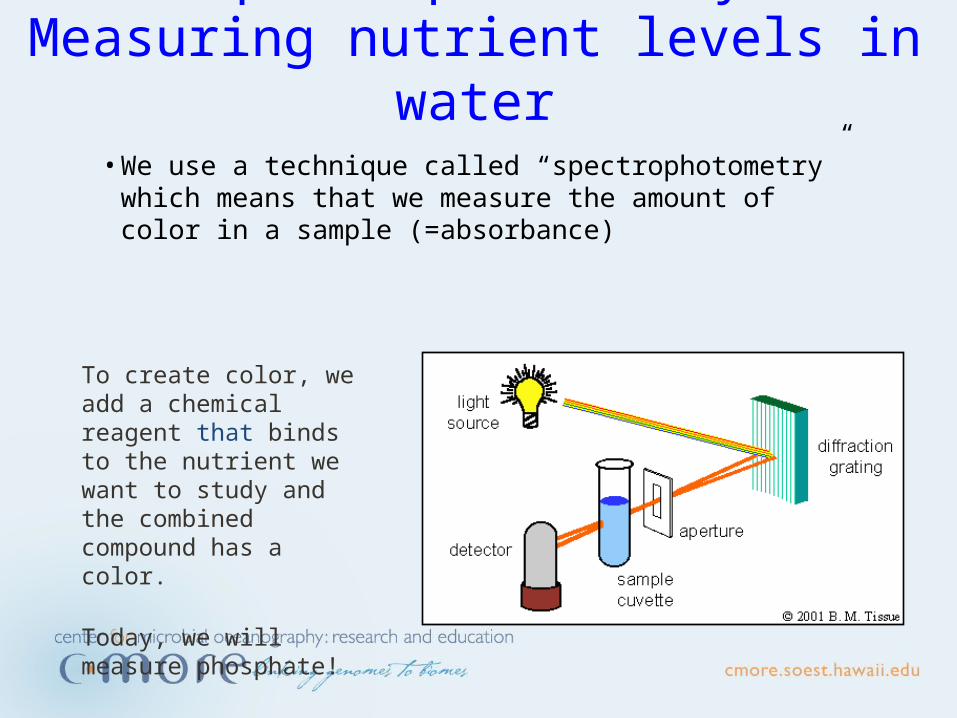
SpectrophotometryMeasuring nutrient levels in water• We use a technique called “spectrophotometry”
which means that we measure the amount of color in a sample (=absorbance)
To create color, we add a chemical reagent that binds to the nutrient we want to study and the combined compound has a color.
Today, we will measure phosphate!
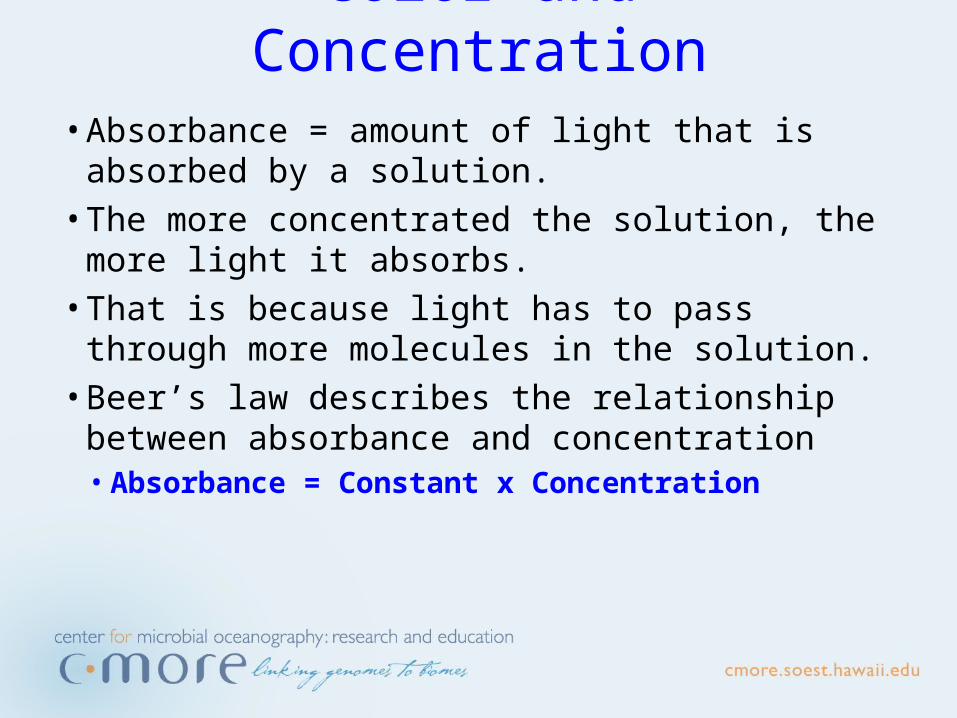
Color and Concentration• Absorbance = amount of light that is absorbed by a
solution.• The more concentrated the solution, the more light
it absorbs.• That is because light has to pass through more
molecules in the solution.• Beer’s law describes the relationship between
absorbance and concentration• Absorbance = Constant x Concentration
• Standard curves
Slides to accompany Lesson 2

Standards
• We need to know what absorbance corresponds to which concentration.
• So we make solutions of known concentrations (standards) and measure their absorbance.
• Then we plot each concentration with its matching absorbance and get a “standard curve”.
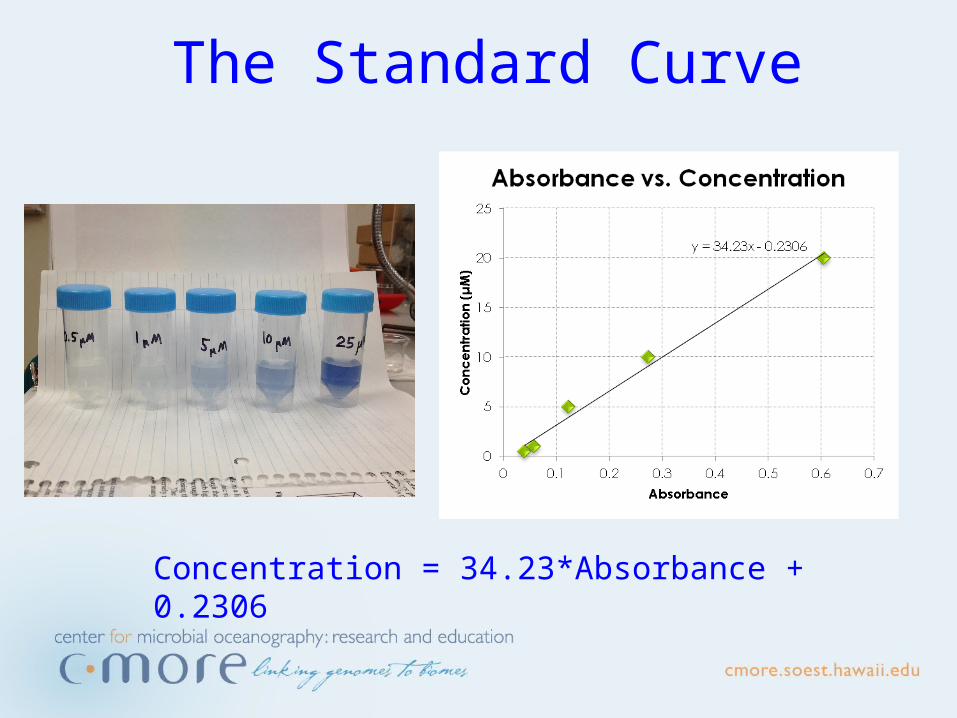
The Standard Curve
Concentration = 34.23*Absorbance + 0.2306
• Measuring phosphate in water samples
Slides to accompany Lesson 3
Phosphate in water samples
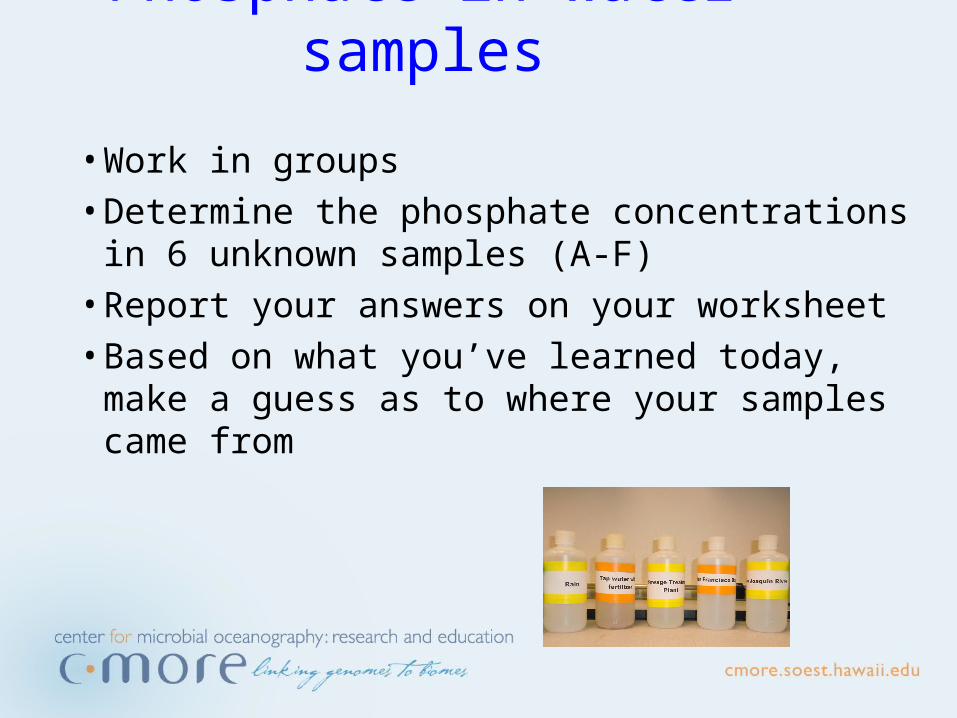
• Work in groups• Determine the phosphate concentrations in 6
unknown samples (A-F)• Report your answers on your worksheet• Based on what you’ve learned today, make a
guess as to where your samples came from
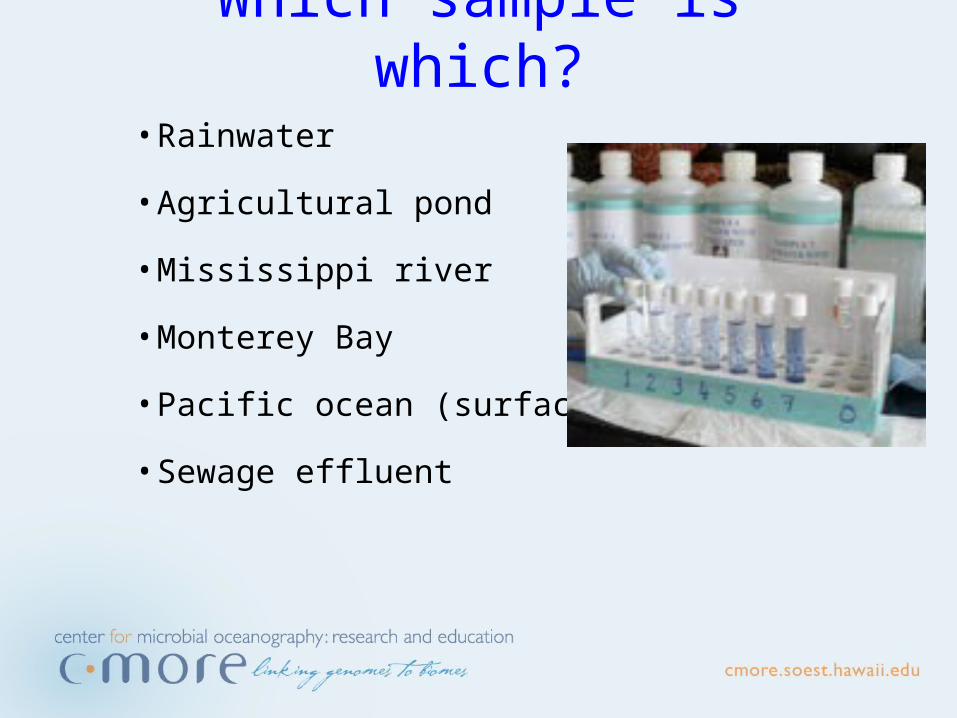
Which sample is which?• Rainwater
• Agricultural pond
• Mississippi river
• Monterey Bay
• Pacific ocean (surface)
• Sewage effluent
Let’s Discuss our Results• Why is the phosphate content in rainwater so low?
Why is there any phosphate in there to begin with?• Why is there so much phosphate in the agricultural
pond water and in the sewage effluent?• Why is there a lot of phosphate in the Mississippi
river?• Why is there a difference between Monterey Bay
and the Pacific Ocean?

Additional Resources for Teachers
26
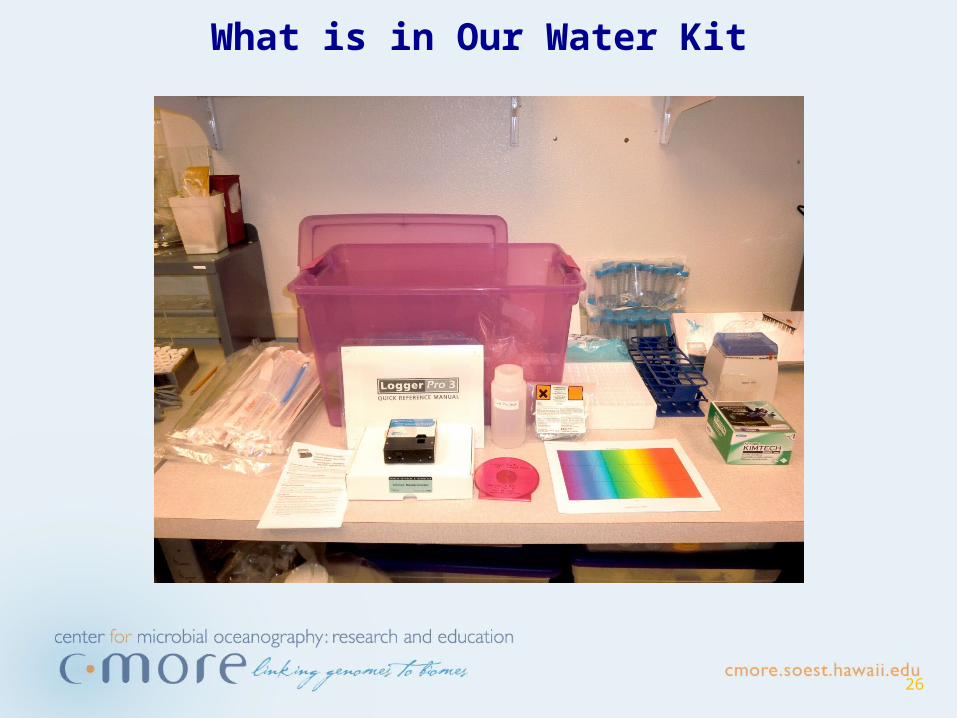
What is in Our Water Kit
27
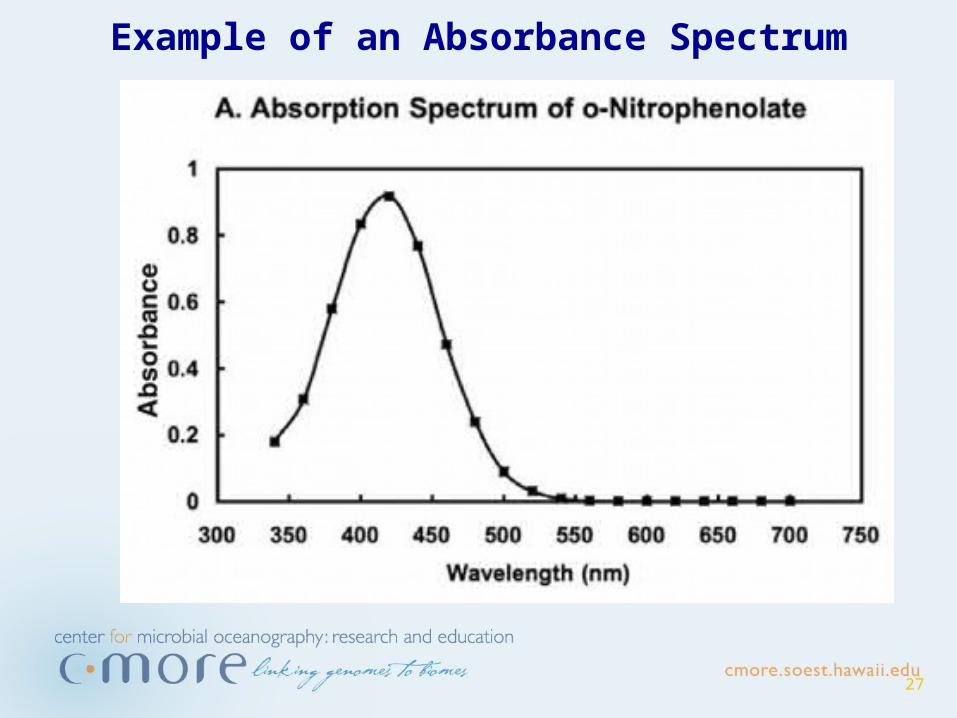
Example of an Absorbance Spectrum
28
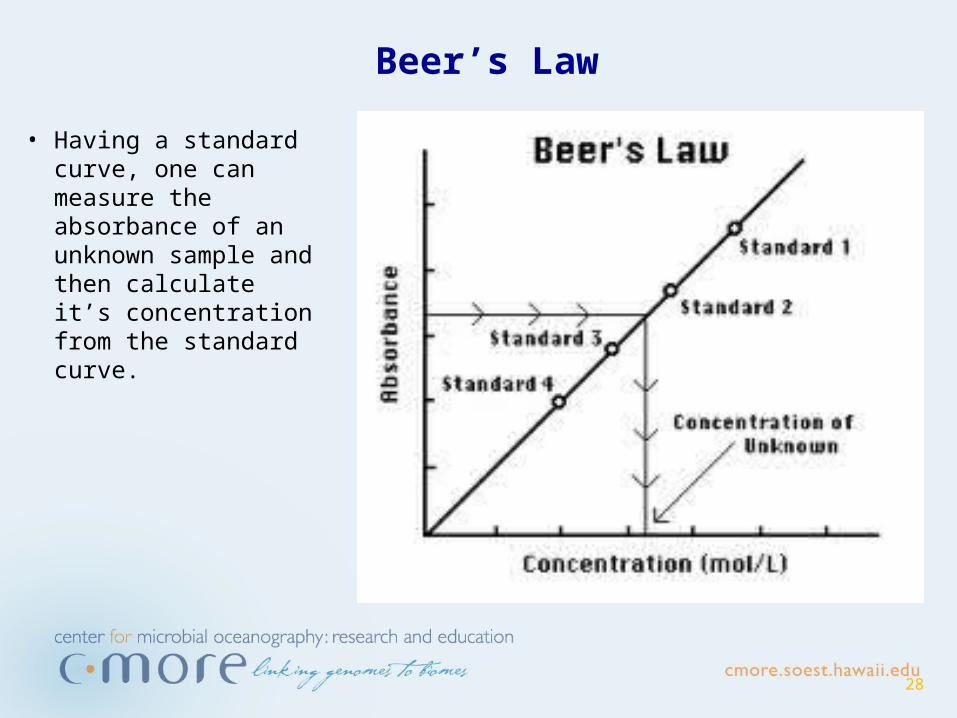
Beer’s Law
• Having a standard curve, one can measure the absorbance of an unknown sample and then calculate it’s concentration from the standard curve.
29
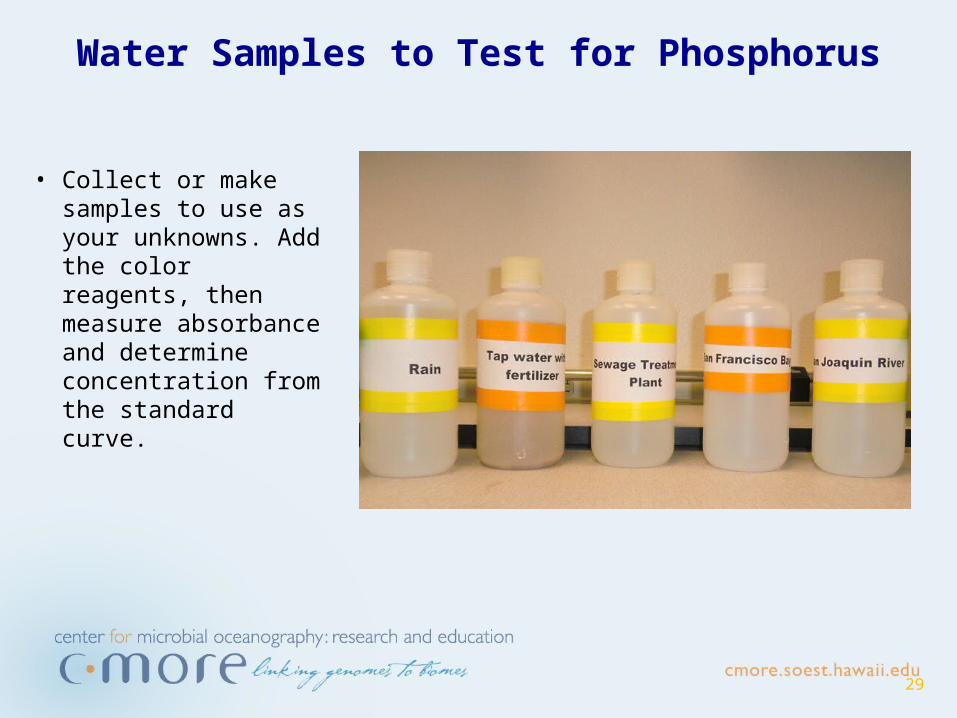
Water Samples to Test for Phosphorus
• Collect or make samples to use as your unknowns. Add the color reagents, then measure absorbance and determine concentration from the standard curve.
30
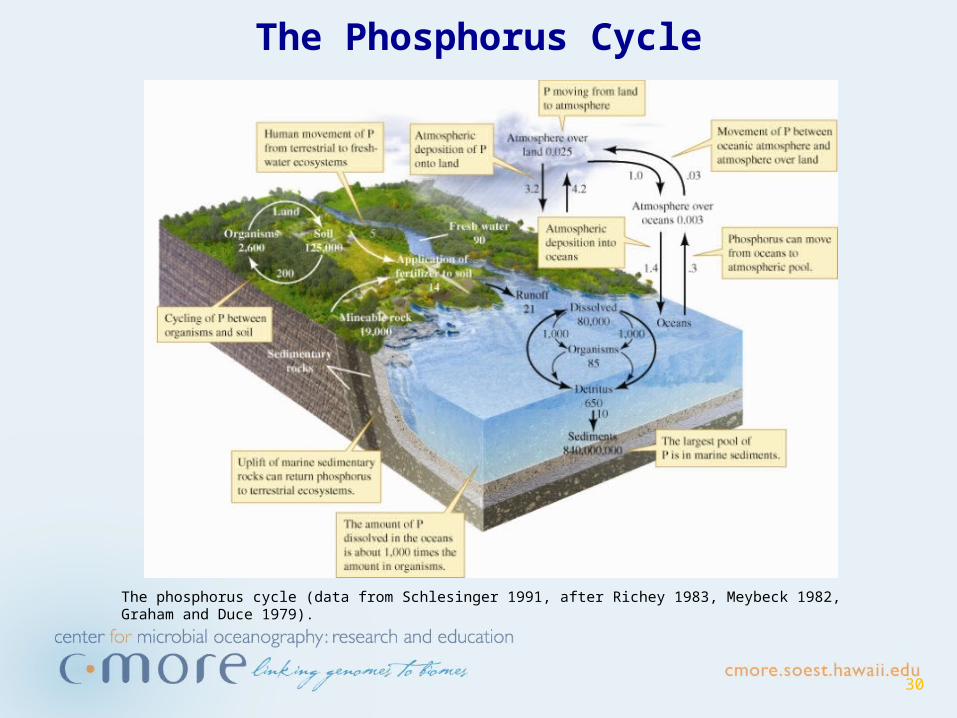
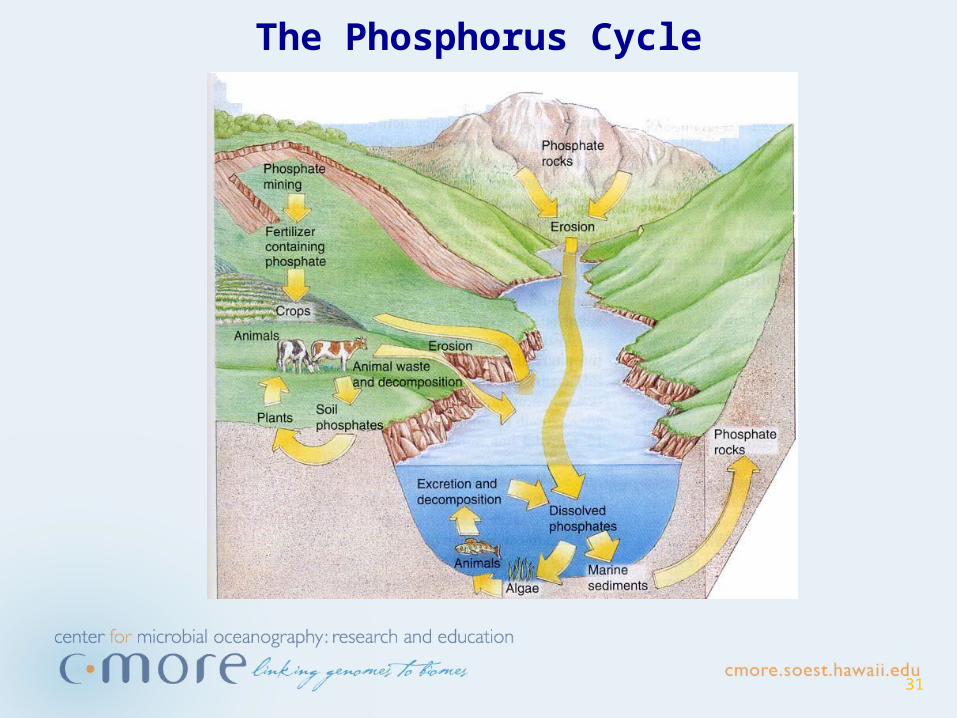
The Phosphorus Cycle
The phosphorus cycle (data from Schlesinger 1991, after Richey 1983, Meybeck 1982, Graham and Duce 1979).
31
The Phosphorus Cycle