1 wolterskluwer august 12, 2003 - amsterdam first half year results 2003
TRANSCRIPT

1
WoltersKluwer
August 12, 2003 - Amsterdam
First Half Year Results 2003

2
Agenda
Highlights HY 2003 R. Pieterse
Cluster/Market Review R. Pieterse
Financials B. Beerkens
Summary, Outlook and Q&A R. Pieterse

3
Highlights
• Challenging economic environment for all clusters impacts revenues and income; EBITA margin under pressure
• Benchmark net profit -26% at constant currencies; (1st quarter 03, -31%)
• Electronic sales increase to 34% of total continuing revenues
• New executive team now in place
• Positive cash flow and tighter working capital control;29% reduction of net debt
• Acceleration of restructuring program and significant cost reductions – at least EUR 70 mln full year
• Organic staff reduction of 500 FTEs already achieved

4
Key Financial HY 03
Constant % Currencies
HY 03 %EUR million
Revenues
Ordinary EBITA
Ordinary EBITA margin %
Benchmark Net Profit
Ordinary EPS before amortization of
intangibles, and exceptionals (fully diluted)
Ordinary free Cash flow
1,609
230
14.3
120
0.42
74
1,917
347
18.1
194
0.66
42
(6)
(24)
(26)
HY 02
(16)
(34)
(38)

5
Organic Growth
Total organic
Acquisitions
Divestments
At constant rates
Currency
Total
HY 03 HY 02
Revenues Ordinary EBITA
% % % % (3.4) 1.5 (18.8) (5.5)
2.7 5.4 1.3 5.8
(4.9) (1.4) (6.8) (0.1)
(5.6) 5.5 (24.3) 0.2
(10.4) 0.5 (9.5) 0.6
(16.0) 6.0 (33.8) 0.8
HY 03 HY 02

6
Electronic Revenues
Internet/ On-line
CD-ROM
Electronic
59
115
174
9
19
28
47
121
168
7
20
27
26
(7)
2
Internet/On-lineCD-ROM
Electronic
136135
271
2526
51
124139
263
2225
47
10(3)
3
%LTB Europe (EUR mln) HY 03 %HY 02%
%LTB NA (USD mln) HY 03 %HY 02%

7
Electronic Revenues
Internet/On-lineCD-ROM
Electronic
610
16
1017
27
69
15
1016
26
02
(2)
Internet/On-lineCD-ROM
Electronic
6825
111
258
33
5833
91
1710
27
44(25)
21
%LTB AsiaPacific(AUDmln) HY 03 %HY 02%
%Health (USD mln) HY 03 %HY 02%

8
Electronic Revenues
Internet/On-lineCD-ROM
Electronic
72
9
62
8
51
6
41
5
4350
43
%Education (EUR mln) HY 03 %HY 02%

9
Rob Pieterse
Chairman Executive Board
Wolters Kluwer nv
Cluster & Market Review

10
LTB Europe
Revenues (EUR) EBITA (EUR)EBITA margin %
62810316.5
62111318.2
(10)(12)
27 4
(12)(2)
7(10)
Million TotalCurrencyAcquisition/DivestmentOrganicHY 02HY 03
Change (mln)
• Growth in revenues and EBITA impacted by disappointing results from UK, Belgium and the Netherlands
• Overall business affected by slow economic conditions;organic performance -1% (flat LY)
• Weak advertising trends cause revenue decline in France and the Netherlands; improving trends in non-advertising revenues in the Netherlands
• Good growth rates for Italy, Scandinavia, CEE, Spain and Teleroute
• Italian and Spanish software strong on back of tax developments
• 28% of revenues are electronic (5% Internet)
NL21%
UK16%
SC3%
BEL9%
GER/ AUS/CEE18%
I T/ SP10%
TLR5%
FR18%

11
LTB Europe
• Key focus on cost reduction
• Major initiatives to address organic growth and infrastructure enhancements
• Aggressive cost management in the UK and management changes
• Strong market positions across Europe; initiatives taken to enhance market share further

12
LTB North America
EBITA margin %
Revenues (USD)(EUR)
EBITA (USD)(EUR)
53148110494
15
-
(112)
(22)
(43)
(42)
(140)
(64)
555621142158
19.6 25.5
Million TotalCurrencyAcquisition/DivestmentOrganicHY 02HY 03
Change (mln)
16%
27%
13%
11%
29%
4%
• Cluster performance negatively impacted specifically by BSI and Aspen
• LIS flat compared to last year despite slow down in transactional markets
• CCH Tax Compliance grew solidly boosted by strong core and accelerated new products; CCH Canada also performed strongly
• Steady underlying performance from CCH overall despite economic conditions; retention rate stabilizing
CCH BSIAspen
CCH LIS
CCH Tax Compliance
CCH Canadian
CCH US Publishing

13
LTB North America
• Electronic revenues 51% of total; Internet/On-line 26%
• Benefits expected in second half from the reorganization of the cluster into customer facing groups, with significant cost reductions, appointment of CEOs and management changes at Aspen back office and finance teams
• Market share set to strengthen as a result of actions taken to upgrade content platform
• New product development and sales and marketing initiatives maintained despite cost reductions
14
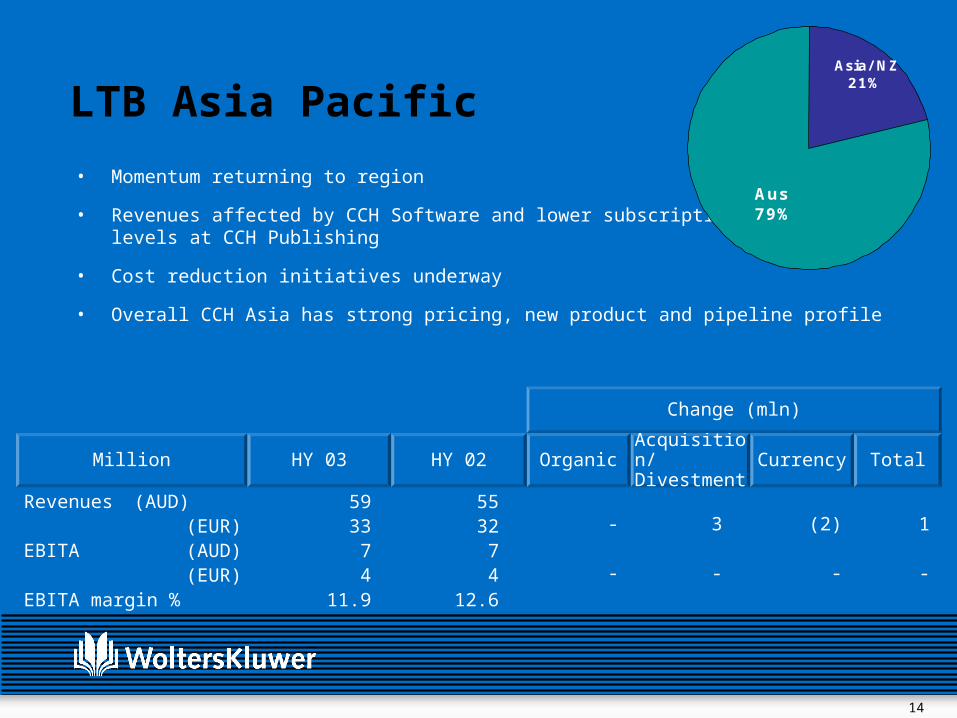
LTB Asia Pacific
• Momentum returning to region
• Revenues affected by CCH Software and lower subscription levels at CCH Publishing
• Cost reduction initiatives underway
• Overall CCH Asia has strong pricing, new product and pipeline profile
Revenues (AUD)(EUR)
EBITA (AUD)(EUR)
EBITA margin %
5933
74
11.9
3
-
(2)
-
-
-
1
-
5532
74
12.6
Million TotalCurrencyAcquisition/DivestmentOrganicHY 02HY 03
Change (mln)
Aus79%
Asia/ NZ21%

15
Health• Professional & Education performing well – strong
revenue and cost management profile especially in Nursing and Health Professional titles
• Good showing from Clinical Tools in Facts & Comparisons and Medispan; integration going according to plan
• Lower revenues mainly due to Medical Research (phasing issues, softness in the international market and reduced advertising revenues)
• Weaker journal and book revenues at Pharma Solutions
Revenues (USD)(EUR)
EBITA (USD)(EUR)
EBITA margin %
3333024238
12.5
2
1
(70)
(9)
(3)
(5)
(71)
(13)
3343734651
13.7
Million TotalCurrencyAcquisition/DivestmentOrganicHY 02HY 03
Change (mln)
18%30%
8%
44%
Medical Research
Pharma Solutions
Prof. & Education
Clinical Tools

16
Health
• Customer focused initiatives being intensified
• Continuing production efficiencies
• Major new book program at Professional and Education underway
• Increased focus on targeting society journals (new contracts booked)
• New intra-cluster product development initiatives
• Actions taken are further strengthening Wolters Kluwer’s strong positions in key Health market segment
• Expected growth for Health above company average

17
Education
• Seasonal business balanced towards second half of year
• Revenues down:
primary education negatively affected as government funded book budgets have been cut
adverse market conditions in UK and Sweden
• Management changes in the UK and the Netherlands
• Strong focus on cost control throughout cluster
Revenues (EUR) EBITA (EUR)EBITA margin %
1175
4.6
120108.0
(3)(4)
1(1)
(1) (3)(5)
Million TotalCurrencyAcquisition/DivestmentOrganicHY 02HY 03
Change (mln)
Sweden30%
UK16% Other
19%
Netherlands 35%

18
Education
• Focus on improved sales and marketing; cross cluster efficiencies and improved cost structure
• Investment in development of blended learning solutions: ready for commercial launch in a number of key markets: Digicoach
• Cooperation with IBM to provide e-learning solutions to schools in UK and the Netherlands
• Businesses aligned to take full advantage of 2004-2006 cycle peak in secondary education
• Education Cluster Day – November 24th, Amsterdam

19
Boudewijn Beerkens
Member Executive Board / CFO
Wolters Kluwer nv
Financials

20
Actions Taken
• Impairments
• Currency Hedging
• Share Buy-Back
• Dutch GAAP (moving to IAS/IFRS); RJ 270 and RJ 271
• Cash Flow & Working Capital Management
• Stricter Acquisition Policy

21
Overview
• Economic environment puts pressure on Wolters Kluwer’s Net Profit Benchmark leading to downward adjustment for full year
• Solid cash flow half year 2003
• 29% decrease in net debt from EUR 2,993 mln to EUR 2,122 mln
• Key financial ratios improved
• Limited acquisition spending
• Buy-back of shares
• Strategy Update on October 30th will outline medium to long term plans

22
HY 03 ResultsHY 03 %HY 02 Constant
currencies %
EUR mln
RevenuesEBITAEBITA margin %
Amortization of intangibles
Financing results
Taxation on operating incomeNon-consolidated and minority interestResults on divestments (after taxation)
Net income
1,609230
14.3
(291)(58)
(10)(4)
18
(115)*
1,917347
18.1
(174)(74)
(67)(2)
2
32
(16)(34)
(6)(24)
* Impairment effect (EUR 155 mln)

23
HY 03 Results (cont)
Net income Amortization of intangiblesTaxation on amortizationResults on divestments (after taxation)
Ordinary BM net income
Ordinary EPS before amortization of intangibles, and exceptionals (fully diluted)
(115)*
291(38)
(18)
120
0.42
32174(10)
(2)
194
0.66
HY 03 %HY 02 Constant currencies %
EUR mln
(38) (26)
* Impairment effect (EUR 155 mln)

24
Consolidated Balance SheetHY 03EUR mln HY 02
Total fixed assets
Total current assets
Total current liabilities
Working capital
Capital Employed
Shareholders equity
Perpetual subordinated bond
Convertible bond
Minority interests
Provisions
Long term loans
Total Financing
3,578
1,991
(1,257)
734
4,312
1,050
225
700
5
346
1,986
4,312
4,732
1,264
(1,340)
(76)
4,656
1,297
225
700
3
254
2,177
4,656

25
Wolters Kluwer complies with Dutch GAAP RJ 270 and RJ 271
• Wolters Kluwer has implemented RJ 270 and RJ 271 as per 1 January
2003, bringing it closer to IAS/IFRS
RJ 270 / IAS 18 – Revenue Recognition
RJ 271 / IAS 19 – Pensions/Employee Benefits
• Estimated impact;
• Year-end 2003 results will include these accounting changes
Equity opening
balance 2003 Revenue 2003
EBITA 2003
RJ 270 (80) 75 pm RJ 271 (50) - pm Total (130) 75 pm
EUR mln (after tax)

26
Improving Key Financial Ratios
2.32.0Net interest bearing debt to shareholders equity
3.22.8Net debt to EBITDA(Rolling 12 months)
4.95.6
2,993
5.36.2
2,122
Net interest coverage- EBITA- EBITDA(Rolling 12 months)
Net debt (29% improvement)
HY 03EUR mln HY 02

27
Cash flow statement
EBITADepreciation
23053
34761
(34)
EBITDA 283 408 (31)
Movement in working capitalCash flow from operationsFinancing costs
(42) (116)(17)241
(71)292(77)
Paid corporate income tax (39) (79)
Other (2) (15)
Cash flow from operating activities 129 121 7
(49)(6)
(63)(16)
Net expenditure fixed assetsAppropriation acquisition provisions
Acquisition spendingDivestment of activitiesCash flow investments
(56)502
(203)0
391 (282)
Cash flow surplus/(deficit) 520 (161)
HY 03EUR mln HY 02 %
28
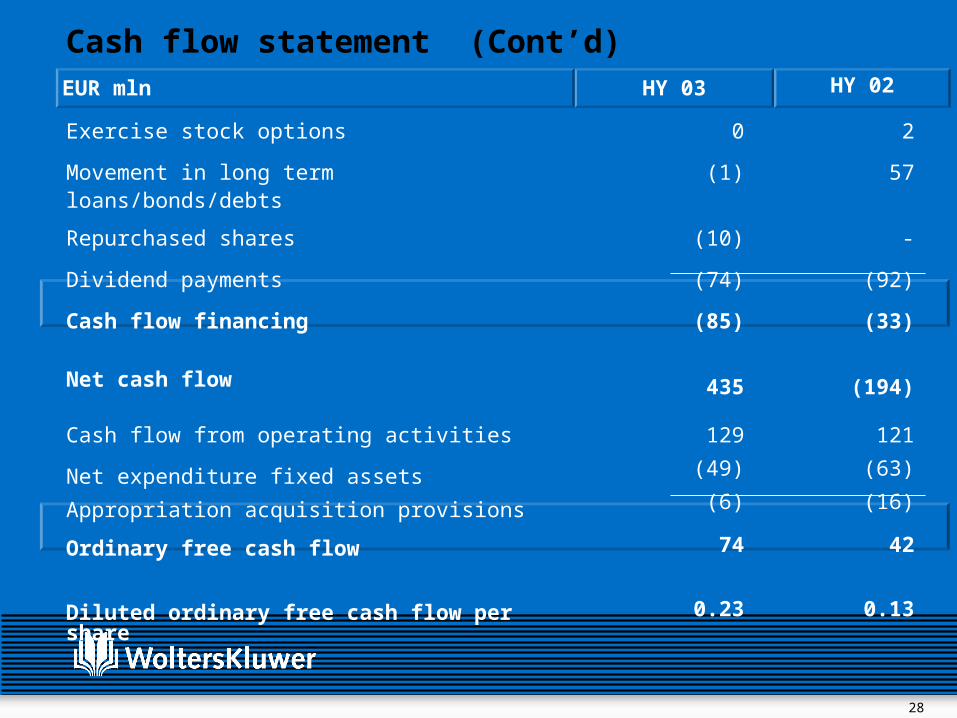
Cash flow statement (Cont’d)
Exercise stock options 0 2
Movement in long term loans/bonds/debts (1) 57
Repurchased shares (10) -
Dividend payments (74) (92)
Cash flow financing
Net cash flow
(85) (33)
435
(194)
Cash flow from operating activities 129
(49)
(6)
121
(63)
(16)Net expenditure fixed assets
Appropriation acquisition provisions
Ordinary free cash flow
Diluted ordinary free cash flow per share
74
0.23
42
0.13
HY 03EUR mln HY 02

29
Working Capital Development(Organic Trend)
Analysis of contribution (+) absorption of (-) Cash Flow
HY 03EUR mln HY 02
Inventories
Trade debtors
Other debtors
Trade creditors
Deferred income
Other short-term liabilities
Increase/(Decrease)
(4)
2
1
(53)
89
(77)
(42)
(20)
(35)
(14)
(62)
86
(71)
(116)

30
Acquisitions HY 2003Stricter acquisition policy and focus on core markets in Europe and US
1.9
7.3
162
300
32
2.2
6.8
211
458
37
2.6
11.1
Revenues multiplier
EBITA multiplier
204Acquired annual revenues
533Total investment
29# of transactions
(incl. minority stakes)
2.2
8.3
618
1,361
104
2002 20002001 Total 00-03
EUR mln
1.7
10.6
41
70
6
HY03

31
Summary & Outlook• Trading conditions will remain challenging for the rest of 2003
• Inevitable impact on revenues and income
• Benchmark ordinary net income at constant currency rates will be
significantly below that of last year and lower than indicated in
May
• Second half of the year expected to be stronger than the first half,
also showing benefits of accelerated cost cutting and
restructuring
• Improvement in financial controls and strong focus on cash
generation
• Further capitalizing on valuable market positions
• Sound medium and long-term prospects, - further details in the
Strategy Update, October 30th

32
• Strategy Update – October 30th, London
• Q3 Results – November 12th, conference call
• Education Cluster Day – November 25th, Amsterdam

33
Appendix

34
Revenues by Media
ElectronicInternetOther
538234304
341519
579240339
331419
(8)(3)
(11)
Print 811 52 939 53 (13)
Services 212 14 249 14 (15)
Continuing business 1,561 1,767 (12)
Non Core 48 3 150 8 (68)
Total 1,609 100 1,917 100 (16)
%EUR mln HY 03 %HY 02%

35
Overview Electronic sales per cluster
LTB Europe 174 28 168 27
LTB North America 245 51 294 47
LTB Asia Pacific 9 27 9 28
Health 101 33 102 28
Education 9 8 6 5
Total 538 34 579 32
EUR mln HY 03 HY 02 % of cluster sales
HY 02HY 03 % of cluster sales

36
Print Revenues
Loose leavesInfo PackagingJournals & NewslettersBooks
200104237270
137
1517
25567
307310
144
1817
(22)55
(23)(13)
Print 811 52 939 53 (13)
%EUR mln HY 03 %HY 02%

37
Print and services Revenues in local currency
100
99
112
60
83
454
118
43
141
58
93
453
Loose-leaves
Info Packaging
Journals/news.
Books
Document services
Total
97
4
15
59
117
292
85
4
10
48
113
260
Loose-leaves
Info Packaging
Journals/news.
Books
Document services
Total
LTB North America (USD mln) HY 03 HY 02
LTB Europe (EUR mln) HY 03 HY 02

38
LTB Asia Pacific (AUD mln)
Health (USD mln)
Print and services Revenues in local currency
25
3
1
9
5
43
25
3
1
9
2
40
Loose-leaves
Info Packaging
Journals/news.
Books
Document services
Total
9
0
127
67
19
222
11
15
131
67
19
243
Loose-leaves
Info Packaging
Journals/news.
Books
Document services
Total
HY 03 HY 02
HY 03 HY 02

39
Print Revenues in local currency
0
0
102
6
108
0
0
108
6
114
Loose-leaves
Journals/news.
Books
Other
Total
Education (EUR) HY 03 HY 02

40
32759
18.2
Revenues (EUR) EBITA (EUR)EBITA margin %
32467
20.8
Million Q2 02Q2 03
LTB Europe
Revenues (USD)(EUR)
EBITA (USD)(EUR)
EBITA margin %
2592275346
20.5
2773047279
25.9
Million Q2 02Q2 03
LTB North America
Q2 03 results per cluster

41
Revenues (USD)(EUR)
EBITA (USD)(EUR)
EBITA margin %
1801593027
16.7
1821993134
17.0
Million Q2 02Q2 03
Health
Q2 03 results per cluster
Revenues (AUD)(EUR)
EBITA (AUD)(EUR)
EBITA margin %
27151.60.95.8
26152.41.49.2
Million Q2 02Q2 03
LTB Asia Pacific

42
7815
20.0
Revenues (EUR) EBITA (EUR)EBITA margin %
7716
20.6
Million Q2 02Q2 03
Education
Q2 03 results per cluster

43
WoltersKluwer
August 12, 2003 - Amsterdam
First Half Year Results 2003