10 designing dewats - loughborough university · pdf file10 designing dewats ... calculations...
TRANSCRIPT
230
10 Designing DEWATS
If the planning engineer knows his or her craft and recognises his or her limita-tions, designing DEWATS is relatively simple. Treatment-system performance cannot be precisely predicted and, therefore, calculating of dimensions should not involve ambitious procedures; in the case of small- and medium-scale DEWATS, a slightly oversized plant volume adds to operational safety.
Based on local conditions, needs and preferences, plants of varying sizes can be chosen as standard designs. On-site adaptations can then be made by less-qualified site supervisors or technicians.
In the case of specific demands, calculations and design must be carried out individually; the structural details of the standardised plants can be integrated. In this chapter we introduce a simplified, quasi-standardised method of calculating dimensions using spreadsheets.
Co-operative plant systems that require interconnecting sewerage must be de-signed individually by an experienced engineer, who is able to place plants and sewers according to contours and other site requirements.
10.1 Technical spreadsheets – background
10.1.1 Usefulness of computer calculation
The purpose of this chapter is to provide the engineer with tools to produce his or her own spreadsheets for sizing DEWATS in any computer programme that he or she is familiar with. The exercise of producing one’s own tables will compel engi-neers to deepen their understanding of design.
The curves that have been used as the basis for calculation in the formulas applied in the computer spreadsheets may also be of interest to those who do not use a computer (these are found in this chapter). As these curves visualise the most important relationships between various parameters, they will enhance understanding of the factors that influence the treatment process. It should be noticed that the graphs have been developed on the basis of mixed information; the methods of calculation, therefore, do not always follow the same logic.
231
Computerised calculations can be very helpful, particularly if the formulas and the input data are correct. Flawed assumptions or wrong data, on the other hand, will definitely result in worthless results. Nevertheless, assuming the input data is correct, spreadsheets provide a quick impression of the plant’s space require-ment and what treatment performance can be expected. Ready-to-use computer spreadsheets are especially helpful to those who do not design DEWATS on a daily basis and would otherwise need to recollect the entire theory for sizing a plant before starting to design.
Please bear in mind that DEWATS provides a set of approaches. The equations used in the technical spreadsheets do rely on certain assumptions. Because of the very different parameters that are relevant for the performances of a plan (temperature, materials to be used, composition of the wastewater etc.) there is not a “right way” to calculate dimensions. It is the experience and understanding of the planner that is crucial to create the designs most appropriate to local condi-tions – i. e. the wastewater problem.
10.1.2 Risks of using simplified formulas
The formulas applied in the spreadsheets have been developed by practitioners, who are not overly concerned with theoretical knowledge. But the formulas are based on scientific findings, which have been simplified in the light of of practical experience.
Even if the formulas were to be 100% correct, the results would not be 100% accurate, as input data is not fully reliable. But the accuracy of the formulas is likely to be greater than the accuracy of wastewater sampling and analysis. There are many unknown factors influencing treatment efficiency and “scientific” hand-books provide a possible range of results. But this book, although “scientifically” based, is written for people who have to build a real plant out of real building materials. The supervisor cannot tell the mason to make a concrete tank “about 4.90m to 5.60m long”; he or she must say: “The length should be 5.35m”. The following spreadsheets were designed in this spirit. Anyone who already uses more variable methods of calculation and who is not the target reader of this book is free to modify the formulas and curves according to his or her experience and ability (the authors welcome any information that would help to improve the spreadsheets).
232
10 Designing DEWATS
As the formulas represent simplifications of complex natural processes, there is a certain risk that they do not reflect reality adequately. However, the risk of changes in the assumed reality is even greater; for example, expanding a factory without enlarging the treatment system is obviously more significant than anassumed BOD of 350mg/l, when in reality it is only 300mg/l.
Listed below are some examples of incorrect assumptions and their consequences:• underestimating sludge accumulation in septic tanks, sedimentation ponds, Imhoff tanks and anaerobic reactors results in shorter desludging intervals • in the case of anaerobic reactors, severe under-sizing could lead to a collapse of the process, while over-sizing may require longer maturation time at the beginning• incorrect treatment performance of primary or secondary treatment steps could be the cause of over- or undersized post-treatment facilities. This may result in unnecessarily high investment costs or having to enlarge the post- treatment facilities• undersized anaerobic ponds will develop odour, while slightly oversized ponds
may not develop sufficient scum, also resulting in smells• undersized aerobic ponds can develop an odour; there is no harm in oversizing
aerobic ponds• the biggest risk lies in filter media clogging in both anaerobic tanks and
constructed wetlands. However, the risk is more likely to come from inferior filter material, faulty structural details or incorrect wastewater data than from incorrect sizing
In general, moderate oversizing reduces the risk of unstable processes and inferior treatment results.
233
10.1.3 About the spreadsheets
The spreadsheets presented in this handbook are in Microsoft EXCEL; other suitable programmes may also be used.
There might be differences in the syntax of formulas, for example 3² (3 to the power of 2) may be written as =POWER(3;2) or =3^2, square root of 9 could be =SQRT(9) or =9^1/2, cubic root of 27 would be =power(27;1/3) or =27^1/3. Some programmes may accept only one of the alternatives.
The spreadsheets are based on data which is normally available to the planning engineer within the context of DEWATS. For example, while the measurement of BOD5 and COD may be possible at the beginning of planning, it is unlikely that the BOD5 will be regularly controlled later on. Therefore, calculations are based on COD or the results of BOD-based formulas have been set in relation to COD, and vice versa. In the following, the term BOD stands for BOD5.
The formulas applied in the spreadsheets are based on curves from scientific publications, handbooks and the experience of BORDA and its partners. The formulas, therefore, define typical trends. For example, it is well-known that the removal efficiency of an anaerobic reactor increases when the COD/BOD ratio is narrow. Such curves have been simplified into a chain of straight lines to allow the reader to easily understand the formulas – and to adjust their values to local conditions if necessary. Although the amount of data on which some of these curves are based is sometimes too insignificant to be statisticaly relevant, the formulas have been applied successfully and adjusted on the basis of practical experience.
The formulas are simple. Besides basic arithmetical operations, they use only one logical function, namely the “IF”-function. For example:
If temperature is less than 20°C; then hydraulic retention time is 20 days; if not, then it is 15 days in case the temperature is less than 25°C; otherwise (this means, if temperature is over 25°C) the HRT is 10 days.
234
10 Designing DEWATS
Assuming the temperature is stated in cell F5 of the spreadsheet, the formula for retention time will be written as: =IF(F5<20;20;IF(F5<25;15;10)).
The formulas have been kept simple, so that the user can make modifications, according to experience or superior knowledge. For example, if it has been found that, for a certain substrate, the HRT should be 25 days below 20°C, 23 days up to 25°C and 20 days above 25°C and, that for safety reasons, 10% longer reten-tion time is added, then the formula should read:
= 110%* IF (F5 < 20; 25; IF (F5 < 25; 23; 20)).
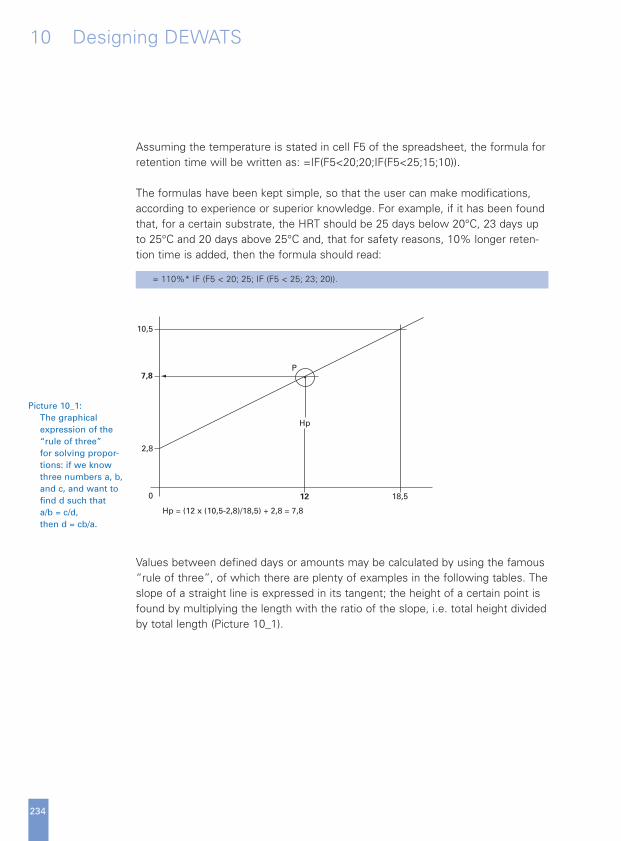
Values between defined days or amounts may be calculated by using the famous “rule of three”, of which there are plenty of examples in the following tables. The slope of a straight line is expressed in its tangent; the height of a certain point is found by multiplying the length with the ratio of the slope, i.e. total height divided by total length (Picture 10_1).
Picture 10_1: The graphical
expression of the “rule of three”for solving propor-tions: if we know three numbers a, b, and c, and want to find d such that a/b = c/d, then d = cb/a.
Hp
0
2,8
7,8
10,5
12 18,5
Hp = (12 x (10,5-2,8)/18,5) + 2,8 = 7,8
P
235
In case the reader is not familiar with working in EXCEL, it is better not to modify formulas but to manipulate the results by entering “modified” data. For example, if the values of spreadsheet results are generally lower or higher than the expe-rienced in the field, dimensioning can be adjusted by entering lower or higher temperature values, or shorter or longer retention times. One could also multiply wastewater volumes or COD concentrations by a safety factor before starting the calculation. To avoid mishaps, all the spreadsheet cells should be locked, except the ones written in bold figures.
When the user prepares his or her own tables and copies the formulas below, the columns (A; B; C; D...) and the rows (1; 2; 3; 4; 5...) before the “equals” symbol of each formula, define which cell the formula should be written in. The names of cells and rows are shown on the entry mask of the monitor. In transferring formu-las to the spreadsheet, the cell name before the “equals” symbol should not be copied; for example E6=D5/E5 should be written in cell E6 as =D5/E5.
The italic figures are either guiding figures to show usual values, or they indicate limits to be observed. The bold figures are those which have to be filled in by hand; the other figures are calculated. Columns which are labelled “given” con-tain data which reflects a given reality, for example, wastewater-flow volume or wastewater strength. Columns which are labelled “chosen” contain data which may be modified to optimise the design, for example, hydraulic retention time or desludging intervals. All other cells contain formulas and should be locked, in order to avoid deleting by accident formulas. Cells which are labelled “check” or “require” should be used to confirm whether the chosen and given values arerealistic.
236
10 Designing DEWATS
10.2 Technical spreadsheets – application
10.2.1 Assumed COD/BOD ratio
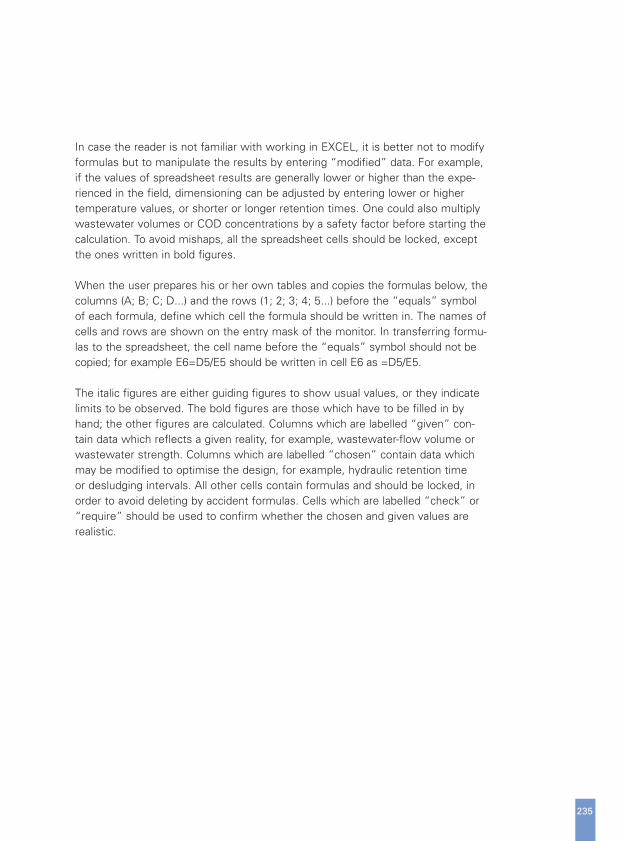
The COD/BOD ratio widens during biological treatment because the BOD reflects only that part of the oxygen demand which is reduced by biological treatment, while the COD represents total oxygen demand. The removed BOD, therefore, has a greater percentage-wise influence on the change of the BOD than on the COD. The COD/BOD ratio widens faster while biological degradation is incomplete, and slower when treatment efficiency reaches almost 100%.
Picture 10_2: COD removal in
relation to tempe-rature in anaerobic reactors.
Change of COD/BOD ratio during anaero-bic treatment. The samples have been taken by SIITRAT from anaerobic filters, most of them serving schools in the suburbs of Delhi, India
Picture 10_3: COD removal rela-
tive to wastewater strength in anaerobic filters.
Simplified curve of Picture 10_2, which is used in the spreadsheet formulas
50 55 60 65 70 75 80 85 90
COD removal in %
1,00
1,05
1,10
1,15
1,20
1,25
1,00
1,05
1,10
1,15
35 45 55 65 75 85 95COD rem. efficiency in %
237
10.2.2 Domestic wastewater quantity and quality
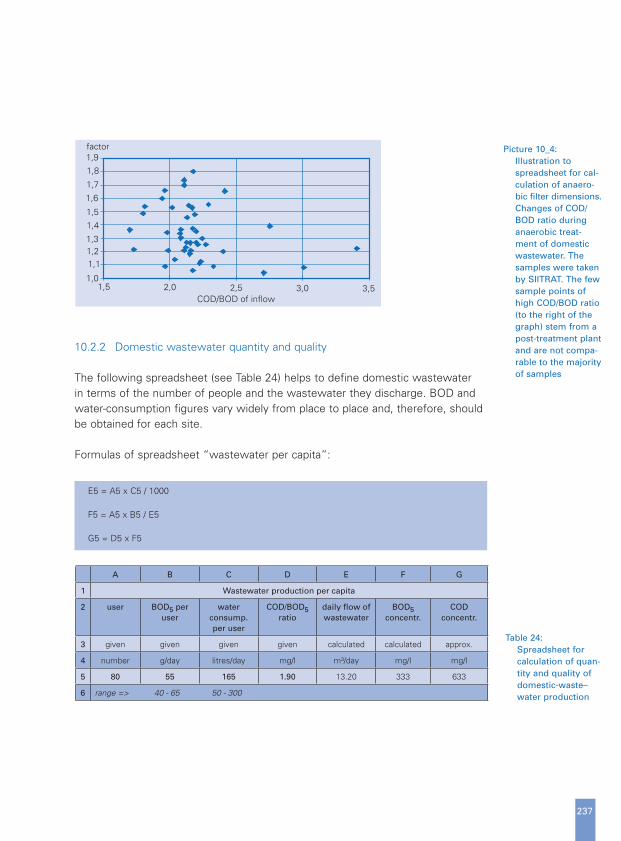
The following spreadsheet (see Table 24) helps to define domestic wastewater in terms of the number of people and the wastewater they discharge. BOD and water-consumption figures vary widely from place to place and, therefore, should be obtained for each site.
Formulas of spreadsheet “wastewater per capita”:
E5 = A5 x C5 / 1000
F5 = A5 x B5 / E5
G5 = D5 x F5
1,0
1,11,21,3
1,4
1,5
1,6
1,7
1,81,9
1,5 2,0 2,5 3,0 3,5COD/BOD of inflow
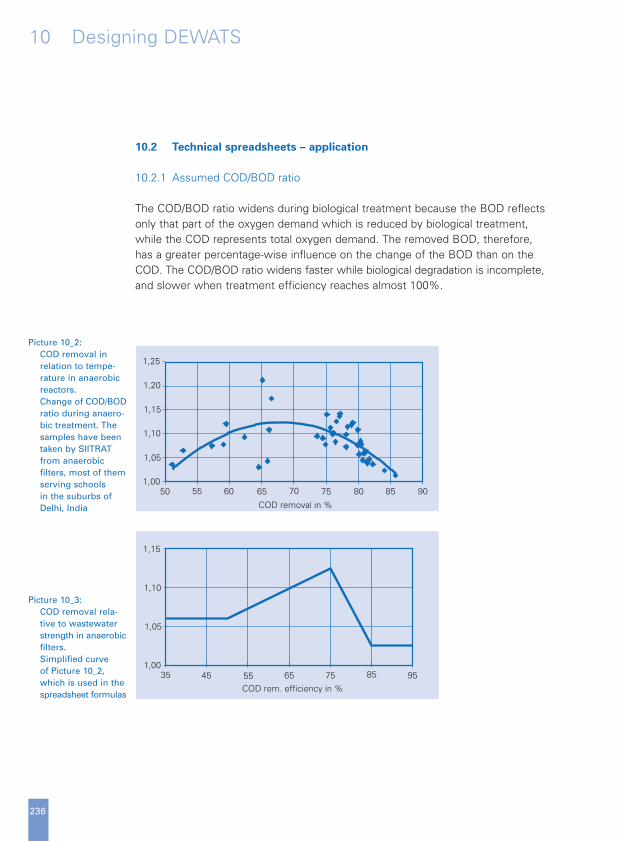
factor Picture 10_4: Illustration to
spreadsheet for cal-culation of anaero-bic filter dimensions.
Changes of COD/BOD ratio during anaerobic treat-ment of domestic wastewater. The samples were taken by SIITRAT. The few sample points of high COD/BOD ratio (to the right of the graph) stem from a post-treatment plant and are not compa-rable to the majority of samples
Table 24: Spreadsheet for
calculation of quan-tity and quality of domestic-waste–water production
A B C D E F G
1 Wastewater production per capita
2 user BOD5 per user
water consump. per user
COD/BOD5 ratio
daily fl ow of wastewater
BOD5 concentr.
COD concentr.
3 given given given given calculated calculated approx.
4 number g/day litres/day mg/l m³/day mg/l mg/l
5 80 55 165 1.90 13.20 333 633
6 range => 40 - 65 50 - 300
238
10 Designing DEWATS
10.2.3 Septic tank
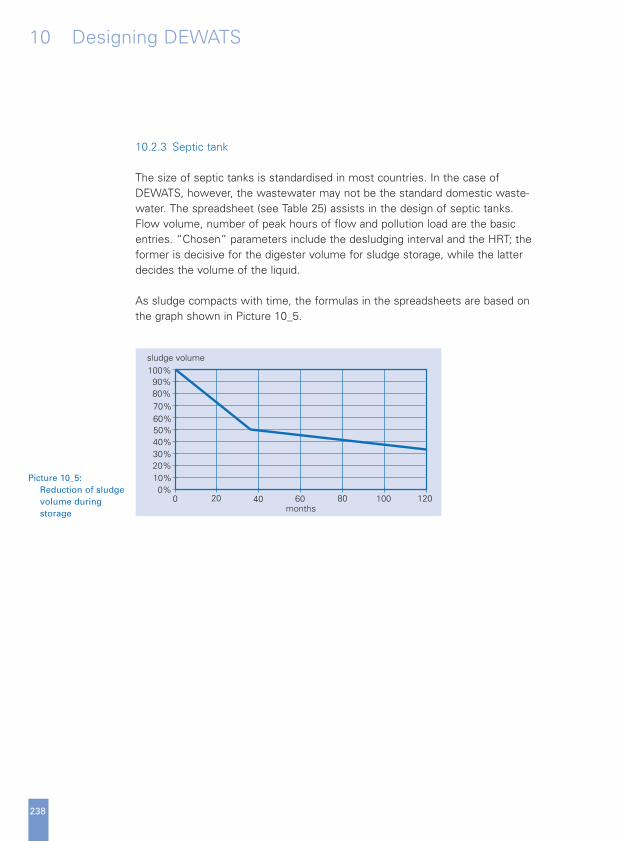
The size of septic tanks is standardised in most countries. In the case of DEWATS, however, the wastewater may not be the standard domestic waste-water. The spreadsheet (see Table 25) assists in the design of septic tanks.Flow volume, number of peak hours of flow and pollution load are the basic entries. “Chosen” parameters include the desludging interval and the HRT; the former is decisive for the digester volume for sludge storage, while the latter decides the volume of the liquid.
As sludge compacts with time, the formulas in the spreadsheets are based on the graph shown in Picture 10_5.
Picture 10_5: Reduction of sludge
volume during storage
0%10%
sludge volume
months0 20 40 60 80 100 120
20%30%40%50%60%70%80%90%
100%
239
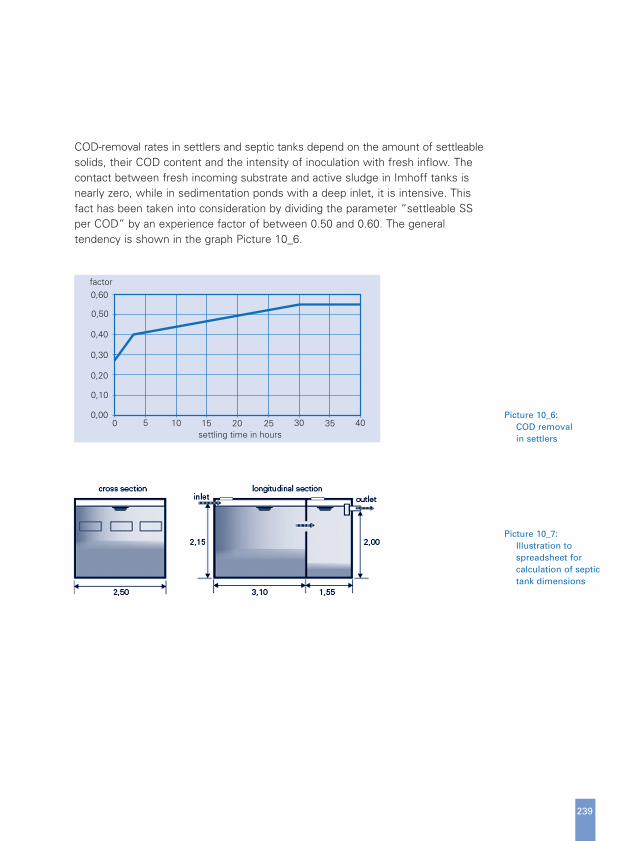
COD-removal rates in settlers and septic tanks depend on the amount of settleable solids, their COD content and the intensity of inoculation with fresh inflow. The contact between fresh incoming substrate and active sludge in Imhoff tanks is nearly zero, while in sedimentation ponds with a deep inlet, it is intensive. This fact has been taken into consideration by dividing the parameter “settleable SS per COD” by an experience factor of between 0.50 and 0.60. The general tendency is shown in the graph Picture 10_6.
Picture 10_7: Illustration to
spreadsheet for calculation of septic tank dimensions
Picture 10_6: COD removal
in settlers
0 5 10 15 20 25 30 35 40settling time in hours
0,00
0,20
0,30
0,40
0,50
0,60factor
0,10
240
10 Designing DEWATS
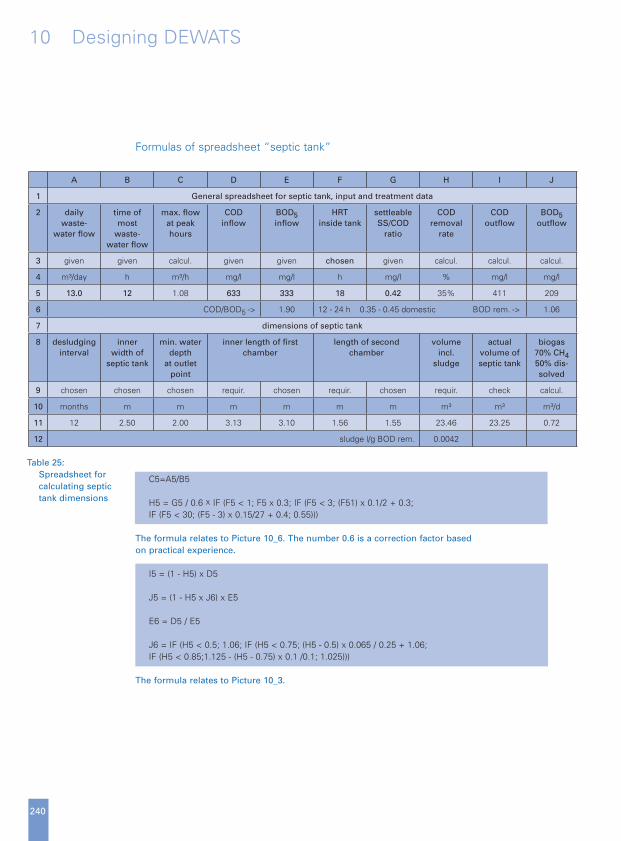
Formulas of spreadsheet “septic tank”
C5=A5/B5
H5 = G5 / 0.6 x IF (F5 < 1; F5 x 0.3; IF (F5 < 3; (F51) x 0.1/2 + 0.3;IF (F5 < 30; (F5 - 3) x 0.15/27 + 0.4; 0.55)))
The formula relates to Picture 10_6. The number 0.6 is a correction factor basedon practical experience.
I5 = (1 - H5) x D5
J5 = (1 - H5 x J6) x E5
E6 = D5 / E5
J6 = IF (H5 < 0.5; 1.06; IF (H5 < 0.75; (H5 - 0.5) x 0.065 / 0.25 + 1.06;IF (H5 < 0.85;1.125 - (H5 - 0.75) x 0.1 /0.1; 1.025)))
The formula relates to Picture 10_3.
A B C D E F G H I J
1 General spreadsheet for septic tank, input and treatment data
2 daily waste-
water fl ow
time of most
waste- water fl ow
max. fl ow at peak hours
COD infl ow
BOD5 infl ow
HRT inside tank
settleable SS/COD
ratio
COD removal
rate
COD outfl ow
BOD5 outfl ow
3 given given calcul. given given chosen given calcul. calcul. calcul.
4 m³/day h m³/h mg/l mg/l h mg/l % mg/l mg/l
5 13.0 12 1.08 633 333 18 0.42 35% 411 209
6 COD/BOD5 -> 1.90 12 - 24 h 0.35 - 0.45 domestic BOD rem. -> 1.06
7 dimensions of septic tank
8 desludging interval
inner width of
septic tank
min. water depth
at outlet point
inner length of fi rstchamber
length of secondchamber
volume incl.
sludge
actual volume of septic tank
biogas 70% CH450% dis-solved
9 chosen chosen chosen requir. chosen requir. chosen requir. check calcul.
10 months m m m m m m m³ m³ m³/d
11 12 2.50 2.00 3.13 3.10 1.56 1.55 23.46 23.25 0.72
12 sludge l/g BOD rem. 0.0042
Table 25: Spreadsheet for
calculating septic tank dimensions
241
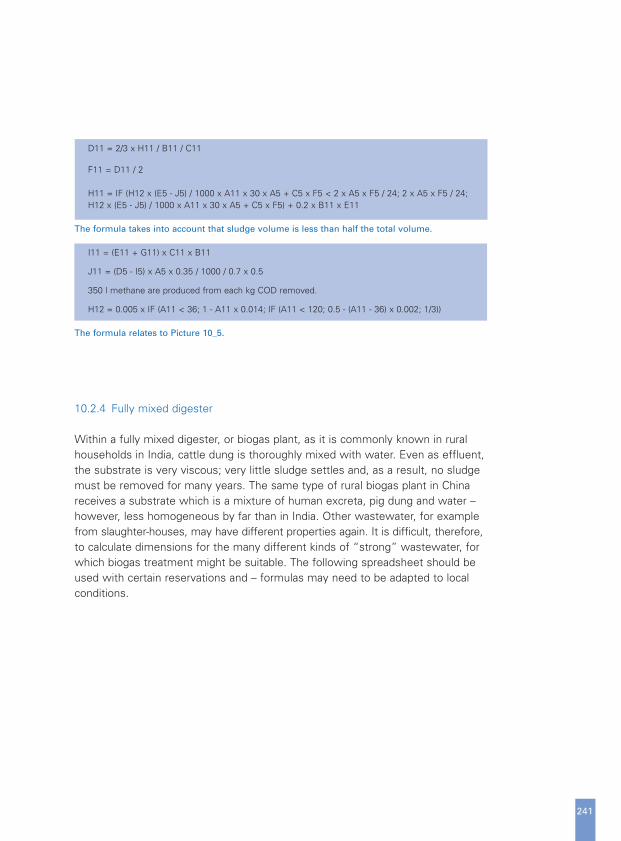
D11 = 2/3 x H11 / B11 / C11
F11 = D11 / 2
H11 = IF (H12 x (E5 - J5) / 1000 x A11 x 30 x A5 + C5 x F5 < 2 x A5 x F5 / 24; 2 x A5 x F5 / 24;H12 x (E5 - J5) / 1000 x A11 x 30 x A5 + C5 x F5) + 0.2 x B11 x E11
The formula takes into account that sludge volume is less than half the total volume.
I11 = (E11 + G11) x C11 x B11
J11 = (D5 - I5) x A5 x 0.35 / 1000 / 0.7 x 0.5
350 l methane are produced from each kg COD removed.
H12 = 0.005 x IF (A11 < 36; 1 - A11 x 0.014; IF (A11 < 120; 0.5 - (A11 - 36) x 0.002; 1/3))
The formula relates to Picture 10_5.
10.2.4 Fully mixed digester
Within a fully mixed digester, or biogas plant, as it is commonly known in rural households in India, cattle dung is thoroughly mixed with water. Even as effluent, the substrate is very viscous; very little sludge settles and, as a result, no sludge must be removed for many years. The same type of rural biogas plant in China receives a substrate which is a mixture of human excreta, pig dung and water – however, less homogeneous by far than in India. Other wastewater, for example from slaughter-houses, may have different properties again. It is difficult, therefore, to calculate dimensions for the many different kinds of “strong” wastewater, for which biogas treatment might be suitable. The following spreadsheet should be used with certain reservations and – formulas may need to be adapted to local conditions.
242
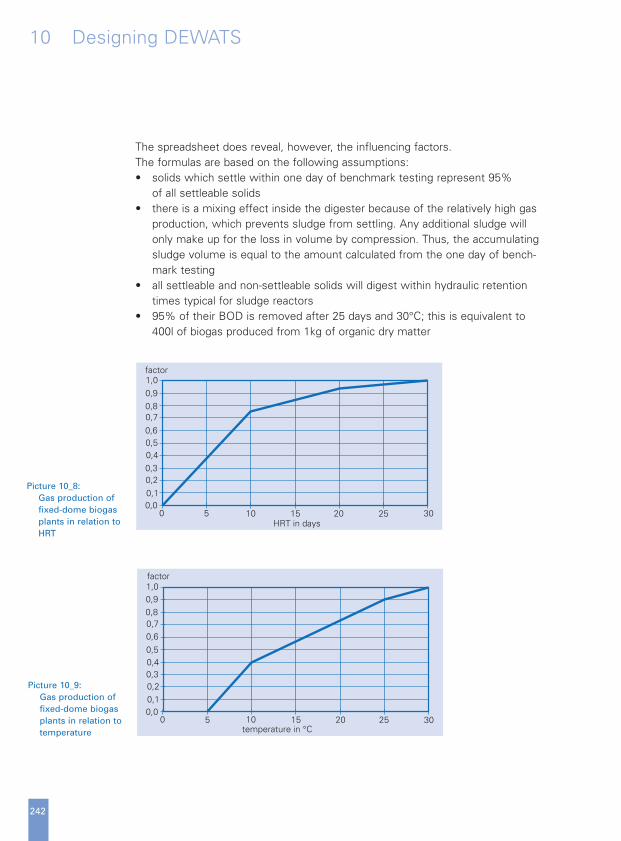
Picture 10_8: Gas production of
fixed-dome biogas plants in relation to HRT
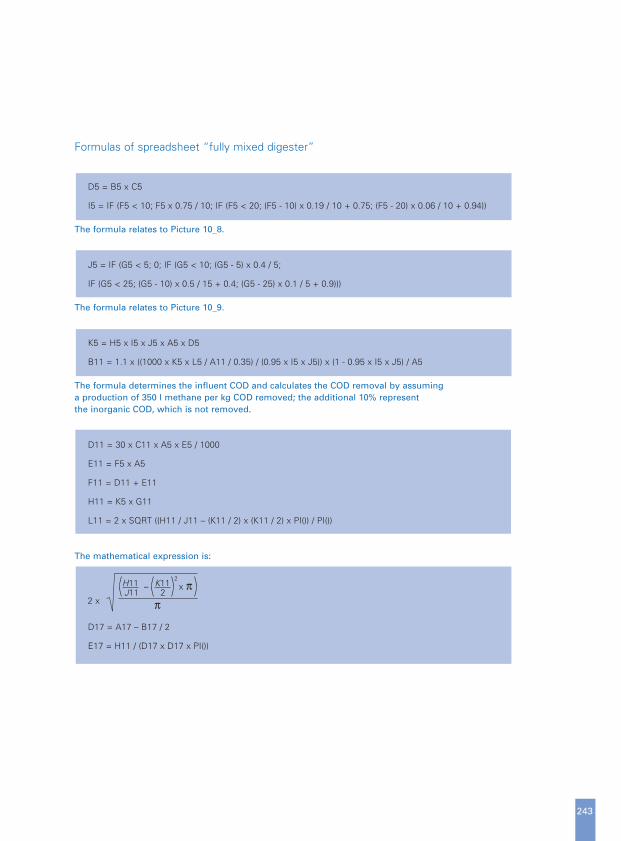
Picture 10_9: Gas production of
fixed-dome biogas plants in relation to temperature
factor
HRT in days
0,00,10,20,30,40,50,60,70,80,91,0
0 5 10 15 20 25 30
factor
temperature in °C
0,00,10,20,30,40,50,60,70,80,91,0
0 5 10 15 20 25 30
10 Designing DEWATS
The spreadsheet does reveal, however, the influencing factors. The formulas are based on the following assumptions:• solids which settle within one day of benchmark testing represent 95%
of all settleable solids• there is a mixing effect inside the digester because of the relatively high gas
production, which prevents sludge from settling. Any additional sludge will only make up for the loss in volume by compression. Thus, the accumulating sludge volume is equal to the amount calculated from the one day of bench-mark testing
• all settleable and non-settleable solids will digest within hydraulic retention times typical for sludge reactors
• 95% of their BOD is removed after 25 days and 30°C; this is equivalent to 400l of biogas produced from 1kg of organic dry matter
243
Formulas of spreadsheet “fully mixed digester”
D5 = B5 x C5
I5 = IF (F5 < 10; F5 x 0.75 / 10; IF (F5 < 20; (F5 - 10) x 0.19 / 10 + 0.75; (F5 - 20) x 0.06 / 10 + 0.94))
The formula relates to Picture 10_8.
J5 = IF (G5 < 5; 0; IF (G5 < 10; (G5 - 5) x 0.4 / 5;
IF (G5 < 25; (G5 - 10) x 0.5 / 15 + 0.4; (G5 - 25) x 0.1 / 5 + 0.9)))
The formula relates to Picture 10_9.
K5 = H5 x I5 x J5 x A5 x D5
B11 = 1.1 x ((1000 x K5 x L5 / A11 / 0.35) / (0.95 x I5 x J5)) x (1 - 0.95 x I5 x J5) / A5
The formula determines the influent COD and calculates the COD removal by assuming a production of 350 l methane per kg COD removed; the additional 10% represent the inorganic COD, which is not removed.
D11 = 30 x C11 x A5 x E5 / 1000
E11 = F5 x A5
F11 = D11 + E11
H11 = K5 x G11
L11 = 2 x SQRT ((H11 / J11 – (K11 / 2) x (K11 / 2) x PI()) / PI())
The mathematical expression is:
D17 = A17 – B17 / 2
E17 = H11 / (D17 x D17 x PI())
2 x
H11 K11J11 2
π–
2
x π
244
10 Designing DEWATS
The mathematical expression is:
H11 / (D17² × π)
F17 = (F11 – POWER (A7 – B17 – C17; 2) x PI() x E17) / (A17 x A17 x PI()) + E17
The mathematical expression is:
G17 = E17 + 0.15
H17 = F17 + 0.15
I17 = 3.14 x I11 x I11 x (K17 - I11 / 3)
J17 = 0.02 + POWER ((F11 + H11/2 + I17) / 4.19; 1/3)
The theoretical digester volume is taken as the volume below the zero line plus half thegas storage; 0.02m are added for plaster.
The mathematical expression is:
L17 = 4.19 x (K17 – 0.02) x (K17 – 0.02) x (K17 – 0.02) – I17 – H11 / 2
B23 = PI() x (I11 + A23) x (I11 + A23) x (K17 – (I11 + A23) / 3)
The volume above the lowest slurry level is found by trial and error; π is expressed as PI().
C23 = I17 + H11
D23 = A23 + J11
E23 = 3.14 x I11 x I11 x (G23 - I11/3)
F23 = 0.02 + POWER ((F11 + H11/2 + E23) / 2.09; 1/3)
0.02 + 3 ; 4.19 is 4/3π(F11 + H11/2 + I17)
4.19
F11 – + E17(A17 – B17 – C17)2 x π x E17
A17 x π
245
0,60
->
ball shaped digester
gasinlet outletinlet
0,90
0,25
1,80
VG
half round digester
1,340,25
0,74
2,25
gas 3 19 outlet
volume of expansion chamber isequal to volume of gas storage
bottom may be flat, conical or bowl shaped
ball->
plan of fixed dome digesters
4,503,60
1,20 3,19
floating drum digester
inlet
outlet1,07
1,50 1,38
0,92 0,25
3,28 3,13
half round
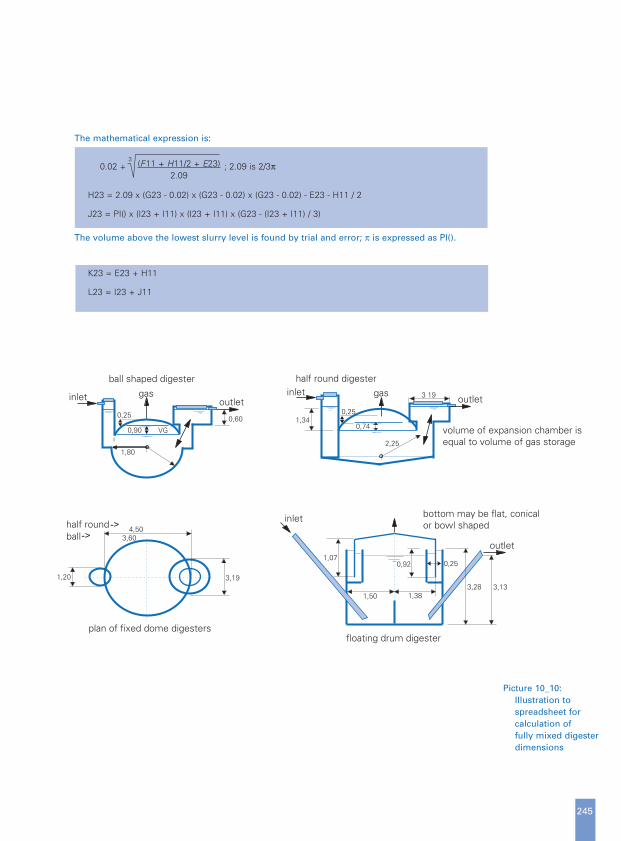
Picture 10_10: Illustration to
spreadsheet forcalculation offully mixed digester dimensions
The mathematical expression is:
H23 = 2.09 x (G23 - 0.02) x (G23 - 0.02) x (G23 - 0.02) - E23 - H11 / 2
J23 = PI() x (I23 + I11) x (I23 + I11) x (G23 - (I23 + I11) / 3)
The volume above the lowest slurry level is found by trial and error; π is expressed as PI().
K23 = E23 + H11
L23 = I23 + J11
0.02 + 3 ; 2.09 is 2/3π(F11 + H11/2 + E23)
2.09
246
10 Designing DEWATS
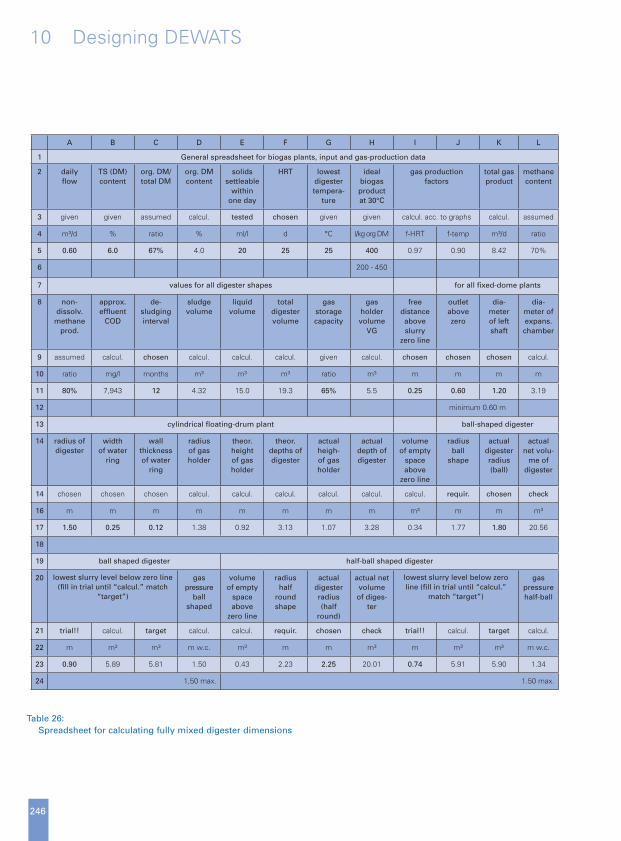
Table 26: Spreadsheet for calculating fully mixed digester dimensions
A B C D E F G H I J K L
1 General spreadsheet for biogas plants, input and gas-production data
2 daily fl ow
TS (DM) content
org. DM/total DM
org. DM content
solids settleable
within one day
HRT lowest digester tempera-
ture
ideal biogas product at 30°C
gas productionfactors
total gas product
methane content
3 given given assumed calcul. tested chosen given given calcul. acc. to graphs calcul. assumed
4 m³/d % ratio % ml/l d °C l/kg org DM f-HRT f-temp m³/d ratio
5 0.60 6.0 67% 4.0 20 25 25 400 0.97 0.90 8.42 70%
6 200 - 450
7 values for all digester shapes for all fi xed-dome plants
8 non-dissolv.
methane prod.
approx. effl uent
COD
de-sludging interval
sludge volume
liquid volume
total digester volume
gas storage capacity
gas holder volume
VG
free distance above slurry
zero line
outlet above zero
dia-meter of left shaft
dia-meter of expans. chamber
9 assumed calcul. chosen calcul. calcul. calcul. given calcul. chosen chosen chosen calcul.
10 ratio mg/l months m³ m³ m³ ratio m³ m m m m
11 80% 7,943 12 4.32 15.0 19.3 65% 5.5 0.25 0.60 1.20 3.19
12 minimum 0.60 m
13 cylindrical fl oating-drum plant ball-shaped digester
14 radius of digester
width of water
ring
wall thickness of water
ring
radius of gas holder
theor. height of gas holder
theor. depths of digester
actual heigh- of gas holder
actual depth of digester
volume of empty
space above
zero line
radius ball
shape
actual digester radius (ball)
actual net volu-
me of digester
14 chosen chosen chosen calcul. calcul. calcul. calcul. calcul. calcul. requir. chosen check
16 m m m m m m m m m³ m m m³
17 1.50 0.25 0.12 1.38 0.92 3.13 1.07 3.28 0.34 1.77 1.80 20.56
18
19 ball shaped digester half-ball shaped digester
20 lowest slurry level below zero line (fi ll in trial until “calcul.” match
“target”)
gas pressure
ball shaped
volume of empty
space above
zero line
radius half
round shape
actual digester radius (half
round)
actual net volume
of diges-ter
lowest slurry level below zero line (fi ll in trial until “calcul.”
match “target”)
gas pressure half-ball
21 trial!! calcul. target calcul. calcul. requir. chosen check trial!! calcul. target calcul.
22 m m³ m³ m w.c. m³ m m m³ m m³ m³ m w.c.
23 0.90 5.89 5.81 1.50 0.43 2.23 2.25 20.01 0.74 5.91 5.90 1.34
24 1,50 max. 1.50 max.
247
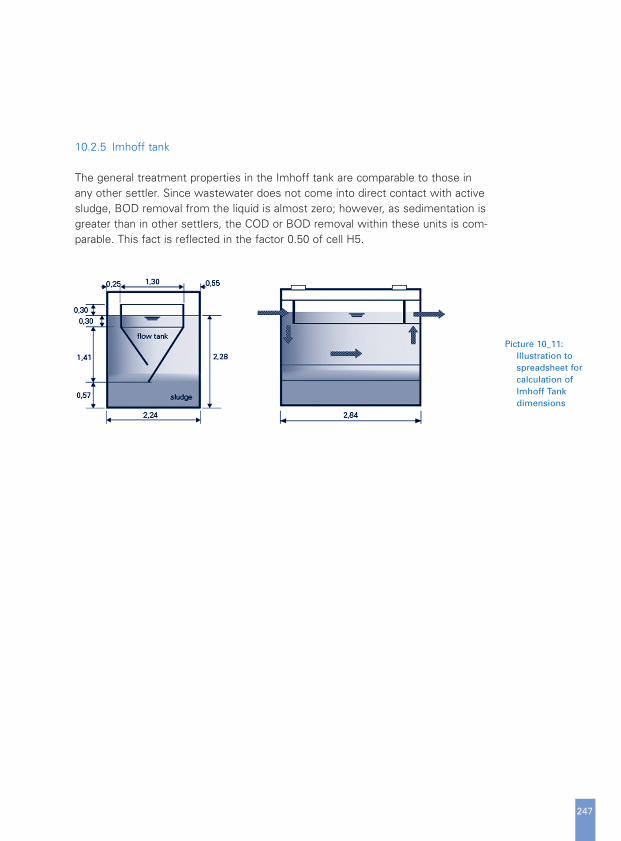
10.2.5 Imhoff tank
The general treatment properties in the Imhoff tank are comparable to those in any other settler. Since wastewater does not come into direct contact with active sludge, BOD removal from the liquid is almost zero; however, as sedimentation is greater than in other settlers, the COD or BOD removal within these units is com-parable. This fact is reflected in the factor 0.50 of cell H5.
Picture 10_11: Illustration to
spreadsheet forcalculation of Imhoff Tank dimensions
248
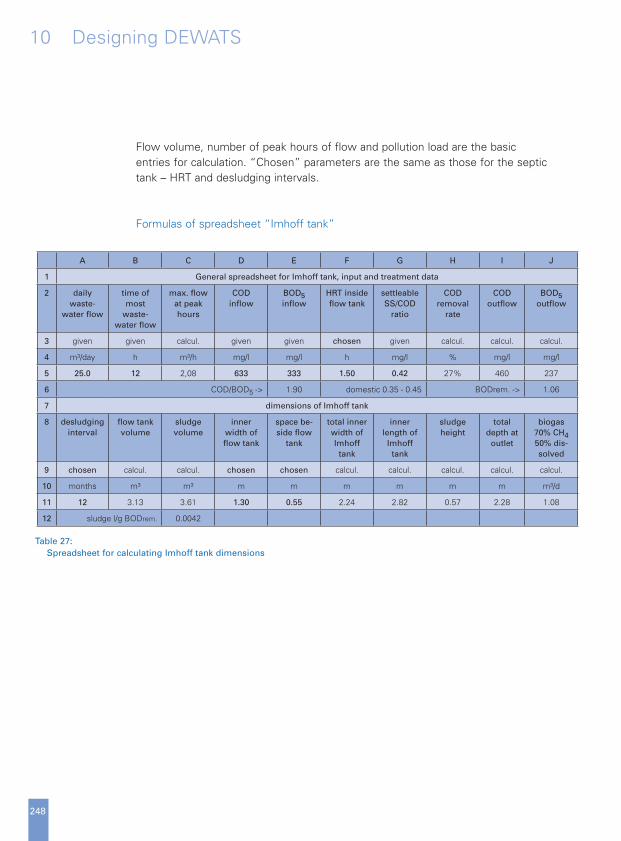
10 Designing DEWATS
Flow volume, number of peak hours of flow and pollution load are the basic entries for calculation. “Chosen” parameters are the same as those for the septic tank – HRT and desludging intervals.
Formulas of spreadsheet “Imhoff tank”
A B C D E F G H I J
1 General spreadsheet for Imhoff tank, input and treatment data
2 daily waste-
water fl ow
time of most
waste-water fl ow
max. fl ow at peak hours
COD infl ow
BOD5 infl ow
HRT inside fl ow tank
settleable SS/COD
ratio
COD removal
rate
COD outfl ow
BOD5 outfl ow
3 given given calcul. given given chosen given calcul. calcul. calcul.
4 m³/day h m³/h mg/l mg/l h mg/l % mg/l mg/l
5 25.0 12 2,08 633 333 1.50 0.42 27% 460 237
6 COD/BOD5 -> 1.90 domestic 0.35 - 0.45 BODrem. -> 1.06
7 dimensions of Imhoff tank
8 desludging interval
fl ow tank volume
sludge volume
inner width of fl ow tank
space be-side fl ow
tank
total inner width of Imhoff tank
inner length of Imhoff tank
sludge height
total depth at
outlet
biogas 70% CH450% dis-solved
9 chosen calcul. calcul. chosen chosen calcul. calcul. calcul. calcul. calcul.
10 months m³ m³ m m m m m m m³/d
11 12 3.13 3.61 1.30 0.55 2.24 2.82 0.57 2.28 1.08
12 sludge l/g BODrem. 0.0042
Table 27: Spreadsheet for calculating Imhoff tank dimensions
249
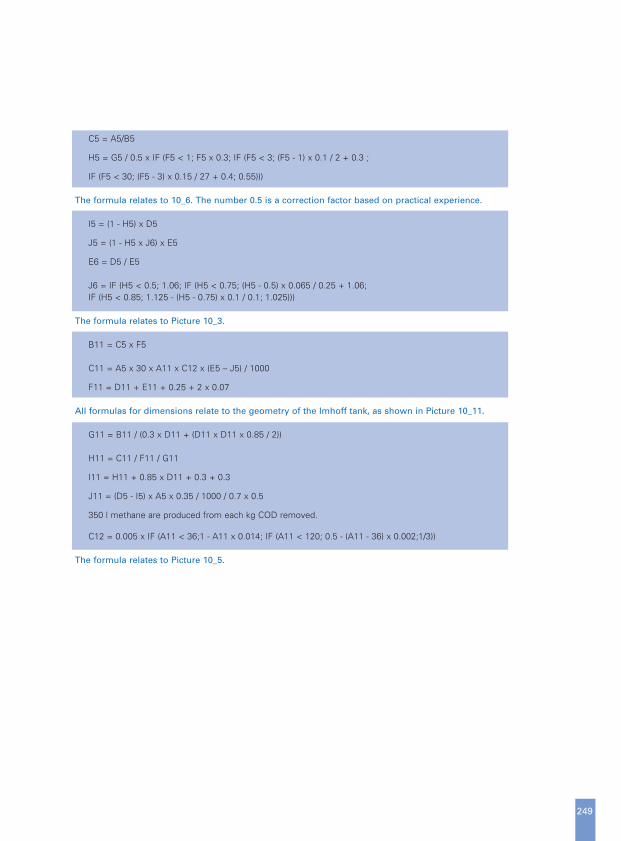
C5 = A5/B5
H5 = G5 / 0.5 x IF (F5 < 1; F5 x 0.3; IF (F5 < 3; (F5 - 1) x 0.1 / 2 + 0.3 ;
IF (F5 < 30; (F5 - 3) x 0.15 / 27 + 0.4; 0.55)))
The formula relates to 10_6. The number 0.5 is a correction factor based on practical experience.
I5 = (1 - H5) x D5
J5 = (1 - H5 x J6) x E5
E6 = D5 / E5
J6 = IF (H5 < 0.5; 1.06; IF (H5 < 0.75; (H5 - 0.5) x 0.065 / 0.25 + 1.06;IF (H5 < 0.85; 1.125 - (H5 - 0.75) x 0.1 / 0.1; 1.025)))
The formula relates to Picture 10_3.
B11 = C5 x F5
C11 = A5 x 30 x A11 x C12 x (E5 – J5) / 1000
F11 = D11 + E11 + 0.25 + 2 x 0.07
All formulas for dimensions relate to the geometry of the Imhoff tank, as shown in Picture 10_11.
G11 = B11 / (0.3 x D11 + (D11 x D11 x 0.85 / 2))
H11 = C11 / F11 / G11
I11 = H11 + 0.85 x D11 + 0.3 + 0.3
J11 = (D5 - I5) x A5 x 0.35 / 1000 / 0.7 x 0.5
350 l methane are produced from each kg COD removed.
C12 = 0.005 x IF (A11 < 36;1 - A11 x 0.014; IF (A11 < 120; 0.5 - (A11 - 36) x 0.002;1/3))
The formula relates to Picture 10_5.
250
10 Designing DEWATS
10.2.6 Anaerobic baffled reactor
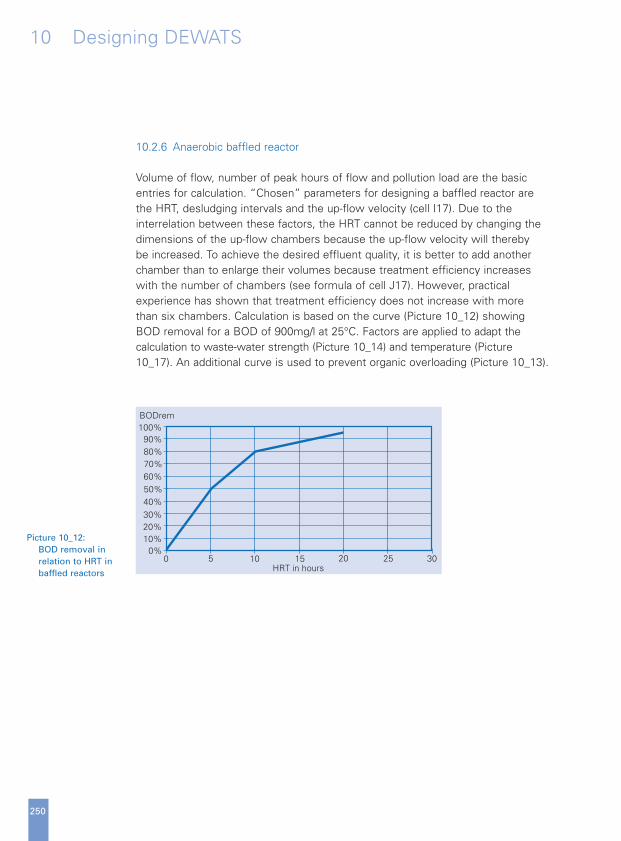
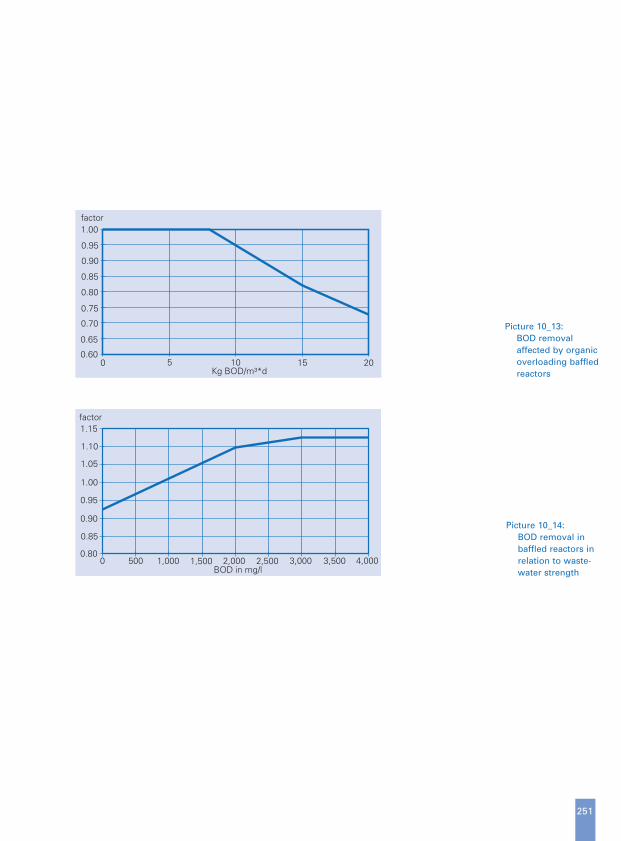
Volume of flow, number of peak hours of flow and pollution load are the basic entries for calculation. “Chosen” parameters for designing a baffled reactor are the HRT, desludging intervals and the up-flow velocity (cell I17). Due to the interrelation between these factors, the HRT cannot be reduced by changing the dimensions of the up-flow chambers because the up-flow velocity will thereby be increased. To achieve the desired effluent quality, it is better to add another chamber than to enlarge their volumes because treatment efficiency increases with the number of chambers (see formula of cell J17). However, practical experience has shown that treatment efficiency does not increase with more than six chambers. Calculation is based on the curve (Picture 10_12) showing BOD removal for a BOD of 900mg/l at 25°C. Factors are applied to adapt the calculation to waste-water strength (Picture 10_14) and temperature (Picture 10_17). An additional curve is used to prevent organic overloading (Picture 10_13).
Picture 10_12: BOD removal in
relation to HRT in baffled reactors
BODrem
HRT in hours
0%10%
0 5 10 15 20 25 30
20%30%40%50%60%70%80%90%
100%
251
0.60
0.65
0.70
0.75
0.80
0.85
0.90
0.95
1.00factor
0 5 10 15 20Kg BOD/m³*d
Picture 10_13: BOD removal
affected by organic overloading baffled reactors
0.80
0.85
0.90
0.95
1.00
1.05
1.10
1.15factor
0 500 1,000 1,500 2,000 2,500 3,000 3,500 4,000BOD in mg/l
Picture 10_14: BOD removal in
baffled reactors in relation to waste-water strength
252
10 Designing DEWATS
A B C D E F G H I J K
1 General spreadsheet for ABR with integrated settler
2 daily waste-
water fl ow
time of most
waste-water fl ow
max. peak fl ow per
hour
COD infl ow
BOD5 infl ow
COD/BOD ratio
settleable SS / COD
ratio
lowest digester tempera-
ture
de-sludging interval
HRT in settler
(no settler HRT=0)
COD removal rate in settler
3 avg. given max. given given calcul. given given chosen chosen calcul.
4 m³/day h m³/h mg/l mg/l ratio mg/l °C months h %
5 25 12 2.08 633 333 1.90 0.42 25 18 1.50 23%
6 COD/BOD5 -> 0.35–0.45 1.5 h
7 treatment data
8 BOD5 removal rate in settler
infl ow into baffl ed reactor
COD/ BOD5
ratio after settler
factors to calculate COD removal rate of anaerobic fi lter
COD rem. 25°, COD
1500
theor. rem. rate acc. to
factors
CODrem. rate
baffl e only
COD out
9 calcul. COD BOD5 calcul. calculated according to graphs calcul. calcul. calcul.
10 % mg/l mg/l mg/l f-overload f-strenght f-temp f-HRT % % % mg/l
11 24% 489 253 1.94 1.00 0.91 1.00 87 79% 81% 94
12 1.06 <- COD/ BOD removal factor COD/BOD removal factor -> 1.025
13 dimensions of settler ABR
14 total COD removal
rate
total BOD5removal
rate
BOD5out
inner masonry measurements chosen acc. to required volume
sludgeaccum.
rate
length of settler
length of settler
max. upfl ow velocity
number of upfl ow chambers
depth at outlet
15 calcul. calcul. calcul. width depth calcul. calcul. chosen chosen chosen chosen
16 % % mg/l m m l/g COD m m m/h No. m
17 85% 87% 42 2.00 1.50 0.0037 2.39 2.40 1.8 5 1.50
18 1.4–2.0m/h
19 dimensions of ABR status and gp
20 length of chambers should not exceed half
depth
area of single upfl ow
chamber
width of chambers actual upfl ow velocity
width of downfl ow
shaft
actual volume
of baffl ed reactor
actual total HRT
org. load(BOD5)
biogas (ass: CH470%; 50%
dissolved)
21 calcul. chosen calcul. calcul. chosen calcul. chosen calcul. calcul. calcul. calcul.
22 m m m² m m m/h m m³ h kg/m³*d m³*/d
23 0.75 0.75 1.16 1.54 2.00 1.39 0.25 15.00 14 1.63 3.37
24 HRT reduced by 5% for sludge
TIP: If removal rate is insuffi cient; increase number of upfl ow chambers to keep upfl ow velocity low.
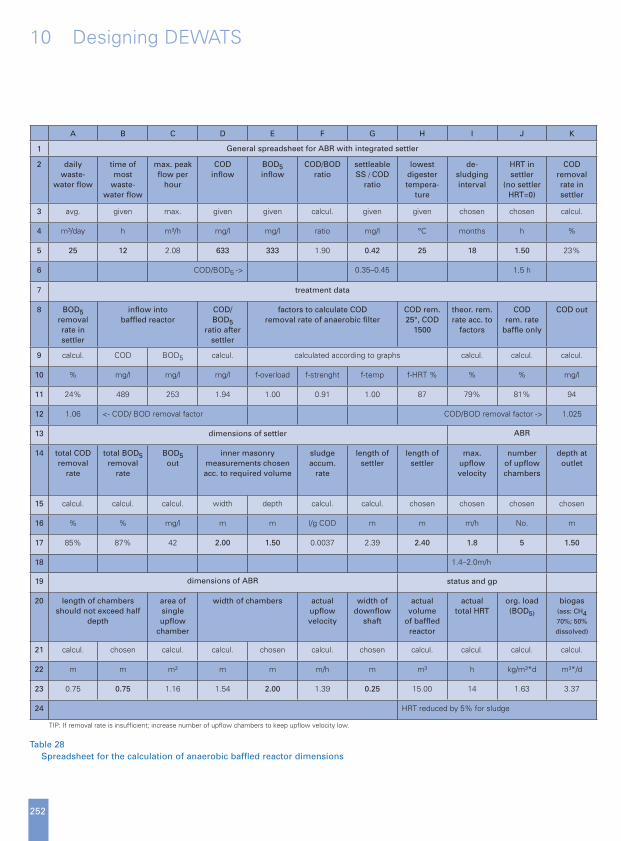
Table 28 Spreadsheet for the calculation of anaerobic baffled reactor dimensions
253
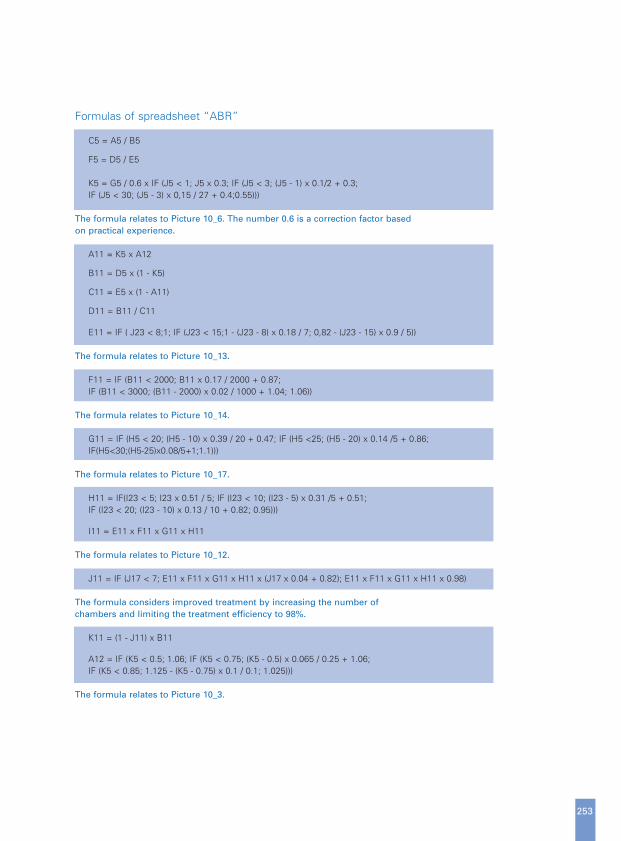
Formulas of spreadsheet “ABR”
C5 = A5 / B5
F5 = D5 / E5
K5 = G5 / 0.6 x IF (J5 < 1; J5 x 0.3; IF (J5 < 3; (J5 - 1) x 0.1/2 + 0.3;IF (J5 < 30; (J5 - 3) x 0,15 / 27 + 0.4;0.55)))
The formula relates to Picture 10_6. The number 0.6 is a correction factor basedon practical experience.
A11 = K5 x A12
B11 = D5 x (1 - K5)
C11 = E5 x (1 - A11)
D11 = B11 / C11
E11 = IF ( J23 < 8;1; IF (J23 < 15;1 - (J23 - 8) x 0.18 / 7; 0,82 - (J23 - 15) x 0.9 / 5))
The formula relates to Picture 10_13.
F11 = IF (B11 < 2000; B11 x 0.17 / 2000 + 0.87;IF (B11 < 3000; (B11 - 2000) x 0.02 / 1000 + 1.04; 1.06))
The formula relates to Picture 10_14.
G11 = IF (H5 < 20; (H5 - 10) x 0.39 / 20 + 0.47; IF (H5 <25; (H5 - 20) x 0.14 /5 + 0.86;IF(H5<30;(H5-25)x0.08/5+1;1.1)))
The formula relates to Picture 10_17.
H11 = IF(I23 < 5; I23 x 0.51 / 5; IF (I23 < 10; (I23 - 5) x 0.31 /5 + 0.51;IF (I23 < 20; (I23 - 10) x 0.13 / 10 + 0.82; 0.95)))
I11 = E11 x F11 x G11 x H11
The formula relates to Picture 10_12.
J11 = IF (J17 < 7; E11 x F11 x G11 x H11 x (J17 x 0.04 + 0.82); E11 x F11 x G11 x H11 x 0.98)
The formula considers improved treatment by increasing the number ofchambers and limiting the treatment efficiency to 98%.
K11 = (1 - J11) x B11
A12 = IF (K5 < 0.5; 1.06; IF (K5 < 0.75; (K5 - 0.5) x 0.065 / 0.25 + 1.06;IF (K5 < 0.85; 1.125 - (K5 - 0.75) x 0.1 / 0.1; 1.025)))
The formula relates to Picture 10_3.
254
10 Designing DEWATS
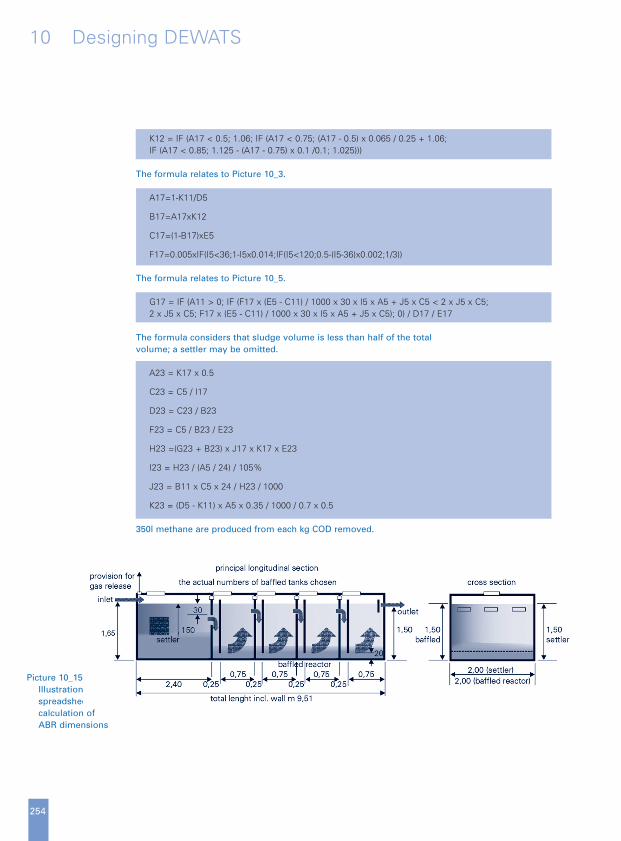
K12 = IF (A17 < 0.5; 1.06; IF (A17 < 0.75; (A17 - 0.5) x 0.065 / 0.25 + 1.06;IF (A17 < 0.85; 1.125 - (A17 - 0.75) x 0.1 /0.1; 1.025)))
The formula relates to Picture 10_3.
A17=1-K11/D5
B17=A17xK12
C17=(1-B17)xE5
F17=0.005xIF(I5<36;1-I5x0.014;IF(I5<120;0.5-(I5-36)x0.002;1/3))
The formula relates to Picture 10_5.
G17 = IF (A11 > 0; IF (F17 x (E5 - C11) / 1000 x 30 x I5 x A5 + J5 x C5 < 2 x J5 x C5;2 x J5 x C5; F17 x (E5 - C11) / 1000 x 30 x I5 x A5 + J5 x C5); 0) / D17 / E17
The formula considers that sludge volume is less than half of the totalvolume; a settler may be omitted.
A23 = K17 x 0.5
C23 = C5 / I17
D23 = C23 / B23
F23 = C5 / B23 / E23
H23 =(G23 + B23) x J17 x K17 x E23
I23 = H23 / (A5 / 24) / 105%
J23 = B11 x C5 x 24 / H23 / 1000
K23 = (D5 - K11) x A5 x 0.35 / 1000 / 0.7 x 0.5
350l methane are produced from each kg COD removed.
Picture 10_15: Illustration to
spreadsheet forcalculation of ABR dimensions
255
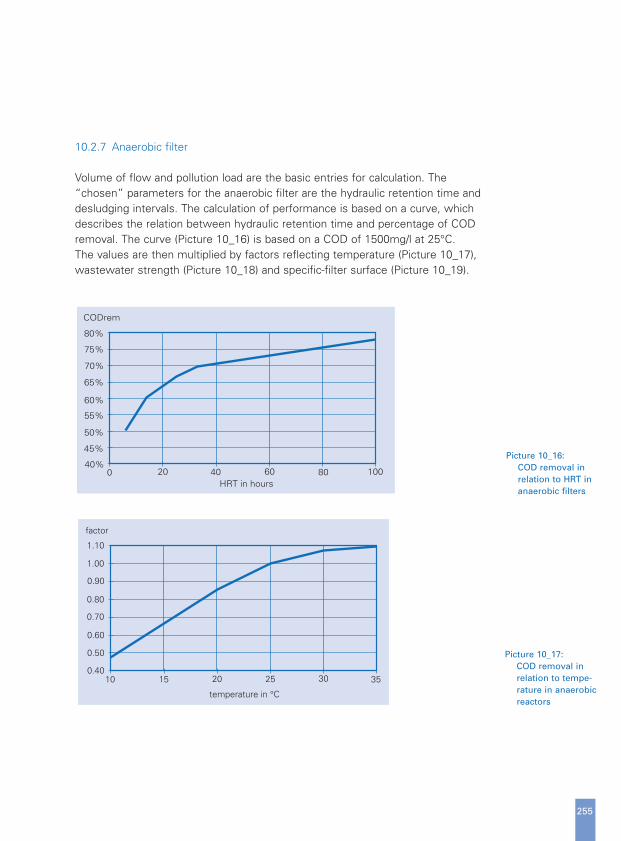
10.2.7 Anaerobic filter
Volume of flow and pollution load are the basic entries for calculation. The“chosen” parameters for the anaerobic filter are the hydraulic retention time and desludging intervals. The calculation of performance is based on a curve, which describes the relation between hydraulic retention time and percentage of COD removal. The curve (Picture 10_16) is based on a COD of 1500mg/l at 25°C. The values are then multiplied by factors reflecting temperature (Picture 10_17), wastewater strength (Picture 10_18) and specific-filter surface (Picture 10_19).
60 80 10040%
45%
50%
55%
60%
65%
70%
75%
80%
0 20 40HRT in hours
CODrem
Picture 10_16: COD removal in
relation to HRT in anaerobic filters
Picture 10_17: COD removal in
relation to tempe-rature in anaerobic reactors
factor
10 15 20 25 30 35
temperature in °C
0.40
0.50
0.60
0.70
0.80
0.90
1.00
1.10
256
10 Designing DEWATS
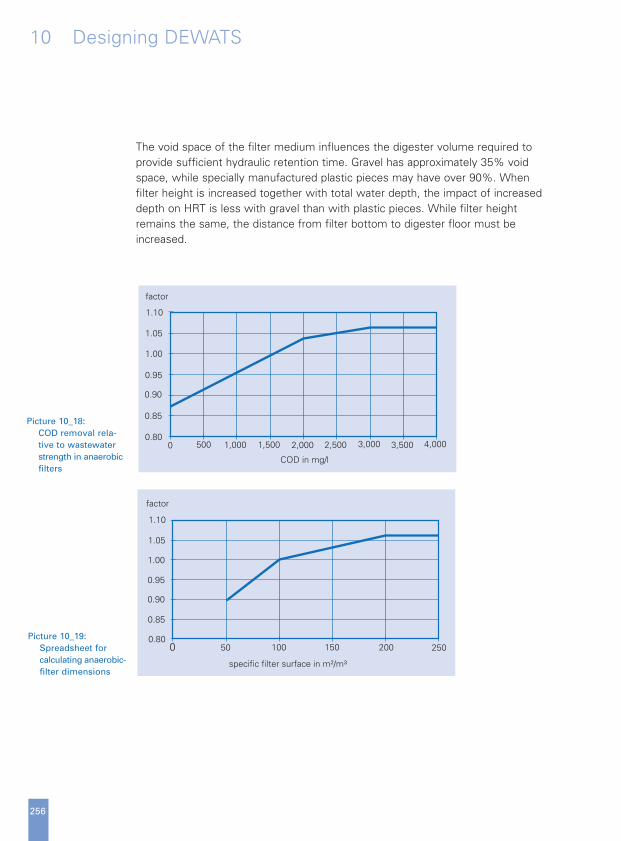
The void space of the filter medium influences the digester volume required to provide sufficient hydraulic retention time. Gravel has approximately 35% void space, while specially manufactured plastic pieces may have over 90%. Whenfilter height is increased together with total water depth, the impact of increased depth on HRT is less with gravel than with plastic pieces. While filter height remains the same, the distance from filter bottom to digester floor must be increased.
0 500 1,000 1,500 2,000 2,500 3,000 3,500 4,0000.80
0.85
0.90
0.95
1.00
1.05
1.10
factor
COD in mg/l
0.80
0.85
0.90
0.95
1.00
1.05
1.10
factor
0 50 100 150 200 250
specific filter surface in m²/m³
Picture 10_18: COD removal rela-
tive to wastewater strength in anaerobic filters
Picture 10_19: Spreadsheet for
calculating anaerobic-filter dimensions
257
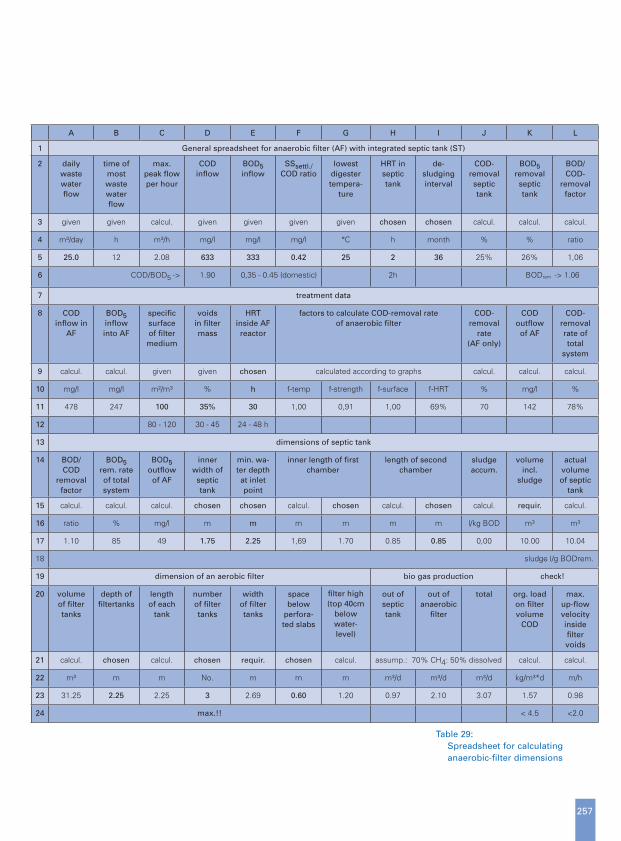
Table 29: Spreadsheet for calculating
anaerobic-filter dimensions
A B C D E F G H I J K L
1 General spreadsheet for anaerobic fi lter (AF) with integrated septic tank (ST)
2 daily waste water fl ow
time of most waste water fl ow
max. peak fl ow per hour
COD infl ow
BOD5 infl ow
SSsettl./COD ratio
lowest digester tempera-
ture
HRT in septic tank
de-sludging interval
COD-removal septic tank
BOD5 removal septic tank
BOD/ COD-
removal factor
3 given given calcul. given given given given chosen chosen calcul. calcul. calcul.
4 m³/day h m³/h mg/l mg/l mg/l °C h month % % ratio
5 25.0 12 2.08 633 333 0.42 25 2 36 25% 26% 1,06
6 COD/BOD5 -> 1.90 0,35 - 0.45 (domestic) 2h BODrem -> 1.06
7 treatment data
8 COD infl ow in
AF
BOD5infl ow into AF
specifi c surface of fi lter medium
voids in fi lter mass
HRT inside AF reactor
factors to calculate COD-removal rate of anaerobic fi lter
COD-removal
rate (AF only)
COD outfl ow of AF
COD-removal rate of total
system
9 calcul. calcul. given given chosen calculated according to graphs calcul. calcul. calcul.
10 mg/l mg/l m²/m³ % h f-temp f-strength f-surface f-HRT % mg/l %
11 478 247 100 35% 30 1,00 0,91 1,00 69% 70 142 78%
12 80 - 120 30 - 45 24 - 48 h
13 dimensions of septic tank
14 BOD/COD
removal factor
BOD5rem. rate of total system
BOD5outfl ow of AF
inner width of septic tank
min. wa-ter depth at inlet point
inner length of fi rst chamber
length of second chamber
sludge accum.
volume incl.
sludge
actual volume of septic
tank
15 calcul. calcul. calcul. chosen chosen calcul. chosen calcul. chosen calcul. requir. calcul.
16 ratio % mg/l m m m m m m l/kg BOD m³ m³
17 1.10 85 49 1.75 2.25 1,69 1.70 0.85 0.85 0,00 10.00 10.04
18 sludge l/g BODrem.
19 dimension of an aerobic fi lter bio gas production check!
20 volume of fi lter tanks
depth of fi ltertanks
length of each
tank
number of fi lter tanks
width of fi lter tanks
space below
perfora-ted slabs
fi lter high (top 40cm
below water-level)
out of septic tank
out of anaerobic
fi lter
total org. load on fi lter volume
COD
max. up-fl ow velocity inside fi lter voids
21 calcul. chosen calcul. chosen requir. chosen calcul. assump.: 70% CH4: 50% dissolved calcul. calcul.
22 m³ m m No. m m m m³/d m³/d m³/d kg/m³*d m/h
23 31.25 2.25 2.25 3 2.69 0.60 1.20 0.97 2.10 3.07 1.57 0.98
24 max.!! < 4.5 <2.0
258
10 Designing DEWATS
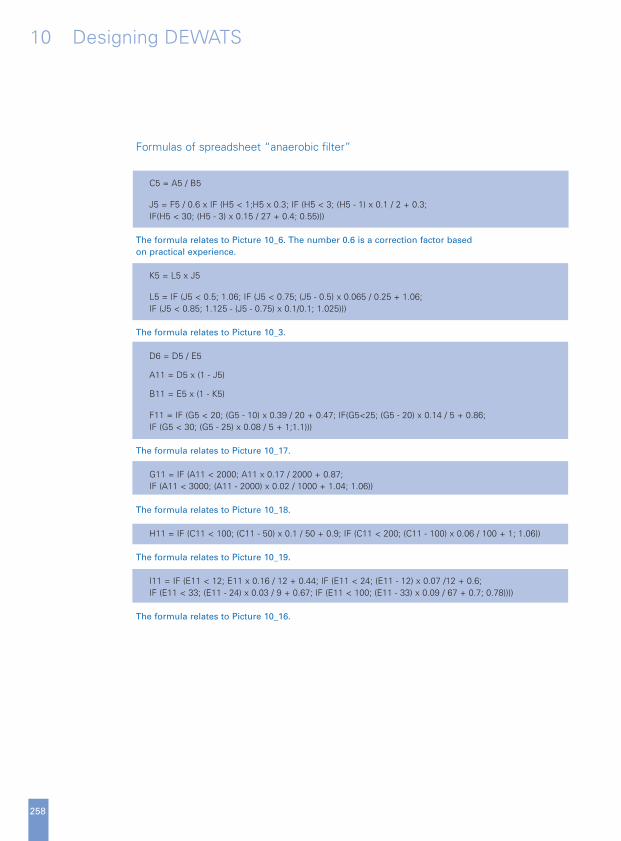
Formulas of spreadsheet “anaerobic filter”
C5 = A5 / B5
J5 = F5 / 0.6 x IF (H5 < 1;H5 x 0.3; IF (H5 < 3; (H5 - 1) x 0.1 / 2 + 0.3;IF(H5 < 30; (H5 - 3) x 0.15 / 27 + 0.4; 0.55)))
The formula relates to Picture 10_6. The number 0.6 is a correction factor basedon practical experience.
K5 = L5 x J5
L5 = IF (J5 < 0.5; 1.06; IF (J5 < 0.75; (J5 - 0.5) x 0.065 / 0.25 + 1.06;IF (J5 < 0.85; 1.125 - (J5 - 0.75) x 0.1/0.1; 1.025)))
The formula relates to Picture 10_3.
D6 = D5 / E5
A11 = D5 x (1 - J5)
B11 = E5 x (1 - K5)
F11 = IF (G5 < 20; (G5 - 10) x 0.39 / 20 + 0.47; IF(G5<25; (G5 - 20) x 0.14 / 5 + 0.86;IF (G5 < 30; (G5 - 25) x 0.08 / 5 + 1;1.1)))
The formula relates to Picture 10_17.
G11 = IF (A11 < 2000; A11 x 0.17 / 2000 + 0.87;IF (A11 < 3000; (A11 - 2000) x 0.02 / 1000 + 1.04; 1.06))
The formula relates to Picture 10_18.
H11 = IF (C11 < 100; (C11 - 50) x 0.1 / 50 + 0.9; IF (C11 < 200; (C11 - 100) x 0.06 / 100 + 1; 1.06))
The formula relates to Picture 10_19.
I11 = IF (E11 < 12; E11 x 0.16 / 12 + 0.44; IF (E11 < 24; (E11 - 12) x 0.07 /12 + 0.6;IF (E11 < 33; (E11 - 24) x 0.03 / 9 + 0.67; IF (E11 < 100; (E11 - 33) x 0.09 / 67 + 0.7; 0.78))))
The formula relates to Picture 10_16.
259
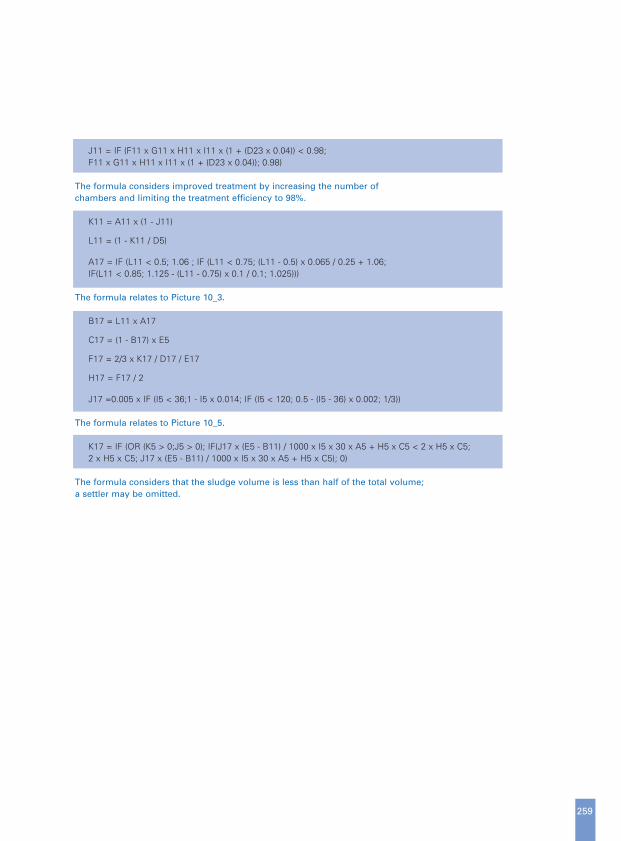
J11 = IF (F11 x G11 x H11 x I11 x (1 + (D23 x 0.04)) < 0.98;F11 x G11 x H11 x I11 x (1 + (D23 x 0.04)); 0.98)
The formula considers improved treatment by increasing the number of chambers and limiting the treatment efficiency to 98%.
K11 = A11 x (1 - J11)
L11 = (1 - K11 / D5)
A17 = IF (L11 < 0.5; 1.06 ; IF (L11 < 0.75; (L11 - 0.5) x 0.065 / 0.25 + 1.06;IF(L11 < 0.85; 1.125 - (L11 - 0.75) x 0.1 / 0.1; 1.025)))
The formula relates to Picture 10_3.
B17 = L11 x A17
C17 = (1 - B17) x E5
F17 = 2/3 x K17 / D17 / E17
H17 = F17 / 2
J17 =0.005 x IF (I5 < 36;1 - I5 x 0.014; IF (I5 < 120; 0.5 - (I5 - 36) x 0.002; 1/3))
The formula relates to Picture 10_5.
K17 = IF (OR (K5 > 0;J5 > 0); IF(J17 x (E5 - B11) / 1000 x I5 x 30 x A5 + H5 x C5 < 2 x H5 x C5;2 x H5 x C5; J17 x (E5 - B11) / 1000 x I5 x 30 x A5 + H5 x C5); 0)
The formula considers that the sludge volume is less than half of the total volume;a settler may be omitted.
260
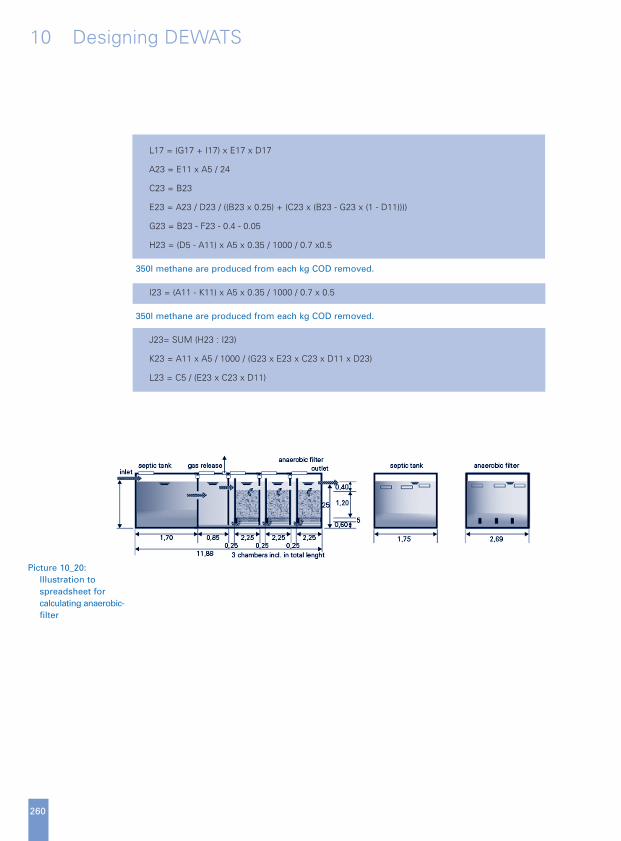
Picture 10_20: Illustration to
spreadsheet forcalculating anaerobic- filter
10 Designing DEWATS
L17 = (G17 + I17) x E17 x D17
A23 = E11 x A5 / 24
C23 = B23
E23 = A23 / D23 / ((B23 x 0.25) + (C23 x (B23 - G23 x (1 - D11))))
G23 = B23 - F23 - 0.4 - 0.05
H23 = (D5 - A11) x A5 x 0.35 / 1000 / 0.7 x0.5
350l methane are produced from each kg COD removed.
I23 = (A11 - K11) x A5 x 0.35 / 1000 / 0.7 x 0.5
350l methane are produced from each kg COD removed.
J23= SUM (H23 : I23)
K23 = A11 x A5 / 1000 / (G23 x E23 x C23 x D11 x D23)
L23 = C5 / (E23 x C23 x D11)
261
10.2.8 Horizontal gravel filter
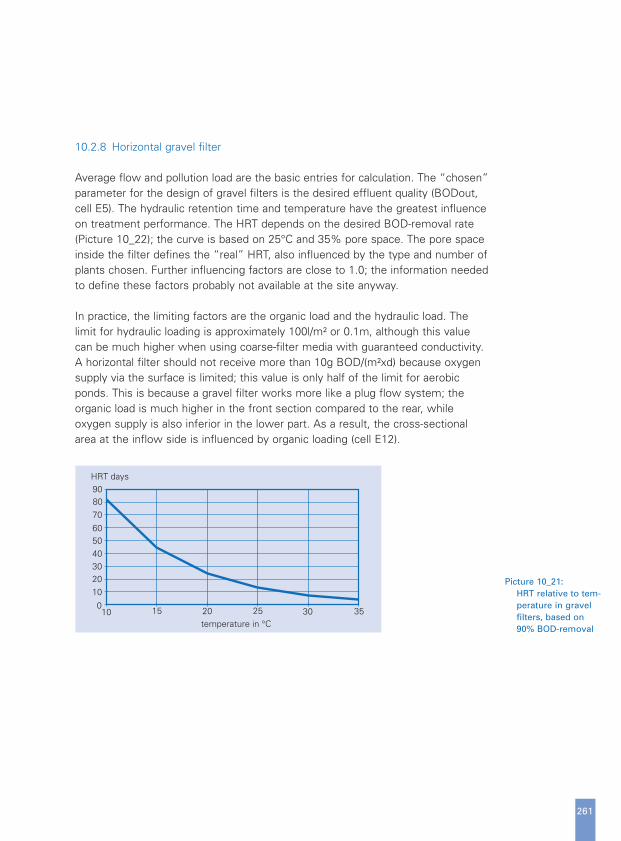
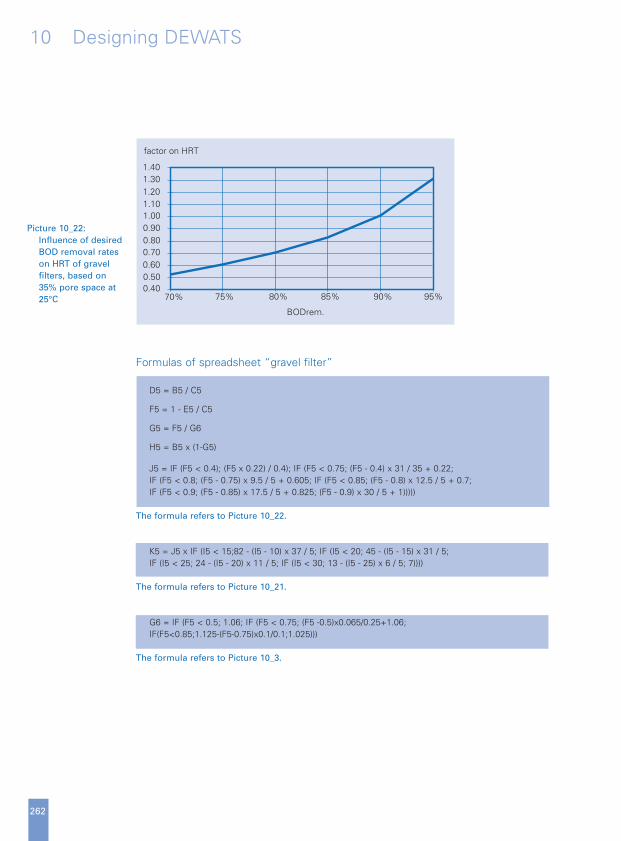
Average flow and pollution load are the basic entries for calculation. The “chosen” parameter for the design of gravel filters is the desired effluent quality (BODout, cell E5). The hydraulic retention time and temperature have the greatest influence on treatment performance. The HRT depends on the desired BOD-removal rate (Picture 10_22); the curve is based on 25°C and 35% pore space. The pore space inside the filter defines the “real” HRT, also influenced by the type and number of plants chosen. Further influencing factors are close to 1.0; the information needed to define these factors probably not available at the site anyway.
In practice, the limiting factors are the organic load and the hydraulic load. The limit for hydraulic loading is approximately 100l/m² or 0.1m, although this value can be much higher when using coarse-filter media with guaranteed conductivity. A horizontal filter should not receive more than 10g BOD/(m²xd) because oxygen supply via the surface is limited; this value is only half of the limit for aerobic ponds. This is because a gravel filter works more like a plug flow system; the organic load is much higher in the front section compared to the rear, while oxygen supply is also inferior in the lower part. As a result, the cross-sectional area at the inflow side is influenced by organic loading (cell E12).
Picture 10_21: HRT relative to tem-
perature in gravel filters, based on 90% BOD-removal
0
102030405060708090HRT days
10 15 20 25 30 35temperature in °C
262
10 Designing DEWATS
Formulas of spreadsheet “gravel filter”
D5 = B5 / C5
F5 = 1 - E5 / C5
G5 = F5 / G6
H5 = B5 x (1-G5)
J5 = IF (F5 < 0.4); (F5 x 0.22) / 0.4); IF (F5 < 0.75; (F5 - 0.4) x 31 / 35 + 0.22;IF (F5 < 0.8; (F5 - 0.75) x 9.5 / 5 + 0.605; IF (F5 < 0.85; (F5 - 0.8) x 12.5 / 5 + 0.7;IF (F5 < 0.9; (F5 - 0.85) x 17.5 / 5 + 0.825; (F5 - 0.9) x 30 / 5 + 1)))))
The formula refers to Picture 10_22.
K5 = J5 x IF (I5 < 15;82 - (I5 - 10) x 37 / 5; IF (I5 < 20; 45 - (I5 - 15) x 31 / 5;IF (I5 < 25; 24 - (I5 - 20) x 11 / 5; IF (I5 < 30; 13 - (I5 - 25) x 6 / 5; 7))))
The formula refers to Picture 10_21.
G6 = IF (F5 < 0.5; 1.06; IF (F5 < 0.75; (F5 -0.5)x0.065/0.25+1.06;IF(F5<0.85;1.125-(F5-0.75)x0.1/0.1;1.025)))
The formula refers to Picture 10_3.
Picture 10_22: Influence of desired
BOD removal rates on HRT of gravelfilters, based on 35% pore space at 25°C
factor on HRT
BODrem.
0.400.500.600.700.800.901.001.101.201.301.40
70% 75% 80% 85% 90% 95%
263
L6 = L5 / 86400
A11 = K5 x 35%
D11 = IF (A5 / L5 / B11 < A5 x C5 / E12; A5 x C5 / E12; A5 / L5 / B11)
The formula compares hydraulic load to maximum organic load in cell E12.
E11 = D11 / C11
F11 = IF (A5 x C5 /L12 > A5 x K5 / C11; A5 x C5 /L12; A5 x K5 / C11)
The formula compares permitted hydraulic load with organic load in cell L12.
G11 = F11 / E11
J11 = H11 x I11
K11 = A5 / J11
L11 = K11 x C5
H12 = E11
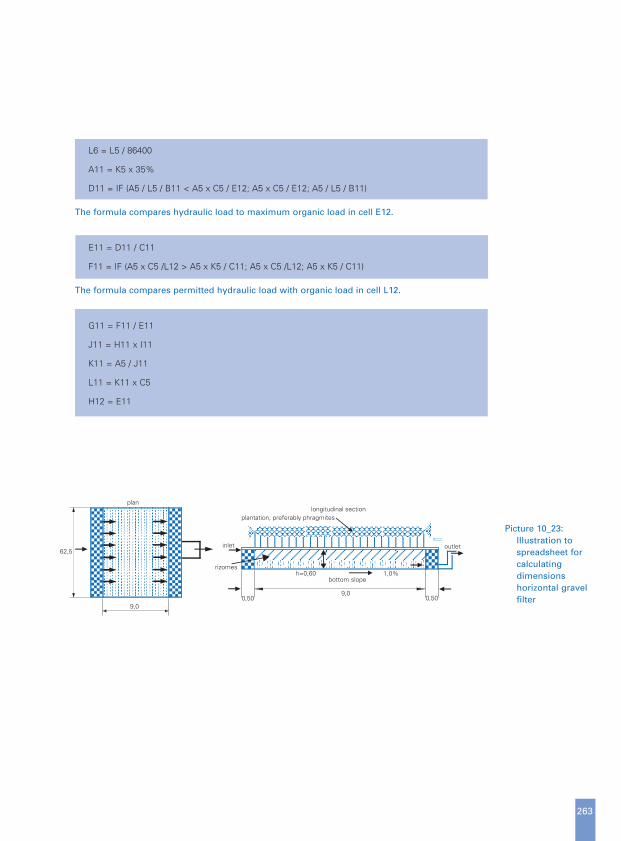
Picture 10_23: Illustration to
spreadsheet forcalculatingdimensionshorizontal gravel filter
62,5
plan
9,0
longitudinal sectionplantation, preferably phragmites
inlet
rizomesh=0,60
bottom slope
9,0
1,0%
outlet
0,50 0,50
264
10 Designing DEWATS
10.2.9 Anaerobic pond
Anaerobic ponds should be built for sedimentation purposes only, as highly loaded ponds with very short retention times and heavy scum formation on the surface – or as relatively low-loaded ponds which are almost odourless because of neutral pH values. The spreadsheet may be used for all three categories. The hydraulic retention time is, therefore, the “chosen” parameter. Ponds with long retention times (low organic loading rates) may be divided into several ponds in series. For ponds with short retention times, the front section can be separated to support development of scum. The choice of HRT strongly influences the organic load of the effluent. Ambient temperature is important and an excessively high temperature should not be chosen for want of smaller ponds. It is assumed that temperature has no influence on COD removal at short retention times of less than 30 hours.
A B C D E F G H I J K L
1 General spreadsheet for planted gravel fi lter, input and treatment data
2 average fl ow
COD in BOD5 in COD/BOD ratio
outfl ow BOD5
BOD5 removal
rate
COD removal
COD out min. annualTemp.
HRT factor acc. to k20=0.3
HRT hydraulic conduct.
Ks
3 given given given calcul. wanted calcul. calcul. calcul. given calcul. via graph
calcul. given
4 m³/d mg/l mg/l mg/l mg/l % % mg/l °C days m/d
5 26 410 215 1.91 30 86% 84 66 25 0.86 11.20 200
6 COD/ BOD rem. factor via graph -> 1.025 Ks in m/s -> 2.31E - 0.3
7 dimensions results
8 HRT in35% pore space
bottom slope
depth of fi lter at
inlet
cross section
area
width of fi lter basin
surface area
required
length of fi lter basin
chosen width
lenght chosen
actual surface
area chosen
hydr. load on chosen surface
org. load on chosen surface
9 calcul. chosen chosen calcul. calcul. calcul. calcul. chosen chosen check! calcul. calcul.
10 days % m m² m m² m m m m² m/d g/m² BOD
11 3.92 1.0% 0.60 37.27 62.1 559 9.0 62.5 9.0 563 0.046 9.9
^ information only 0.3 - 0.6 m max. BOD5 150 g/m² always -> 62.1 max. loads => 0.100 10
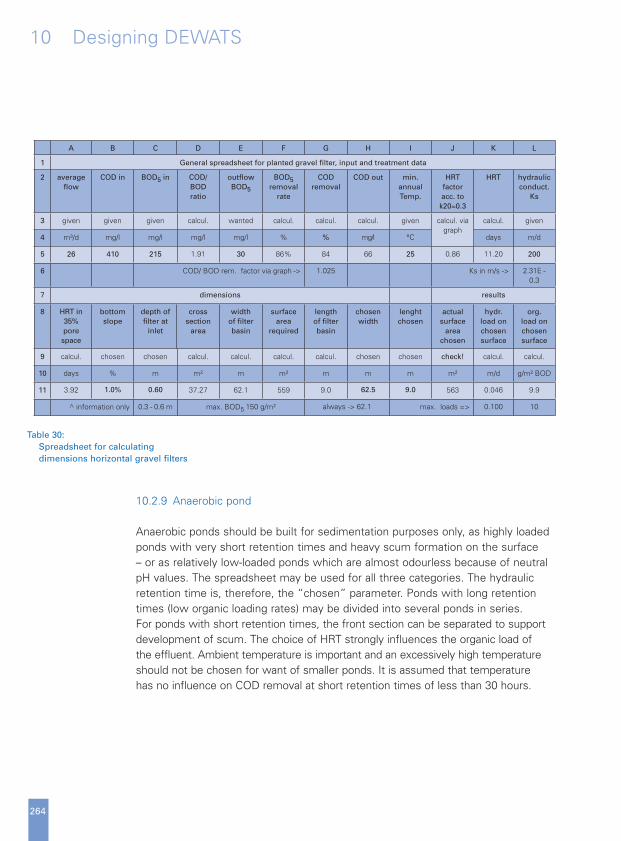
Table 30: Spreadsheet for calculating
dimensions horizontal gravel filters
265
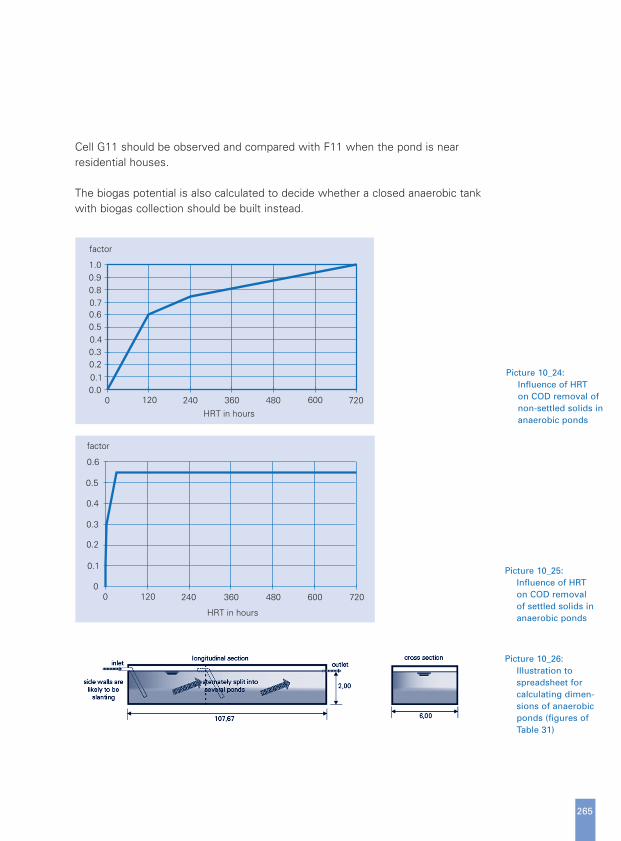
Cell G11 should be observed and compared with F11 when the pond is near residential houses.
The biogas potential is also calculated to decide whether a closed anaerobic tank with biogas collection should be built instead.
Picture 10_24: Influence of HRT
on COD removal of non-settled solids in anaerobic ponds
0.00.10.20.30.40.50.60.70.80.9
factor
1.0
0 120 240 360 480 600 720HRT in hours
0
0.1
0.2
0.3
0.4
0.5
0.6
0 120 240 360 480 600 720
HRT in hours
factor
Picture 10_25: Influence of HRT
on COD removal of settled solids in anaerobic ponds
Picture 10_26: Illustration to
spreadsheet for calculating dimen-sions of anaerobic ponds (figures of Table 31)
266
10 Designing DEWATS
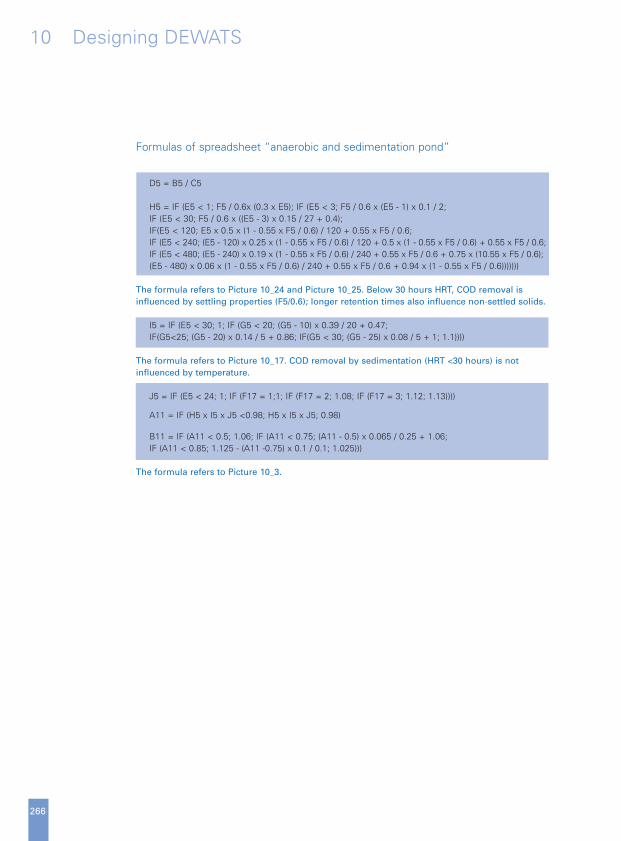
Formulas of spreadsheet “anaerobic and sedimentation pond”
D5 = B5 / C5
H5 = IF (E5 < 1; F5 / 0.6x (0.3 x E5); IF (E5 < 3; F5 / 0.6 x (E5 - 1) x 0.1 / 2; IF (E5 < 30; F5 / 0.6 x ((E5 - 3) x 0.15 / 27 + 0.4);IF(E5 < 120; E5 x 0.5 x (1 - 0.55 x F5 / 0.6) / 120 + 0.55 x F5 / 0.6;IF (E5 < 240; (E5 - 120) x 0.25 x (1 - 0.55 x F5 / 0.6) / 120 + 0.5 x (1 - 0.55 x F5 / 0.6) + 0.55 x F5 / 0.6;IF (E5 < 480; (E5 - 240) x 0.19 x (1 - 0.55 x F5 / 0.6) / 240 + 0.55 x F5 / 0.6 + 0.75 x (10.55 x F5 / 0.6);(E5 - 480) x 0.06 x (1 - 0.55 x F5 / 0.6) / 240 + 0.55 x F5 / 0.6 + 0.94 x (1 - 0.55 x F5 / 0.6)))))))
The formula refers to Picture 10_24 and Picture 10_25. Below 30 hours HRT, COD removal isinfluenced by settling properties (F5/0.6); longer retention times also influence non-settled solids.
I5 = IF (E5 < 30; 1; IF (G5 < 20; (G5 - 10) x 0.39 / 20 + 0.47; IF(G5<25; (G5 - 20) x 0.14 / 5 + 0.86; IF(G5 < 30; (G5 - 25) x 0.08 / 5 + 1; 1.1))))
The formula refers to Picture 10_17. COD removal by sedimentation (HRT <30 hours) is notinfluenced by temperature.
J5 = IF (E5 < 24; 1; IF (F17 = 1;1; IF (F17 = 2; 1.08; IF (F17 = 3; 1.12; 1.13))))
A11 = IF (H5 x I5 x J5 <0.98; H5 x I5 x J5; 0.98)
B11 = IF (A11 < 0.5; 1.06; IF (A11 < 0.75; (A11 - 0.5) x 0.065 / 0.25 + 1.06;IF (A11 < 0.85; 1.125 - (A11 -0.75) x 0.1 / 0.1; 1.025)))
The formula refers to Picture 10_3.
267
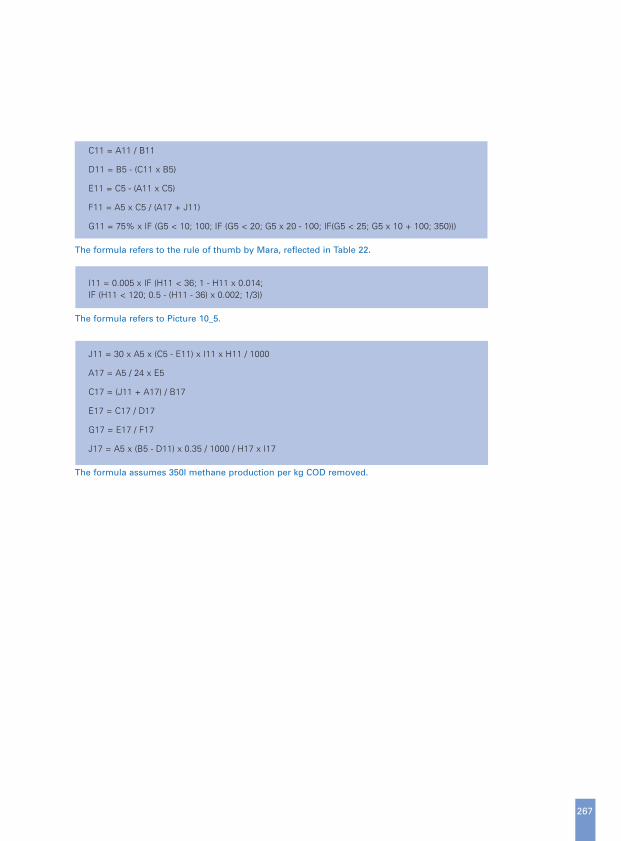
C11 = A11 / B11
D11 = B5 - (C11 x B5)
E11 = C5 - (A11 x C5)
F11 = A5 x C5 / (A17 + J11)
G11 = 75% x IF (G5 < 10; 100; IF (G5 < 20; G5 x 20 - 100; IF(G5 < 25; G5 x 10 + 100; 350)))
The formula refers to the rule of thumb by Mara, reflected in Table 22.
I11 = 0.005 x IF (H11 < 36; 1 - H11 x 0.014;IF (H11 < 120; 0.5 - (H11 - 36) x 0.002; 1/3))
The formula refers to Picture 10_5.
J11 = 30 x A5 x (C5 - E11) x I11 x H11 / 1000
A17 = A5 / 24 x E5
C17 = (J11 + A17) / B17
E17 = C17 / D17
G17 = E17 / F17
J17 = A5 x (B5 - D11) x 0.35 / 1000 / H17 x I17
The formula assumes 350l methane production per kg COD removed.
268
10 Designing DEWATS
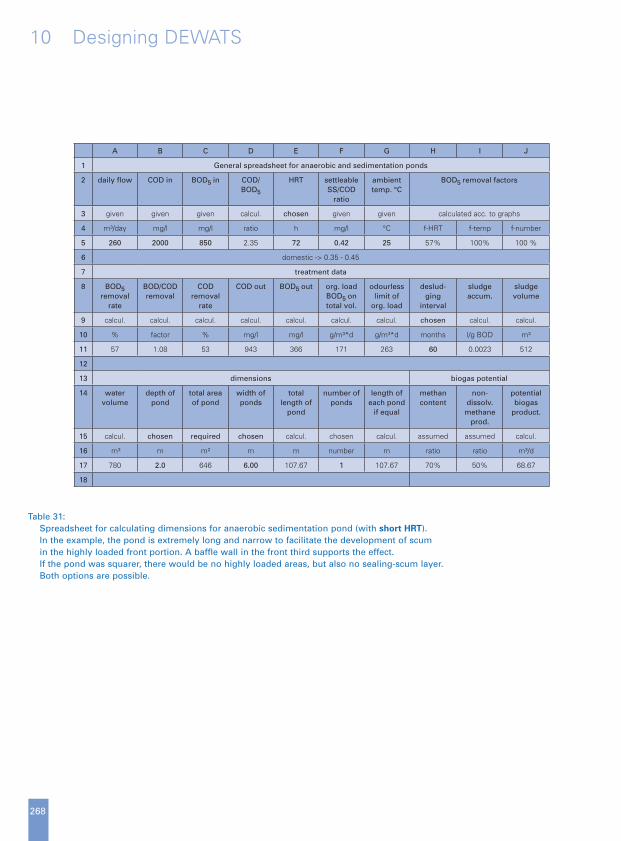
A B C D E F G H I J
1 General spreadsheet for anaerobic and sedimentation ponds
2 daily fl ow COD in BOD5 in COD/ BOD5
HRT settleable SS/COD
ratio
ambient temp. °C
BOD5 removal factors
3 given given given calcul. chosen given given calculated acc. to graphs
4 m³/day mg/l mg/l ratio h mg/l °C f-HRT f-temp f-number
5 260 2000 850 2.35 72 0.42 25 57% 100% 100 %
6 domestic -> 0.35 - 0.45
7 treatment data
8 BOD5 removal
rate
BOD/COD removal
COD removal
rate
COD out BOD5 out org. load BOD5 on total vol.
odourless limit of
org. load
deslud-ging
interval
sludge accum.
sludge volume
9 calcul. calcul. calcul. calcul. calcul. calcul. calcul. chosen calcul. calcul.
10 % factor % mg/l mg/l g/m³*d g/m³*d months l/g BOD m³
11 57 1.08 53 943 366 171 263 60 0.0023 512
12
13 dimensions biogas potential
14 water volume
depth of pond
total area of pond
width of ponds
total length of
pond
number of ponds
length of each pond
if equal
methan content
non-dissolv.
methane prod.
potential biogas
product.
15 calcul. chosen required chosen calcul. chosen calcul. assumed assumed calcul.
16 m³ m m² m m number m ratio ratio m³/d
17 780 2.0 646 6.00 107.67 1 107.67 70% 50% 68.67
18
Table 31: Spreadsheet for calculating dimensions for anaerobic sedimentation pond (with short HRT).
In the example, the pond is extremely long and narrow to facilitate the development of scum in the highly loaded front portion. A baffle wall in the front third supports the effect. If the pond was squarer, there would be no highly loaded areas, but also no sealing-scum layer.Both options are possible.
269
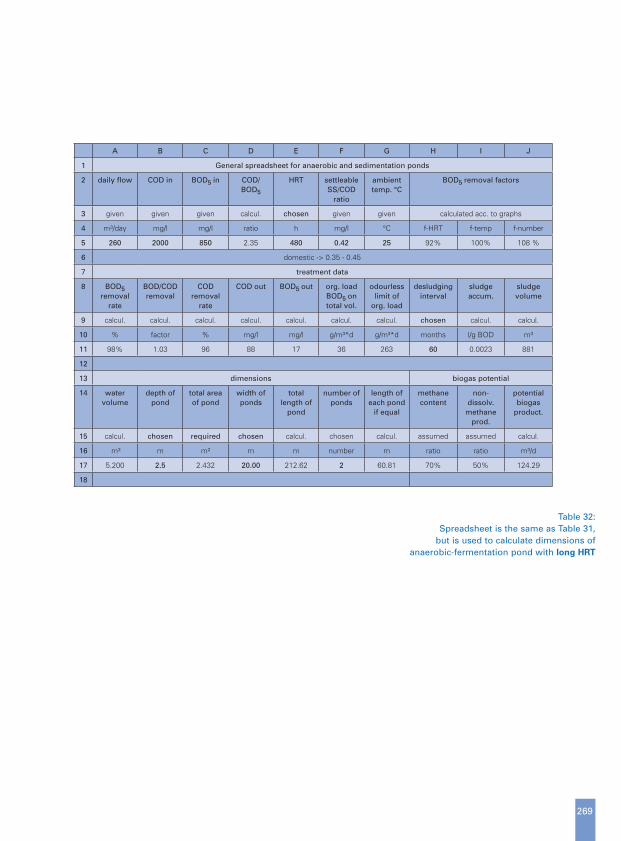
A B C D E F G H I J
1 General spreadsheet for anaerobic and sedimentation ponds
2 daily fl ow COD in BOD5 in COD/ BOD5
HRT settleable SS/COD
ratio
ambient temp. °C
BOD5 removal factors
3 given given given calcul. chosen given given calculated acc. to graphs
4 m³/day mg/l mg/l ratio h mg/l °C f-HRT f-temp f-number
5 260 2000 850 2.35 480 0.42 25 92% 100% 108 %
6 domestic -> 0.35 - 0.45
7 treatment data
8 BOD5 removal
rate
BOD/COD removal
COD removal
rate
COD out BOD5 out org. load BOD5 on total vol.
odourless limit of
org. load
desludging interval
sludge accum.
sludge volume
9 calcul. calcul. calcul. calcul. calcul. calcul. calcul. chosen calcul. calcul.
10 % factor % mg/l mg/l g/m³*d g/m³*d months l/g BOD m³
11 98% 1.03 96 88 17 36 263 60 0.0023 881
12
13 dimensions biogas potential
14 water volume
depth of pond
total area of pond
width of ponds
total length of
pond
number of ponds
length of each pond
if equal
methane content
non-dissolv.
methane prod.
potential biogas
product.
15 calcul. chosen required chosen calcul. chosen calcul. assumed assumed calcul.
16 m³ m m² m m number m ratio ratio m³/d
17 5.200 2.5 2.432 20.00 212.62 2 60.81 70% 50% 124.29
18
Table 32: Spreadsheet is the same as Table 31,
but is used to calculate dimensions ofanaerobic-fermentation pond with long HRT
270
10 Designing DEWATS
10.2.10 Aerobic pond
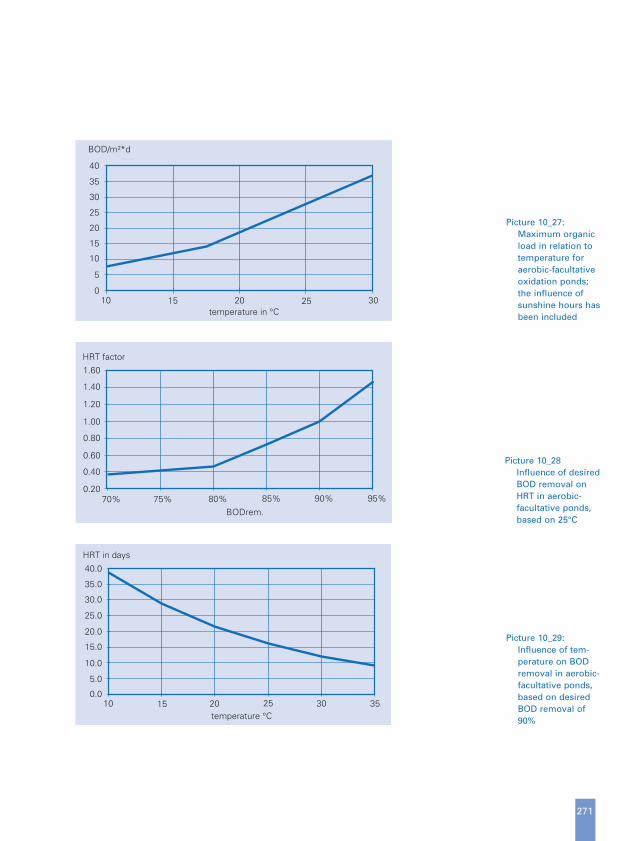
Volume of flow and pollution load are the basic entries for calculation. Key “chosen” parameter is the desired effluent quality (BODout, cell F5). The HRTrequired to achieve a certain BOD-removal rate depends on the temperature.The curve (Picture 10_29) shows this relationship for a 90% BOD-removal rate.
Picture 10_28 shows how HRT changes with altering treatment performance, defined as BOD-removal rate at 25°C.
Sludge production may be high in aerobic ponds, due to dead algae sinking to the bottom. According to Suwarnarat 1.44g TS can be expected from 1g BOD5. Assuming a 20% total-solids content in compressed bottom sludge and a 50% reduction of volume due to anaerobic stabilisation, almost 4mm of bottom sludge per gram BOD5/m²×d organic load would accumulate during one year. At loading rates of 15g BOD5/m²×d, approximately 6cm of sludge is expected per year. Since the surface area plays the major role for dimensioning, the sludge volume has been neglected in the calculation.
271
Picture 10_27: Maximum organic
load in relation to temperature for aerobic-facultative oxidation ponds; the influence of sunshine hours has been included
10 15 20 25 30temperature in °C
BOD/m²*d
0
5
10
15
20
25
30
35
40
Picture 10_28 Influence of desired
BOD removal on HRT in aerobic-facultative ponds, based on 25°C
HRT factor
0.20
0.40
0.60
0.80
1.00
1.20
1.40
1.60
BODrem.70% 75% 80% 85% 90% 95%
temperature °C10 15 20 25 30 35
0.0
5.0
10.0
15.0
20.0
25.0
30.0
35.0
40.0
HRT in days
Picture 10_29: Influence of tem-
perature on BOD removal in aerobic-facultative ponds, based on desired BOD removal of 90%
272
10 Designing DEWATS
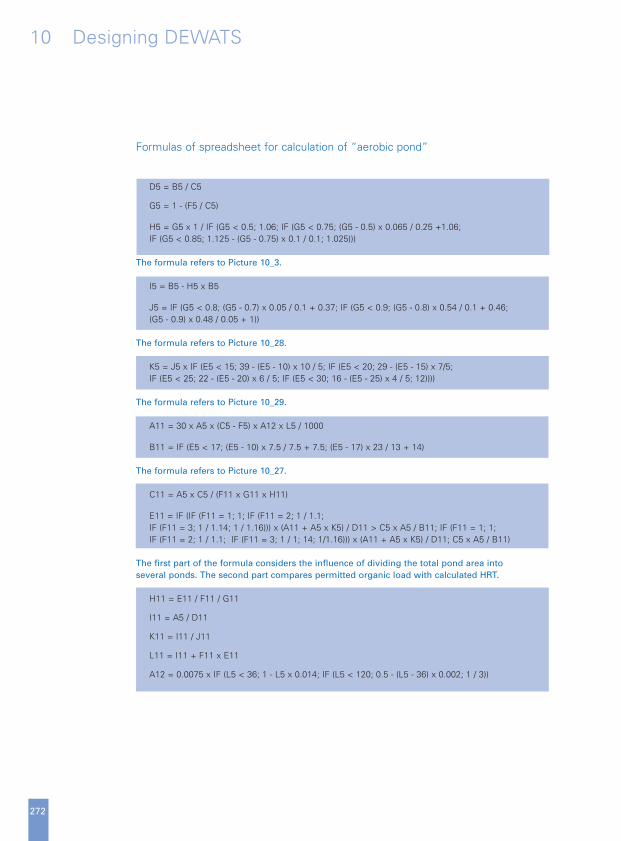
Formulas of spreadsheet for calculation of “aerobic pond”
D5 = B5 / C5
G5 = 1 - (F5 / C5)
H5 = G5 x 1 / IF (G5 < 0.5; 1.06; IF (G5 < 0.75; (G5 - 0.5) x 0.065 / 0.25 +1.06;IF (G5 < 0.85; 1.125 - (G5 - 0.75) x 0.1 / 0.1; 1.025)))
The formula refers to Picture 10_3.
I5 = B5 - H5 x B5
J5 = IF (G5 < 0.8; (G5 - 0.7) x 0.05 / 0.1 + 0.37; IF (G5 < 0.9; (G5 - 0.8) x 0.54 / 0.1 + 0.46;(G5 - 0.9) x 0.48 / 0.05 + 1))
The formula refers to Picture 10_28.
K5 = J5 x IF (E5 < 15; 39 - (E5 - 10) x 10 / 5; IF (E5 < 20; 29 - (E5 - 15) x 7/5;IF (E5 < 25; 22 - (E5 - 20) x 6 / 5; IF (E5 < 30; 16 - (E5 - 25) x 4 / 5; 12))))
The formula refers to Picture 10_29.
A11 = 30 x A5 x (C5 - F5) x A12 x L5 / 1000
B11 = IF (E5 < 17; (E5 - 10) x 7.5 / 7.5 + 7.5; (E5 - 17) x 23 / 13 + 14)
The formula refers to Picture 10_27.
C11 = A5 x C5 / (F11 x G11 x H11)
E11 = IF (IF (F11 = 1; 1; IF (F11 = 2; 1 / 1.1;IF (F11 = 3; 1 / 1.14; 1 / 1.16))) x (A11 + A5 x K5) / D11 > C5 x A5 / B11; IF (F11 = 1; 1;IF (F11 = 2; 1 / 1.1; IF (F11 = 3; 1 / 1; 14; 1/1.16))) x (A11 + A5 x K5) / D11; C5 x A5 / B11)
The first part of the formula considers the influence of dividing the total pond area into several ponds. The second part compares permitted organic load with calculated HRT.
H11 = E11 / F11 / G11
I11 = A5 / D11
K11 = I11 / J11
L11 = I11 + F11 x E11
A12 = 0.0075 x IF (L5 < 36; 1 - L5 x 0.014; IF (L5 < 120; 0.5 - (L5 - 36) x 0.002; 1 / 3))
273
A B C D E F G H I J K L
1 General spreadsheet on aerobic-facultative ponds, input and treatment data
2 daily fl ow
COD in BOD5 in COD/BOD5
min.water temp.
BOD5 out (wanted)
BOD removal
COD removal
COD out BOD5 removal factor for
HRT
HRT de-sludging interval
3 given given calcul. calcul. given chosen calcul. calcul. calcul. calcul. calcul. chosen
4 m³/d mg/l mg/l mg/l °C mg/l % % mg/l % days months
5 20 500 170 2.94 20 30 82 78 108 0.59 12.9 12
6 0.05 - 1.0
7 dimensions of aerobic-facultative ponds polishing pond 1 day HRT total
8 accum. sludge volume
permit org. load
BOD5
actual org. load (BOD5)
depth of ponds
total pond area
number of main ponds
width of ponds
length of each ponds
area of polish pond
width of polish pond
length of polish
pond
area of all ponds
9 calcul. calcul. calcul. chosen calcul. chosen chosen calcul. calcul. chosen calcul. calcul.
10 m³ g/m²*d g/m²*d m m² No m m m² m m m²
11 6.3 19.3 13.2 0.9 258 3 9.00 9.55 22 5.00 4.44 796
12 0.00624 l/g BOD 0.9 - 1.2 m
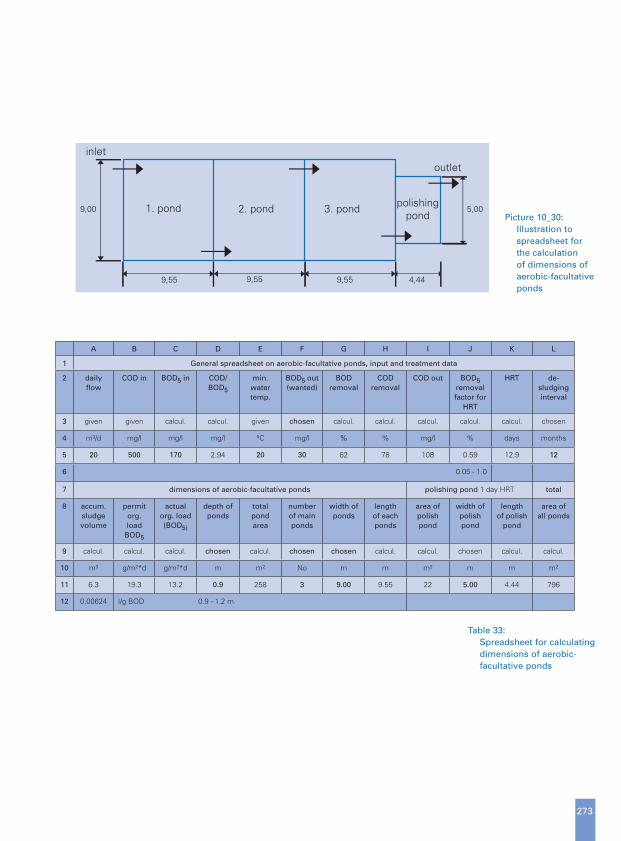
Picture 10_30: Illustration to
spreadsheet for the calculation of dimensions of aerobic-facultative ponds
inletoutlet
1. pond 2. pond 3. pond polishingpond
9,00 5,00
9,55 9,55 9,55 4,44
Table 33: Spreadsheet for calculating
dimensions of aerobic-facultative ponds
274
10 Designing DEWATS
10.3 Spreadsheets for costings
General background
This chapter helps the reader to produce his or her own tool for calculating annual DEWATS costs. Since economic calculations always incorporate the unknown future, they are never exact. However, it would be reckless to invest in DEWATS without prior economic evaluation. The spreadsheet helps one to calculate annual expenditure, including capital costs, operational costs and maintenance. Expected income from biogas or the sale of sludge for fertiliser may be deducted. To use the spreadsheet, the following data must be collected:• planning costs, including transport to site and laboratory costs for initial
wastewater analysis• investment costs of buildings, site work and equipment• assumed maintenance and operating costs• rate of interest (minus inflation rate)• wastewater data to calculate possible benefits – and to compare cost per
amount of treated wastewater
275
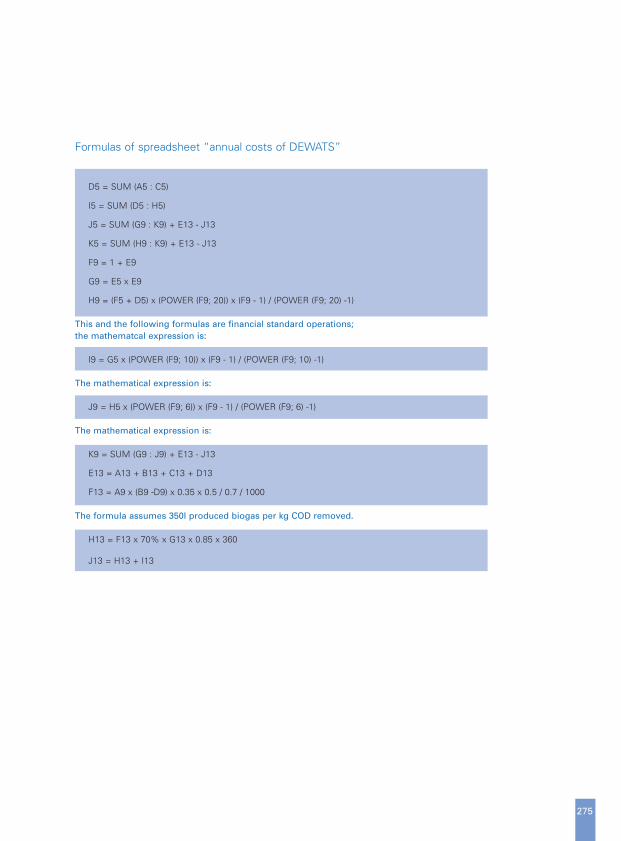
Formulas of spreadsheet “annual costs of DEWATS”
D5 = SUM (A5 : C5)
I5 = SUM (D5 : H5)
J5 = SUM (G9 : K9) + E13 - J13
K5 = SUM (H9 : K9) + E13 - J13
F9 = 1 + E9
G9 = E5 x E9
H9 = (F5 + D5) x (POWER (F9; 20)) x (F9 - 1) / (POWER (F9; 20) -1)
This and the following formulas are financial standard operations; the mathematcal expression is:
I9 = G5 x (POWER (F9; 10)) x (F9 - 1) / (POWER (F9; 10) -1)
The mathematical expression is:
J9 = H5 x (POWER (F9; 6)) x (F9 - 1) / (POWER (F9; 6) -1)
The mathematical expression is:
K9 = SUM (G9 : J9) + E13 - J13
E13 = A13 + B13 + C13 + D13
F13 = A9 x (B9 -D9) x 0.35 x 0.5 / 0.7 / 1000
The formula assumes 350l produced biogas per kg COD removed.
H13 = F13 x 70% x G13 x 0.85 x 360
J13 = H13 + I13
276
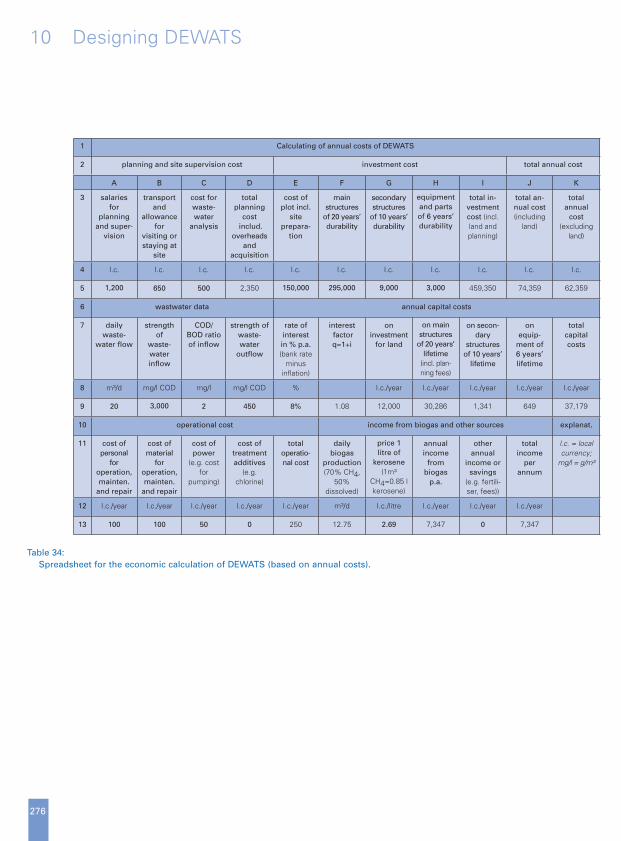
10 Designing DEWATS
1 Calculating of annual costs of DEWATS
2 planning and site supervision cost investment cost total annual cost
A B C D E F G H I J K
3 salaries for
planning and super-
vision
transport and
allowance for
visiting or staying at
site
cost for waste-water
analysis
total planning
cost includ.
overheads and
acquisition
cost of plot incl.
site prepara-
tion
main structures
of 20 years’ durability
secondarystructures
of 10 years’ durability
equipment and parts of 6 years’ durability
total in-vestment cost (incl. land and planning)
total an-nual cost (including
land)
total annual
cost (excluding
land)
4 I.c. I.c. I.c. I.c. I.c. I.c. I.c. I.c. I.c. I.c. I.c.
5 1,200 650 500 2,350 150,000 295,000 9,000 3,000 459,350 74,359 62,359
6 wastwater data annual capital costs
7 daily waste-
water fl ow
strength of
waste-water infl ow
COD/ BOD ratio of infl ow
strength ofwaste-water
outfl ow
rate of interest in % p.a. (bank rate
minus infl ation)
interest factor q=1+i
on investment
for land
on main structures
of 20 years’ lifetime
(incl. plan-ning fees)
on secon-dary
structures of 10 years’
lifetime
on equip-
ment of 6 years’ lifetime
total capital costs
8 m³/d mg/l COD mg/l mg/l COD % I.c./year I.c./year I.c./year I.c./year I.c./year
9 20 3,000 2 450 8% 1.08 12,000 30,286 1,341 649 37,179
10 operational cost income from biogas and other sources explanat.
11 cost ofpersonal
for operation, mainten.
and repair
cost of material
for operation, mainten.
and repair
cost of power
(e.g. cost for
pumping)
cost of treatment additives
(e.g. chlorine)
total operatio-nal cost
daily biogas
production (70% CH4,
50% dissolved)
price 1 litre of
kerosene (1m³
CH4=0.85 l kerosene)
annual income
from biogas
p.a.
other annual
income or savings
(e.g. fertili-ser, fees))
total income
per annum
l.c. = local currency;
mg/l = g/m³
12 I.c./year I.c./year I.c./year I.c./year I.c./year m³/d I.c./litre I.c./year I.c./year I.c./year
13 100 100 50 0 250 12.75 2.69 7,347 0 7,347
Table 34: Spreadsheet for the economic calculation of DEWATS (based on annual costs).
277
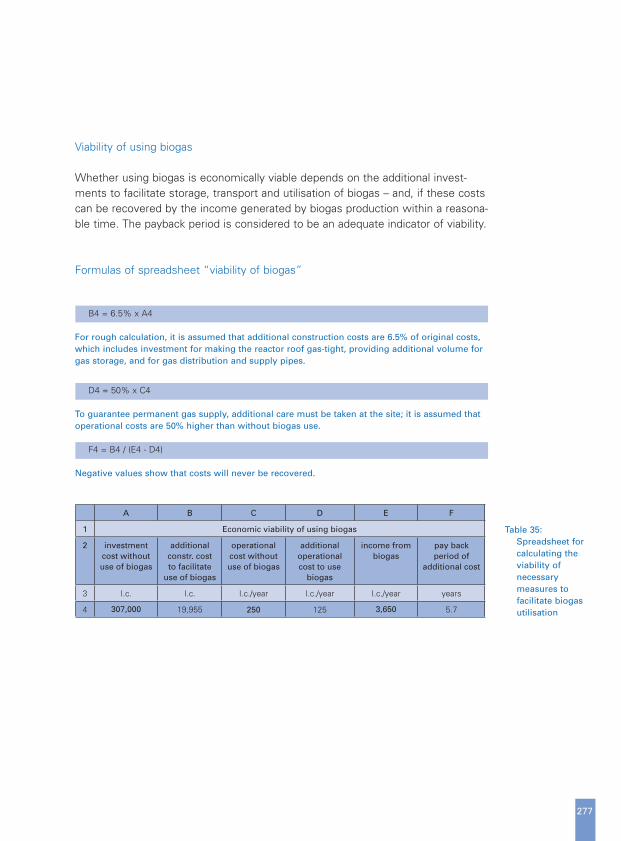
Viability of using biogas
Whether using biogas is economically viable depends on the additional invest-ments to facilitate storage, transport and utilisation of biogas – and, if these costs can be recovered by the income generated by biogas production within a reasona-ble time. The payback period is considered to be an adequate indicator of viability.
Formulas of spreadsheet “viability of biogas”
B4 = 6.5% x A4
For rough calculation, it is assumed that additional construction costs are 6.5% of original costs, which includes investment for making the reactor roof gas-tight, providing additional volume for gas storage, and for gas distribution and supply pipes.
D4 = 50% x C4
To guarantee permanent gas supply, additional care must be taken at the site; it is assumed that operational costs are 50% higher than without biogas use.
F4 = B4 / (E4 - D4)
Negative values show that costs will never be recovered.
A B C D E F
1 Economic viability of using biogas
2 investment cost without use of biogas
additional constr. cost to facilitate
use of biogas
operational cost without use of biogas
additional operational cost to use
biogas
income from biogas
pay back period of
additional cost
3 I.c. I.c. I.c./year I.c./year I.c./year years
4 307,000 19,955 250 125 3,650 5.7
Table 35: Spreadsheet for
calculating theviability of necessary measures to facilitate biogas utilisation
278
10 Designing DEWATS
10.4 Using spreadsheets without a computer
Not everybody uses a computer; some may not even have access to one. But, computer formulas may also be useful to those who usually work with a pocket calculator. The following explanations are presented for them. The calculation for the septic tank (see Table 36) is a good example:
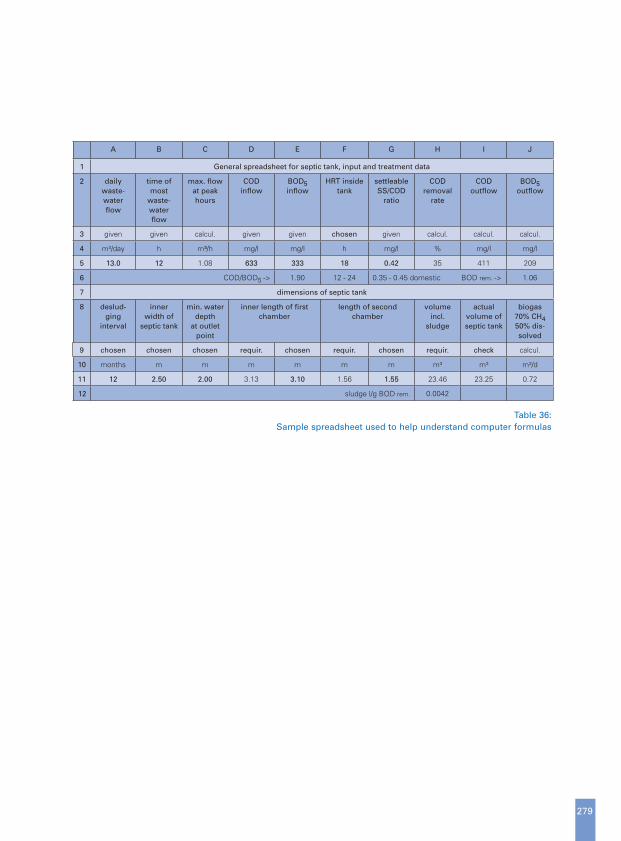
A computer table is made up of cells. The location of each cell within the table is described by columns A.....X, AA...AX, etc. and rows 1.....>1000. Each cell within the table, therefore, has an exact address. For example, the first cell in the top left corner has the address A1 (column A, row 1). In the table below, cell J10 reads m³/d and cell D5 reads 633. Cell I11 reads 23.25; this figure is the result of a formula hidden “under” it. On the computer, the formula appears in the head-line every time one clicks on the cell. These formulas can also be applied without a computer, in connection with the various graphs. One must realise, however, that the computer writing differs from normal mathematical writing in some points: for example, 4/(3×2) is written as = 4/3/2 on the computer, and 4×2/3 may be written either 4*2/3 or 4/3*2.
279
A B C D E F G H I J
1 General spreadsheet for septic tank, input and treatment data
2 daily waste-water fl ow
time of most
waste-water fl ow
max. fl ow at peak hours
COD infl ow
BOD5 infl ow
HRT inside tank
settleable SS/COD
ratio
COD removal
rate
COD outfl ow
BOD5 outfl ow
3 given given calcul. given given chosen given calcul. calcul. calcul.
4 m³/day h m³/h mg/l mg/l h mg/l % mg/l mg/l
5 13.0 12 1.08 633 333 18 0.42 35 411 209
6 COD/BOD5 -> 1.90 12 - 24 0.35 - 0.45 domestic BOD rem. -> 1.06
7 dimensions of septic tank
8 deslud-ging
interval
inner width of
septic tank
min. water depth
at outlet point
inner length of fi rstchamber
length of secondchamber
volume incl.
sludge
actual volume of septic tank
biogas 70% CH450% dis-solved
9 chosen chosen chosen requir. chosen requir. chosen requir. check calcul.
10 months m m m m m m m³ m³ m³/d
11 12 2.50 2.00 3.13 3.10 1.56 1.55 23.46 23.25 0.72
12 sludge l/g BOD rem. 0.0042
Table 36: Sample spreadsheet used to help understand computer formulas
280
10 Designing DEWATS
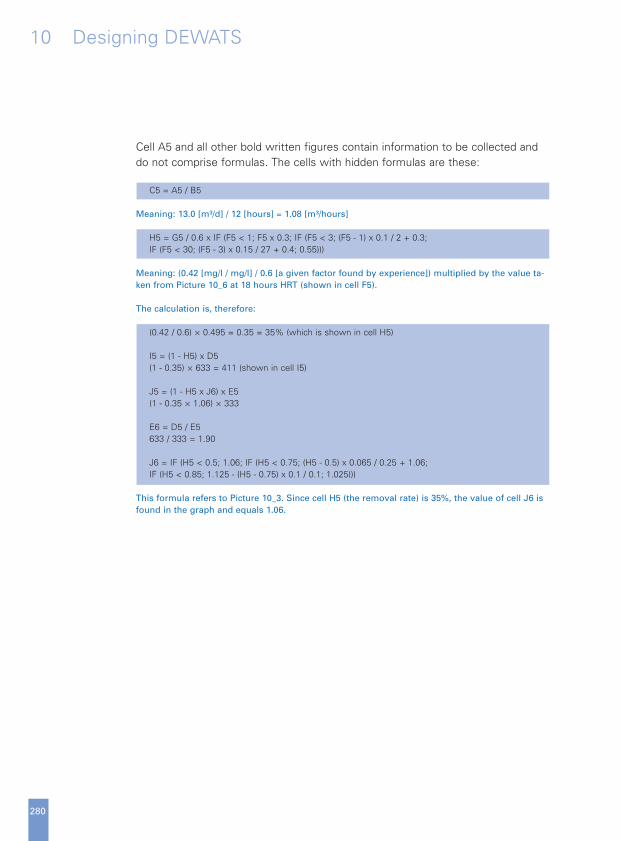
Cell A5 and all other bold written figures contain information to be collected and do not comprise formulas. The cells with hidden formulas are these:
C5 = A5 / B5
Meaning: 13.0 [m³/d] / 12 [hours] = 1.08 [m³/hours]
H5 = G5 / 0.6 x IF (F5 < 1; F5 x 0.3; IF (F5 < 3; (F5 - 1) x 0.1 / 2 + 0.3;IF (F5 < 30; (F5 - 3) x 0.15 / 27 + 0.4; 0.55)))
Meaning: (0.42 [mg/l / mg/l] / 0.6 [a given factor found by experience]) multiplied by the value ta-ken from Picture 10_6 at 18 hours HRT (shown in cell F5).
The calculation is, therefore:
(0.42 / 0.6) × 0.495 = 0.35 = 35% (which is shown in cell H5)
I5 = (1 - H5) x D5(1 - 0.35) × 633 = 411 (shown in cell I5)
J5 = (1 - H5 x J6) x E5(1 - 0.35 × 1.06) × 333
E6 = D5 / E5633 / 333 = 1.90
J6 = IF (H5 < 0.5; 1.06; IF (H5 < 0.75; (H5 - 0.5) x 0.065 / 0.25 + 1.06;IF (H5 < 0.85; 1.125 - (H5 - 0.75) x 0.1 / 0.1; 1.025)))
This formula refers to Picture 10_3. Since cell H5 (the removal rate) is 35%, the value of cell J6 is found in the graph and equals 1.06.
281
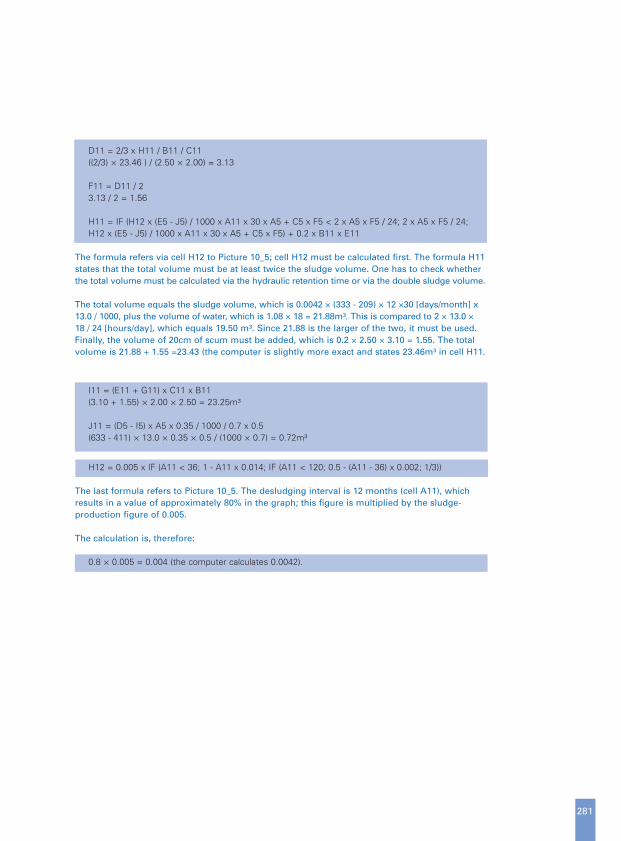
D11 = 2/3 x H11 / B11 / C11((2/3) × 23.46 ) / (2.50 × 2.00) = 3.13
F11 = D11 / 23.13 / 2 = 1.56
H11 = IF (H12 x (E5 - J5) / 1000 x A11 x 30 x A5 + C5 x F5 < 2 x A5 x F5 / 24; 2 x A5 x F5 / 24;H12 x (E5 - J5) / 1000 x A11 x 30 x A5 + C5 x F5) + 0.2 x B11 x E11
The formula refers via cell H12 to Picture 10_5; cell H12 must be calculated first. The formula H11 states that the total volume must be at least twice the sludge volume. One has to check whether the total volume must be calculated via the hydraulic retention time or via the double sludge volume.
The total volume equals the sludge volume, which is 0.0042 × (333 - 209) × 12 ×30 [days/month] x 13.0 / 1000, plus the volume of water, which is 1.08 × 18 = 21.88m³. This is compared to 2 × 13.0 × 18 / 24 [hours/day], which equals 19.50 m³. Since 21.88 is the larger of the two, it must be used. Finally, the volume of 20cm of scum must be added, which is 0.2 × 2.50 × 3.10 = 1.55. The total volume is 21.88 + 1.55 =23.43 (the computer is slightly more exact and states 23.46m³ in cell H11.
I11 = (E11 + G11) x C11 x B11(3.10 + 1.55) × 2.00 × 2.50 = 23.25m³
J11 = (D5 - I5) x A5 x 0.35 / 1000 / 0.7 x 0.5(633 - 411) × 13.0 × 0.35 × 0.5 / (1000 × 0.7) = 0.72m³
H12 = 0.005 x IF (A11 < 36; 1 - A11 x 0.014; IF (A11 < 120; 0.5 - (A11 - 36) x 0.002; 1/3))
The last formula refers to Picture 10_5. The desludging interval is 12 months (cell A11), which results in a value of approximately 80% in the graph; this figure is multiplied by the sludge-production figure of 0.005.
The calculation is, therefore:
0.8 × 0.005 = 0.004 (the computer calculates 0.0042).