10 h5 h 0 h supplemental figure 1 14 h 16 h 24 h untreated supplemental figure 1 untreated cells...
TRANSCRIPT
10 h5 h0 h
Supplemental Figure 1
14 h 16 h 24 h
Un
trea
ted
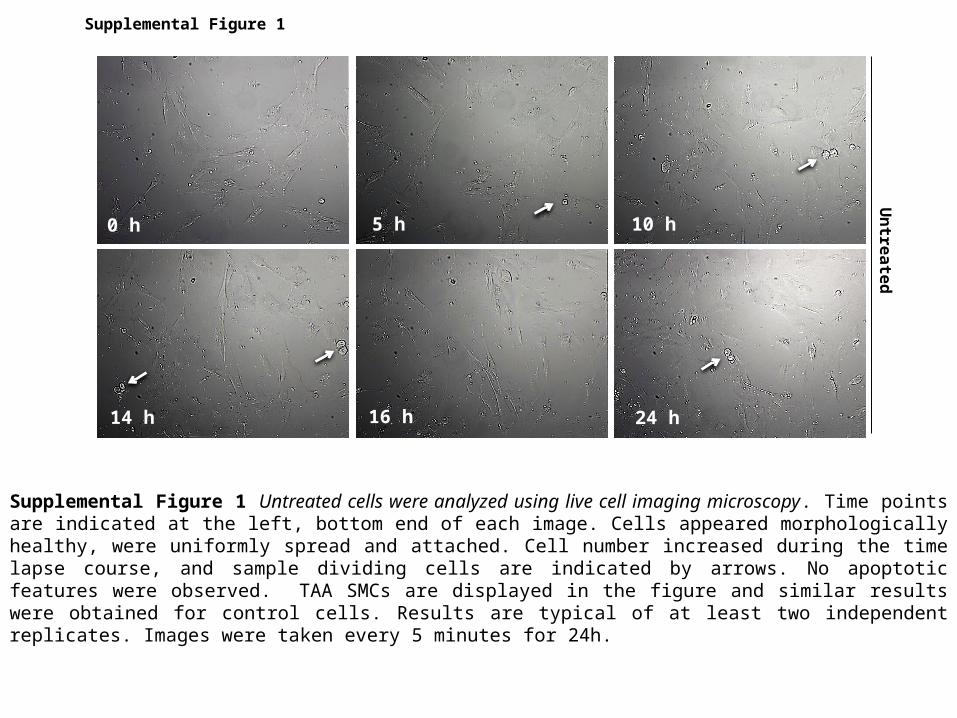
Supplemental Figure 1 Untreated cells were analyzed using live cell imaging microscopy. Time points are indicated at the left, bottom end of each image. Cells appeared morphologically healthy, were uniformly spread and attached. Cell number increased during the time lapse course, and sample dividing cells are indicated by arrows. No apoptotic features were observed. TAA SMCs are displayed in the figure and similar results were obtained for control cells. Results are typical of at least two independent replicates. Images were taken every 5 minutes for 24h.
Control 20 µg/ml 40 µg/ml
7-K
C2
5-O
HC
Supplemental Figure 2
Control SMCs
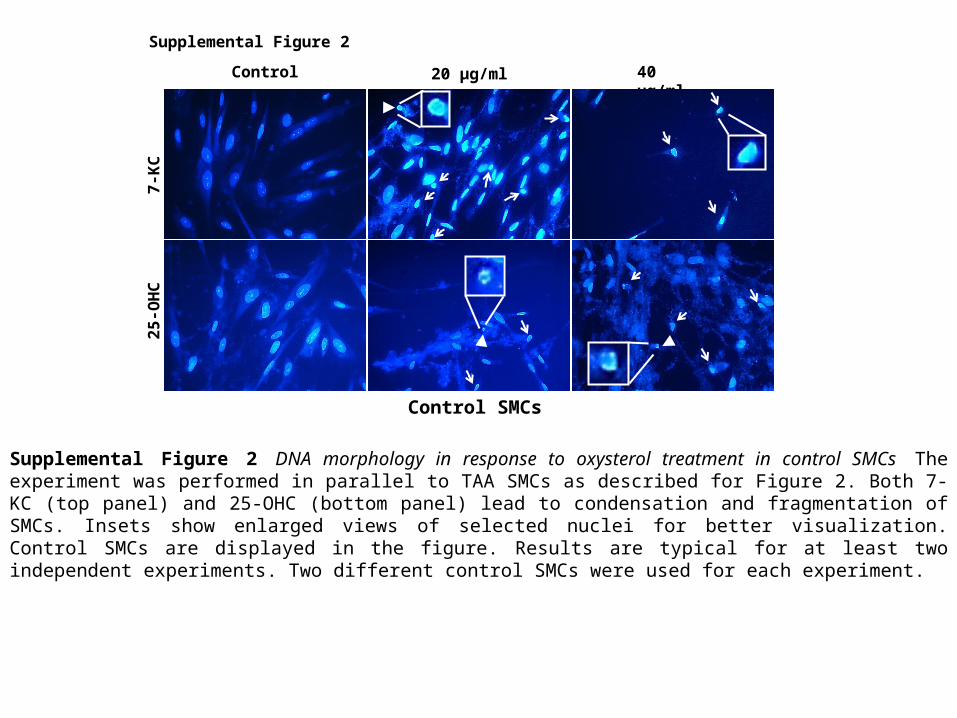
Supplemental Figure 2 DNA morphology in response to oxysterol treatment in control SMCs The experiment was performed in parallel to TAA SMCs as described for Figure 2. Both 7-KC (top panel) and 25-OHC (bottom panel) lead to condensation and fragmentation of SMCs. Insets show enlarged views of selected nuclei for better visualization. Control SMCs are displayed in the figure. Results are typical for at least two independent experiments. Two different control SMCs were used for each experiment.
(-) Resveratrol (+) Resveratrol0
40
80
120Control (+) 7-KC (+) 25-OHC
(-) NAC (+) NAC 0
40
80
120 Control (+) 7-KC (+) 25-OHC %
Cel
l via
bili
ty
Supplemental Figure 3
A B
% C
ell v
iab
ility
*
*
****
§
§
§§
§§
Control SMCsControl SMCs
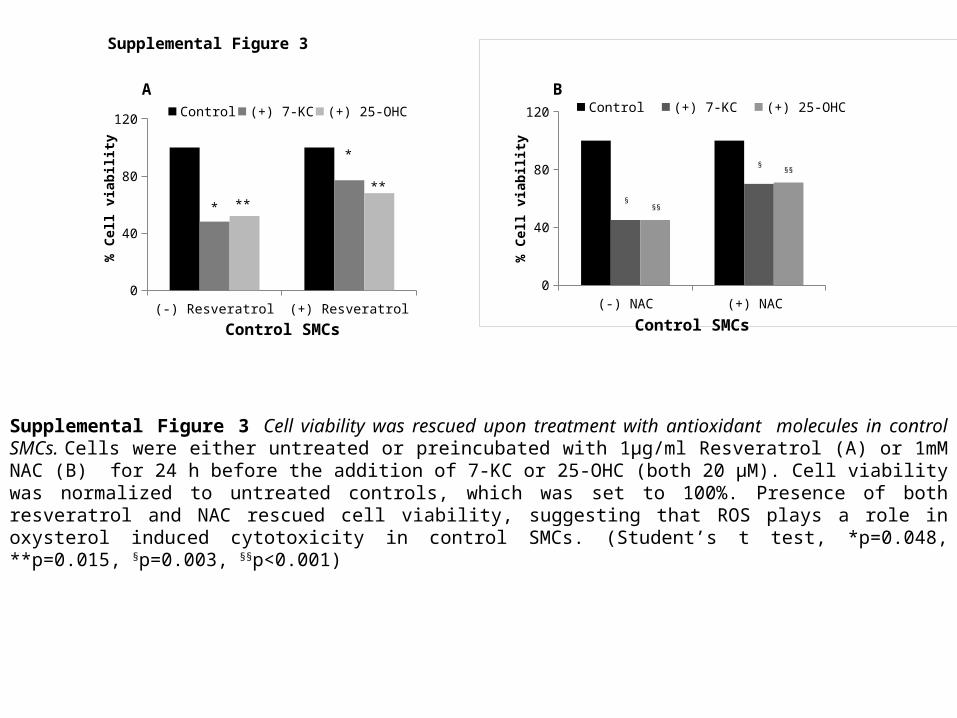
Supplemental Figure 3 Cell viability was rescued upon treatment with antioxidant molecules in control SMCs. Cells were either untreated or preincubated with 1µg/ml Resveratrol (A) or 1mM NAC (B) for 24 h before the addition of 7-KC or 25-OHC (both 20 µM). Cell viability was normalized to untreated controls, which was set to 100%. Presence of both resveratrol and NAC rescued cell viability, suggesting that ROS plays a role in oxysterol induced cytotoxicity in control SMCs. (Student’s t test, *p=0.048, **p=0.015, §p=0.003, §§p<0.001)

0 10 20 400
5
10
15
20
25
(+) 7-KC, (-) inh. (+) 25-OHC, (-) inh.
(+) 7-KC, (+) inh. (+) 25-OHC, (+) inh.
Cas
pas
e A
ctiv
ity
(Fo
ld C
han
ge)
Supplemental Figure 4
Supplemental Figure 4 Control SMCs exhibited increased caspase activity (solid columns) in response to both 7-KC and 25-OHC treatment. Caspase 3/7 activity (y-axis) was determined using a commercially available kit (see materials and methods for details) and was detected by a chemiluminometer. Signal from untreated cells was set to 1, and fold change was calculated based on normalized values to untreated controls. Addition of caspase inhibitors to the reaction mixture lead to reduction of caspase activity showing the specificity of the assay (striped columns). The experiment was replicated at three independent times. (inh: Caspase inhibitor, Ac-DEVD-CHO peptide)

0 200
20
40
60
80
100
120siNT sip53 siBax siAkt1 siAkt2 siCasp3
0 400
20
40
60
80
100
120
140
siNT sip53 siBax siAkt1 siAkt2 siCasp3
[7-KC] (µg/ml) [25-OHC] (µg/ml)
% C
ell v
iab
ility
% C
ell v
iab
ility
Supplemental Figure 5
A B
Supplemental Figure 5 Effect of silencing apoptotic and antiapoptotic genes on SMC viability (Control SMCs) Control SMCs were transfected with siRNA to silence p53, Bax, Caspase 3, Akt1 or Akt2 and treated with 7-KC (A) or 25-OHC (B). The efficiency of silencing was between 70-90% based on RT-qPCR analysis (data not shown). There was no significant difference in cell death between controls and siRNA treated SMCs (Mann Whitney U test, p>0.1 for all genes under study). (siNT: Transfection using Non-Targetting siRNAs, sip53: siRNA for p53, siBax: siRNA for Bax, siCaspase3: siRNA for caspase3, siAkt1 or 2: siRNA for Akt1 or 2)