10 - stock exchange of mauritius · the information contained in the handbook is designed as a...
TRANSCRIPT

2010DEM Handbook

The Stock Exchange of Mauritius Ltd is pleased to present the DEM Handbook 2010. This Handbook has been prepared with the collaboration of listed companies and has been compiled from the latest annual reports of each listed company. The information contained in the Handbook is designed as a general reference and does not, by itself, provide answers to all questions, which should be asked about shares and their prospects.
The publication of the figures of listed companies contained in this Handbook has been done with reasonable care and diligence. However, the Stock Exchange of Mauritius Ltd makes no representations, gives no warranty and disclaims all liability in respect thereof and shall not be held liable for any damage, loss or cost incurred resulting from any error in the information or of any use of the said information. Appropriate independent advice should be obtained before making any investment decision.

ABC Motors Company Limited 4 - 56The Anglo-Mauritius Assurance Company Limited 6 - 8 Alma Investments Company Limited 9 - 10Associated Commercial ltd 11 - 12Ascencia Limited 13 - 14The Black River Investments Company Limited 15 - 16Bychemex Limited 17 - 18Chemco Limited 19 - 20CIEL Investment Ltd 21 - 22CIEL Textile 23 - 24Compagnie Immobilière Limitée 25 - 26Constance La Gaieté Company Limited 27 - 28Constance Hotels Services Limited 29 - 30Compagnie Des Villages De Vacances De l’Isle De France Limitée 31 - 32Deep River Beau Champ 33 - 35Deep River Investment Limited 36 - 37ENL Investment Trust 38 - 39ENL Limited 40 - 42Excelsior United Development Companies Limited 43 - 44Flacq United Estates Limited 45 - 47FIDES 48 - 49Hotelest Limited 50 - 51Knowledge Economics Ltd 52 - 53Livestock Limited 54 - 55Les Gaz Industriels Ltd 56 - 58 Les Moulins de la Concorde Ltée 59 -60Margarine Industries Ltd 61 - 62Mauritius Cosmetics Limited 63 - 64Medical & Surgical Centre 65 - 66Mauritius Secondary Industries 67 - 68Mauritius Freeport Development Company Limited 69 - 70Medine Limited 71 - 73Medine Share Holding Company Limitec 74 - 75Morning Light Co. Ltd. 76 - 77Paper Converting Company Limited 78 - 79Phoenix Investment Company Limited 80 - 82Quality Beverages Limited 83 - 85Robert Le Maire Limited 86 - 88RHT Holding Ltd 89 - 91SIT Land Holdings 92 - 93 Soap & Allied Industries Limited 94 - 96Southern Cross Tourist Co. Ltd. 97 - 98Tropical Paradise Ltd 99 - 100Union Flacq Ltdq 101 - 103The Union Sugar Estates Company Limited 104 - 105 United Bus Service 107 - 108United Investments Limited 109 - 110 Vital Water Bottling Co. Ltd. 111 - 112
Table of Contents

4 | DEM 2010The Stock Exchange of Mauritius Ltd.
ABC Motors Company Limited
SEM Code : ABC.I0000
Classification : Commerce
Registered Office : ABC Centre, Military Road, Port Louis
Board of Directors : AH CHUEN Raymond (Chairman) AH CHUEN Donald (Chief Executive Officer) AH CHUEN Vincent AH CHUEN Marc AH CHUEN Dean (Executive Director) CHU John TIN KIONG FONG France
Company Secretary : ABC Professional & Secretarial Services Ltd
Principal Activities : Dealer in Motor Vehicles and Spare Parts Automotive Workshop Agency for Import and Export of Motor Vehicles and Accessories
SUMMARY INFORMATION
ABC Motors Co. Ltd is the exclusive distributor of Nissan Motors Co. Ltd and Nissan Diesel vehicles in Mauritius, comprising passenger and light commercial vehicles, pick-ups and trucks. Since its establishment in 1985, ABC Motors Co Ltd has ranked among the top sales performers in the vehicles market and has received numerous awards on its sales performance, after sales service and spare parts facilities, winning the Nissan Gold Price Award on several occasions and the Nissan Global Award in 2005, 2007 and 2008.
For the year 2009, ABC Motors was again the No. 1 company as a Brand Leader in terms of market share of motor vehicles sold in Mauritius, a position it has achieved for the past 14 consecutive years!
ABC Motors employs over 600 people and is a member company of the DEM (Development Enterprise Market) of the Stock Exchange of Mauritius and a member of the Mauritius Chamber of Commerce and Industry. It is strongly supported by its principals in terms of staff training and development, with regular visits and workshops by their specialists from Japan and South Africa.
The Company has a very active staff welfare committee and contributes generously in the charitable, health promotion and other social welfare activities and projects of various voluntary social organizations.
4 | DEM 2010The Stock Exchange of Mauritius Ltd.

DEM 2010 | 5The Stock Exchange of Mauritius Ltd.
INCOME STATEMENT (RS)
FINANCIAL REVIEW OF THE GROUP BALANCE SHEET (RS)
30 Jun 2009 2008 2007
ASSETS
Non-current assetsProperty and equipment 95,777,709 103,076,836 97,207,939 Intangible assets 1,699,322 2,368,754 1,908,120 Investments in subsidiary - - -Investments in associates 114,509,084 107,320,460 104,400,885 Available-for-sale investments 23,892,390 13,211,426 10,553,677 Deferred tax asset 817,692 255,681 63,364 236,696,197 226,233,157 214,133,985Current assetsStock 245,640,717 149,055,697 118,036,418 Trade and other receivables 218,957,081 210,983,408 197,068,596 Cash at bank and in hand 31,010,673 8,878,551 2,743,482 495,608,471 368,917,656 317,848,496
Total assets 732,304,668 595,150,813 531,982,481
EQUITY AND LIABILITIES
Capital and reservesStated capital 61,756,800 61,756,800 61,756,800 Share premium 147,300 147,300 147,300 Retained earnings 235,046,184 213,698,635 151,230,807 Investment revaluation reserve 2,400,707 2,219,349 1,086,600 Equity attribuable to equity holders of the parent 299,350,991 277,822,084 214,221,507 Minority interest 7,563,013 7,504,428 6,583,100
Total Equity 306,914,004 285,326,512 220,804,607
LIABILITIES
Non-current liabilities Loans 26,784,317 28,910,450 45,500,000 Obligation under finance lease 9,751,764 14,184,525 10,610,932 Retirement benefit obligation 13,290,110 10,604,545 9,582,180 49,826,191 53,699,520 65,693,112 Current liabilities Bank overdrafts 161,823,416 63,493,021 52,181,935 Trade and other payables 45,516,323 53,783,351 43,083,254 Bills payable 127,048,695 80,276,754 105,970,629 Amount due to subsidiary - - -Loans 27,166,831 41,589,550 33,500,000 Obligation under finance lease 5,589,541 5,446,478 3,810,055 Taxation 8,419,667 11,535,627 6,938,889 375,564,473 256,124,781 245,484,762
Total equity and liabilities 732,304,668 595,150,813 531,982,481
30 Jun 2009 2008 2007
Revenue 1,197,865,621 1,170,080,132 935,498,126
Profit from operations 64,327,911 106,989,902 62,470,711 Share of profits less losses of associates 7,188,624 8,419,099 14,866,967 Net finance costs 32,849,211 26,022,463 31,331,292 Profit before taxation 38,667,324 89,386,538 46,006,386 Taxation 4,917,122 12,460,320 7,108,368 Profit for the year 33,750,202 76,926,218 38,898,018 Equity holders of the parent 33,390,125 76,604,890 38,625,557 Minority interest 360,077 321,328 272,461 33,750,202 76,926,218 38,898,018
STATISTICS
Number of ordinary shares used in calculation 6,175,680 6,175,680 6,175,680Earnings per share (Rs) 5.41 12.40 6.84Dividends per share (Rs) 1.30 1.95 1.15Net asset value per share (Rs) 57.77 54.90 36.11

6 | DEM 2010The Stock Exchange of Mauritius Ltd.6 | DEM 2010The Stock Exchange of Mauritius Ltd.
The Anglo-Mauritius Assurance Company Limited
SEM Code : ANGM.I0000
Classification : Banks, Insurance & Other Finance
Registered Office : Swan Group Centre, Intendance Street, Port-Louis
Directors
Non-Executive : M.E. Cyril MAYER, B. Com., CA (SA) – Chairperson M.J. Cyril LAGESSE L.J. Jérôme de CHASTEAUNEUF, B.Sc. Economics (LSE), A.C.A. (UK) F. M. J. Pierre DOGER DE SPÉVILLE George J. DUMBELL, A.C.I.B. (UK) M. A. Eric ESPITALIER-NOËL, B. Soc. Sc. (SA), M.B.A. (UK) M. D. Henri HAREL, A.C.I.S. Thierry P. J. M. LAGESSE, M.B.A. (France) M.F.I. Jean Hugues MAIGROT
Independent Non-Executive : M. D. Pierre Dinan, GOSK, B.Sc. Economics (LSE), F.C.A. (ENGLAND) Peroomal Gopallen MOOROOGEN, F.C.C.A., M.B.A. (Wales) Victor C. SEEYAVE, M.B.A. (USA), B.A. Economics (UK)
Executive : J. M. Louis RIVALLAND, B.Sc. (Hons.) (SA), F.I.A. (UK), F.A.S. (SA) – Group Chief Executive
Secretary : Swan Group Corporate Services Limited (per M. J. Jean Paul CHASTEAU DE BALYON, F.MIoD)
Principal Activities : Life assurance, pensions, actuarial and investment business
SUMMARY INFORMATION
The Anglo-Mauritius Assurance Society Limited, one of the market leaders in the life assurance, pensions, actuarial and investment business in Mauritius, has developed over the years a full range of insurance products and services to serve the needs of corporate and individual clients either directly or through its sales representatives’ network. Swan Insurance Company Limited is the major shareholder of The Anglo-Mauritius Assurance Society Limited. Assets under the management of The Anglo-Mauritius amounted to Rs. 18.8 billion and the Life Assurance Fund reached Rs. 18.5 billion at 31st December 2009. The Company manages both locally and internationally an investment portfolio which consists, inter alia, of equities at market value of Rs. 8.8 billion and debenture stocks at market value of Rs. 6.5 million at 31st December 2009. Investments are made in key sectors of activity namely tourism, real estate, sugar, trade and financial services in Mauritius and in the region. The Company caters for the insurance requirements of its clients in the region. The Company participates actively in the socio-economic development of the country by granting loans for the construction or purchase of residential and business properties. Residential loans granted to policyholders amounted to Rs. 1.9 billion and loans on business properties totalled Rs. 344 million at 31st December 2009. Benefits paid to policyholders, beneficiaries and annuitants amounted to Rs. 1.1 billion at 31st December 2009. Market capitalisation of the Company on the Mauritian Stock Exchange at 31st December 2009 was Rs. 775 million.
DEM 2010 | 7The Stock Exchange of Mauritius Ltd.
31 Dec 2009 2008 2007 2006 2005
ASSETS
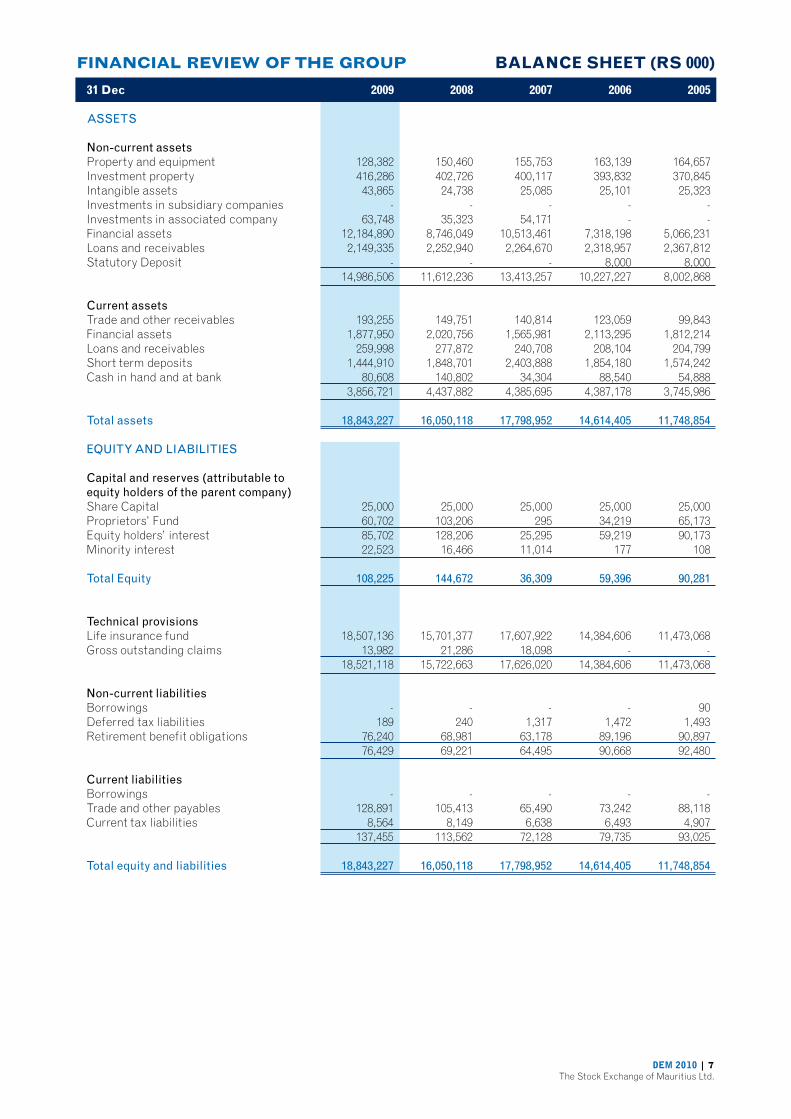
Non-current assets Property and equipment 128,382 150,460 155,753 163,139 164,657 Investment property 416,286 402,726 400,117 393,832 370,845 Intangible assets 43,865 24,738 25,085 25,101 25,323 Investments in subsidiary companies - - - - - Investments in associated company 63,748 35,323 54,171 - -Financial assets 12,184,890 8,746,049 10,513,461 7,318,198 5,066,231 Loans and receivables 2,149,335 2,252,940 2,264,670 2,318,957 2,367,812 Statutory Deposit - - - 8,000 8,000 14,986,506 11,612,236 13,413,257 10,227,227 8,002,868
Current assets Trade and other receivables 193,255 149,751 140,814 123,059 99,843 Financial assets 1,877,950 2,020,756 1,565,981 2,113,295 1,812,214 Loans and receivables 259,998 277,872 240,708 208,104 204,799 Short term deposits 1,444,910 1,848,701 2,403,888 1,854,180 1,574,242 Cash in hand and at bank 80,608 140,802 34,304 88,540 54,888 3,856,721 4,437,882 4,385,695 4,387,178 3,745,986
Total assets 18,843,227 16,050,118 17,798,952 14,614,405 11,748,854 EQUITY AND LIABILITIES
Capital and reserves (attributable to equity holders of the parent company) Share Capital 25,000 25,000 25,000 25,000 25,000 Proprietors’ Fund 60,702 103,206 295 34,219 65,173 Equity holders’ interest 85,702 128,206 25,295 59,219 90,173 Minority interest 22,523 16,466 11,014 177 108
Total Equity 108,225 144,672 36,309 59,396 90,281
Technical provisions Life insurance fund 18,507,136 15,701,377 17,607,922 14,384,606 11,473,068 Gross outstanding claims 13,982 21,286 18,098 - - 18,521,118 15,722,663 17,626,020 14,384,606 11,473,068
Non-current liabilities Borrowings - - - - 90 Deferred tax liabilities 189 240 1,317 1,472 1,493 Retirement benefit obligations 76,240 68,981 63,178 89,196 90,897 76,429 69,221 64,495 90,668 92,480
Current liabilities Borrowings - - - - -Trade and other payables 128,891 105,413 65,490 73,242 88,118 Current tax liabilities 8,564 8,149 6,638 6,493 4,907 137,455 113,562 72,128 79,735 93,025
Total equity and liabilities 18,843,227 16,050,118 17,798,952 14,614,405 11,748,854
FINANCIAL REVIEW OF THE GROUP BALANCE SHEET (RS 000)

8 | DEM 2010The Stock Exchange of Mauritius Ltd.
31 Dec 2009 2008 2007 2006 2005 Gross Premiums 1,475,053 1,545,647 1,470,620 1,337,548 1,102,019 Ceded to Reinsurers (74,010) (74,862) (77,893) (51,146) (45,851)Net insurance premiums 1,401,043 1,470,785 1,392,727 1,286,402 1,056,168 Consideration for annuities 202,656 225,942 255,557 193,958 133,244 Fee income on insurance and investment contracts 116,878 98,044 63,398 51,808 32,405 Investment income 1,186,852 1,050,895 970,031 720,711 597,288 Other income 52,277 172,088 384,101 195,127 88,227 Gain on exchange 538 185,374 - 222,218 16,195 Other operating income - rent 20,859 26,815 21,390 18,200 15,499 Share of results of associated company 7,677 4,982 24,667 - - 2,988,780 3,234,925 3,111,871 2,688,424 1,939,026 Gross death and disablement insurance claims 89,398 72,821 71,752 - -Recoverable from reinsurers (24,495) (11,073) (14,255) - -Net death and disablement insurance claims 64,903 61,748 57,497 52,140 43,469 Maturity claims 840,148 693,105 617,302 566,372 450,701 Surrenders 194,051 509,906 377,915 206,773 175,209 Annuities 217,474 187,410 165,880 137,175 116,298 Commissions payable to agents and brokers 106,332 50,310 44,993 50,163 44,007 Fees payable 65,697 62,401 50,327 39,890 28,702 Depreciation of property and equipment 9,139 8,511 10,922 11,778 12,650 Depreciation of investment property 7,400 6,949 6,589 6,331 5,743 Amortisation of intangible assets 6,507 647 1,006 1,216 922 Computer development expenses 3,202 3,862 3,930 2,538 2,155 Bad debts 2,005 2,276 2,457 3,594 1,325 Marketing and administrative expenses 155,074 130,508 125,828 114,607 105,170 Loss on exchange 38,738 - 226,322 - - 1,710,670 1,717,633 1,690,968 1,192,577 986,351 Surplus for the year before taxation 1,278,110 1,517,292 1,420,903 1,495,847 952,675 Taxation (10,600) (4,737) (3,058) (19,340) 7,085 Surplus for the year 1,267,510 1,512,555 1,417,845 1,476,507 959,760 Surplus transferred as follows: - Life assurance fund 1,261,453 1,375,645 1,407,007 1,476,434 868,466 - Proprietors’ fund - 133,682 - - 91,285 - Minority interest 6,057 3,228 10,837 73 9 STATISTICS
Number of ordinary shares used in calculation 2,500,000 2,500,000 2,500,000 2,500,000 2,500,000 Earnings per share (Rs) 21.62 23.51 14.00 15.19 15.05 Dividends per share (Rs) 20.80 18.00 15.40 15.40 15.40
FINANCIAL REVIEW OF THE GROUP LIFE INSURANCE FUND (RS 000)

DEM 2010 | 9The Stock Exchange of Mauritius Ltd.
Alma Investments Company Limited
SEM Code : ALMA.I0000
Classification : Investment
Registered Office : 11th Floor, Medine Mews, 4 Chaussée Street, Port Louis
Board of Directors : Pierre DOGER DE SPÉVILLE – Chairman Rajkumar GUJADHUR Arnaud LECLÉzIO René LECLÉzIO
Company Secretary : Patricia GODER
Senior Executive : Daniel GIRAUD – Group Chief Executive
Principal Activities : Investment holding
SUMMARY INFORMATION
Alma Investments Company Limited was incorporated in 1964. Its main activity consists of the holding of investments.
Its key investment is namely the holding of 50.10% of the issued share capital of The Black River Investments Company Limited which owns 26.27% and 27.41% of the issued share capital of Medine Limited and Excelsior United Development Companies Limited respectively.

10 | DEM 2010The Stock Exchange of Mauritius Ltd.
INCOME STATEMENT (RS)
FINANCIAL REVIEW OF THE GROUP BALANCE SHEET (RS)
30 Jun 2009 2008 2007
ASSETS
Non-current assetsInvestments in subsidiary - - - Investments in associates 2,890,725,735 2,867,492,129 2,851,052,178 Investment in securities 236,974,572 322,231,869 268,309,414 3,127,700,307 3,189,723,998 3,119,361,592
Current assetsTrade and other receivables 17,954,305 5,445,227 19,106,564 Cash at bank 3,933,953 1,624,241 4,769,339 21,888,258 7,069,468 23,875,903 Total assets 3,149,588,565 3,196,793,466 3,143,237,495
EQUITY AND LIABILITIES
Capital and reservesShare Capital 73,312,960 73,312,960 73,312,960 Share premium 5,156,480 5,156,480 5,156,480 Fair value and other reserves 1,352,069,087 1,455,528,199 1,388,702,209 Retained earnings 251,559,445 217,987,933 217,409,360 Equity holders’ interests 1,682,097,972 1,751,985,572 1,684,581,009 Minority interests 1,452,082,152 1,443,318,181 1,440,439,021
Total Equity 3,134,180,124 3,195,303,753 3,125,020,030
LIABILITIES
Current liabilities Trade and other payables 1,436,052 1,470,749 1,480,063 Current tax liabilities 9,183 18,964 37,220 Dividends to minority shareholders 6,998,475 - 8,269,192 Dividends 6,964,731 - 8,430,990 Total liabilities 15,408,441 1,489,713 18,217,465
Total equity and liabilities 3,149,588,565 3,196,793,466 3,143,237,495
30 Jun 2009 2008 2007
Dividend income 9,729,760 8,926,430 6,921,633 Share of result in associates 101,603,096 32,129,169 240,948,731 Other income 62,710 584,081 234,127 111,395,566 41,639,680 248,104,491 Administrative expenses (2,419,773) (1,846,724) (1,492,884) 108,975,793 39,792,956 246,611,607 Finance costs (18,286) - (8,548)Profit before taxation 108,957,507 39,792,956 246,603,059 Income tax (9,183) (18,964) (37,220)Profit for the year 108,948,324 39,773,992 246,565,839 Attributable to: Equity holders of the company 58,305,652 23,751,687 126,005,049 Minority interests 50,642,672 16,022,305 120,560,790 Profit for the year 108,948,324 39,773,992 246,565,839
STATISTICS
Number of ordinary shares used in calculation 7,331,296 7,331,296 7,331,296 Earnings per share (Rs) 7.95 3.24 17.19 Dividends per share (Rs) 4.70 3.50 3.75 Net asset value per share (Rs) 229.44 238.97 229.78
DEM 2010 | 11The Stock Exchange of Mauritius Ltd.
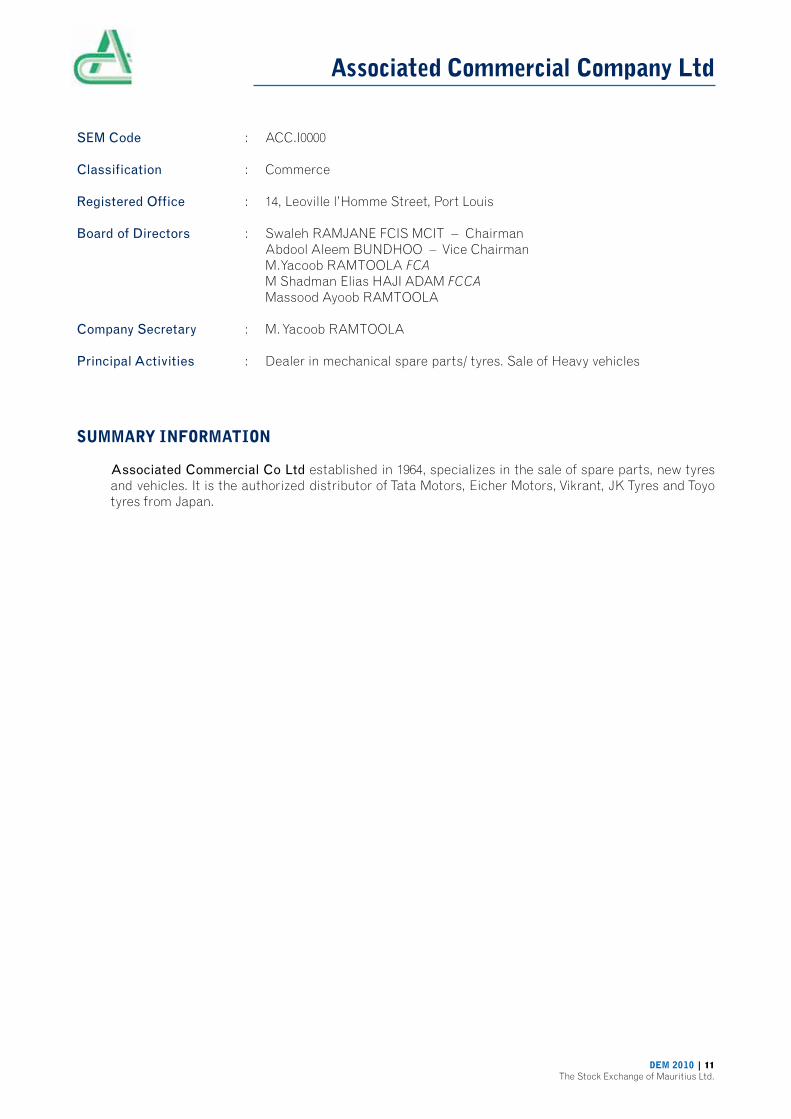
Associated Commercial Company Ltd
SEM Code : ACC.I0000
Classification : Commerce
Registered Office : 14, Leoville l’Homme Street, Port Louis
Board of Directors : Swaleh RAMJANE FCIS MCIT – Chairman Abdool Aleem BUNDHOO – Vice Chairman M.Yacoob RAMTOOLA FCA M Shadman Elias HAJI ADAM FCCA Massood Ayoob RAMTOOLA
Company Secretary : M. Yacoob RAMTOOLA
Principal Activities : Dealer in mechanical spare parts/ tyres. Sale of Heavy vehicles
SUMMARY INFORMATION
Associated Commercial Co Ltd established in 1964, specializes in the sale of spare parts, new tyres and vehicles. It is the authorized distributor of Tata Motors, Eicher Motors, Vikrant, JK Tyres and Toyo tyres from Japan.

12 | DEM 2010The Stock Exchange of Mauritius Ltd.
INCOME STATEMENT (RS)
FINANCIAL REVIEW OF THE GROUP BALANCE SHEET (RS)
30 Jun 2009 2008 2007
ASSETS
Non-current assetsProperty,plant and equipment 9,659,642 8,745,496 9,480,051Investments in securities 38,630,851 43,520,231 41,785,539Investments in associates 39,543,323 37,999,169 28,619,674 87,833,816 90,264,896 79,885,264 Current assetsStocks and goods in transit 77,730,849 69,084,596 62,725,036Trade and other receivables 21,490,690 15,107,943 72,726,343Cash at bank and in hand 652,083 280,828 131,539 99,873,622 84,473,367 135,582,918 Total assets 187,707,438 174,738,263 215,468,182
EQUITY AND LIABILITIES
Capital and reservesStated capital 20,514,196 20,514,196 20,514,196Investment in revaluation reserve 46,395,483 56,041,143 47,229,347Profit and loss account 59,676,727 42,888,348 35,155,641Shareholders’ interest 126,586,406 119,443,687 102,899,184
Non-current liabilities Retirement benefit obligations 3,219,035 2,838,035 3,898,000Obligations under finance lease 741,144 - - Deferred tax liabilities 348,558 409,222 571,571 4,308,737 3,247,257 4,469,571
Current liabilities Bank overdraft(secured) 5,286,913 18,596,136 25,269,415Loan 31,500,000 20,500,000 32,468,900Obligations under finance lease 160,738 - - Trade and other payables 18,038,252 11,728,094 49,175,288Taxation 1,826,392 1,223,089 1,185,824 56,812,295 52,047,319 108,099,427
Total equity and liabilities 187,707,438 174,738,263 215,468,182
30 Jun 2009 2008 2007
Turnover Normal 177,068,310 124,102,923 111,087,565Tender - - 135,506,000 177,068,310 124,102,923 246,593,565Profit from operations 15,586,890 10,237,167 6,781,349Other income 3,671,279 2,352,690 2,403,365 19,258,169 12,589,857 9,184,714Share of associates results 6,317,136 2,283,266 2,928,976Finance costs (3,856,919) (3,168,105) (3,320,287)Profit before taxation 21,718,386 11,705,018 8,793,403Taxation (1,786,861) (1,114,906) (1,006,793)Profit after taxation (19,931,525) 10,590,112 7,786,610
STATISTICS
Number of ordinary shares used in calculation 1,142,962 1,142,962 1,142,962 Earnings per share (Rs) 17.44 9.27 6.81 Dividends per share (Rs) 2.75 2.50 2.25 Net asset value per share (Rs) 110.75 104.50 90.03

DEM 2010 | 13The Stock Exchange of Mauritius Ltd.
Ascencia Limited
SEM Code : ASCE.I0000
Classification : Investment
Registered Office : No. 5, President John Kennedy Street, Port Louis
Board of Directors : Philippe ESPITALIER-NOËL – (Chairman) Cheong Shaow Woo AH CHING ziyad BUNDHUN Jacques DE NAVACELLE Vaughan HEBERDEN Sanjiv MIHDIDIN AndreTAIT Company Secretary : Tioumitra MAHARAHAJE
Principal Activities : Property company
SUMMARY INFORMATION
Ascencia is a listed company on the Development and Enterprise Market since 23 December 2008. The principal activity of the Company is to invest in real estate properties, both freehold and leasehold as well as in property developments. The Company’s investment strategy is developed and adjusted on an ongoing basis so as to seize opportunities and optimise potential returns from a wide selection of property sectors and geographic regions, with the aim of delivering dividend income as well as long term capital growth. Its policy is to distribute 75% of its profits available for distribution as dividends. In general, Ascencia can be regarded as a fairly low risk investment and hence, is benchmarked against bond and gilt-edged securities.

14 | DEM 2010The Stock Exchange of Mauritius Ltd.
INCOME STATEMENT (RS 000)
FINANCIAL REVIEW OF THE GROUP BALANCE SHEET (RS 000)
30 Sep 2009 2008
ASSETS
Non-current assetsInvestment properties 1,401,800 1,319,815
Current assets 46,670 36,612
Total assets 1,448,470 1,356,427
EQUITY AND LIABILITIES Equity and reserves Share capital 751,578 431,357 Retained earnings 63,436 9,598
Total equity and reserves 815,014 440,955
Non-current liabilities 412,000 400,000
Current liabilities 221,456 515,472
Total equity and liabilities 1,448,470 1,356,427
30 Sep 2009 2008
RevenueRental income 156,718 37,553 Other income 4,758 1,841 161,476 39,394
ExpensesOperating expenses (26,770) (2,690)Administrative expenses (11,802) (3,459)Finance costs (60,963) (23,647) (99,535) (29,796)
Fair value gain / (loss) 84,679 -
Profit before tax 146,620 9,598 Taxation (16,652) - Profit after tax 129,968 9,598
STATISTICS
Number of ordinary shares used in calculation (000’s) 746 431 Earnings per share (Rs) 216 22 Dividends per share (Rs) 77 - Net asset value per share (Rs) 1,093 1,017

DEM 2010 | 15The Stock Exchange of Mauritius Ltd.
The Black River Investments Company Limited
SEM Code : BRI.I0000
Classification : Investment
Registered Office : 11th Floor, Medine Mews, 4 Chaussée Street, Port Louis
Board of Directors : Pierre DOGER DE SPÉVILLE – Chairman Rajkumar GUJADHUR Arnaud LECLÉzIO René LECLÉzIO
Senior Executive : Daniel GIRAUD – Chief Executive
Company Secretary : Patricia GODER
Principal Activities : Investment holding
SUMMARY INFORMATION
The Black River Investments Company Limited was incorporated in 1947 and is a subsidiary of Alma Investments Company Limited. Its main activity consists of the holding of investments.
Its key investments are namely the holding of 26.27% and 27.41% of the share capital of Medine Limited and Excelsior United Development Companies Limited respectively.

16 | DEM 2010The Stock Exchange of Mauritius Ltd.
INCOME STATEMENT (RS)
FINANCIAL REVIEW OF THE GROUP BALANCE SHEET (RS)
30 Jun 2009 2008 2007
ASSETS
Non-current assetsInvestments in associates 2,887,940,414 2,864,737,507 2,848,273,786Investments in securities 21,948,983 27,664,995 35,607,074 2,909,889,397 2,892,402,502 2,883,880,860
Current assetsTrade and other receivables 14,037,260 94,048 16,932,969Cash at bank 696,359 512,257 371,654 14,733,619 606,305 17,304,623 Total assets 2,924,623,016 2,893,008,807 2,901,185,483
EQUITY AND LIABILITIES
Capital and reservesShare capital 5,500,000 5,500,000 5,500,000Share premium 63,950,000 63,950,000 63,950,000Fair value and other reserves 2,210,835,998 2,258,563,543 2,246,218,539Retained earnings 629,443,824 564,144,213 568,093,265Equity holders’ interests 2,909,729,822 2,892,157,756 2,883,761,804
Current liabilities Other payables 867,504 850,371 856,743Current tax liabilities 690 680 11,936Proposed dividends 14,025,000 - 16,555,000 14,893,194 851,051 17,423,679
Total equity and liabilities 2,924,623,016 2,893,008,807 2,901,185,483
30 Jun 2009 2008 2007
Dividend income 964,544 709,615 946,726Share of profit of associates 101,538,133 32,124,564 240,964,991Other income 4,675 4,603 53,566Gross income 102,507,352 32,838,782 241,965,283Administrative expenses (1,027,216) (765,790) (589,508)Profit before finance cost 101,480,136 32,072,992 241,375,775Finance cost - - (697)Profit before taxation 101,480,136 32,072,992 241,375,078Income tax (690) (680) (11,936)Net profit for the year 101,479,446 32,072,312 241,363,142
STATISTICS
Number of ordinary shares used in calculation 550,000 550,000 550,000Earnings per share (Rs) 184.51 58.31 438.84Dividends per share (Rs) 101.00 74.50 99.10Net asset value per share (Rs) 5,290.42 5,258.47 5,243.20

DEM 2010 | 17The Stock Exchange of Mauritius Ltd.
Bychemex Limited
SEM Code : BYCH.I0000
Classification : Industry
Registered Office : Chaussée Tromelin, Fort George, Port-Louis
Board of Directors : HAREL Antoine L. - Chairman LEUNG SHING Georges NG KWING KING E. Harold MONTOCCHIO M.J. François RIVALLAND L. J. Michel G.O.S.K.
Company Secretary : HM Secretaries Ltd
Principal Activities : Manufacturer of specialty chemicals for textile industry
SUMMARY INFORMATION
Established in 1987, Bychemex Limited is a major supplier of basic and auxiliary chemicals to the textile industry. With consistent technical support and frequent visits of our principals, the Company endeavours to offer advice to its clients to improve their processes, thus adding value to our specialty products.

18 | DEM 2010The Stock Exchange of Mauritius Ltd.
INCOME STATEMENT (RS)
FINANCIAL REVIEW OF THE GROUP BALANCE SHEET (RS)
31 Dec 2009 2008 2007
ASSETS
Non-current assetsProperty, plant and equipment 8,770,106 7,799,149 8,135,836 Investment in securities 437,106 200,000 - 9,207,212 7,999,149 8,135,836 Current assetsInventories 5,072,673 5,825,585 5,285,920 Trade and other receivables 16,784,051 16,554,871 18,414,423 Receivable from other companies 11,973,590 8,957,713 10,505,047 Cash and cash equivalents 1,500,303 7,991,300 2,693,379 35,330,617 39,329,469 36,898,769
Total assets 44,537,829 47,328,618 45,034,605
EQUITY AND LIABILITIES
Capital and reservesShare capital 5,000,000 5,000,000 5,000,000 Retained earnings 25,094,457 24,093,531 22,708,366 Shareholders’ interest 30,094,457 29,093,531 27,708,366
LIABILITIES
Non-current liabilities Deferred tax liabilities 615,270 586,106 621,132
Current liabilities Trade and other payables 6,782,912 11,092,971 11,205,107 Payable to related companies 854,706 683,846 - Current tax liabilites 1,190,484 872,164 500,000 Dividends 5,000,000 5,000,000 5,000,000 13,828,102 17,648,981 16,705,107 Total liabilities 14,443,372 18,235,087 17,326,239
Total equity and liabilities 44,537,829 47,328,618 45,034,605
31 Dec 2009 2008 2007
Sales 74,808,923 71,971,286 75,782,477 Cost of sales (56,598,998) (54,670,655) (59,887,808)Gross profit 18,209,925 17,300,631 15,894,669 Other income 1,810,356 1,801,495 2,049,378 Operating expenses (13,937,346) (13,740,641) (11,716,704) 6,082,935 5,361,485 6,227,343 Net finance income 992,278 1,860,818 461,591 Profit before taxation 7,075,213 7,222,303 6,688,934 Income tax expense (1,074,287) (837,138) (566,979)Profit for the year 6,000,926 6,385,165 6,121,955
STATISTICS
Number of ordinary shares used in calculation 5,000,000 5,000,000 5,000,000Earnings per share (Rs) 1.20 1.28 1.22Dividends per share (Rs) 1.00 1.00 1.00Net asset value per share (Rs) 6.02 5.82 5.54

DEM 2010 | 19The Stock Exchange of Mauritius Ltd.
Chemco Limited
SEM Code : CHEM.I0000
Classification : Commerce
Registered Office : Chaussée Tromelin, Fort Georges, Port-Louis
Board of Directors : Antoine L. HAREL Georges LEUNG SHING M. J. François MONTOCCHIO E. Harold NG KWING KING L. J. Michel RIVALLAND G.O.S.K.
Company Secretary : HM Secretaries Ltd
Principal Activities : Chemicals, Commerce
SUMMARY INFORMATION
Established in 1984, Chemco Limited is a supplier of basic and specialty chemicals, agro-chemicals and specific general goods. The Company has also developed and enhanced its services and market share in supplying sugar processing chemicals to the major sugar mills which have recently undertaken projects to refine sugar locally. In addition it provides raw materials for paint industry, for detergent industry, chemicals and services for cooling water treatment and effluent water treatment, while also doing business in refrigerants, fertilizers, laboratory services, swimming pool chemicals, equipment and services, air conditioners, plastic resins, tyres and pesticides.

20 | DEM 2010The Stock Exchange of Mauritius Ltd.
INCOME STATEMENT (RS)
FINANCIAL REVIEW OF THE GROUP BALANCE SHEET (RS)
31 Dec 2009 2008 2007
ASSETS
Non-current assetsPlant and equipment 8,927,206 8,939,547 7,938,403 Investment in subsidiary companies - - - Investment in financial assets 51,206 31,496 32,512 Retirement benefit obligations 868,397 - - 9,846,809 8,971,043 7,970,915 Current assetsInventories 43,356,139 56,924,381 46,545,698 Trade and other receivables 64,113,634 70,872,233 74,144,912 Receivable from related companies 11,251,052 7,778,374 794,518 Cash and cash equivalents 3,100,953 5,279,681 5,998,964 121,821,778 140,854,669 127,484,092
Total assets 131,668,587 149,825,712 135,455,007
EQUITY AND LIABILITIES
Capital and reservesShare capital 6,208,722 6,208,722 6,208,722 Share premium 5,518,864 5,518,864 5,518,864 Other reserves 30,886 8,066 89,034 Retained earnings 48,419,437 34,153,809 24,013,886 Shareholders’ interests 60,177,909 45,889,461 35,830,506
LIABILITIES
Non-current liabilities Deferred tax liabilities 528,854 448,960 325,088
Current liabilities Trade and other payables 18,124,415 15,857,331 23,351,762 Payables to related companies 14,603,890 20,915,894 16,867,313 Current tax liabilities 1,787,687 4,721,245 926,386 Borrowings 29,616,238 53,921,482 51,945,230 Dividend 6,829,594 8,071,339 6,208,722 70,961,824 103,487,291 99,299,413 Total liabilities 71,490,678 103,936,251 99,624,501
Total equity and liabilities 131,668,587 149,825,712 135,455,007
31 Dec 2009 2008 2007
Sales 310,875,503 330,464,095 312,819,155 Cost of sales (242,390,858) (259,052,259) (258,211,111)Gross profit 68,484,645 71,411,836 54,608,044 Other income 1,548,945 4,567,896 2,405,300 Operating expenses (46,081,796) (50,517,092) (40,292,149) 23,951,794 25,462,640 16,721,195 Finance costs (1,902,100) (2,555,309) (7,836,166)Profit before taxation 22,049,694 22,907,331 8,885,029 Income tax expense (3,111,855) (4,696,069) (646,550) 18,937,839 18,211,262 8,238,479 Profit from discontinued operation 2,157,383 - - Profit for the year 21,095,222 18,211,262 8,238,479
STATISTICS
Number of ordinary shares used in calculation 6,208,722 6,208,722 6,208,722 Earnings per share (Rs) 3.40 2.93 1.33 Dividends per share (Rs) 1.10 1.30 1.00 Net asset value per share (Rs) 9.69 7.39 5.77

DEM 2010 | 21The Stock Exchange of Mauritius Ltd.
CIEL Investment Ltd
SEM Code : CIEL.I0000
Classification : Investment
Registered Office : 5th Floor, Ebène Skies, Rue de l’Institut, Ebène
Board of Directors : P. Arnaud DALAIS – (Chairman) Jan BOULLE G. Christian DALAIS Jean-Pierre DALAIS Maurice DALAIS Pierre DANON Louis GUIMBEAU Didier MERVEN Iqbal RAJAHBALEE Neermal SADDUL
Company Secretary : Ciel Corporate Services Ltd
Principal Activities : Investment Holding Company
SUMMARY INFORMATION
Ciel Investment Limited (CIL) is a public company incorporated on December 5, 1977, and quoted on the Development and Enterprise Market.
CIL is an investment company holding interests in a number of companies operating in various sectors of the Mauritian economy, the main ones being involved in tourism, property and commerce.
CIL is committed to the highest standard of business integrity, transparency and professionalism in all its activities to ensure that the activities within the company and group are managed ethically and responsibly to enhance business value for all stakeholders.

22 | DEM 2010The Stock Exchange of Mauritius Ltd.
INCOME STATEMENT (RS 000)
FINANCIAL REVIEW OF THE GROUP BALANCE SHEET (RS 000)
31 Mar 2010 2009 2008
ASSETSNon-current assetsProperty,plant and equipment 522,780 524,179 421,681 Investment properties 710,531 718,936 590,836 Intangible assets 174,745 60,246 92,404 Investments in Joint ventures 806,486 745,107 231,709 Investments in associates 2,945,196 3,199,114 2,985,018 Investments in other financial assets 231,541 187,596 516,336 Deposit on investments 79,617 300,656 370,181 Non-current receivables 6,000 8,529 18,162 Retirement benefit obligations 2,142 4,914 5,430 5,479,038 5,749,277 5,231,757 Current assetsInventories 111 116 114 Trade and other receivables 171,996 148,165 141,444 Cash and cash equivalents 175,052 41,661 476,408 347,159 189,942 617,966 Total assets 5,826,197 5,939,219 5,849,723 EQUITY AND LIABILITIESCapital and reservesStated Capital 1,328,349 2,174,237 2,174,237 Retained earnings 2,892,389 2,808,152 2,412,055 Revaluation, fair value and other reserves 709,105 550,097 819,826 Equity holder’s interests 4,929,843 5,532,486 5,406,118 Minority interests 18,686 2,803 2,141 Total equity 4,948,529 5,535,289 5,408,259 LIABILITIESNon-current liabilities Deferred tax liabilities 4,703 14,470 14,388 Borrowings 211,937 198,945 59,594 Retirement benefit obligations 2,288 1,335 659 218,928 214,750 74,641 Current liabilities Borrowings 376,336 7,822 10,876 Trade and other payables 266,547 167,525 256,714 Current tax liabilities 15,857 13,833 14,892 Proposed dividends - - 84,341 658,740 189,180 366,823
Total liabilities 877,668 403,930 441,464 TOTAL EQUITY AND LIABILITIES 5,826,197 5,939,219 5,849,723
31 Mar 2010 2009 2008
Revenue 215,541 291,650 356,019 Expenditure Management, administrative and general expenses 191,551 202,062 236,181 Depreciation 16,734 6,230 6,142 208,285 208,292 242,323 Profit before finance costs 7,256 83,358 113,696 Finance costs (46,418) (13,216) (14,945)Profit before exceptional items (39,162) 70,142 98,751 Exceptional items (58,327) (37,539) 15,473 Share of result of joint ventures 32,970 (4,927) (8,737)Share of result of associates 507,557 276,526 341,550 Profit before taxation 443,038 304,202 447,037 Income tax (94) (11,664) (11,071)Profit for the year 442,944 292,538 435,966 Owners of the parent 439,744 291,625 436,235 Minority interest 3,200 913 (269)Profit for the year 442,944 292,538 435,966
STATISTICSNumber of ordinary shares used in calculation 1,111,607 1,204,873 1,124,664 Earnings per share (Rs) 0.40 0.24 0.39Dividends per share (Rs) 0.07** 0.08* 0.10Net asset value per share (Rs) 5.46 4.59 4.49
“*Note: .05 cents declared on 14 April 2009 is for year ended 31 March 2009“**Note: .05 cents declared on 6 April 2010 is for year ended 31 March 2010

DEM 2010 | 23The Stock Exchange of Mauritius Ltd.
CIEL Textile Ltd
SEM Code : FKL.I0000
Classification : Others
Registered Office : 5th Floor, Ebène Skies, Rue de l’Institut, Ebène
Board of Directors : P. Arnaud DALAIS – Chairman G. Christian DALAIS Antoine DELAPORTE Henri DE PITRAY Jérome LAGESSE Harold MAYER Didier MERVEN Alain REY Eddy YEUNG KAN CHING Jérôme DE CHASTEAUNEUF (alternate to P. Arnaud DALAIS)
Company Secretary : Ciel Corporate Services Ltd
Principal Activities : Investment Holding Company
SUMMARY INFORMATION
Ciel Textile Limited (CTL) is a public company incorporated on January 19, 1971, and is quoted on the Development and Enterprise Market.
The principal activity of CTL is that of an investment holding company with interests in a number of companies involved in textile activities.
The Board of Directors of CTL has the overall responsibility of ensuring that the company complies with the standards of good corporate governance. It approves risk strategy and policies and delegates their formulation, implementation and monitoring to committees of the Board, auditors and senior management.

24 | DEM 2010The Stock Exchange of Mauritius Ltd.
INCOME STATEMENT (RS 000)
FINANCIAL REVIEW OF THE GROUP BALANCE SHEET (RS 000)
30 Jun 2010 2009 2008
ASSETS
Non-current assetsPlant and equipment 2,024,005 2,094,849 2,049,424 Intangible assets 5,404 4,362 1,707 Investments in: Associates 33,218 45,365 39,847 Others 21,665 9,185 9,185 54,883 54,550 49,032 Non-currents receivables 747 764 7,262 Deferred income tax assets 41,655 68,804 67,485 2,126,694 2,223,329 2,174,910
Current assetsInventories 1,521,844 1,771,520 1,581,563 Trade and other receivables 1,774,076 1,812,804 1,881,794 Cash in hand and at bank 287,609 212,544 165,558 3,583,529 3,796,868 3,628,915
Total assets 5,710,223 6,020,197 5,803,825
EQUITY AND LIABILITIES
Capital and reservesShare capital 685,865 685,865 685,865 Revaluation and other reserves 485,749 492,014 451,838 Retained earnings 972,204 990,593 998,183 2,143,818 2,168,472 2,135,886 Minority interests 132,389 106,857 78,531 Redeemable preference share capital 448,937 448,937 448,937
Total equity 2,725,144 2,724,266 2,663,354
LIABILITIES
Non-current liabilities Borrowings 104,890 104,132 375,540 Deferred income tax liabilities 91,451 98,395 101,184 Retirement benefit obligations 13,336 14,317 43,995 Other financial liability 72,636 85,382 107,117 282,313 302,226 627,836
Current liabilities Trade and other payables 1,602,372 1,891,928 1,706,226 Borrowings 1,091,990 1,093,486 781,891 Current tax liabilities 8,404 6,091 20,515 Dividends payable on preference shares - 2,200 4,003 2,702,766 2,993,705 2,512,635
Total liabilities 2,985,079 3,295,931 3,140,471
TOTAL EQUITY AND LIABILITIES 5,710,223 6,020,197 5,803,825
30 Jun 2010 2009 2008
Turnover 6,862,813 6,523,232 6,545,145 Profit before depreciation and amortisation 433,457 422,272 782,484 Other Operating Income / (Costs) - 19,296 (12,362)Depreciation and amortisation (221,493) (211,016) (213,836)Operating profit 211,964 230,552 556,286 Net finance costs (99,969) (111,200) (105,443)Share of (losses) / profits of associates (14,669) 10,062 14,620 Profit before taxation 97,326 129,414 465,463 Taxation (35,427) (2,678) (4,257)Profit for the year 61,899 126,736 461,206
Attributable to: Equity holders of the parent 37,641 114,422 448,445 Minority interests 24,258 12,314 12,761 Profit for the year 61,899 126,736 461,206
STATISTICS
Number of ordinary shares used in calculation 101,807,589 101,807,589 101,807,589 Earnings per share (Rs) 0.37 1.12 4.40Dividends per share (Rs) 0.37 0.37 0.50Net asset value per share (Rs) 21.06 21.30 20.98
DEM 2010 | 25The Stock Exchange of Mauritius Ltd.
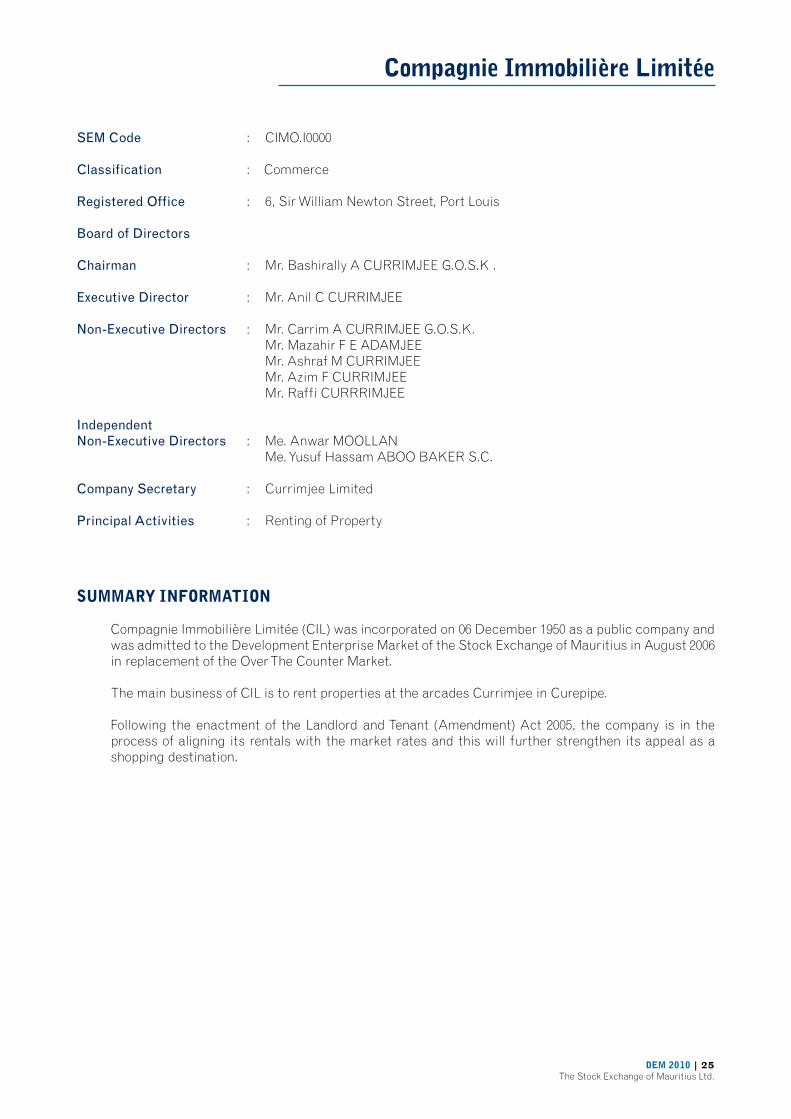
Compagnie Immobilière Limitée
SEM Code : CIMO.I0000
Classification : Commerce
Registered Office : 6, Sir William Newton Street, Port Louis
Board of Directors
Chairman : Mr. Bashirally A CURRIMJEE G.O.S.K . Executive Director : Mr. Anil C CURRIMJEE
Non-Executive Directors : Mr. Carrim A CURRIMJEE G.O.S.K. Mr. Mazahir F E ADAMJEE Mr. Ashraf M CURRIMJEE Mr. Azim F CURRIMJEE Mr. Raffi CURRRIMJEE
Independent Non-Executive Directors : Me. Anwar MOOLLAN Me. Yusuf Hassam ABOO BAKER S.C.
Company Secretary : Currimjee Limited
Principal Activities : Renting of Property
SUMMARY INFORMATION
Compagnie Immobilière Limitée (CIL) was incorporated on 06 December 1950 as a public company and was admitted to the Development Enterprise Market of the Stock Exchange of Mauritius in August 2006 in replacement of the Over The Counter Market.
The main business of CIL is to rent properties at the arcades Currimjee in Curepipe.
Following the enactment of the Landlord and Tenant (Amendment) Act 2005, the company is in the process of aligning its rentals with the market rates and this will further strengthen its appeal as a shopping destination.

26 | DEM 2010The Stock Exchange of Mauritius Ltd.
INCOME STATEMENT (RS)
FINANCIAL REVIEW OF THE GROUP BALANCE SHEET (RS)
31 Dec 2009 2008 2007
ASSETS
Non-current assetsProperty,plant and equipment 1,258,078 1,996,567 2,669,205 Intagible assets 70,424 140,828 -Investment Property 235,550,000 196,949,377 196,717,949 237,022,263 199,086,772 199,387,154
Current assetsTrade and other receivables 7,245,355 6,230,568 3,706,891 Cash in hand and at bank 72,638 57,461 21,759 7,371,993 6,288,029 3,728,650 Total assets 244,340,256 205,374,801 203,115,804
EQUITY AND LIABILITIES
Capital and reservesStated capital 2,664,000 2,664,000 2,664,000 Share premium 36,007,074 36,007,074 36,007,074 Investment property revaluation reserve 108,003,873 108,003,873 108,003,873 Retained earnings 93,553,155 51,094,936 47,169,932
Total equity 240,228,102 197,769,883 193,844,879
LIABILITIES
Non-current liabilities Borrowings - 658,614 2,467,606 Retirement benefit obligations 281,000 256,000 250,000 Deferred tax liabilities - 33,431 26,781 281,000 948,045 2,744,387
Current liabilities Bank overdraft 57,707 1,191,362 955,415 Borrowings 649,732 1,787,207 2,177,619 Trade and other payables 2,897,595 2,906,343 2,868,883 Taxation 226,120 771,961 524,621 3,831,154 6,656,873 6,526,538 Total equity and liabilities 244,340,256 205,374,801 203,115,804
31 Dec 2009 2008 2007
Revenue 14,638,660 15,812,006 10,247,652 Other Income 1,973 10,462 4,786 Adminitrative Expenses (6,707,585) (8,638,694) (6,009,301)Finance Costs (173,463) (515,304) (624,942)Profit for the year before taxation 45,885,647 6,668,470 3,618,195 Taxation (1,029,828) (1,145,066) (513,447)Profit for the year 44,855,819 5,523,404 3,104,748
STATISTICS
Number of ordinary shares used in calculation 266,400 266,400 266,400Earnings per share (Rs) 168.38 20.73 11.65Dividends per share (Rs) 9.00 6.00 3.00Net asset value per share (Rs) 901.76 742.38 727.65
DEM 2010 | 27The Stock Exchange of Mauritius Ltd.
Constance La Gaieté Company Limited
SEM Code : CSE.I0000
Classification : Sugar
Registered Office : 5th, Labama House, 35 Sir William Newton Street, Port-Louis
Board of Directors : Mr George DUMBELL – Chairperson Mr Adolphe VALLET Mr Clément REY Mrs Georgina ROGERS Mr Jean Juppin DE FONDAUMIèRE Mr Louis RIVALLAND Mr Jean RIBET Mr Clément Labauve D’ARIFAT REY Mr Arnaud DALAIS Mr Jean Jacques VALLET Mr Noel Adolphe VALLET
Company Secretary : La Gaiété Services Ltd
Principal Activities : Sugar and other agro-industrial activities
SUMMARY INFORMATION
Founded in 1882 Constance La Gaiété Company Limited produces some 155,000 tons of sugar cane on 2,200 hectares on the eastern part of Mauritius. Its milling activities were centralized on Deep River Beau Champ Milling Co Ltd in 1998. It is also involved in other agro industrial activities and real estates projects.

28 | DEM 2010The Stock Exchange of Mauritius Ltd.
INCOME STATEMENT (RS 000)
FINANCIAL REVIEW OF THE GROUP BALANCE SHEET (RS 000)
31 Dec 2009 2008 2007
ASSETS
Non-current assetsProperty,plant and equipment 318,809 318,295 340,032 Investment property 6,605 7,455 8,309 Intangible assets 1,240 1,471 - Investments in subsidiary companies - - - Investments in associated companies 202,776 215,848 196,835 Investments in financial assets 39,251 39,853 48,345 Deferred expenditure 46,287 53,991 35,785 Bearer biological assets 35,359 34,463 31,233 650,327 671,376 660,539 Current assetsConsumable biological assets 34,086 36,322 61,389 Inventories 6,880 9,709 5,392 Trade and other receivables 171,827 230,762 292,861 Bank balances and cash 168,347 68,423 1,069 381,140 345,216 360,711 Non-current assets held for sale 39,267 19,114 -
Total assets 1,070,734 1,035,706 1,021,250
EQUITY AND LIABILITIES
Capital and reservesShare Capital 120,000 120,000 120,000 Reserves 190,041 191,508 201,602 Retained earnings 361,250 343,141 320,542 Equity holder’s interests 671,291 654,649 642,144
LIABILITIES
Non-current liabilities Borrowings 823 823 1,223 Retirement benefit obligations 76,793 75,517 80,011 77,616 76,340 81,234
Current liabilities Trade and other payables 297,665 296,501 264,726 Borrowings 4,962 8,216 33,146 Dividend payable 19,200 - - 321,827 304,717 297,872
Total liabilities 399,443 381,057 379,106 Total equity and liabilities 1,070,734 1,035,706 1,021,250
31 Dec 2009 2008 2007
Revenue Sugar, molasses and bagasse 214,214 185,287 169,898 Other operating revenue 116,488 105,227 100,756 330,702 290,514 270,654 SIFB compensation 102 19,605 47,455 330,804 310,119 318,109 Biological assets - bearer 896 3,230 222 - consumable (2,236) (25,067) (10,285)Operating expenses (327,291) (315,908) (328,213)Operating loss 2,173 (27,626) (20,167)Other income 47,145 37,473 100,568 49,318 9,847 80,401 Finance costs (394) (3,425) (5,042)Profit from ordinary activities 48,924 6,422 75,359 VRS costs written off (3,094) (20,673) (106,148) 45,830 (14,251) (30,789)Share of profit/(loss) from associated companies (6,489) 33,363 19,660 Profit/(loss) before taxation 39,341 19,112 (11,129)Taxation (7,704) 18,206 23,475 Profit/(loss) for the year 31,637 37,318 12,346
STATISTICS
Number of ordinary shares used in calculation 4,800,000 4,800,000 4,800,000 Earnings per share (Rs) 6.59 7.77 2.57Dividends per share (Rs) 4.00 3.25 3.25Net asset value per share (Rs) 139.85 136.39 133.78

DEM 2010 | 29The Stock Exchange of Mauritius Ltd.
Constance Hotels Services Limited
SEM Code : CHSL.I0000
Classification : Leisure & Hotels
Registered Office : 5th Floor, Labama House, 35 Sir William Newton Street, Port-Louis
Board of Directors : Mr George DUMBELL – Chairperson Mr Adolphe VALLET Mr Jean Pierre DALAIS Mr. Jerôme DE CHASTEAUNEUF Mr Louis RIVALLAND Mr Clément REY Mr Stéphane LEAL Mr Patrice BINET-DECAMPS Mr Jean Lartigue RIBET Mr Clément Labauve D’ARIFAT REY Mr Iqbal MALLAM-HASHAM Mr Noel Adolphe VALLET
Company Secretary : La Gaiété Services Ltd
Principal Activities : Owner and manager of hotels
SUMMARY INFORMATION
Constance Hotels Services Limited was incorporated on 15 May 1984. In addition to the hotels it owns in Mauritius, namely Constance Belle Mare Plage and Constance Le Prince Maurice, the Company has equity participation and management contracts in respect of hotels in the Seychelles, Madagascar and Maldives.

30 | DEM 2010The Stock Exchange of Mauritius Ltd.
INCOME STATEMENT (RS 000)
FINANCIAL REVIEW OF THE GROUP BALANCE SHEET (RS 000)
31 Dec 2009 2008 2007
ASSETS
Non-current assetsProperty, plant and equipment 2,368,929 2,215,709 2,166,041Intangible assets 380,829 366,344 63,826Investments in subsidiary companies - - -Investments in associated companies 893,202 847,332 593,811Investments in financial assets 1,700 1,700 200Retirement benefit obligations 1,702 1,326 700Loans to related companies 98,348 103,894 -Deferred tax assets 3,706 20,560 53,391 3,748,416 3,556,865 2,877,969
Current assetsInventories 115,886 116,480 90,178Trade and other receivables 495,360 450,716 393,795Cash and cash equivalents 35,001 47,127 82,790 646,247 614,323 566,763
Total assets 4,394,663 4,171,188 3,444,732
EQUITY AND LIABILITIES
Capital and reservesStated capital 936,783 936,783 936,783Other reserves 138,364 191,379 144,507Retained earnings 967,537 1,083,834 997,165Equity holders’ interest 2,042,684 2,211,996 2,078,455Minority interest 2,780 2,480 3,362
Total equity 2,045,464 2,214,476 2,081,817
Non-current liabilities Borrowings 1,426,371 467,859 407,825Deferred tax liabilities 78,149 31,846 25,612Retirement benefit obligations 17,802 14,848 14,631 1,522,322 514,553 448,068
Current liabilities Trade and other payables 280,274 270,101 231,573Borrowings 529,590 1,137,501 610,228Current tax liabilities 1,022 2,575 9,082Proposed dividend 15,991 31,982 63,964 826,877 1,442,159 914,847
Total liabilities 2,349,199 1,956,712 1,362,915 Total equity and liabilities 4,394,663 4,171,188 3,444,732
31 Dec 2009 2008 2007
Revenue 1,444,609 1,577,450 1,750,750 Operating profit 235,268 311,078 463,404Finance costs (127,014) (142,451) (128,569)Share of results of associates (90,619) 53,302 70,565Profit before taxation 17,635 221,929 405,400Taxation (75,210) (53,288) (39,414)(Loss)/Profit for the year (57,575) 168,641 365,986Minority interest (10,749) (10,451) (10,062)(Loss)/Profit attributable to equity holders (68,324) 158,190 355,924
STATISTICS
Number of ordinary shares used in calculation 63,964 63,964 63,964Earnings per share (Rs) (1.07) 2.47 5.56 Dividends per share (Rs) 0.75 1.50 2.00 Net asset value per share (Rs) 31.93 34.58 32.49

DEM 2010 | 31The Stock Exchange of Mauritius Ltd.
Compagnie Des Villages De Vacances De L’Isle De France Limitée
SEM Code : COVI.I0000
Classification : Others
Registered Office : C/o Club Méditerranée, Pointe aux Canonniers
Board of Directors : Sophie BARRAULT Colette BROCHEN Marie Jeanne LI YING PIN Anne Dominique GOBERT Saliha ABDOU Sunil Kumar KOOSUL Silverio EDOUARD
Company Secretary : Financial Consulting Associates Ltd
Principal Activities : Renting of hotel establishment
SUMMARY INFORMATION
Since the formation of COVIFRA in 1972, the company has rented its investment properties, plant and equipment to Holiday Villages Management Services (Mauritius) Limited (“HVMS”) which operates the Club Med Hotel at La Pointe aux Canonniers.

32 | DEM 2010The Stock Exchange of Mauritius Ltd.
INCOME STATEMENT (RS)
FINANCIAL REVIEW OF THE GROUP BALANCE SHEET (RS)
31 Oct 2009 2008 2007
ASSETS
Non-current assetsInvestment Properties 1,753,137,748 1,745,500,000 1,360,847,024 Equipment 141,607,999 161,292,416 29,134,302 1,894,745,747 1,906,792,416 1,389,981,326
Current assetsTrade and other receivables 127,187,253 211,686,709 131,526,907 Cash in hand and at bank 2,814,716 66,238,783 67,447,755 130,001,969 277,925,492 198,974,662 Total assets 2,024,747,716 2,184,717,908 1,588,955,988
EQUITY AND LIABILITIES
Capital and reservesStated capital 566,100,000 566,100,000 566,100,000 Retained profits 16,858,388 143,542,881 300,504,739
Total equity 582,958,388 709,642,881 866,604,739
LIABILITIES
Non-current liabilities Loan 24,226,145 26,464,899 28,481,789 Other payables 3,824,225 408,310 408,392 Deferred tax 74,683,615 86,480,636 91,305,131 102,733,985 113,353,845 120,195,312 Current liabilities Loan 5,149,893 5,149,893 5,149,893 Loan from holding company 1,160,439,800 1,059,962,800 - Amount due to fellow subsidiary 4,388,929 4,388,929 83,434,607 Amount due to holding company 163,475,491 277,230,567 511,907,000 Other payables 5,601,230 14,988,993 1,664,437 1,339,055,343 1,361,721,182 602,155,937
Total liabilities 1,441,789,328 1,475,075,027 722,351,249
TOTAL EQUITY AND LIABILITIES 2,024,747,716 2,184,717,908 1,588,955,988
31 Oct 2009 2008 2007
Income Revenue 134,032,082 133,588,922 59,535,385 Interest income 989,059 3,168,279 2,217,226 Other income - 422,238 - Gain on revaluation of investment properties - - 239,184,368 135,021,141 137,179,439 300,936,979 Expenses Amount written off investment properties - - 26,047,245 Loss on disposal of property,plant and equipment - - 6,207,480 Loss on revaluation of investment properties - 167,975,116 - Depreciation 19,588,266 18,787,710 8,511,031 Interest expense 90,299,482 77,451,572 3,944,295 General expenses 4,143,287 1,485,841 833,919 Exchange loss 102,786,620 33,175,553 2,164,043 Auditors’ remuneration - audit fees 75,000 75,000 75,000 - other fees - 15,000 15,000 216,892,655 298,965,792 47,798,013 (Loss)/Profit before taxation (81,871,514) (161,786,353) 253,138,966 Taxation 11,797,021 4,824,495 (70,735,589)(Loss)/Profit for the year (70,074,493) (156,961,858) 182,403,377
STATISTICS
Number of ordinary shares used in calculation 56,610,000 56,610,000 56,610,000 (Loss)/earnings per share (Rs) (1.24) (2.77) 3.22 Dividends per share (Rs) 1.25 - - Net asset value per share (Rs) 10.30 12.54 15.31

DEM 2010 | 33The Stock Exchange of Mauritius Ltd.
Deep River-Beau Champ Limited
SEM Code : DRBC.I0000
Classification : Sugar
Registered Office : 5th Floor, Ebène Skies, Rue de l’Institut, Ebène
Board of Directors : Thierry LAGESSE (Chairman) G. Christian DALAIS P. Arnaud DALAIS Maurice DALAIS Bernard DALAIS Jean DE FONDAUMIERE Louis GUIMBEAU Jean Claude HAREL Arnaud LAGESSE J. Cyril LAGESSE Robert LAGESSE Didier MERVEN Adolphe VALLET
Company Secretary : Ciel Corporate Services Ltd
Principal Activities : Sugar cane growing and other agricultural activities.
SUMMARY INFORMATION
Deep River-Beau Champ Limited (DRBC) is a public company incorporated on April 18, 1913, and quoted on the Development and Enterprise Market.
DRBC is engaged in sugar cane growing and other agricultural activities. The group operates two sugar milling factories, a bagasse and coal based power generation plant and holds a portfolio of investments. DRBC is also involved in property development and management.
DRBC is committed to the highest standard of business integrity, transparency and professionalism in all its activities to ensure that the activities within the Company and Group are managed ethically and responsibly to enhance business value for all stakeholders.

34 | DEM 2010The Stock Exchange of Mauritius Ltd.
FINANCIAL REVIEW OF THE GROUP BALANCE SHEET (RS 000)
30 Jun 2009 2008 2007 Restated
ASSETS EMPLOYED
Non-current assetsProperty, plant and equipment 7,915,551 4,089,333 3,576,091 Land-projects 10,423 11,484 13,300 Investment property 1,231 1,073 1,099 Intangible assets 44,382 - 1,039 Investment in subsidiary companies - - - Investment in associated companies 112,292 277,443 224,616 Investment in joint ventures 669,009 250,534 139,205 Investment in securities 60,862 69,660 78,783 Deposit on investment 5,000 90,924 - Bearer biological assets 242,463 171,520 181,730 Non-current receivables 177,034 176,183 53,608 Deferred expenditure 1,004,155 836,013 925,622 Deferred tax assets 6,907 34,531 37,554 10,249,309 6,008,698 5,232,647
Current assetsDeferred expenditure 112,465 97,640 35,894 Inventories 222,997 202,326 241,917 Consumable biological assets 1,201,252 1,101,506 1,251,504 Trade and other receivables 453,953 324,686 640,511 Current tax assets 60,928 24,501 26,802 Retirement benefit asset 943 - - Short term deposits 4,707 - - Cash in hand and at bank 58,888 67,466 93,256 2,116,133 1,818,125 2,289,884
Total assets 12,365,442 7,826,823 7,522,531
EQUITY AND LIABILITIES
Capital and reservesShare capital 93,600 93,600 93,600 Revaluation and other reserves 4,766,337 1,084,183 1,146,695 Retained earnings 2,163,158 1,980,368 1,688,111 Shareholders’ interests 7,023,095 3,158,151 2,928,406 Loans 68,010 217,460 165,107 Minority interests 1,204,465 932,647 906,752 8,295,570 4,308,258 4,000,265
Non-current liabilities Borrowings 746,554 761,006 820,574 Deferred tax liabilities 555,587 394,602 411,106 Retirement benefit obligations 144,368 117,887 217,589 1,446,509 1,273,495 1,449,269
Current liabilities Trade and other payables 632,028 434,445 596,527 Current tax liabilities 25,635 27,412 29,536 Borrowings 1,922,644 1,740,157 1,403,878 Proposed dividend 43,056 43,056 43,056 2,623,363 2,245,070 2,072,997 Total equity and liabilities 12,365,442 7,826,823 7,522,531

DEM 2010 | 35The Stock Exchange of Mauritius Ltd.
FINANCIAL REVIEW OF THE GROUP INCOME STATEMENT (RS 000)
30 Jun 2009 2008 2007 Restated
Turnover 4,036,434 3,253,477 2,581,633 SIFB compensation 49,600 97,263 60,991 (Losses) /gains arising from changes in fair value of biological assets 25,142 (77,040) 279,565 Other operating income 186,334 118,311 72,323 4,297,510 3,392,011 2,994,512 Operating expenses (3,475,033) (2,918,467) (2,375,982) Operating profit 822,477 473,544 618,530 VRS amortisation and other expenses (14,987) (8,631) (19,709)Investment and other income 5,159 5,072 7,851 Finance costs (234,576) (229,126) (146,945) Profit before exceptional items 578,073 240,859 459,727 Exceptional items 8,000 40,684 - Profit after exceptional items 586,073 281,543 459,727 Share of results of joint ventures 37,907 79,992 (20,038)Share of results of associates 2,015 84,412 76,309 Profit before taxation 625,995 445,947 515,998 Income tax charge (191,741) (56,616) (96,490) Net profit after taxation 434,254 389,331 419,508 Minority interests (185,944) (52,021) (117,601) Profit attributable to equity holders of the company 248,310 337,310 301,907
STATISTICS
Number of ordinary shares used in calculation 8,826,794 8,826,794 8,826,794 Earnings per share (Rs) 27.71 37.79 33.78 Dividends per share (Rs) 7.00 7.00 7.00 Net asset value per share (Rs) 934.79 488.09 453.08

36 | DEM 2010The Stock Exchange of Mauritius Ltd.
Deep River Investment Limited
SEM Code : DRIL.I0002
Classification : Investment
Registered Office : 5th Floor, Ebène Skies, Rue de l’Institut, Ebène
Board of Directors : G. Christian DALAIS – (Chairman) P. Arnaud DALAIS Jean Pierre DALAIS Bernard DALAIS Maurice DALAIS Louis GUIMBEAU Guy HUGNIN Didier MERVEN Jean-Michel PITOT Dominique ROUSSET
Company Secretary : Ciel Corporate Services Ltd
Principal Activities : Investment Holding Company
SUMMARY INFORMATION
Deep River Investment Limited (DRI) is a public company incorporated on August 31, 1948, and is quoted on the Development and Enterprise Market.
The principal activity of DRI is that of an investment holding company with investments in three companies, namely, Ciel Investment Limited, Deep River-Beau Champ Limited and Ciel Textile Limited.
DRI is committed to the highest standard of business integrity, transparency and professionalism in all its activities to ensure that the activities within the company and group are managed ethically and responsibly to enhance business value for all stakeholders.

DEM 2010 | 37The Stock Exchange of Mauritius Ltd.
INCOME STATEMENT (RS 000)
FINANCIAL REVIEW OF THE GROUP BALANCE SHEET (RS 000)
30 Jun 2009 2008 2007
ASSETS
Non-current assetsInvestments in associates 4,500,187,228 3,177,299,971 2,960,974,443
Current assetsTrade and other receivables 15,757,731 15,822,731 15,622,731Investments in securities 259,225 341,725 318,975 16,016,956 16,164,456 15,941,706
Total assets 4,516,204,184 3,193,464,427 2,976,916,149
EQUITY AND LIABILITIES
Capital and reservesShare capital 8,226,650 8,226,650 8,226,650Fair value reserves 125,595 208,095 185,345Other associates’ reserves 2,331,156,823 1,167,836,639 1,308,077,397Retained earnings 2,120,593,297 1,930,749,927 1,644,800,586Shareholders’ interest 4,460,102,365 3,107,021,311 2,961,289,978
Current liabilities Trade and other payables 7,401,535 6,228,902 62,343Current tax liabilities 26,347 27,179 44,792Borrowings 48,673,937 46,786,836 217,467Proposed dividends - 33,400,199 15,301,569 56,101,819 86,443,116 15,626,171 Total equity and liabilities 4,516,204,184 3,193,464,427 2,976,916,149
30 Jun 2009 2008 2007
Share of results of associates net of tax 177,003,822 274,631,056 366,969,954Dividend and other income 216,533 215,000 214,900Total revenue 177,220,355 274,846,056 367,184,854Administrative expenses (378,924) (263,056) (126,319)Other operating expenses (609,269) (615,908) (152,028)Finance costs (6,766,260) (6,188,734) (2,554) Profit before taxation 169,465,902 267,778,358 366,903,953Income tax (26,347) (27,179) (44,792) Net profit 169,439,555 267,751,179 366,859,161
STATISTICS
Number of ordinary shares used in calculation 822,665 822,665 822,665Earnings per share (Rs) 205.96 325.47 445.94Dividends per share (Rs) 28.00 73.40 73.40Net asset value per share (Rs) 5,489.72 3776.78 3599.63
38 | DEM 2010The Stock Exchange of Mauritius Ltd.
ENL Investment Limited
SEM Code : ENIT.I0000
Classification : Investment
Registered Office : 7th Floor, Swan Group Centre, Intendance Street, Port Louis
Board of Directors : Guy RIVALLAND – (Chairman) Hector ESPITALIER-NOËL Eric ESPITALIER-NOËL Gilbert ESPITALIER-NOËL M P Roger ESPITALIER-NOËL
Company Secretary : ENL Limited
Principal Activities : Investment Company
SUMMARY INFORMATION
ENL Investment is one of the largest publicly traded companies in Mauritius, dealing in shares and securities, a large number of which are quoted on the Stock Exchange of Mauritius. It holds a very attractive investment portfolio that covers all key sectors of the local economy. ENL Investment owns and manages sizeable shareholdings in some of the major groups of companies in Mauritius such as New Mauritius Hotels, MADCO/ Food and Allied Industries and Rogers Consolidated Shareholding in addition to smaller stakes in a number of local companies.
The Food & Allied Group figures among the leading companies in Mauritius. It is a diversified agro-industrial group and also the promoter of the Labourdonnais Waterfront Hotel, a high-end business hotel situated in the Caudan Waterfront complex and The Suffren Hotel & Marina.
The Rogers Group, the largest conglomerate in Mauritius, owns and manages over 150 subsidiaries and associated companies in the tourism, aviation, logistics, and financial services sectors.
ENL Investment also has interests in New Mauritius Hotels, promoter of the Beachcomber group of hotels. Beachcomber opened its first hotel in 1952 and has ever since played a significant role in the development of quality tourism. The group owns and operates some of the most prestigious beach hotels, located on the most stunning sites of the Mauritian coastline as well as in Seychelles.

DEM 2010 | 39The Stock Exchange of Mauritius Ltd.
INCOME STATEMENT (RS 000)
FINANCIAL REVIEW OF THE GROUP BALANCE SHEET (RS 000)
30 Jun 2009 2008 2007
ASSETS
Non-current assetsAvailable-for-sale securities: Investments in associates 3,008,098 3,473,655 1,746,562 Investments in financial assets 1,901,103 1,861,184 1,546,150 4,909,201 5,334,839 3,292,712 Current assetsTrade and other receivables 5,466 3,646 318 Held-for-trading securities 30,715 33,953 33,440 Receivable from group companies 2,362 89,671 29,289 Cash and cash equivalents 2,134 1,466 5,907 40,677 128,736 68,954
Total assets 4,949,878 5,463,575 3,361,666
EQUITY AND LIABILITIES
Capital and reservesShare Capital 1,612,984 967,608 967,608 Other reserves 2,043,819 2,785,605 1,887,277 Application monies - 645,376 - Retained earnings 1,099,186 768,749 462,531 Shareholders’ interests 4,755,989 5,167,338 3,317,416
LIABILITIES
Non-current liabilities Borrowings 123,687 39,916 3,500
Current liabilities Trade and other payables 2,850 1,618 2,955 Payable to group companies 9,026 207,475 4,014 Current tax liabilities 359 518 879 Current borrowings 23,451 17,308 3,500 Proposed dividends 34,516 29,402 29,402 70,202 256,321 40,750
Total liabilities 193,889 296,237 44,250 Total equity and liabilities 4,949,878 5,463,575 3,361,666
30 Jun 2009 2008 2007
Dividends receivable 52,055 57,871 48,764 Interest receivable 3,874 4,584 8,025 55,929 62,455 56,789 Administrative expenses 6,271 6,312 3,129 Management fees 23,500 24,906 19,514 29,771 31,218 22,643 26,158 31,237 34,146 Fair value adjustments (3,194) 513 14,470 Finance costs (19,866) (4,583) (9,293)Share of profit of associates 541,180 212,154 144,716 Profit before exceptional items 544,278 239,321 184,039 Exceptional items 20,476 165,210 - Profit before income tax 564,754 404,531 184,039 Income tax expense (403) (518) (879)Profit for the year 564,351 404,013 183,160
STATISTICS
Weighted Average number of ordinary shares used in calculation 85,028,000 73,504,000 73,504,000 Earnings per share (Rs) 6.64 5.50 2.49 Dividends per share (Rs) 1.30 1.30 1.20 Net asset value per share (Rs) 55.93 70.30 45.13

40 | DEM 2010The Stock Exchange of Mauritius Ltd.
ENL Limited
SEM Code : ENL.J0000
Classification : Investment
Registered Office : 7th Floor, Swan Group Centre, Intendance Street, Port Louis
Board of Directors : Guy RIVALLAND – (Chairman) Hector ESPITALIER-NOËL Eric ESPITALIER-NOËL Gilbert ESPITALIER-NOËL Jacques ESPITALIER NOËL M P Roger ESPITALIER NOËL Edouard ESPITALIER NOËL Philippe ESPITALIER NOËL Patrice de ROBILLARD Robert ESPITALIER NOËL
Company Secretary : Hector Espitalier-Noël
Principal Activities : Investment and Management Company
SUMMARY INFORMATION
ENL Limited is a leading and rapidly growing business group in Mauritius. It is engaged in a well diversified range of activities covering the main economic pillars of the national economy. The group ranks among the conglomerates with the strongest asset base in the island.
ENL’s business activities are organised in five clusters for a more focussed and effective management.
ENL Agribusiness manages the traditional agricultural activities of the group namely sugar cane cultivation. Its operational arm remains The Savannah Sugar Estates Company Limited (SAV) which effective 31 December 2009, had amalgamated with Mon Désert-Alma Limited such that SAV now remains as the amalgamated company. ENL Agribusiness has also put into place a diversification program and is actively involved in the production of other agro industrial products such as a wide variety of food crops, flowers, ornamental plants, poultry farming, cattle and deer farming. Its activities are also reinforced by Agrex for the sale of flowers on the local and overseas market and ESP Landscapers for the design, implementation and maintenance of landscaping projects for hotels and individuals.
ENL Commercial regroups more than a dozen companies engaged in varied activities, ranging from car dealership, express courier services, timber merchandising to the production of upholstery and soft furnishings for the hospitality sector and stationary for office use.
Through ENL Investment, the group holds and manages sizeable shareholdings in leading companies such as Rogers Consolidated Shareholding, New Mauritius Hotels, Food and Allied Industries and MADCO.
Property development is a new and promising line of business that ENL has been engaged into for a few years now. This has led to the creation of ENL Property, a cluster dedicated mainly to bringing value to land owned through SAV.
ENL Property is currently engaged in two major developments under the Integrated Resorts Scheme, namely La Balise Marina and Villas Valriche. Several other landmark residential, commercial and business park projects are under construction, the most ambitious one being the creation of a signature satellite-town in the Bagatelle/ Réduit region. The innovative mixed-use estate Les Allées d’Helvetia in Moka has, on the other hand, already reached advanced construction stage.
Since its incorporation in 1944, ENL has grown into one of the most influential wealth creators of the country. The Espitalier-Noël name has been respected in Mauritius for decades for its adherence to strong values and business ethics. These values and ethics have recently been translated into a stated commitment to promote sustainable development. To this end, the group has pledged support to youth development as well as to the preservation and enhancement of the natural environment. The ENL Foundation has been created to implement the group’s policy as far as Corporate Social Responsibility is concerned. ENL Corporate Services is the fifth cluster to complete the ENL group structure.

DEM 2010 | 41The Stock Exchange of Mauritius Ltd.
FINANCIAL REVIEW OF THE GROUP BALANCE SHEET (RS 000)
30 Jun 2009 2008 2007
ASSETS
Non-current assetsProperty, plant and equipment 8,112,665 3,476,897 3,764,949 Investment properties 15,754 18,990 19,727 Deferred expenditure 432,964 473,639 327,837 Intangible assets 805,894 281,851 64,531 Investments in associates 3,219,139 3,889,128 2,828,746 Investments in financial assets 1,209,086 2,175,078 1,941,573 Deposit on investments 9,237 31,448 - Bearer biological assets 132,942 133,983 134,014 Non-current receivables 36 36 83,364 Deferred tax assets 705 5,153 9,312 13,938,422 10,486,203 9,174,053
Current assetsInventories 349,679 327,522 379,219 Consumable biological assets 324,697 306,094 361,536 Trade and other receivables 462,397 486,784 402,653 Held for trading securities 55,734 62,833 60,930 Cash in hand and at bank 50,728 49,367 45,101 1,243,235 1,232,600 1,249,439 Non-current assets held for sale 60,864 75,693 -
Total assets 15,242,521 11,794,496 10,423,492
EQUITY AND LIABILITIES
Capital and reservesShare capital 14,256 14,256 14,256 Other reserves 6,037,713 4,433,140 3,475,720 Retained earnings 1,581,429 664,154 750,339 Equity holders’ interests 7,633,398 5,111,550 4,240,315 Non-controlling interests 4,404,234 2,746,330 2,347,600 12,037,632 7,857,880 6,587,915
LIABILITIES
Non-current liabilities Borrowings 929,806 1,465,501 1,539,990 Deferred tax liabilities 3,867 4,108 2,841 Retirement benefit obligations 206,709 201,832 316,836 Deferred Income 244,400 - - 1,384,782 1,671,441 1,859,667
Current liabilities Trade and other payables 909,910 573,528 432,556 Payable to group companies - - - Current tax liabilities 9,973 8,448 12,501 Current borrowings 871,712 1,668,943 1,516,597 Proposed dividends 28,512 14,256 14,256 1,820,107 2,265,175 1,975,910
Total liabilities 3,204,889 3,936,616 3,835,577 Total equity and liabilities 15,242,521 11,794,496 10,423,492

42 | DEM 2010The Stock Exchange of Mauritius Ltd.
FINANCIAL REVIEW OF THE GROUP INCOME STATEMENT (RS 000)
30 Jun 2009 2008 2007
Sales 1,764,268 1,475,705 1,309,767 Cost of sales (1,391,695) (1,158,357) (1,036,844)Gross profit 372,573 317,348 272,923 Sugar proceeds 536,248 721,061 744,490 Investment and other income 71,994 84,434 140,712 Management and secretarial fees 47,999 25,473 27,981 Other operating income 176,173 189,856 227,577 1,204,987 1,338,172 1,413,683 Other operating expenses (776,448) (915,262) (871,692)Administrative expenses (302,761) (233,189) (226,348)Operating profit 125,778 189,721 315,643 Fair value adjustments (9,963) 1,903 25,850 Amortisation of deferred expenditure (58,466) (33,967) (14,406)Share of profits less lossesof associated companies net of tax 515,939 371,450 110,961 Finance costs (286,446) (401,213) (341,014)Profit before exceptional items 286,842 127,894 97,034 Exceptional items 837,513 58,517 50,510 Profit before taxation 1,124,355 186,411 147,544 Taxation charge (14,550) (13,921) (23,710)Profit after taxation 1,109,805 172,490 123,834 Attributable to: Equity holders of the company 849,268 71,011 46,804 Non-controlling interests 260,537 101,479 77,030 1,109,805 172,490 123,834
STATISTICS
Number of ordinary shares used in calculation 1,425,600 1,425,600 1,425,600 Earnings per share (Rs) 595.73 49.81 32.83 Dividends per share (Rs) 40.00 30.00 30.00 Net asset value per share (Rs) 5,354.52 3,585.54 2,974.41

DEM 2010 | 43The Stock Exchange of Mauritius Ltd.
Excelsior United Development Companies Limited
SEM Code : EUD.I0000
Classification : Investment
Registered Office : 11th Floor, Medine Mews, 4 Chaussée Street, Port Louis
Board of Directors : Pierre DOGER DE SPÉVILLE – Chairman Daniel GIRAUD – Group Chief Executive Ganeshwar GUJADHUR Lajpati GUJADHUR René LECLÉzIO – Vice Chairman. Chairman – Corporate Governance Committee Gérald LINCOLN – Chairman – Audit Committee Roland DE RAVEL
Senior Executive : Daniel GIRAUD – Group Chief Executive
Company Secretary : Patricia GODER
Principal Activities : Holding of investment in securities and of investment properties
SUMMARY INFORMATION
EUDCOS was founded in 1974 and is primarily an investment company, which has built over the years a diversified portfolio of investments in securities.
Through its subsidiaries and associates, EUDCOS is strategically positioned in specific sectors, namely beverages, tourism and commerce, while directly, as well as through one of its subsidiaries, it is also present in the investment property sector.

44 | DEM 2010The Stock Exchange of Mauritius Ltd.
INCOME STATEMENT (RS 000)
FINANCIAL REVIEW OF THE GROUP BALANCE SHEET (RS 000)
30 Jun 2009 2008 2007
ASSETS
Non-current assetsProperty, plant and equipment 309,660 313,325 310,787 Investment properties 278,628 270,938 217,802 Intangible assets 17,639 15,696 16,003 Investments in subsidiaries - - - Investments in associates 174,516 146,189 130,236 Investments in securities 352,797 466,506 380,757 Deferred tax assets 429 270 6,410 1,133,669 1,212,924 1,061,995 Current assetsInventories 72,838 64,662 55,648 Trade and other receivables 130,806 159,829 146,433 Amounts receivable from group companies - - - Investments in securities 370 393 422 Cash and cash equivalents 113,007 78,835 54,427 317,021 303,719 256,930
Total assets 1,450,690 1,516,643 1,318,925
EQUITY AND LIABILITIES
Capital and reservesShare Capital 121,453 121,453 121,453 Share premium 13,830 13,830 13,830 Revaluation and other reserves 299,728 406,063 309,228 Retained earnings 492,389 415,421 363,888 Shareholders’ interest 927,400 956,767 808,399 Minority interests 193,726 183,930 119,730
Total equity 1,121,126 1,140,697 928,129
LIABILITIES
Non-current liabilities Borrowings 88,813 112,399 144,688 Deferred tax liabilities 12,024 11,145 3,223 Retirement benefit obligations 12,713 12,111 10,984 113,550 135,655 158,895
Current liabilities Trade and other payables 101,411 89,692 81,155 Current tax liabilities 9,903 10,520 10,441 Borrowings 104,700 140,079 140,305 216,014 240,291 231,901
Total liabilities 329,564 375,946 390,796 Total equity and liabilities 1,450,690 1,516,643 1,318,925
30 Jun 2009 2008 2007
Turnover 563,348 563,171 481,310 Cost of sales (370,659) (339,881) (303,267)Gross profit 192,689 223,290 178,043 Other income 27,620 22,237 26,653 Selling and marketing expenses (43,440) (39,674) (34,480)Administrative expenses (63,352) (63,874) (58,527)Operating profit 113,517 141,979 111,689 Finance cost (9,453) (29,589) (30,198)Profit before exceptional items 104,064 112,390 81,491 Exceptional items - - 15,646 Profit after exceptional items 104,064 112,390 97,137 Share of profit in associates 54,114 41,037 30,980 Profit before tax 158,178 153,427 128,117 Income tax (10,933) (15,183) (4,982)Profit for the year 147,245 138,244 123,135 Attributable to: Equity holders of the company 129,193 100,114 85,303 Minority interests 18,052 38,130 37,832
STATISTICS
Number of ordinary shares used in calculation 121,453,252 121,453,252 121,453,252 Earnings per share 1.06 0.82 0.70Dividends per share (Rs) 0.38 0.40 0.38Net asset value per share (Rs) 7.64 7.88 6.66
DEM 2010 | 45The Stock Exchange of Mauritius Ltd.
Flacq United Estates Limited
SEM Code : FUEL.I0000
Classification : Sugar
Registered Office : 11th Floor, Swan Group Centre, 10 Intendance Street, Port Louis
Board of Directors
Directors : Thierry LAGESSE – (Chairman) Yusuf ABOOBAKER Jan BOULLÉ Amédée DARGA Dayanidhi GUJADHUR Michel HARDY Arnaud LAGESSE J. Cyril LAGESSE Anne ROGERS Joseph VAUDIN
Alternate Director : Jan BOULLÉ (Alternate Director to Anne Rogers)
Company Secretary : GML Services Financiers et Juridiques Ltée
Principal Activities : Sugar cane growing, investment in sugar milling and electricity production
SUMMARY INFORMATION
Flacq United Estates Limited (FUEL) is a public company incorporated on August 21, 1948. FUEL, the largest sugar cane grower in Mauritius, has through merging with Mon Loisir in 2001, further extended the area of land under sugar cane cultivation it owns and manages from 5,400 hectares to 7,700 hectares to produce some 550,000 tonnes of cane per annum. The group sugar factories, F.U.E.L. Sugar Milling Company Limited (FSMC) and Compagnie Usinière de Mon Loisir Ltée (CUML) together mill some 1,300,000 tonnes of sugar cane annually to produce in excess of 125,000 tonnes of sugar.
F.U.E.L. Steam and Power Company Limited (FSPG) and CUML jointly export 210 giga Watt hour of electricity to the National grid annually. The refinery built by FUEL Refinery Limited next to the FUEL factory to refine sugar for the European market has started operations in December 2009 and is expected to produce 175,000 tonnes of refined sugar annually.

46 | DEM 2010The Stock Exchange of Mauritius Ltd.
FINANCIAL REVIEW OF THE GROUP BALANCE SHEET (RS 000)
30 Jun 2009 2008 2007
ASSETS
Non-current assetsProperty,plant and equipment 4,805,380 4,746,774 4,848,633 Investment properties 471,420 471,420 46,420 Intangible assets 151,867 113,127 79,651 Investments in subsidiaries - - -Investments in associates 161,220 5,942 6,542 Investments in securities 675,005 653,689 651,215 Deferred expenditure 395,360 431,995 109,936 Deferred tax assets 44 41 9,094 Biological assets 145,355 140,981 145,511 Non-current receivables 58,643 118,575 153,825 Loan receivable 6,701 10,960 14,762 6,870,995 6,693,504 6,065,589
Current assetsDeferred expenditure 101,418 82,333 91,639 Biological assets 447,159 417,237 552,748 Loan receivable 4,259 3,792 3,402 Inventories 218,675 140,187 131,814 Trade and other receivables 945,120 1,239,615 266,983 Cash in hand and at bank 97,407 12,065 19,663 1,814,038 1,895,229 1,066,249
Total assets 8,685,033 8,588,733 7,131,838
EQUITY AND LIABILITIES
Capital and reservesStated capital 752,657 752,657 711,526 Revaluation and other reserves 3,252,077 3,215,354 3,152,045 Retained profit 1,323,264 1,419,125 1,204,871
Equity attributable to equity holders of the parent 5,327,998 5,387,136 5,068,442Minority interests 401,540 401,353 372,154
Total equity 5,729,538 5,788,489 5,440,596
LIABILITIES
Non-current liabilities Borrowings 915,710 838,336 585,164 Deferred tax liabilities 73,600 100,878 91,011 Retirement benefit obligations 124,335 128,240 337,628 1,113,645 1,067,454 1,013,803
Current liabilities Borrowings 845,066 728,219 294,398 Proposed dividents payable tominority shareholders - 16,311 16,311 Trade and other payables 954,660 898,308 305,241 Current tax liabilities 42,124 41,056 27,166 Proposed dividends - 48,896 34,323 1,841,850 1,732,790 677,439
Total liabilities 2,955,495 2,800,244 1,691,242 Total equity and liabilities 8,685,033 8,588,733 7,131,838
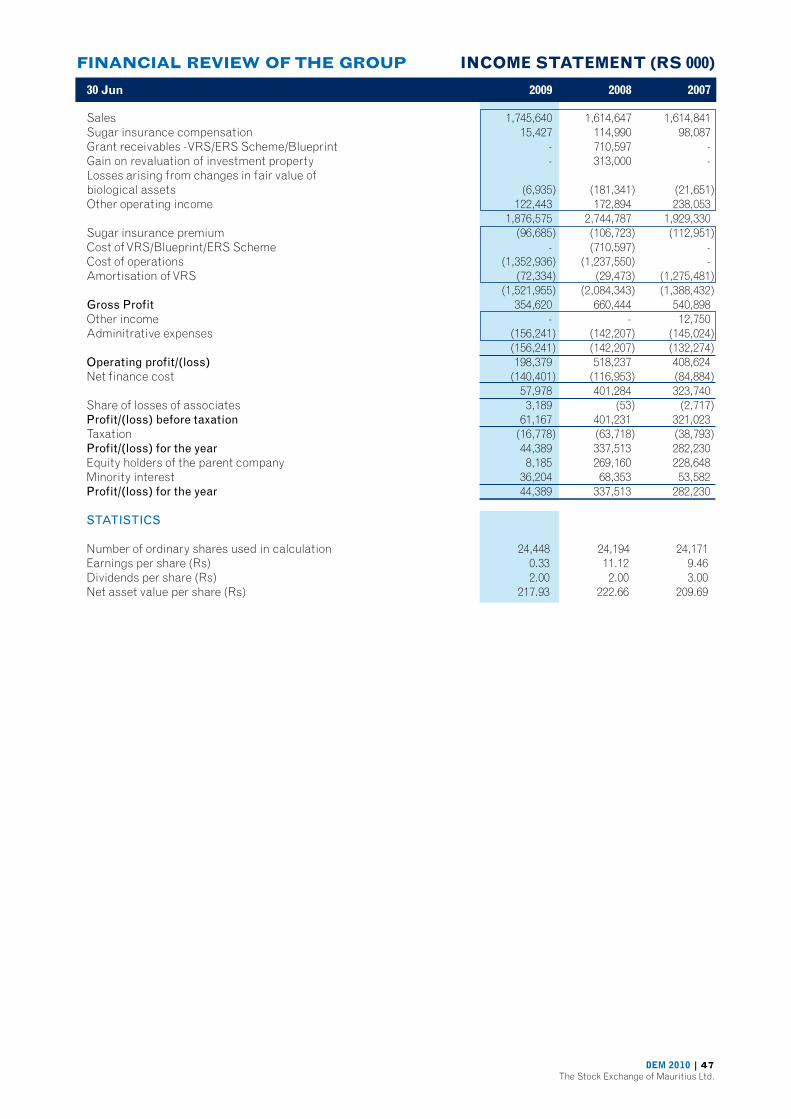
DEM 2010 | 47The Stock Exchange of Mauritius Ltd.
FINANCIAL REVIEW OF THE GROUP INCOME STATEMENT (RS 000)
30 Jun 2009 2008 2007
Sales 1,745,640 1,614,647 1,614,841 Sugar insurance compensation 15,427 114,990 98,087 Grant receivables -VRS/ERS Scheme/Blueprint - 710,597 - Gain on revaluation of investment property - 313,000 - Losses arising from changes in fair value of biological assets (6,935) (181,341) (21,651)Other operating income 122,443 172,894 238,053 1,876,575 2,744,787 1,929,330 Sugar insurance premium (96,685) (106,723) (112,951)Cost of VRS/Blueprint/ERS Scheme - (710,597) - Cost of operations (1,352,936) (1,237,550) -Amortisation of VRS (72,334) (29,473) (1,275,481) (1,521,955) (2,084,343) (1,388,432)Gross Profit 354,620 660,444 540,898 Other income - - 12,750 Adminitrative expenses (156,241) (142,207) (145,024) (156,241) (142,207) (132,274)Operating profit/(loss) 198,379 518,237 408,624 Net finance cost (140,401) (116,953) (84,884) 57,978 401,284 323,740 Share of losses of associates 3,189 (53) (2,717)Profit/(loss) before taxation 61,167 401,231 321,023 Taxation (16,778) (63,718) (38,793)Profit/(loss) for the year 44,389 337,513 282,230 Equity holders of the parent company 8,185 269,160 228,648 Minority interest 36,204 68,353 53,582 Profit/(loss) for the year 44,389 337,513 282,230
STATISTICS
Number of ordinary shares used in calculation 24,448 24,194 24,171Earnings per share (Rs) 0.33 11.12 9.46Dividends per share (Rs) 2.00 2.00 3.00 Net asset value per share (Rs) 217.93 222.66 209.69

48 | DEM 2010The Stock Exchange of Mauritius Ltd.
Forward Investment and Development Enterprises Limited
SEM Code : FIDE.I0000
Classification : Investment
Registered Office : 11th Floor, Swan Group Centre, 10 Intendance Street, Port Louis
Board of Directors : J. Cyril LAGESSE – Chairman Jan BOULLÉ Dayanidhi GUJADHUR Arnaud LAGESSE Thierry LAGESSE
Company Secretary : GML Services Financiers et Juridiques Ltée
Principal Activities : Investment holding as well as production and sale of macadams and bricks through its subsidiary
SUMMARY INFORMATION
Forward Investment and Development Enterprises Limited (FIDES) is a public investment company set up in 1974.
The company has a 80.53% share in Flacq Associated Stonemasters Limited (FAST), which produces bricks and aggregates in the east of the island.
FIDES has a diversified portfolio invested in local and foreign equities.

DEM 2010 | 49The Stock Exchange of Mauritius Ltd.
INCOME STATEMENT (RS 000)
FINANCIAL REVIEW OF THE GROUP BALANCE SHEET (RS 000)
30 Jun 2009 2008 2007
ASSETS
Non-current assetsProperty, plant and equipment 33,281 28,317 31,842Investment properties 38,980 8,338 8,338Investment in subsidiary company - - -Investment in associated company - - 2,152Investments in securities 718,602 796,352 831,603 790,863 833,007 873,935 Current assetsInventories 8,810 8,858 7,379Trade and other receivables 90,952 102,637 80,877Bank balance and cash 34,823 25,533 21,800 134,585 137,028 110,056
Total assets 925,448 970,035 983,991
EQUITY AND LIABILITIES
Capital and reservesStated capital 8,821 8,821 8,821Revaluation and other reserves 451,128 563,575 643,803Retained earnings 392,410 332,211 257,462Equity attributable to equity holders of the parent 852,359 904,607 910,086Minority interests 21,979 21,067 20,147
Total equity 874,338 925,674 930,233
Non-current liabilities Retirement benefit obligations 2,283 1,692 1,440Deferred tax liabilities 1,929 1,799 2,038 4,212 3,491 3,478
Current liabilities Trade and other payables 8,972 13,365 18,589Borrowings 16,846 4,664 13,071Current tax liabilities 2,066 5,150 3,575Dividends 19,014 17,691 15,045 46,898 40,870 50,280 Total equity and liabilities 92,5448 970,035 983,991
30 Jun 2009 2008 2007
Sales 114,559 138,043 112,267Cost of sales (84,425) (98,881) (86,764)Gross profit 30,134 39,162 25,503Other operating income 12,349 62,381 50,597Surplus on revaluation of investment properties 30,642 - -Distribution costs (499) (1,078) (93)Administrative expenses (15,047) (15,420) (11,422)Operating profit 57,579 85,045 64,585Net finance revenues 39,881 35,780 29,861 97,460 120,825 94,446Share of loss of associate - - (179)Profit before tax 97,460 120,825 94,267Tax expenses (4,541) (4,986) (3,407)Profit for the year 92,919 115,839 90,860Minority interest (9,181) (11,945) (7,885)Profit attributable to equity holders of the parent 83,738 103,894 82,975
STATISTICS
Number of ordinary shares used in calculation 8,820,947 8,820,947 8,820,947Earnings per share (Rs) 9.49 11.78 9.41 Dividends per share (Rs) 3.25 3.25 3.00 Net asset value per share (Rs) 96.63 102.55 103.17

50 | DEM 2010The Stock Exchange of Mauritius Ltd.
Hotelest Limited
SEM Code : HTLS.I0000
Classification : Others
Registered Office : Labama House, 35 Sir William Newton Street, Port-Louis
Board of Directors : Mr George DUMBELL – Chairperson Mr Adolphe VALLET Mr Jean Pierre DALAIS Mr Clément LABAUVE D’ARIFAT REY Mr Jean RIBET Mr. Jean Juppin DE FONDAUMIèRE Mr Clément REY Mr Marc FREISMUTH Mr Louis RIVALLAND Mr Noel Adolphe VALLET
Company Secretary : La Gaiété Services Ltd
Principal Activities : Holding Company of Constance Hotels Services Ltd
SUMMARY INFORMATION
Hotelest Ltd holds 51% of the capital of Constance Hotels Services Ltd (CHSL). CHSL and its subsidiaries own hotels in Mauritius and equity participation and management contracts in respect of hotels in the Seychelles, Madagascar and Maldives.

DEM 2010 | 51The Stock Exchange of Mauritius Ltd.
INCOME STATEMENT (RS 000)
FINANCIAL REVIEW OF THE GROUP BALANCE SHEET (RS 000)
31 Dec 2009 2008 2007
ASSETS
Non-current assetsProperty, plant and equipment 2,368,929 2,215,709 2,166,041 Intangible assets 380,829 366,344 63,826 Investments in subsidiary companies - - - Investments in associates 893,202 847,332 593,811 Investment in financial assets 1,700 1,700 200 Retirement benefit obligations 1,702 1,326 700 Loan to related company 98,348 103,894 - Deferred tax assets 3,706 20,560 53,391 3,748,416 3,556,865 2,877,969
Current assetsInventories 115,886 116,480 90,178 Trade and other receivables 495,461 450,832 393,885 Cash and cash equivalents 35,415 47,491 83,560 646,762 614,803 567,623 Total assets 4,395,178 4,171,668 3,445,592
EQUITY AND LIABILITIES
Capital and reserves (attributable to equity holders of the parent company)Stated Capital 477,397 477,397 477,397 Revaluation and other reserves 45,899 72,937 49,032 Retained earnings 518,902 578,417 534,220 Equity holders’ interests 1,042,198 1,128,751 1,060,649 Minority interests 1,003,694 1,086,357 1,021,804
Total equity 2,045,892 2,215,108 2,082,453
LIABILITIES
Non-current liabilities Borrowings 1,426,371 467,859 407,825 Deferred tax liabilities 78,149 31,846 25,612 Retirement benefit obligations 17,802 14,848 14,631 1,522,322 514,553 448,068 Current liabilities Trade and other payables 288,522 286,273 263,465 Proposed dividend 7,830 15,658 32,296 Borrowings 529,590 1,137,501 610,228 Current tax liabilities 1,022 2,575 9,082 826,964 1,442,007 915,071
Total liabilities 2,349,286 1,956,560 1,363,139
TOTAL EQUITY AND LIABILITIES 4,395,178 4,171,668 3,445,592
31 Dec 2009 2008 2007
Revenue 1,444,609 1,577,450 1,750,750 Operating profit 234,086 310,095 462,624 Finance costs (127,014) (142,451) (128,569)Share of results of associates (90,619) 53,302 70,565 Profit before taxation 16,453 220,946 404,620 Taxation (75,210) (53,288) (39,414)(Loss)/Profit for the year (58,757) 167,658 365,206 Equity holders of the company (36,027) 79,694 180,741Minority interest (22,730) 87,964 184,465(Loss)/Profit for the year (58,757) 167,658 365,206
STATISTICS
Number of ordinary shares used in calculation 32,621,872 32,621,872 32,621,872 Earnings per share (Rs) (1.10) 2.44 5.54 Dividends per share (Rs) 0.72 1.47 1.97 Net asset value per share (Rs) 31.95 34.60 32.51
52 | DEM 2010The Stock Exchange of Mauritius Ltd.
Knowledge Economies Limited
SEM Code : CASI.I0000
Classification : Investment
Registered Office : No. 5, President John Kennedy Street, Port Louis
Board of Directors : Navin Srinivasa Saminaden ROOTHRAY – (Chairman) Farhana ALIMOHAMED Amrita Devi BHEEKHUN
Company Secretary : Tioumitra Panday Woogra MAHARAHAJE Kunal SEEPURSAUND
Principal Activities : Investment company

DEM 2010 | 53The Stock Exchange of Mauritius Ltd.
INCOME STATEMENT (RS 000)
FINANCIAL REVIEW OF THE GROUP BALANCE SHEET (RS 000)
30 Sep 2009 2008 2007
ASSETS
Non-current assetsAvailable-for-sale investments 4,862 5,161 243,897 Deferred tax 142 - - 5,004 5,161 243,897
Current assetsTrade and other receivables 39 2 4,688 Taxation - - 117 Cash and cash equivalents 15,663 16,376 6,147 15,702 16,378 10,952
Total assets 20,706 21,539 254,849
EQUITY AND LIABILITIES
Capital and reservesShare Capital 21,101 21,101 21,101 Retained earnings (639) 694 40,111 Fair value reserves (1,063) (764) 193,433
Total equity 19,399 21,031 254,645
LIABILITIES
Current liabilities Other payables 349 425 204 Current tax liabilities 958 83 -
Total liabilities 1,307 508 204
Total equity and liabilities 20,706 21,539 254,849
30 Sep 2009 2008 2007
Revenue Dividends 188 4,641 9,143 Interest income - 591 383 188 5,232 9,526 Administrative expenses (827) (708) (275) (639) 4,524 9,251 Finance costs - - (5)Profit on disposal of investment - 5,251 - Fair value release on distributionof investment - 181,964 - Profit before taxation (639) 191,739 9,246 Taxation (694) (83) (34)Profit for the year (1,333) 191,656 9,212
STATISTICS
Number of ordinary shares used in calculation (000’s) 21,101 2,110 2,110 Earnings per share (Rs) (0.63) 90.83 4.37 Dividends per share (Rs) - - - Net asset value per share (Rs) 9.19 9.97 120.68

54 | DEM 2010The Stock Exchange of Mauritius Ltd.
Livestock Feed Limited
SEM Code : LFL.I0000
Classification : Industry
Registered Office : c/o Food & Allied Group Headquarters, Gentilly, Moka
Board of Directors : Michel Cédric DOGER DE SPEVILLE Pierre Elysée Michel DOGER DE SPEVILLE (Alternate Director : Cédric DOGER DE SPEVILLE) Marie Désiré Pierre DINAN Marie André Eric ESPITALIER-NOEL Marie Edouard Gilbert ESPITALIER-NOEL Gérard Jean Patrick HARDY Dominique Rocky FORGET Marie François Pierre-Yves POUGNET (Alternate Director: P A Noël EYNAUD) Louis Maxime Adolphe VALLET
Company Secretary : Marie Françoise Hélène THEVENAU
Principal Activities : The principal activity of Livestock Feed Limited consists of the processing and distribution of animal feeds.
SUMMARY INFORMATION
Founded in 1977, Livestock Feed Ltd was the first Mauritian enterprise to undertake production of animal feed with the technical assistance of international partners, namely Epol (Pty) Ltd South Africa and Evialis International.
A pioneer industry in Mauritius, LFL has gradually diversified its operations to assert itself as a leader in the region. LFL offers a prime support to animal production and aquaculture, and all its processes are geared towards providing high quality feeds with a strong commercial outreach.
The Company has invested massively to consolidate and modernize its national and regional production base. The latest investments include a mill at Riche-Terre for production of Extruded and Aquaculture feeds and a mill in Madasgascar, which started its operations in September 2004. The company, through its subsidiary Agrobulk Limited, is involved in the unloading and storage of imported bulk commodities.
Livestock Feed Limited now operates four business units and is well geared to maintain its leadership position in the region. The company believes in continuous improvement and keeps a close eye on new technologies and entertains a proactive approach to any development opportunities.

DEM 2010 | 55The Stock Exchange of Mauritius Ltd.
INCOME STATEMENT (RS 000)
FINANCIAL REVIEW OF THE GROUP BALANCE SHEET (RS 000)
30 Jul 2009 2008 2007
ASSETS
Non-current assetsProperty,plant and equipment 450,831 457,111 438,365 Investment properties 10,642 10,642 31,705 Intangible assets 2,791 2,599 4,343 Investments in subsidiary companies - - - Investments in associated companies 317,008 253,442 253,813 Investment in financial assets 69,187 70,173 68,755 Non-current receivables 1,500 1,500 1,500 Retirement benefit asset 851 825 759 Deferred income tax assets 50 50 5,444 852,860 796,342 804,684 Current assetsInventories 326,757 316,519 225,874 Trade and other receivables 315,359 289,355 270,501 Cash in hand and at bank 15,192 33,985 7,892 657,308 639,859 504,267 Total assets 1,510,168 1,436,201 1,308,951
EQUITY AND LIABILITIES
Capital and reservesShare Capital 108,536 108,536 108,536 Revaluation and other reserves 209,419 167,678 175,647 Retained earnings 442,416 337,260 297,889 Shareholders’ interests 760,371 613,474 582,072 Minority interests 13,789 10,223 7,460
Total equity 774,160 623,697 589,532
LIABILITIES
Non-current liabilities Borrowings 154,435 179,266 177,906 Retirement benefit obligations 5,318 3,914 3,450 Deferred income tax liabilities 31,335 31,414 31,578 191,088 214,594 212,934 Current liabilities Trade and other payables 84,216 108,601 100,990 Borrowings 440,973 484,447 402,856 Current tax liabilities 19,731 4,862 2,639 544,920 597,910 506,485
Total liabilities 736,008 812,504 719,419
TOTAL EQUITY AND LIABILITIES 1,510,168 1,436,201 1,308,951
30 Jul 2009 2008 2007
Sales 1,872,254 1,488,618 1,245,745 Cost of Sales (1,567,813) (1,264,074) (1,069,934)Gross Profit 304,441 224,544 175,811 Other income 10,925 5,414 5,850 Administrative expenses (143,975) (108,772) (98,033) 171,391 121,186 83,628 Finance cost (51,234) (65,720) (55,076)Share of results of associates 27,046 11,697 16,381 Profit before taxation 147,203 67,163 44,933 Income tax (20,998) (10,555) (5,708)Profit for the year 126,205 56,608 39,225 Equity holders of the company 122,686 53,684 38,682 Minority interest 3,519 2,924 543 Profit for the year 126,205 56,608 39,225
STATISTICS
Number of ordinary shares used in calculation 10,500,000 10,500,000 10,500,000 Earnings per share (Rs) 11.64 5.07 3.64 Dividends per share (Rs) 1.70 1.30 1.30 Net asset value per share (Rs) 72.08 58.09 55.10

56 | DEMÔ 2010The Stock Exchange of Mauritius Ltd.
Les Gaz Industriels Ltd
SEM Code : GIL.I0000
Classification : Industry
Registered Office : 18 Edith Cavell Street, Port Louis
Board of Directors : COETzEE Willem COMMINS Jérôme DE BRAGARD HARDY Philippe HAREL Antoine L. – Chairman MSISKA Maria PIAT Eric
Company Secretary : HM Secretaries Ltd.
Principal Activities : Manufacture of industrial and medical gases and accessories; welding equipment and accessories, welding machines and electrodes; diving gases and equipment and accessories
SUMMARY INFORMATION
Incorporated in April 1952. South African leading gas company, Afrox, owns 38% equity in Les Gaz Industriels Ltd. The Company obtained its ISO 9001:2000 certification in October 2005 and was re-certified on 27 August 2009 (ISO9001:2008).

DEM 2010 | 57The Stock Exchange of Mauritius Ltd.
FINANCIAL REVIEW OF THE GROUP BALANCE SHEET (RS)
30 Jun 2009 2008 2007
ASSETS
Non-current assetsProperty, plant and equipment 115,196,542 107,663,005 111,437,821 Intangible assets 2,239,739 752,574 805,011 Investment in subsidiary company 166,611 - - Investments in financial assets 7,745,280 9,644,351 6,985,867 125,348,172 118,059,930 119,228,699
Current assetsInventories 11,158,817 10,146,402 10,558,518Trade and other receivables 30,540,165 26,383,463 24,835,875Cash and cash equivalents 24,780,279 54,866,923 39,640,677 66,479,261 91,396,788 75,035,070 Total assets 191,827,433 209,456,718 194,263,769
EQUITY AND LIABILITIES
Capital and reserves Share capital 26,113,920 26,113,920 26,113,920 Share premium 159 159 159 Revaluation and other reserves 49,908,532 51,825,812 49,172,466 Retained earnings 57,640,130 64,308,628 62,499,861 Equity holders’ interest 133,662,741 142,248,519 137,786,406
LIABILITIES
Non-current liabilities Deferred tax liabilities 10,651,336 10,285,304 10,481,064Retirement benefit obligations 5,924,870 6,124,760 6,464,263 16,576,206 16,410,064 16,945,327 Current liabilities Trade and other payables 34,181,960 30,760,234 30,494,767Current tax liabilities 2,444,881 4,108,410 4,075,624Proposed dividends 4,961,645 15,929,491 4,961,645 41,588,486 50,798,135 39,532,036
Total liabilities 58,164,692 67,208,199 56,477,363
TOTAL EQUITY AND LIABILITIES 191,827,433 209,456,718 194,263,769

58 | DEM 2010The Stock Exchange of Mauritius Ltd.
INCOME STATEMENT (RS)
30 Jun 2009 2008 2007
Sales 107,169,546 100,478,842 109,333,157 Cost of sales (50,070,967) (46,817,213) (49,959,621)Gross profit 57,098,579 53,661,629 59,373,536 Other income 5,018,480 5,558,860 3,957,165 Selling and distribution expenses (16,370,652) (13,975,255) (15,092,615)Administrative Expenses (23,993,109) (19,104,188) (22,210,580) 21,753,298 26,141,046 26,027,506 Net foreign exchange gains/(losses) 584,318 695,616 (255,564)Profit before taxation 22,337,616 26,836,662 25,771,942 Income tax (3,153,333) (3,875,620) (4,285,082)Profit after taxation 19,184,283 22,961,042 21,486,860
STATISTICS
Number of ordinary shares used in calculation 2,611,392 2,611,392 2,611,392 Earnings per share (Rs) note 1 7.35 8.79 8.23 Dividends per share (Rs) note 2 9.90 8.10 3.90 Net asset value per share (Rs) note 3 51.18 54.47 52.76 note 1 Profit available for ordinary shareholders 19,184,283 22,961,042 21,486,860 Number of ordinary shares 2,611,392 2,611,392 2,611,392 Earnings Per Share 7.35 8.79 8.23 note 2 Total Dividend Paid ( Interim + Final ) 25,852,781 21,152,275 10,184,429 Number of ordinary shares 2,611,392 2,611,392 2,611,392 Dividends per share 9.90 8.10 3.90 note 3 Equity holders’ interest 133,662,741 142,248,519 137,786,406 Number of ordinary shares 2,611,392 2,611,392 2,611,392 Net asset value per share 51.18 54.47 52.76

DEM 2010 | 59The Stock Exchange of Mauritius Ltd.
Les Moulins De La Concorde Limitée
SEM Code : LMLC.I0000
Classification : Industry
Registered Office : c/o Food & Allied Group Headquarters, Gentilly, Moka
Board of Directors : Vincent AH CHUEN Marie Desiré Pierre DINAN Cédric Michel DOGER DE SPEVILLE Pierre Elysée Michel DOGER DE SPEVILLE Marie André Eric ESPITALIER-NOEL Pierre Augustin Noël EYNAUD Anwar JOONAS Deonanan MAKOOND Marie François Pierre-Yves POUGNET (Chairman) Hansraj RUHEE Shekur SUNTAH (Alternate Director: Capt Ponamballum) Pieter Johannes VAN NIEKERK
Company Secretary : Marie Françoise Hélène THEVENAU
Principal Activities : Milling of Wheat
SUMMARY INFORMATION
Established in 1989, Les Moulins de La Concorde Ltée (LMLC) has been a major player in the development of the Mauritian economy over the past twenty years and has played a key-role in the field of food security by ensuring, since the beginning of its activities, regular fresh flour supply to the country.
As part of its commitment, to ensuring security of supply of fresh flour, the company has 16 wheat silos to ensure optimal conservation of a strategic wheat stock of 40,000 tonnes.
LMLC meticulously selects its wheat which is sourced from reliable producers worldwide and has a state of the art milling facility with technological knowhow, certified by internationally accredited quality systems including ISO14001:2004, ISO9001:2000, HACCP. The Company is also in the process of being OHSAS certified.
LMLC produces some 120,000 tonnes of flour per year out of which around 100,000 tonnes are supplied to STC for sale to local bakeries and wholesalers, around 14,000 tonnes are exported and 6,000 tonnes are sold directly on the local retail market in small packs under the brand “Blé d’Or” and “Les Moulins”.

60 | DEM 2010The Stock Exchange of Mauritius Ltd.
INCOME STATEMENTS (RS 000)
FINANCIAL REVIEW OF THE GROUP BALANCE SHEET (RS 000)
30 Jun 2009 2008
ASSETS
Non-current assetsProperty, plant and equipment 633,188 477,557 Intangible assets 2,016 2,166 Investment in subsidiary company - - Investment in associated company 99,024 89,209 Investment in financial assets 100,517 107,894 834,745 676,826
Current assetsInventories 420,567 362,404 Trade and other receivables 207,551 137,211 Cash and cash equivalents 79,594 16,266 707,712 515,881 Total assets 1,542,457 1,192,707
EQUITY AND LIABILITIES
Capital and reserves Share capital 210,000 210,000 Revaluation and other reserves 334,842 204,252 Retained earnings 429,027 344,725 Equity holders’ interest 973,869 758,977 Minority interest 17,922 19,992
Total equity 991,791 778,969
Non-current liabilities Retirement benefit obligations 9,427 8,534 Deferred tax liabilities 90,171 65,622 99,598 74,156 Current liabilities Trade and other payables 36,183 12,504 Borrowings 396,415 317,299 Current tax liabilities 18,470 9,779 451,068 339,582
Total liabilities 550,666 413,738
TOTAL EQUITY AND LIABILITIES 1,542,457 1,192,707
30 Jun 2009 2008
Sales 2,103,755 1,493,606 Fluctuations in foreign exchange (114,590) 67,303 1,989,165 1,560,909 Cost of sales (1,824,638) (1,388,919)Gross profit 164,527 171,990 Other income 6,429 4,527 Selling and distribution costs (23,632) (17,532)Administrative expenses (70,049) (57,856) 77,275 101,129 Net finance revenue/(cost) 19,747 (65,932)Share of result of associate 3,550 (4,186)Profit before taxation 100,572 31,011 Income tax expense (16,964) (6,114)Net profit for the year 83,608 24,897 Attributable to: Equity holders of the company 83,660 24,934 Minority interest (52) (37) 83,608 24,897 STATISTICS
Number of ordinary shares in calculation 1,800,000 1,800,000 Earnings per share (Rs) 43.14 10.52 Dividends per share (Rs) 13.00 9.00 Net asset value per share (Rs) 524.37 404.99

DEM 2010 | 61The Stock Exchange of Mauritius Ltd.
Margarine Industries Limited
SEM Code : MIL.I0000
Classification : Industry
Registered Office : 6, Sir William Newton Street, Port Louis
Board of Directors : Mr. Currimjee J CURRIMJEE, Mr. Fakhruddin J CURRIMJEE, Mr. Mustanshir A CURRIMJEE, Mr. Bashirally A CURRIMJEE, Mr. Azim F CURRIMJEE, Mr. Raffi CURRIMJEE, Mr. Anil C CURRIMJEE, Mr. Ashraf M CURRIMJEE, Mr. Mazahir F E ADAMJEE, Mr. Hassam VAYID Mr. Saliah M SAIT
Company Secretary : Currimjee Limited
Principal Activities : Manufacturing and sale of margarine and its related products
SUMMARY INFORMATION
Margarine Industries Limited (‘MIL’) was established in 1967. The Company is the largest manufacturer of margarine in Mauritius and caters for both the Domestic and Industrial market.
A quality manufacturer, MIL holds the Mauricert MS26 and MS27 certificates, is HACCP registered since 1999, received its ISO 9000 – 2000 certificate in December 2005 and in October 2008 became the first ISO 22000 company in the Food Industry.

62 | DEM 2010The Stock Exchange of Mauritius Ltd.
INCOME STATEMENT (RS)
FINANCIAL REVIEW OF THE GROUP BALANCE SHEET (RS)
31 Dec 2009 2008 2007
ASSETS
Non-current assetsProperty,plant and equipment 151,116,734 85,834,519 82,778,914 Investment in subsidiary - - -Goodwill 651,218 651,218 651,218 Advance to subsidiary - - -Retirement benefit asset 9,629,689 8,456,894 3,351,111 161,397,641 94,942,631 86,781,243 Current assetsInventories 66,951,828 73,679,362 46,309,348 Trade and other receivables 55,763,228 58,417,370 52,208,890 Cash in hand and at bank 12,082,110 29,328,401 8,918,801 134,797,166 161,425,133 107,437,039
Total assets 296,194,807 256,367,764 194,218,282
EQUITY AND LIABILITIES
Capital and reservesStated capital 30,023,900 30,023,900 30,023,900 Revaluation Reserves 45,715,266 28,525,648 28,651,437 Other Reserves 3,810,342 (6,473,994) 11,900,591 Retained earnings 24,038,998 29,039,537 19,476,580
Equity attributable to equity holders of the parent 103,588,506 81,115,091 90,052,508
LIABILITIES
Non-current liabilitiesLoans - - 822,152Retirement benefit obligations 5,178,000 - -Deferred tax liabilities 9,365,944 6,580,542 5,680,429Obligation under finance lease 19,172,923 9,844,770 6,049,556 33,716,867 16,425,312 12,552,137
Current liabilitiesLoans 46,884,651 31,313,840 6,040,462Taxation 1,949,285 2,619,482 3,381,762Obligation under finance lease 4,162,621 2,901,250 1,660,740Trade and other payables 67,658,405 86,212,554 55,911,591Bank overdrafts 38,234,472 35,780,237 24,619,082 158,889,434 158,827,363 91,613,637
Total liabilities 192,606,301 175,252,675 104,165,774
Total equity and liabilities 296,194,807 256,367,766 194,218,282
31 Dec 2009 2008 2007
Revenue 329,325,813 308,718,041 257,115,710 Cost of sales (252,432,315) (226,326,374) (179,349,561)Gross Profit 76,893,498 82,391,667 77,766,149 Other income 640,032 3,410,209 1,071,128 Distribution costs (6,950,606) (6,280,976) (4,682,719)Selling expenses (15,099,683) (14,700,012) (14,027,500)Administration expenses (37,266,302) (32,212,709) (29,232,613)Net finance costs (7,206,358) (2,687,737) (4,628,175)Profit before taxation 11,010,581 28,204,119 26,266,270 Taxation (4,127,349) (3,154,523) (3,718,673)Profit for the year 6,883,232 25,049,596 22,547,597
STATISTICS
Number of shares used in calculation 300,239 300,239 300,239Earnings per share (Rs) 22.93 83.42 75.10Dividends per share (Rs) 40.00 52.00 30.00
DEM 2010 | 63The Stock Exchange of Mauritius Ltd.
Mauritius Cosmetics Limited
SEM Code : MCOS.I0000
Classification : Industry
Registered Office : Bonne Terre, Vacoas
Board of Directors : Jadoo Hermann DOOKUN – Chairman Lady Henriette DOOKUN Jawaheer Lall DOOKUN Uwe HOLLMICHEL Assish Kumar Ghanshyam SINGH JUGMOHUN Navind Kumar DOOKUN
Managing Director : Jadoo Hermann DOOKUN
Company Secretary : St James Secretaries Limited
Principal Activities : 1. Manufacturing of various consumer goods. 2. Rental of immovable property. 3. Investment in shares, property and deposits.
SUMMARY INFORMATION
Since starting its operation in 1965, Mauritius Cosmetics Ltd has been producing locally toothpaste brand Blendax under license from Procter & Gamble of USA.
Over the years, the Company has witnessed a continuous expansion of its activities whilst regularly introducing new manufacturing technologies and state-of-the-art equipment, to stay on the cutting edge of production. This together with a team of dedicated professionals and highly skilled personnel have contributed in making Blendax the single largest selling toothpaste brand in Mauritius.
In addition to Blendax, the Company also manufactures Kamill cosmetic products under license from Burnus GMBH ( Germany ) and furniture care products from Poliboy Werke (Germany). The Company also holds a licensee partnership with Beauté Diffusion (Paris) for the manufacture of perfumes, eau de colognes and eau de toilettes.
Mauritius Cosmetics Ltd upholds a tradition to offer the best products to consumers based on high standard of care and strictest quality assurance programs at all levels of operation. The Company has also diversified its activities to include property investment.

64 | DEM 2010The Stock Exchange of Mauritius Ltd.
INCOME STATEMENT (RS)
FINANCIAL REVIEW OF THE GROUP BALANCE SHEET (RS)
30 Jun 2009 2008 2007
ASSETS
Non-current assetsProperty, plant and equipment 296,898,628 243,913,219 221,669,964 Intangible assets 6,685,099 6,282,886 6,448,012 Investment Property 499,767,398 526,890,459 508,544,500 Retirement Benefit Asset 81,483 81,483 81,483 Investments in subsidiary companies - - - Other investments 16,672,466 18,329,886 15,554,883 820,105,074 795,497,933 752,298,842 Current assetsInventories 79,833,251 94,005,579 75,350,895 Trade and other receivables 127,895,346 110,158,922 98,281,709 Short term deposits - 1,500,000 - Cash in hand and at bank 26,084,544 13,969,541 52,840,074 233,813,141 219,634,042 226,472,678
Total assets 1,053,918,215 1,015,131,975 978,771,520
EQUITY AND LIABILITIES
Capital and reservesShare capital 45,000,000 45,000,000 45,000,000 Retained earnings 257,344,266 196,176,609 185,104,454 Other reserves 522,578,957 559,022,677 556,922,768 Equity holders’ interest 824,923,223 800,199,286 787,027,222 Minority interest 46,673,493 47,127,273 44,582,025
Total equity 871,596,716 847,326,559 831,609,247
LIABILITIES
Non-current liabilities Borrowings 13,666,337 6,557,989 2,787,534 Deferred Income Taxes 5,462,349 5,397,879 5,330,535 Retirement benefit obligations 781,696 1,003,518 184,050 19,910,382 12,959,386 8,302,119
Current liabilities Trade and other payables 76,403,619 92,286,827 113,479,888 Current tax liabilities 2,601,760 2,704,354 4,865,892 Bank overdrafts 65,436,147 44,082,207 5,501,615 Borrowings 12,569,591 10,372,642 9,612,759 Dividend Payable 5,400,000 5,400,000 5,400,000 162,411,117 154,846,030 138,860,154
Total liabilities 182,321,499 167,805,416 147,162,273 Total equity and liabilities 1,053,918,215 1,015,131,975 978,771,520
30 Jun 2009 2008 2007
Revenue 363,776,016 381,972,261 317,305,410 Cost of sales (270,289,350) (285,889,051) (227,310,341)Gross profit 93,486,666 96,083,210 89,995,069 Other operating income 33,839,827 22,218,541 21,224,284 Distribution costs (34,440,056) (34,004,341) (26,077,056)Administrative expenses (54,877,912) (52,831,427) (39,453,907)Other operating expenses (3,041,129) (1,641,715) (106,060)Profit from operations 34,967,396 29,824,268 45,582,330 Finance costs (9,335,834) (7,540,533) (5,933,468) 25,631,562 22,283,735 39,648,862 Negative Goodwill 7,822,872 - -Increase in fair value of investment properties - - 13,976,915 Profit before tax 33,454,434 22,283,735 53,625,777 Taxation charge (3,713,883) (3,266,332) (4,998,321)Profit for the year 29,740,551 19,017,403 48,627,456 Equity holders of the parent 30,135,331 16,539,055 46,605,580 Minority interests (394,780) 2,478,348 2,021,876
STATISTICS
Number of ordinary shares used in calculation 4,500,000 4,500,000 4,500,000 Earnings per share (Rs) 6.70 3.68 10.36Dividends per share (Rs) 0.50 1.20 1.20Net asset value per share (Rs) 183.32 177.82 174.89

DEM 2010 | 65The Stock Exchange of Mauritius Ltd.
The Medical & Surgical Centre Limited
SEM Code : MASC.I0000
Classification : Others
Registered Office : Georges Guibert Street, Floréal
Board of Directors : Dr NAROTTAM Dev Puri – Chairman Mr Gérald Maurice Raoul DE SENNEVILLE Dr Marie Marc Guy ADAM Mr Joseph Jean Pierre Piat DALAIS Mr Yogesh Kumar SAREEN Mr Antoine Michel THOMAS
Managing Director : Mr Raj GORE – (Chief Operating Officer)
Company Secretary : St James Secretaries Limited
Principal Activities : Provision of high quality medical, surgical and clinical support.
SUMMARY INFORMATION
The company is pursuing with its principal activity of providing high quality medical, surgical and clinical care with the support of Fortis Healthcare Ltd, India, which has joined the company as a strategic partner.

66 | DEM 2010The Stock Exchange of Mauritius Ltd.
INCOME STATEMENT (RS)
FINANCIAL REVIEW OF THE GROUP BALANCE SHEET (RS)
30 Jun 2009 2008 2007
ASSETS
Non-current assetsProperty, plant and equipment 430,255,538 438,501,916 Intangible assets 84,000 112,000 Investments in subsidiary - - Investments in associate - - 442,133,000 430,339,538 438,613,916
Current assetsInventories 15,056,360 16,088,252 Trade and other receivables 48,268,326 49,106,652 Cash in hand and at bank 1,172,312 649,739 135,314,000 64,496,998 65,844,643
Total assets 577,447,000 494,836,536 504,458,559
EQUITY AND LIABILITIES
Capital and reservesShare Capital 289,801,000 124,801,318 124,801,318 Revaluation reserves 83,825,000 83,824,960 83,824,960 Revenue Deficit (16,203,000) (35,302,413) (27,203,984)Shareholders’ interest 357,423,000 173,323,865 181,422,294
LIABILITIES
Non-Current liabilitiesBorrowings 122,146,107 135,909,694 Deferred tax liabilities 8,813,192 10,492,379 Retirement benefit obligations 13,600,516 13,435,640 126,481,000 144,559,815 159,837,713
Current liabilitiesTrade and other payables 32,003,045 22,559,639 Borrowings 144,949,811 140,638,913 93,543,000 176,952,856 163,198,552
Total liabilities 220,024,000 321,512,671 323,036,265
Total equity and liabilities 577,447,000 494,836,536 504,458,559
30 Jun 2009 2008 2007
Sales 367,762,000 260,989,501 225,478,610 Cost of sales (147,593,806) (126,447,522)Gross Profit 113,395,695 99,031,088 Other operating income 10,534,437 10,201,797 Administrative expenses (69,766,192) (58,384,074)Depreciation (25,677,182) (22,479,272) 43,318,000 28,486,758 28,369,539 Finance costs (23,609,000) (34,728,332) (26,567,261)Share of loss of associate - (3,536,042) (3,480,946)Loss before exceptional item 19,709,000 (9,777,616) (1,678,668)Exceptional item - - (20,277,662)Loss before taxation 19,709,000 (9,777,616) (21,956,330)Taxation 1,586,000 1,679,187 - Loss for the year 21,295,000 (8,098,429) (21,956,330)
STATISTICS
Number of ordinary shares used in calculation 569,940,822 256,473,370 256,473,370 Earnings per share (Rs) 0.05 (0.03) (0.09)Dividends per share (Rs) - - - Net asset value per share (Rs) 0.63 0.30 0.73 Net asset value per share (Rs) 0.63 0.68 0.71

DEM 2010 | 67The Stock Exchange of Mauritius Ltd.
Mauritius Secondary Industries Ltd
SEM Code : MSIL.I0000
Classification : Industry/Property
Registered Office : 14, Leoville l’Homme Street, Port Louis
Board of Directors : Abdool Aleem BUNDHOO – Chairman M.Yacoob RAMTOOLA FCA – Vice Chairman Swaleh RAMJANE FCIS MCIT M Shadman Elias HAJI ADAM FCCA Massood Ayoob RAMTOOLA
Company Secretary : Swaleh Ramjane FCIS MCIT
Principal Activities : Retreading of Tyres Rental of Commercial Buildings
SUMMARY INFORMATION
Mauritius Secondary Industries Ltd established in 1961 is engaged in the retreading of tyres and rental of commercial, office and industrial building.

68 | DEM 2010The Stock Exchange of Mauritius Ltd.
INCOME STATEMENT (RS)
FINANCIAL REVIEW OF THE GROUP BALANCE SHEET (RS)
30 Jun 2009 2008 2007
ASSETS
Non-current assetsProperty, plant and equipment 7,061,044 6,035,195 7,334,182 Investment property 9,915,007 11,070,508 12,233,556 Investments 9,125,991 9,916,409 6,965,730 Deferred tax asset 43,878 57,799 - 26,145,920 27,079,911 26,533,468
Current assetsStocks 1,325,462 2,048,651 815,791 Trade and other receivables 1,823,441 3,002,979 1,512,846 Cash in hand and at bank 592 4,037 18,896 3,149,495 5,055,667 2,347,533
Total assets 29,295,415 32,135,578 28,881,001
EQUITY AND LIABILITIES
Capital and reservesStated Capital 8,000,000 8,000,000 8,000,000 Profit and loss account 5,454,859 3,584,115 2,369,264 Fair value reserve 4,350,634 5,374,863 3,000,134
Total equity 17,805,493 16,958,978 13,369,398
LIABILITIES
Non-current liabilitiesLoans 7,000,000 6,000,000 8,652,123 Retirement benefit obligations 1,625,606 1,481,606 1,337,606 Deferred tax liabilities - - 22,514 8,625,606 7,481,606 10,012,243
Current liabilitiesBank overdrafts (secured) 1,457,307 2,839,844 1,142,068 Loans - 1,827,124 2,918,228 Trade and other payables 1,096,610 2,353,381 1,032,943 Taxation 310,399 674,645 406,121 2,864,316 7,694,994 5,499,360
Total liabilities 11,489,922 15,176,600 15,511,603
Total equity and liabilities 29,295,415 32,135,578 28,881,001
30 Jun 2009 2008 2007
Turnover Rental income 7,659,097 7,226,762 6,999,538 Retreading of tyres 10,980,314 8,673,978 6,990,390 18,639,411 15,900,740 13,989,928 Operating profit 3,988,037 3,271,861 2,179,369 Other income 602,863 540,759 257,610 4,590,900 3,812,620 2,436,979 Finance cost (1,012,875) (1,043,437) (1,286,635)Profit before taxation 3,578,025 2,769,183 1,150,344 Taxation (707,281) (594,332) (338,403)Profit after taxation 2,870,744 2,174,851 811,941
STATISTICS
Number of ordinary shares used in calculation 800,000 800,000 800,000Earnings per share (Rs) 3.58 2.72 1.01 Dividends per share (Rs) 1.25 1.20 0.80 Net asset value per share (Rs) 22.26 21.20 16.71

DEM 2010 | 69The Stock Exchange of Mauritius Ltd.
Mauritius Freeport Development Company Limited
SEM Code : MFRE.I0000
Classification : Commerce
Registered Office : No. 5, President John Kennedy Street, Port Louis
Board of Directors : Jean Marie René LECLEzIO – Chairman Joseph René François PIAT DALAIS – Chairman of Corporate Governance Committee Olivier DECANNIERE Norbert Marie Auguste DENTRESSANGLE Dominique de FROBERVILLE – Chief Executive Officer Robert C. de FROBERVILLE Sheo Shankar GUJADHUR Ashok Kumar Jai Krishen KALACHAND Gérard LINCOLN – Chairman of Audit Committee Louis RIVALLAND Pierre Elysée Michel de SPEVILLE Boomah Devi UTCHANAH
Company Secretary : Executive Services Limited
SUMMARY INFORMATION
Mauritius Freeport Development Ltd (MFD) is a Logistics Service Provider located in the Freeport of Mauritius, offering a comprehensive range of Supply Chain Management services to companies wishing to place a multi-item pivotal stock in Mauritius and subsequently feed each regional market as per its specific and timely requirements.
MFD’s warehouses include 46,000m2 of dry storage and 12,000m2 of cold rooms for storage and processing which meet the most stringent international standards – EU, ISO and HACCP as well as a dedicated fishing quay of 117m long.
The company also has 14,000m2 of industrial zones. These consist of plug and work modules equipped with electricity, water and IT facilities, for companies involved in processing activities.

70 | DEM 2010The Stock Exchange of Mauritius Ltd.
INCOME STATEMENT (RS)
FINANCIAL REVIEW OF THE GROUP BALANCE SHEET (RS)
31 Dec 2009 2008 2007
ASSETS
Non-current assetsIntangible assets 950,807 943,514 973,156 Property, plant and equipment 1,569,680,268 1,573,569,134 1,303,877,707 Available-for-sale investment 300,000 300,000 - 1,570,931,075 1,574,812,648 1,304,850,863 Current assetsTrade and other receivables 107,005,399 113,101,068 89,880,127 Cash and cash equivalents - - 1,110,533 107,005,399 113,101,068 90,990,660
Total assets 1,677,936,474 1,687,913,716 1,395,841,523
EQUITY AND LIABILITIES
Capital and reservesStated Capital 900,000,000 900,000,000 900,000,000 Retained earnings (479,120,935) (496,197,733) (415,307,535)Revaluation reserve 31,435,071 31,435,071 31,435,071
Total equity 452,314,136 435,237,338 516,127,536
LIABILITIES
Non-Current liabilitiesBorrowings 728,107,654 887,302,550 588,671,231
Current liabilitiesBorrowings 388,069,417 232,099,574 227,347,589 Trade and other payables 109,445,267 133,274,254 63,695,167 497,514,684 365,373,828 291,042,756
Total liabilities 1,225,622,338 1,252,676,378 879,713,987
Total equity and liabilities 1,677,936,474 1,687,913,716 1,395,841,523
31 Dec 2009 2008 2007
Revenue 375,710,678 338,113,584 253,723,480 Operational charges (238,561,279) (233,810,971) (162,490,461) 137,149,399 104,302,613 91,233,019 Other income 1,969,744 152,174 - Administrative expenses (35,249,440) (43,646,598) (30,989,391)Selling and marketing expenses (11,139,576) (15,611,015) (12,969,552)Operating profit 92,730,127 45,197,174 47,274,076 Financial charges - Interest expense (90,732,968) (89,032,102) (85,136,849) - Met exchange 15,079,639 (37,055,270) 39,603,066 - Total (75,653,329) (126,087,372) (45,533,783)(loss)/ Profit for the year 17,076,798 (80,890,198) 1,740,293
STATISTICS
Number of ordinary shares used in calculation 90,000,000 90,000,000 87,589,041 (Loss)/ Earnings per share (Rs) - Basis 0.19 (0.90) 0.02 - Diluted 0.19 (0.90) 0.02 Dividends per share (Rs) - - - Net asset value per share (Rs) 5.03 4.84 5.73
DEM 2010 | 71The Stock Exchange of Mauritius Ltd.
Medine Limited
SEM Code : MSE.I0000
Classification : Sugar
Registered Office : 11th Floor, Medine Mews, 4 Chaussée Street, Port Louis
Board of Directors : Pierre DOGER DE SPÉVILLE – Chairman Alain CHATEL Jacques FORGET – Managing Director – Agriculture Cluster Daniel GIRAUD – Group Chief Executive Lajpati GUJADHUR Ramapatee GUJADHUR René LECLÉzIO – Vice Chairman. Chairman – Corporate Governance Committee Gérald LINCOLN Jacques LI WAN PO – Chairman – Audit Committee Sulliman Adam MOOLLAN Alain DE RAVEL Marc DE RAVEL
Senior Executive : Daniel GIRAUD – Group Chief Executive Company Secretary : Patricia GODER
Principal Activities : Agriculture, Property, Leisure
SUMMARY INFORMATION
Incorporated in 1913, Medine is an important actor in the sugar sector, always accelerating developments and further consolidating its activities with the creation of new business pillars.
The reshuffling of Medine’s activities into three business units, namely Agriculture, Property and Leisure ensures new impetus to the group while moving the latter strategically forward.
With the rapid change in the sugar industry, Medine has reengineered its business practice and is confidently looking ahead to the challenges in that sector, while actively exploring alternative and sustainable growth opportunities.
Medine has the ambition to be a major property developer. With key initiatives like the Cascavelle Shopping Mall and the Cascavelle Business Park, the western region of the island will soon reach out for higher standards in urban development. Already renowned for its solid experience in the development of IRS projects in Mauritius, Medine is now focusing on its Akasha project.
The local leisure sector is presently very dynamic and Medine has developed results-oriented programmes that will enable Casela Nature & Leisure Park to mitigate the risk from new entrants in this arena. Medine is also the promoter of the Tamarina Golf Club, which consists of an 18-hole International Championship Golf Course, in accordance with the USGA standards and requirements.

72 | DEM 2010The Stock Exchange of Mauritius Ltd.
FINANCIAL REVIEW OF THE GROUP BALANCE SHEET (RS 000)
30 Jun 2009 2008 2007
ASSETS
Non-current assetsProperty, plant and equipment 9,348,696 9,236,503 9,038,370 Investment properties 305,784 283,710 241,007 Intangible assets 5,443 3,826 4,119 Investments in subsidiaries - - - Investments in associate 186,471 141,728 128,985 Investments in securities 69,374 44,633 47,072 Deferred expenditure 235,845 293,259 237,835 Biological assets 152,848 138,521 134,565 Deferred tax assets 7,608 17,303 4,210 10,312,069 10,159,483 9,836,163
Current assetsBiological assets 315,341 297,105 367,182 Inventories 63,154 60,953 67,291 Construction work-in-progress - 48,395 91,447 Trade and other receivables 278,525 591,867 866,180 Amount due from group companies - - - Cash in hand and at bank 73,412 329,166 420,153 730,432 1,327,486 1,812,253
Total assets 11,042,501 11,486,969 11,648,416
EQUITY AND LIABILITIES
Capital and reservesStated capital 1,050,000 1,050,000 1,050,000 Revaluation and other reserves 6,963,406 7,012,389 7,036,182 Retained earnings 2,010,933 1,843,008 1,911,313 Equity holder’s interests 10,024,339 9,905,397 9,997,495 Minority interests 55,981 59,507 53,274
Total equity 10,080,320 9,964,904 10,050,769
LIABILITIES
Non-current liabilities Deferred tax liabilities 20,289 20,854 20,336 Other payable 4,125 4,125 4,125 Borrowings 224,901 223,438 231,262 Retirement benefit obligations 111,384 112,966 205,662 360,699 361,383 461,385
Current liabilities Borrowings 83,216 423,755 317,083 Trade and other payables 458,928 719,497 717,352 Amount due to group companies - - - Proposed dividends 52,500 - 63,000 Current tax liabilities 251 2,121 38,827 Derivative financial instruments 6,587 15,309 - 601,482 1,160,682 1,136,262
Total liabilities 962,181 1,522,065 1,597,647 Total equity and liabilities 11,042,501 11,486,969 11,648,416

DEM 2010 | 73The Stock Exchange of Mauritius Ltd.
INCOME STATEMENT (RS 000)
30 Jun 2009 2008 2007
Turnover 1,287,361 2,138,549 2,706,577 Sugar insurance compensation 3,867 19,018 87 Other operating revenue 71,118 66,570 64,091 Sugar insurance premium (46,352) (54,528) (55,067)Changes in fair value of biological assets (7,131) (102,341) (18,811)Operating expenses (1,131,259) (1,960,237) (2,333,462)Gross profit 177,604 106,941 363,415 Selling and marketing expenses (27,044) (38,663) (51,365)Administrative expenses (180,923) (144,397) (154,601)Other income 29,578 19,075 104,389 (Loss)/Profit before finance costs (785) (57,044) 261,838 Finance costs - net 99,308 (206,686) (54,500)(Loss)/Profit before exceptional items 98,523 (263,730) 207,338 Exceptional items 106,870 253,360 632,919 (Loss)/Profit after exceptional items 205,393 (10,370) 840,257 Share of result of associates 52,243 25,243 50,242 Profit before taxation 257,636 14,873 890,499 Income tax credit/(charge) (9,461) 10,483 (48,726)Profit after tax 248,175 25,356 841,773 Attributable to: Equity holders of the Company 251,701 17,841 828,301 Minority interest (3,526) 7,515 13,472 Profit for the year 248,175 25,356 841,773
STATISTICS
Number of shares used in calculation 105,000,000 105,000,000 105,000,000Earnings per share (Rs) 2.40 0.17 7.89Dividends per share (Rs) 1.50 1.00 1.50Net asset value per share (Rs) 95.47 94.34 95.21

74 | DEM 2010The Stock Exchange of Mauritius Ltd.
The Medine Shares Holding Company Limited
SEM Code : MSH.I0000
Classification : Investment
Registered Office : 11th Floor, Medine Mews, 4 Chaussée Street, Port Louis
Board of Directors : Pierre DOGER DE SPÉVILLE – Chairman Daniel GIRAUD – Chief Executive Ganeshwar GUJADHUR René LECLÉzIO Marc DE RAVEL
Company Secretary : Patricia GODER
Senior Executive : Daniel GIRAUD – Chief Executive
Principal Activities : Investment holding
SUMMARY INFORMATION
The Medine Shares Holding Company Limited was incorporated in 1947. Its main activity consists of the holding of investments.
Its key investments are namely the holding of 25.29% and 26.13% of the share capital of Medine Limited and Excelsior United Development Companies Limited respectively.

DEM 2010 | 75The Stock Exchange of Mauritius Ltd.
INCOME STATEMENT (RS)
FINANCIAL REVIEW OF THE GROUP BALANCE SHEET (RS)
30 Jun 2009 2008 2007
ASSETS
Non-current assetsInvestments in associates 2,777,075,042 2,754,662,137 2,739,175,935Investments in securities 36,701 53,165 50,078 2,777,111,743 2,754,715,302 2,739,226,013Current assetsTrade and other receivables 13,274,825 131,677 16,053,886Bank balance 74,542 136,660 296,889 13,349,367 268,337 16,350,775
Total assets 2,790,461,110 2,754,983,639 2,755,576,788
EQUITY AND LIABILITIES
Capital and reservesShare capital 6,467,910 6,467,910 6,467,910Share premium 60,559,800 60,559,800 60,559,800Fair value and other reserves 2,109,718,038 2,149,907,555 2,130,614,337Retained earnings 600,027,936 537,628,395 541,677,272
Total equity 2,776,773,684 2,754,563,660 2,739,319,319
Current liabilitiesOther payables 428,128 418,943 391,513Current tax liabilities 82 1,036 19,576Proposed dividends 13,259,216 - 15,846,380 13,687,426 419,979 16,257,469
Total equity and liabilities 2,790,461,110 2,754,983,639 2,755,576,788
30 Jun 2009 2008 2007
Dividend income 1,715 2,058 1,715Share of profit of associates 97,413,692 30,674,375 231,653,133Other income 560 7,581 88,218Gross income 97,415,967 30,684,014 231,743,066Administrative expenses (1,245,644) (1,014,594) (803,048)Profit before finance cost 96,170,323 29,669,420 230,940,018Finance cost (25,425) (478) (1,238)Profit before taxation 96,144,898 29,668,942 230,938,780Income tax (157) (1,036) (19,576)Net profit for the year 96,144,741 29,667,906 230,919,204
STATISTICS
Number of shares used in calculation 646,791 646,791 646,791Earnings per share (Rs) 148.65 45.87 357.02Dividends per share (Rs) 81.00 59.50 79.50Net asset value per share (Rs) 4,293.15 4,258.82 4,235.24

76 | DEM 2010The Stock Exchange of Mauritius Ltd.
Morning Light Co Ltd
SEM Code : MOLI.I0000
Classification : Leisure & Hotels
Registered Office : 301, Chancery House, Lislet Geoffroy Street, Port Louis, Mauritius
Board of Directors : ABOUDA Essam AH TECK Carl – (Chairman) AH TECK Patrice AH TECK Tommy ANDERSON Derrek (alternate to ABOUDA Essam) FON SING Alex FON SING Clifford (alternate to FON SING Alex) HOW KIN SANG Cyril ISHWURLAL Golam NARAYANIN Peter David (alternate to NARAYANIN Theophane) NARAYANIN Theophane WAY Mark WILSON Brian (alternate to WAY Mark) YOO FOO Peter Henry (alternate to YOO FOO Sir Francois Henri) YOO FOO Sir Francois Henri
Company Secretary : LEU SAN Clement
Principal Activities : The company owns a first class resort hotel of international standard named as the “Hilton Mauritius Resort & Spa”.
SUMMARY INFORMATION
The company was incorporated on 26 October 1994 and was converted into a public company on 7 February 2006.
It was admitted to the Over-The-Counter Market of the Stock Exchange of Mauritius in February 2006 and then to the Development & Enterprise Market in January 2007.
The hotel is managed and operated by Hilton International, the worldwide hotel group.

DEM 2010 | 77The Stock Exchange of Mauritius Ltd.
INCOME STATEMENT (RS)
FINANCIAL REVIEW OF THE GROUP BALANCE SHEET (RS)
30 Jun 2009 2008 2007
ASSETS
Non-current assetsProperty, plant and equipment 958,353,267 940,329,579 958,082,195
Current assetsInventories 9,573,756 7,844,754 6,416,105 Trade and other receivables 70,084,166 56,526,450 73,332,663 Cash at hand and in bank 29,693,627 43,440,603 13,215,231 109,351,549 107,811,807 92,963,999
Total assets 1,067,704,816 1,048,141,386 1,051,046,194
EQUITY AND LIABILITIES
Capital and reservesStated capital 459,615,800 459,615,800 459,615,800 Revaluation reserve 238,867,862 242,487,062 289,536,262 Profit and loss account 103,689,284 119,412,548 (71,712,145)
Total equity 802,172,946 821,515,410 677,439,917
LIABILITIES
Non-current liabilitiesObligations under finance leases 854,746 1,306,937 1,685,388 Retirement benefit obligations 6,949,000 5,785,000 4,673,000 Deferred tax liability 41,459,000 27,988,000 - Debentures - - 8,337,000 Bank loan 12,499,980 24,999,976 37,499,980 61,762,726 60,079,913 52,195,368
Current liabilitiesBank overdraft 91,101,722 2,523,464 7,385,990 Trade and other payables 92,837,188 108,920,380 132,876,258 Obligations under finance leases 452,189 403,287 381,546 Debentures - 8,337,000 58,359,000 Bank loan 12,500,000 12,500,004 12,500,004 Shareholders’ loans - - 48,024,000 Amount due to a related company 6,878,045 33,861,928 61,884,111 203,769,144 166,546,063 321,410,909
Total liabilities 265,531,870 226,625,976 373,606,277
Total equity and liabilities 1,067,704,816 1,048,141,386 1,051,046,194
30 Jun 2009 2008 2007
Turnover 513,517,572 610,985,640 562,716,079 Cost of sales (272,539,617) (287,689,549) (272,777,944)Gross profit 240,977,955 323,296,091 289,938,135 Other income 14,591,434 10,336,986 17,431,700 Operating expenses (151,762,459) (148,057,055) (146,881,349)Operating profit 103,806,930 185,576,022 160,488,486 Finance costs (10,778,069) (13,512,529) (27,839,962)Profit before taxation 93,028,861 172,063,493 132,648,524 Taxation (20,448,165) 15,442,000 - Profit for the year 72,580,696 187,505,493 132,648,524
STATISTICS
Number of ordinary shares used in calculation 45,961,580 45,961,580 45,961,580 Earnings per share (Rs) 1.58 4.08 2.89Dividends per share (Rs) 2.00 - -Net asset value per share (Rs) 17.45 17.87 14.74

78 | DEM 2010The Stock Exchange of Mauritius Ltd.
Paper Converting Company Limited
SEM Code : PCCL.I0000
Classification : Industry
Registered Office : Bonne Terre, Vacoas
Board of Directors : Jadoo Hermann DOOKUN – Chairman Lady Henriette DOOKUN Jawaheer Lall DOOKUN Uwe HOLLMICHEL Assish Kumar Ghanshyam SINGH JUGMOHUN Navind Kumar DOOKUN
Managing Director : Jadoo Hermann DOOKUN
Company Secretary : St James Secretaries Limited
Principal Activities : Manufacture of toilet and tissue products, under license of Kimberly Clark Corp of USA.
SUMMARY INFORMATION
Incorporated in October 1967, Paper Converting Co Ltd manufactures a wide range of toilet and tissue paper under license from Kimberly Clark Corp of USA.
Over the years the Company has consolidated its leadership in the Mauritian market and has largely contributed in making Kleenex paper products as a household name in Mauritius. Conscious of the concept of quality improvement and in line with the increase in the demand of its product the Company has recently invested in a complete machine line of production designed with the latest state-of-the-art technology with the objective to offer quality products and to meet consumers satisfaction in a today’s competitive environment.
The Company’s research and development unit has also focused on the need of the industrial, catering and tourism sector which saw the incorporation of subsidiary companies Tissue Converting Ltd and Pacon Ltd who caters for the production of a different range of products ranging from Jumbo toilet rolls to tailor-made paper products governed under the international corporation policy concerning quality control.

DEM 2010 | 79The Stock Exchange of Mauritius Ltd.
INCOME STATEMENT (RS)
FINANCIAL REVIEW OF THE GROUP BALANCE SHEET (RS)
30 Jun 2009 2008 2007
ASSETS
Non-current assetsProperty, plant and equipment 212,083,419 107,342,963 96,120,233 Intangible Assets 38,220 - -Investments 4,075,701 5,560,051 5,560,051 216,197,340 112,903,014 101,680,284
Current assetsInventories 40,211,574 38,035,658 11,792,542 Trade and other receivables 69,627,323 123,495,531 66,501,012 Short term deposits - - 19,837,479 Cash at bank and in hand 6,457,878 5,021,500 5,819,147 116,296,775 166,552,689 103,950,180
Total assets 332,494,115 279,455,703 205,630,464
EQUITY AND LIABILITIES
Capital and reservesShare Capital 15,000,000 15,000,000 15,000,000 Share Premium 4,368,750 4,368,750 4,368,750 Revaluation Reserve 59,384,751 59,384,751 66,577,251 Retained earnings 103,198,235 81,465,709 70,952,487
Total equity 181,951,736 160,219,210 156,898,488
LIABILITIES
Non-current LiabilitiesBorrowings 34,649,658 40,000,000 - Deferred income taxes 8,379,980 3,618,970 3,397,146 43,029,638 43,618,970 3,397,146
Current liabilitiesBorrowings 9,208,555 10,000,000 - Trade and other payables 69,725,872 58,430,364 44,185,315 Current tax liabilities - 1,814,931 755,262 Bank overdraft 27,078,314 3,572,228 394,253 Dividend payable 1,500,000 1,800,000 - 107,512,741 75,617,523 45,334,830 Total liabilities 150,542,379 119,236,493 48,731,976
Total equity and liabilities 332,494,115 279,455,703 205,630,464
30 Jun 2009 2008 2007
Revenue 131,045,385 87,103,733 86,529,484 Cost of sales (106,352,973) (66,225,743) (72,233,385)Gross Profit 24,692,412 20,877,990 14,296,099 Other Operating Income 28,534,148 11,631,077 11,091,297 Distribution costs (2,674,834) (6,690,275) (7,417,319)Administrative expenses (13,577,695) (8,185,651) (6,600,868)Other operating expenses (3,145,769) (2,459,269) (1,938,086)Profit from operations 33,828,262 15,173,872 9,431,123 Finance costs (6,633,423) (821,111) (47,431)Profit before tax 27,194,839 14,352,761 9,383,692 Taxation (4,224,030) (2,039,539) (632,007)Profit after tax 22,970,809 12,313,222 8,751,685 Dividends (1,500,000) (1,800,000) - Profit retained for the year 21,470,809 10,513,222 8,751,685
STATISTICS
Number of ordinary shares used in calculation 1,500,000 1,500,000 1,500,000 Earnings per share (Rs) 15.31 8.21 5.83Dividends per share (Rs) 0.50 1.20 -Net asset value per share (Rs) 121.30 106.81 104.60

80 | DEM 2010The Stock Exchange of Mauritius Ltd.
Phoenix Investment Company Limited
SEM Code : PHIN.I0000
Classification : Investment
Registered Office : 11th Floor, Swan Group Centre, 10 Intendance Street, Port Louis
Board of Directors* : Thierry LAGESSE – (Chairman) Jan BOULLÉ François DALAIS François HUGNIN J. Cyril LAGESSE Arnaud LAGESSE George WIEHE
Alternate Director : Arnaud Lagesse (Alternate Director to J. Cyril Lagesse)
Company Secretary : GML Services Financiers et Juridiques Ltée
Principal Activities : Investment
* List of Directors and Alternate Director as at 23 June 2010
SUMMARY INFORMATION
Phoenix Investment Company Limited is an investment company which holds 31.02% ofthe shares of its subsidiary Phoenix Beverages Limited (“PBL”). PBL is the leadingbeverages company in Mauritius and offers a wide range of Beers, Wines, Soft Drinksand Table Water. Its main brands being Phoenix, Blue Marlin, Guinness, Smirnoff Ice,Coca Cola, Sprite, Fanta, Schweppes, Pearona and Crystal.

DEM 2010 | 81The Stock Exchange of Mauritius Ltd.
FINANCIAL REVIEW OF THE GROUP BALANCE SHEET (RS 000)
30 Jun 2009 2008 2007
ASSETS
Non-current assetsProperty, plant and equipment 2,092,785 1,895,263 1,875,833 Intangible assets 12,640 5,762 7,762 Investments in subsidiary company - - - Investments in associated companies 140,854 162,912 10,490 Investments in financial assets 12,794 575 575 2,259,073 2,064,512 1,894,660
Current assetsInventories 416,987 369,057 257,628 Trade and other receivables 201,664 221,235 221,399 Bank balances and cash 94,770 52,057 136,111 713,421 642,349 615,138 Non-currents assets classified as held for sale - 12,224 13,801
Total assets 2,972,494 2,719,085 2,523,599
EQUITY AND LIABILITIES
Capital and reservesShare Capital 93,399 93,399 93,399 Revaluation and other reserves 196,602 194,383 189,123 Retained earnings 306,720 265,264 224,581 Shareholders’ interest 596,721 553,046 507,103 Minority interests 1,497,053 1,402,049 1,299,683
Total equity 2,093,774 1,955,095 1,806,786
LIABILITIES
Non-current liabilitiesBorrowings 75,993 119,323 153,636 Deferred tax liabilities 148,555 135,499 123,457 Retirement benefit obligations 30,506 41,596 58,891 255,054 296,418 335,984
Current liabilitiesTrade and other payables 489,292 274,984 280,081 Current tax liabilities 30,295 33,746 25,340 Borrowings 72,127 131,552 50,620 Proposed dividends 31,952 27,290 24,788 623,666 467,572 380,829
Total liabilities 878,720 763,990 716,813
Total equity and liabilities 2,972,494 2,719,085 2,523,599

82 | DEM 2010The Stock Exchange of Mauritius Ltd.
FINANCIAL REVIEW OF THE GROUP INCOME STATEMENT (RS 000)
30 Jun 2009 2008 2007
Revenue 3,202,342 2,897,155 2,709,546 Manufacturing costs 1,565,928 1,450,941 1,316,192 Excise duty 711,745 670,736 671,702 Cost of sales 2,277,673 2,121,677 1,987,894 Gross profit 924,669 775,478 721,652 Other income 31,522 59,249 5,993 Marketing, warehousing, selling and distribution expenses (390,635) (322,492) (308,964)Administrative expenses (216,704) (184,601) (174,250) 348,852 327,634 244,431 Profit on disposal of property and securities - - 54,128 Movement on reduction of shares in associate 3,734 - - Profit before finance costs 352,586 327,634 298,559 Finance income/(costs) (21,314) (22,997) (34,015)Share of results of associates (30,545) (32,957) (6,896)Profit before taxation 300,727 271,680 257,648 Taxation (charge)/credit (52,537) (48,433) 8,683 Profit for the year 248,190 223,247 266,331 Equity holders of the company 76,087 67,973 82,922 Minority interests 172,103 155,274 183,409
STATISTICS
Number of ordinary shares used in calculation 5,685,387 5,685,387 5,685,387 Earnings per share 13.38 11.96 14.58Dividends per share (Rs) 5.62 4.80 4.36Net asset value per share (Rs) 104.96 97.27 89.19
DEM 2010 | 83The Stock Exchange of Mauritius Ltd.
Quality Beverages Limited
SEM Code : QBL.I0000
Classification : Industry
Registered Office : 6, Sir William Newton Street, Port Louis
Board of Directors : Mr. Currimjee J CURRIMJEE, Mr. Fakhruddin J CURRIMJEE, Mr. Mustanshir A CURRIMJEE, Mr. Bashirally A CURRIMJEE, Mr. Azim F CURRIMJEE, Mr. Raffi CURRIMJEE, Mr. Anil C CURRIMJEE, Mr. Ashraf M CURRIMJEE, Mr. Mazahir F E ADAMJEE, Mr. Hassam VAYID Mr. Saliah M SAIT
Company Secretary : Currimjee Limited
Principal Activities : Bottling and distribution of beverages
SUMMARY INFORMATION
Quality Beverages Limited (‘QBL’) started operations in 1955 as a Pepsi Cola Franchise Bottler. It is now one of the two leading bottlers and distributors of soft drinks in Mauritius. Its product portfolio includes the full Pepsi-Cola range of soft drinks. Quality Beverages Limited is also present in the non-carbonated and fruit based segments with local brands.
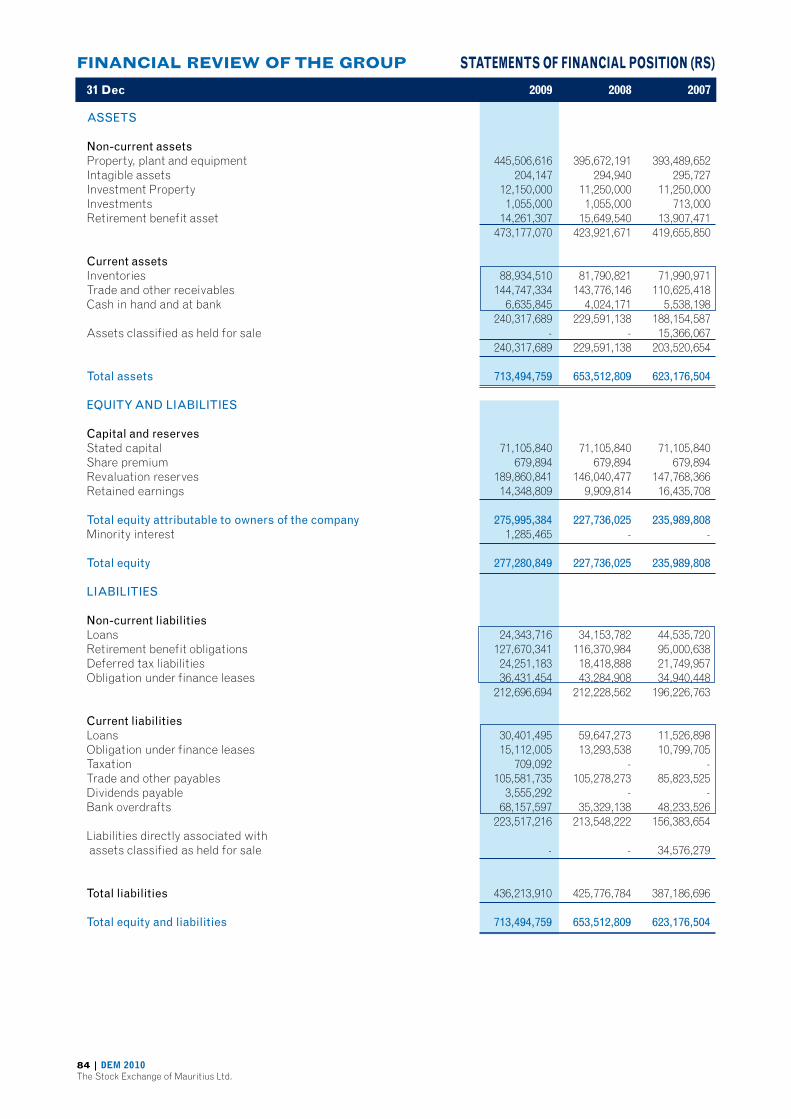
84 | DEM 2010The Stock Exchange of Mauritius Ltd.
FINANCIAL REVIEW OF THE GROUP STATEMENTS OF FINANCIAL POSITION (RS)
31 Dec 2009 2008 2007
ASSETS
Non-current assetsProperty, plant and equipment 445,506,616 395,672,191 393,489,652 Intagible assets 204,147 294,940 295,727 Investment Property 12,150,000 11,250,000 11,250,000 Investments 1,055,000 1,055,000 713,000 Retirement benefit asset 14,261,307 15,649,540 13,907,471 473,177,070 423,921,671 419,655,850
Current assetsInventories 88,934,510 81,790,821 71,990,971 Trade and other receivables 144,747,334 143,776,146 110,625,418 Cash in hand and at bank 6,635,845 4,024,171 5,538,198 240,317,689 229,591,138 188,154,587 Assets classified as held for sale - - 15,366,067 240,317,689 229,591,138 203,520,654
Total assets 713,494,759 653,512,809 623,176,504
EQUITY AND LIABILITIES
Capital and reservesStated capital 71,105,840 71,105,840 71,105,840 Share premium 679,894 679,894 679,894 Revaluation reserves 189,860,841 146,040,477 147,768,366 Retained earnings 14,348,809 9,909,814 16,435,708
Total equity attributable to owners of the company 275,995,384 227,736,025 235,989,808 Minority interest 1,285,465 - -
Total equity 277,280,849 227,736,025 235,989,808
LIABILITIES
Non-current liabilities Loans 24,343,716 34,153,782 44,535,720 Retirement benefit obligations 127,670,341 116,370,984 95,000,638 Deferred tax liabilities 24,251,183 18,418,888 21,749,957 Obligation under finance leases 36,431,454 43,284,908 34,940,448 212,696,694 212,228,562 196,226,763
Current liabilities Loans 30,401,495 59,647,273 11,526,898 Obligation under finance leases 15,112,005 13,293,538 10,799,705 Taxation 709,092 - -Trade and other payables 105,581,735 105,278,273 85,823,525 Dividends payable 3,555,292 - -Bank overdrafts 68,157,597 35,329,138 48,233,526 223,517,216 213,548,222 156,383,654Liabilities directly associated with assets classified as held for sale - - 34,576,279
Total liabilities 436,213,910 425,776,784 387,186,696 Total equity and liabilities 713,494,759 653,512,809 623,176,504

DEM 2010 | 85The Stock Exchange of Mauritius Ltd.
FINANCIAL REVIEW OF THE GROUP STATEMENTS OF COMPREHENSIVE INCOME (RS)
31 Dec 2009 2008 2007
Revenue 513,337,338 481,557,754 466,378,398 Cost of sales (334,720,117) (315,694,000) (318,129,942)Gross Profit 178,617,221 165,863,754 148,248,456 Investment income 260,530 1,578,296 167,439 Other income 2,489,818 2,270,098 2,585,540 Selling, distribution and marketing expenses (67,495,080) (67,073,696) (69,850,078)Administrative expenses (93,982,489) (94,468,857) (73,394,205)Finance costs (15,875,374) (20,472,879) (18,520,712)Fair value gain on investment property 900,000 - -Profit/ (loss) before taxation 4,914,626 (12,303,284) (10,763,560)Taxation (507,356) 3,331,069 (1,138,276)Profit/ (loss) for the year from continuing operations 4,407,270 (8,972,215) (11,901,836) Discontinued Operations Profit/ (loss) for the year from discontinued operations - 376,432 6,967,862 Profit/ (loss) for the year 4,407,270 (8,595,783) (4,933,974) Earnings/ (loss) per share From continuing and discontinued operations 0.64 (1.21) (0.69)From continuing operations 0.64 (1.26) (1.67)
STATISTICS
Number of ordinary shares used in calculation 7,110,584 7,110,584 7,110,584 Loss per share From continuing and discontinued operations 0.64 (1.21) (0.69)From continuing operations 0.64 (1.26) (1.67)Dividends per share (Rs) 0.50 - - Net asset value per share (Rs) 38.99 32.03 33.19
86 | DEM 2010The Stock Exchange of Mauritius Ltd.
Robert Le Maire Limited
SEM Code : RLM.I0000
Classification : Commerce
Registered Office : 11th Floor, Swan Group Centre,, 10 Intendance Street, Port Louis
Board of Directors* : Arnaud LAGESSE – (Chairman) Jean Claude HAREL Roger KOENIG – (Chief Executive Officer) J. Cyril LAGESSE Eric LE BRETON – (Chief Operating Officer) Maxime REY Georges André ROBERT
Company Secretary : GML Services Financiers et Juridiques Ltée
Principal Activities : Sales and maintenance of agricultural machineries and spares, pesticides, light, industrial equipment, tooling, welding electrodes etc.
Engineering, M&E contracting services and lifts & escalators. Merchant traders. Wholesaling and retailing of hardware, medical equipment and consumables.
* List of Directors, Chief Executive Officer and Chief Operating Officer as at 23 June 2010.
SUMMARY INFORMATION
Robert Le Maire Limited (RLM) is a long standing and well established company founded and incorporated on 25 November 1931.
The main activities of RLM are those of general agents, importers, merchants, and providers of engineering and contracting services.
Over the years RLM acquired and developed strategic investments in a number of subsidiary and associate companies operating in related fields of activities, as described below. They operate locally in all major sectors of the Mauritian economy and are also present Madagascar, RSA, India and Bangladesh in specific sectors.
The RLM Group (RLMG) activities are organized under three main clusters namely:
•TheCommercialandEngineeringcluster•ThePrintingcluster•TheTextilecluster.
The Group’s activities are diversified, the main ones being summarised as follows:
• Importersanddistributorsofequipmentandconsumablesforthelocalagroindustry (Tractors, cane harvesters, trailers etc).•Offeringelectro-mechanicalexpertiseinautomatedproductionsystemsand electronic process control.•Projectmanagement,executionandrealisationinspecificengineeringactivities.•ProvidersofliftsandescalatorsandM&EContractingServices.• Importersanddistributorsofawidevarietyoflightengineeringproducts,toolsandequipment.•Printingequipment,materialsandconsumables.•Textilemachines,dyestuffandrawmaterials.•Supplyingmedicalequipmentandconsumables.•Energysavingdevices.
RLM is listed on the Development & Enterprise Market (DEM) of the Stock Exchange ofMauritius since the creation of this market.

DEM 2010 | 87The Stock Exchange of Mauritius Ltd.
FINANCIAL REVIEW OF THE GROUP BALANCE SHEET (RS)
30 Jun 2009 2008 2007
ASSETS
Non-current assetsInvestment properties 9,500,000 9,500,000 9,100,000 Intangible assets 46,206,962 47,243,837 70,457,818 Property,plant and equipment 135,543,838 141,565,996 133,142,248 Investments in subsidiaries - - - Investments in associates 46,974,889 29,176,013 41,847,776 Other investments 20,411,980 14,486,489 15,399,169 Deferred tax asset - - 524,457 258,637,669 241,972,335 270,471,468
Current assetsStocks and work in progress 440,357,245 436,896,255 349,835,400 Trade and other receivables 556,265,765 526,778,741 448,692,984 Tax refundable - - - Amount owned by related companies - - - Advance to associate - - 2,225,000 Cash and bank balances 32,025,038 38,517,829 27,834,781 1,028,648,048 1,002,192,825 828,588,165 Assets classified as held for sale 89,873,167 148,341,894 - Total currents assets 1,118,521,215 1,150,534,719 828,588,165
Total assets 1,377,158,884 1,392,507,054 1,099,059,633 EQUITY AND LIABILITIES
Capital and reservesStated capital 21,763,800 21,763,800 21,763,800 Reserves 412,187,048 344,188,729 224,598,583 Equity attributable to equity holders 433,950,848 365,952,529 246,362,383 Minority interests 14,051,505 14,874,062 10,809,337
Total equity 448,002,353 380,826,591 257,171,720
Non-current liabilities Subsidiary’s founder share 596,364 302,227 581,455 Loans 38,730,816 40,955,380 51,021,830 Deferred tax liabilities 3,146,277 2,069,220 - Obligations under finance lease 20,345,960 29,553,907 17,524,281 Retirement benefit obligations 41,127,176 44,282,411 50,930,692 103,946,593 117,163,145 120,058,258 Current liabilitiesBank overdrafts (secured) 334,475,100 337,493,741 299,623,991 Trade and other payables 282,577,481 372,706,382 275,590,123 Bills payable 101,091,984 76,292,375 61,162,941 Amount due to related companies - - - Loans 77,447,401 60,964,400 58,528,840 Obligations under finance lease 11,743,722 11,424,548 7,576,284 Income tax 5,904,160 13,895,855 12,818,336 Dividends 11,970,090 10,881,900 6,529,140 825,209,938 883,659,201 721,829,655 Liabilities associated with assets classified as held for sale - 10,858,117 - 825,209,938 894,517,318 721,829,655
Total equity and liabilities 1,377,158,884 1,392,507,054 1,099,059,633 30

88 | DEM 2010The Stock Exchange of Mauritius Ltd.
FINANCIAL REVIEW OF THE GROUP INCOME STATEMENT (RS)
30 Jun 2009 2008 2007
Continuing operations Turnover 1,763,891,349 1,671,351,542 1,290,447,179 Cost of sales (1,387,045,203) (1,319,839,618) (1,000,622,335)Gross profit 376,846,146 351,511,924 289,824,844 Administrative expenses (287,887,937) (243,185,599) (217,715,081)Profit from operations 88,958,209 108,326,325 72,109,763 Surplus on revaluation of investment property - 5,700,000 - Share of results of associates 25,298,876 17,915,900 (48,725)Other income 28,661,839 28,431,898 26,936,005 Finance costs (54,944,385) (62,965,641) (51,216,392)Profit before taxation 87,974,539 97,408,482 47,780,651 Taxation (13,559,206) (16,501,795) (13,803,096)Profit for the year from continuing operations 74,415,333 80,906,687 33,977,555 Discontinued operations Profit for the year from discontinued operations 2,145,292 13,421,040 3,710,251 Profit for the year 76,560,625 94,327,727 37,687,806 Minority interests (4,563,060) (5,965,110) (1,877,660)Profit attributable to equity holders 71,997,565 88,362,617 35,810,146
STATISTICS
Earnings per share (Rs) 33.08 40.60 16.45 Dividends per share (Rs) 5.50 5.00 3.00 Net asset value per share (Rs) 199.39 168.15 113.20

DEM 2010 | 89The Stock Exchange of Mauritius Ltd.
RHT Holding Ltd
SEM Code : RHT.I0000
Classification : Investment Company
Registered Office : 14 Hugnin Road, Rose Hill
Board of Directors : Paul Chung Kim Fung AH LEUNG Sanjiva GOBURDHUN Ravindra GOBURDHUN Yoosuf Mohammad KUREEMAN Gilbert Patrick Stéphane LEAL Nayan SHARMA – (Chairperson) Sidhartha SHARMA Van Man SIN KWOK WONG
Senior Executives : Sanjiva GOBURDHUN Sidhartha SHARMA
Company Secretary : ConSec Ltd
Principal Activities : Investment Holding Company
SUMMARY INFORMATION
RHT Holding Ltd (formerly known as Rose-Hill Transport Limited) was incorporated in 1954 and it regrouped five individual operators who were operating on Route No. 1 since 1952. It was admitted on the Over-the-Counter Market (now DEM) of the Stock Exchange of Mauritius Ltd (SEM) in May 2001.
Today, more than 56 years after start of operations, RHT has a fleet of 88 buses, including 50 air-conditioned vehicles and caters for the transport needs of more than 10M passengers annually.
As from 01st January 2009, the Company has been restructured into different clusters namely: RHT Bus Services Ltd, RHT Properties Ltd, RHT Investments Ltd and RHT Ventures Ltd and RHT Fund Management Ltd.
The shareholders of the company resolved to change the name of the Company to RHT Holding Limited at a special meeting held on the 10th May 2010 and effective as from the 01st July 2010 to reflect more accurately its function after the restructuring, and it is now the holding company of the above-mentioned Companies.
RHT Investments Ltd is involved in the management of quoted and unquoted investments. It has substantial shareholding in the Mauritius Commercial Bank Ltd and in the tourism sector.
RHT Bus Services Ltd is involved in transport operations.
RHT Properties Ltd deals with the management & development of properties.
RHT Ventures Ltd is involved in investment in corporate entities and has four subsidiaries, one of which, RHT Systems (PVT) India Ltd, is incorporated in India. It also has interests in corporate entities in the media sector.
RHT Fund Management Ltd is involved in the Management of investment funds.

90 | DEM 2010The Stock Exchange of Mauritius Ltd.
FINANCIAL REVIEW OF THE GROUP BALANCE SHEET (RS)
30 Jun 2009 2008 2007
ASSETS
Non-current assetsProperty, plant and equipment 120,576,774 98,368,267 87,335,877 Investment properties 10,975,000 10,975,000 2,880,000 Intangible assets 5,055,028 5,305,663 5,237,863 Investment in subsidiaries - - - Investment in associate 692,805 690,383 - Investments in securities 458,569,020 595,933,062 366,181,961 Debenture (Unsecured) - - - Loan receivable - 2,000,000 - Deferred tax assets 9,338,020 5,298,323 2,686,807 605,206,647 718,570,698 464,322,508
Current assetsLoan receivable - 1,000,000 - Inventories 2,770,308 3,247,430 2,468,760 Trade and other receivables 19,071,093 27,387,292 21,595,769 Cash at bank and in hand 5,118,395 828,167 10,278,605 26,959,796 32,462,889 34,343,134
Total assets 632,166,443 751,033,587 498,665,642 EQUITY AND LIABILITIES
Capital and reservesStated Capital 24,324,300 24,324,300 24,324,300 Reserves 453,144,181 628,641,657 392,161,319
Equity attributable to equity holders of the parent 477,468,481 652,965,957 416,485,619Minority Interests 2,146,071 1,135,264 730,096
Total assets 479,614,552 654,101,221 417,215,715 LIABILITIES
Non-current liabilitiesBorrowings 1,000,000 2,642,855 4,870,499 Retirement benefit obligations 17,004,251 12,218,505 12,432,133 Obligations under finance lease 46,304,607 30,245,454 22,482,352 64,308,858 45,106,814 39,784,984
Current liabilitiesBank overdrafts (secured) 42,898,381 15,797,699 11,364,846 Borrowings 2,942,855 2,121,432 2,417,286 Taxation 65,904 - -Obligations under finance lease 13,193,817 8,289,506 5,773,178 Trade and other payables 22,452,893 20,022,326 18,217,745 Dividend proposed 6,689,183 5,594,589 3,891,888 88,243,033 51,825,552 41,664,943Total liabilities 152,551,891 96,932,366 81,449,927
Total equity and liabilities 632,166,443 751,033,587 498,665,642
30
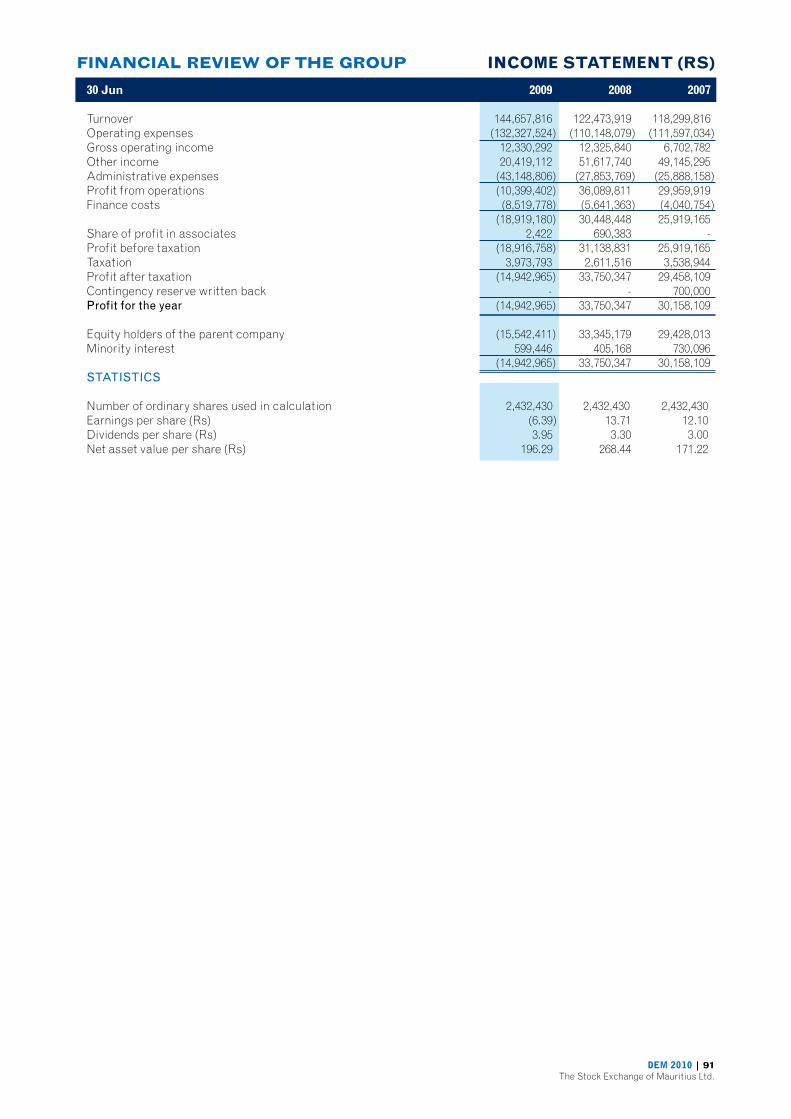
DEM 2010 | 91The Stock Exchange of Mauritius Ltd.
FINANCIAL REVIEW OF THE GROUP INCOME STATEMENT (RS)
30 Jun 2009 2008 2007
Turnover 144,657,816 122,473,919 118,299,816 Operating expenses (132,327,524) (110,148,079) (111,597,034)Gross operating income 12,330,292 12,325,840 6,702,782 Other income 20,419,112 51,617,740 49,145,295 Administrative expenses (43,148,806) (27,853,769) (25,888,158)Profit from operations (10,399,402) 36,089,811 29,959,919 Finance costs (8,519,778) (5,641,363) (4,040,754) (18,919,180) 30,448,448 25,919,165 Share of profit in associates 2,422 690,383 - Profit before taxation (18,916,758) 31,138,831 25,919,165 Taxation 3,973,793 2,611,516 3,538,944 Profit after taxation (14,942,965) 33,750,347 29,458,109 Contingency reserve written back - - 700,000 Profit for the year (14,942,965) 33,750,347 30,158,109 Equity holders of the parent company (15,542,411) 33,345,179 29,428,013 Minority interest 599,446 405,168 730,096 (14,942,965) 33,750,347 30,158,109STATISTICS
Number of ordinary shares used in calculation 2,432,430 2,432,430 2,432,430 Earnings per share (Rs) (6.39) 13.71 12.10 Dividends per share (Rs) 3.95 3.30 3.00 Net asset value per share (Rs) 196.29 268.44 171.22

92 | DEM 2010The Stock Exchange of Mauritius Ltd.
SIT Land Holdings Ltd
SEM Code : SIT.I1111
Classification : Others
Registered Office : 3rd floor Alexander House, 35 Cybercity, Ebene.
Board of Directors : Mr Rajen Manikion Chairman Mr Nundlall Basant Roi Mr Assenjee Gurib Mr Balakishnah Teeroovengadum Mr Chettandeo Bhugun Mr Yodhunsingh Daumoo Mr C F C Gerard Chung Kwan Fang Mr Seemadree Gunganah Mr Sobeersen Sanmukhiya
Senior Executive : Mr Ravin Premsagar Bholah – Chief Executive Officer – SIT Group
Company Secretary : SIT Corporated and Secretarial Services Ltd
Principal Activities : Dealings in matters relating to agriculture in general Acquire, hold and/or dispose of properties in general; and Investment holding
SUMMARY INFORMATION
SIT Land Holdings Ltd is a public company, incorporated in Mauritius. Its registered office and principal place of business is 3rd floor Alexander House, 35 Cybercity, Ebène.
The principal activities of the company are :
• Dealings in matters relating to agriculture in general;• Acquire, hold and /or dispose of properties in general; and• Investment holding.

DEM 2010 | 93The Stock Exchange of Mauritius Ltd.
INCOME STATEMENT (RS 000)
FINANCIAL REVIEW OF THE GROUP BALANCE SHEET (RS 000)
30 Jun 2009 2008 2007
ASSETS
Non-current assetsLand 392,740 431,435 488,276 Equipment 2,425 3,518 1,198 Intangible assets - - 3 Investment in associate 35,457 4,244 - Biological assets 28,182 27,437 33,005 Deferred expenditure 30,041 40,055 - Deferred tax assets 7,133 1,276 - 495,978 507,965 522,482 Current assetsTrade and other receivables 298,618 174,908 128,528 Biological assets 42,000 61,000 80,000 Bank and cash balances 28,529 26,219 18,263 369,147 262,127 226,791 Non current assets held for sale 24,515 20,502 27,635
Total assets 889,640 790,594 776,908
EQUITY AND LIABILITIES
Capital and reservesStated Capital 325,025 325,025 325,025 Retained earnings 310,275 192,793 142,863
Total equity 635,300 517,818 467,888
LIABILITIES
Non-current liabilities Borrowings 35,904 46,269 89,033 Retirement benefit obligations 11,067 9,749 39,493 46,971 56,018 128,526
Current liabilities Other payables 145,190 61,247 14,325 Borrowings 37,845 151,611 165,112 Taxation 24,334 3,900 1,057 207,369 216,758 180,494
Total liabilities 254,340 272,776 309,020 Total equity and liabilities 889,640 790,594 776,908
30 Jun 2009 2008 2007
Proceeds from sugar, molasses and other products 111,818 135,839 143,084 SIFB compensation 4,416 7,478 13,930 116,234 143,317 157,014 Other income 26,471 21,911 26,475 Changes in fair value ofbiological assets (19,000) (19,000) (11,000) 123,705 146,228 172,489 Sale of land 225,451 198,197 73,486 349,156 344,425 245,975 Operating expenses (91,400) (100,644) (104,922)SIFB premium (9,672) (13,342) (13,761)Amoritsation of VRS costs (10,014) (14,742) (25,045)Amortisation of biological assets (5,892) (6,342) (6,577)Cost of land sold (48,019) (87,841) (19,692)Administrative expenses (16,320) (9,923) (15,770) (181,317) (232,834) (185,767)Operating profit 167,839 111,591 60,208 Finance costs (20,843) (25,239) (31,309)Share of result of associate 31,213 5,205 (1,511)Profit before taxation 178,209 91,557 27,388 Taxation (18,477) (2,624) (1,196)Profit for the year 159,732 88,933 26,192
STATISTICS
Number of ordinary shares used in calculation 325,025,000 325,025,000 325,025,000 Earnings per share (Rs) 0.49 0.27 0.08 Dividends per share (Rs) 0.13 0.12 0.12 Net asset value per share (Rs) 1.95 1.59 1.44

94 | DEM 2010The Stock Exchange of Mauritius Ltd.
Soap & Allied Industries Limited
SEM Code : SAIL.I0000
Classification : Industry
Registered Office : 6, Sir William Newton Street, Port Louis
Board of Directors
Non-Executive Chairman : Mr. Bashirally A CURRIMJEE
Managing Director : Mr. Ashraf M CURRIMJEE
Non-Executive Directors : Mr. Mustanshir A CURRIMJEE Mr. Currim J CURRIMJEE Mr. Anil C CURRIMJEE Mr. Azim F CURRIMJEE Mr. Mazahir F E ADAMJEE
Independent Directors : Mr. Hassam VAYID Mr. Saliah Mohamed SAIT
Company Secretary : Currimjee Limited
Principal Activities : The principal activity of the Company is the manufacture of laundry and toilet soaps and detergents.
SUMMARY INFORMATION
Soap & Allied Industries Limited (‘SAIL’) was established in 1966 as an import substitution industry to manufacture laundry and toilet soap for the local market.
Over the years, SAIL has diversified its activities and today SAIL offers to its customers a wide gamut of products ranging from laundry soaps, toilet soaps, detergent powders, detergent liquids, shampoos to shower gels.
In spite of fierce competition, both local and imported, most of SAIL’s brands are market leaders. Since 2007, SAIL is an ISO 9001:2000 certified company.
SAIL has been exporting since 1982 and today, through SAIL International Ltd (SIL), SIL exports to six islands in the Indian Ocean and to the African Region.
Sail Distributors Ltd (‘SDL’), a wholly owned subsidiary of SAIL, distributes soap and detergent products, rice and other FMCG to hypermarkets, supermarkets, wholesalers and retailers nationwide.
SOAP AND ALLIED INDUSTRIES LTD.Old Moka Road Bell VillagePort-Louis Ile MauriceTel. : 212-0699

DEM 2010 | 95The Stock Exchange of Mauritius Ltd.
FINANCIAL REVIEW OF THE GROUP BALANCE SHEET (RS)
31 Dec 2009 2008 2007
ASSETS
Non-current assetsProperty,plant and equipment 236,548,692 201,321,912 203,677,920 Intagible assets 6,662,001 6,157,216 6,088,706 Investment Property 24,300,000 22,500,000 22,500,000 Investments in subsidiary company - - -Investments in associates 34,979,299 34,979,299 34,979,299 Investments in securities 37,280,593 28,780,593 29,197,733 Deferred tax assets - - 16,985 339,770,585 294,739,020 296,460,643
Current assetsStocks 102,355,510 153,757,929 110,857,085 Trade and other receivables 85,182,134 91,910,806 76,952,878 Amount due by subsidiaries - - -Amounts owed by related companies 4,080,018 10,185,291 6,088,525 Cash and bank balances 90,597 1,008,842 130,074 Assets classified as held for sale - - 13,562,684 191,708,259 256,862,868 207,591,246
Total assets 531,478,844 551,601,888 504,051,889 EQUITY AND LIABILITIES
Capital and reservesStated capital 41,013,000 41,013,000 41,013,000 Share premium 73,499,581 73,499,581 73,499,581 Capital reserve 8,208,112 8,208,112 8,208,112 Investment revaluation reserve 21,182,558 13,682,558 16,939,634 Revaluation reserve 62,202,743 42,988,887 45,940,834 Investment property reserve 11,768,459 11,768,459 11,768,459 Retained earnings 59,363,102 49,293,947 51,224,254
Total equity attributable to equity holders of the parent 277,237,555 240,454,544 248,593,874 LIABILITIES
Non-current liabilities Borrowings 4,261,247 5,572,993 9,576,724 Retirement benefit obligations 103,478,000 102,380,000 97,253,000 Deferred tax liabilities 6,397,362 146,172 604,143 114,136,609 108,099,165 107,433,867 Current liabilitiesBorrowings 79,858,906 149,794,693 85,550,615 Bills payable 14,944,330 18,322,506 39,509,655 Trade and other payables 33,446,096 24,179,212 21,695,860 Amounts owed to related companies 10,184,633 10,133,264 493,017 Taxation 1,670,715 618,504 775,001 140,104,680 203,048,179 148,024,148 Total equity and liabilities 531,478,844 551,601,888 504,051,889 30

96 | DEM 2010The Stock Exchange of Mauritius Ltd.
FINANCIAL REVIEW OF THE GROUP INCOME STATEMENT (RS)
31 Dec 2009 2008 2007
Turnover 535,296,343 502,641,582 410,475,582 Cost of sales (375,646,421) (369,124,451) (294,511,442)Gross Profit 159,649,922 133,517,131 115,964,140 Other income 4,068,490 1,893,236 13,427,634 Advertising and Selling Expenses (64,771,783) (55,405,918) (48,543,148)Administrative expenses (65,553,636) (58,443,467) (50,177,466)Profit from operations 33,392,993 21,560,982 30,671,160 Finance costs (10,169,305) (12,816,918) (12,300,004)Retirement benefit obligations - (5,127,000) 205,000 Share of results of associate companies - - (231,599)Profit before taxation 25,023,688 3,617,064 18,344,557 Taxation (4,701,283) (1,222,365) (2,413,530)Profit for the year attributable to equity holders of the parent 20,322,405 2,394,699 15,931,027
STATISTICS
Number of ordinary shares used in calculation 4,101,300 4,101,300 4,101,300 Earnings per share (Rs) 4.96 0.58 4.22Dividends per share (Rs) 2.50 2.00 1.50Net asset value per share (Rs) 67.60 58.63 65.83

DEM 2010 | 97The Stock Exchange of Mauritius Ltd.
Southern Cross Tourist Co. Ltd
SEM Code : SCT.I0000
Classification : Leisure & Hotels
Registered Office : Union Ducray, Rivière Des Anguilles, Mauritius
Board of Directors : Francois MONTOCCHIO – Chairman Jacques P . C. G CADY ROUSTAND DE NAVACELLE DE COUBERTIN Marie Jean Michel DOGER DE SPEVILLE Alain GIBLOT DUCRAY F Jacques GIBLOT DUCRAY Maurice R H LACOSTE M. J. Nicolas MERVEN
Company Secretary : Navitas Corporate Services Ltd
Principal Activities : Ownership and operation of an hotel trading as Le Preskil Beach Resort
SUMMARY INFORMATION
Southern Cross Tourist Co Ltd (SCT) which is listed on the Development and Enterprise Market owns and manages Le Preskil Beach Resort, a 200-rooms hotel of 3-plus standard situated on a prime site at Pointe Jerome, Mahebourg.
Despite the effect of the economic recession, the hotel has achieved good operational results and occupancy rate in 2009.

98 | DEM 2010The Stock Exchange of Mauritius Ltd.
INCOME STATEMENT (RS 000)
FINANCIAL REVIEW OF THE GROUP BALANCE SHEET (RS 000)
31 Dec 2009 2008 2007
ASSETS
Non-current assets 403,589 429,286 424,435 Current assets 112,891 73,728 111,180
Total assets 516,480 503,014 535,615
EQUITY AND LIABILITIES
Capital and reservesEquity holders’ interests 271,297 216,216 202,781
Non-Current liabilities 102,501 131,912 203,239
Current liabilities 142,682 154,886 129,595
Total equity and liabilities 516,480 503,014 535,615
31 Dec 2009 2008 2007
Turnover 360,344 328,587 316,424 Gross profit 221,633 192,990 195,740 Other income 5,614 4,220 5,152 227,247 197,210 200,892 Administrative and other expenses (139,891) (140,732) (134,661)Finance costs (4,782) (20,611) (23,711)Share of profit of associate 680 102 - Exceptional items (218,065) (2,574) - (Loss)/profit before taxation (134,811) 33,395 42,520 Taxation 2,827 (7,703) (1,223)(Loss)/profit for the year (131,984) 25,692 41,297
STATISTICS
Number of ordinary shares used in calculation 125,644,644 94,068,000 94,068,000 (Loss)/earnings per share (Rs) (1.05) 0.27 0.44Dividends per share 0.20 0.13 0.13Net asset value per share 2.16 2.30 2.16
DEM 2010 | 99The Stock Exchange of Mauritius Ltd.
Tropical Paradise Ltd
SEM Code : TPL.I0000
Classification : Leisure & Hotels
Registered Office : c/o Food & Allied Group Headquarters, Gentilly, Moka
Board of Directors : Pierre Elysée Michel DOGER DE SPEVILLE – Chairman (Alternate Director : Noel Pierre Augustin EYNAUD) Marie Joseph Jean-Paul CHASTEAU DE BALYON Marie Edouard Gilbert ESPITALIER-NOEL Marie Maxime Hector ESPITALIER-NOEL (Alternate Director : Mr. Marie André Eric Espitalier-Noël) Alex Voon Chong FON SING Jean Marie René LECLEzIO Armand MAUDAVE Marie François Pierre-Yves POUGNET
Company Secretary : Marie Françoise Hélène THEVENAU
Principal Activities : The main activity of the company is to operate the Labourdonnais Waterfront Hotel and Le Suffren Hotel & Marina at le Caudan Waterfront
SUMMARY INFORMATION
Tropical Paradise Co Ltd was incorporated in 1994 and is the owner of two business hotels on the Port Louis Waterfront trading under the name of The Labourdonnais Waterfront Hotel and Le Suffren Hotel & Marina.
The Labourdonnais was opened in December 1996 and has established itself as the leading business hotel in Mauritius and is today the favorite meeting place for local and overseas business people.
The hotel features 109 elegant and luxury Guests rooms and Suites and provides one of the most sought-after venues for high profile conferences, seminars, meetings and business forums.
The Labourdonnais has taken the lead in environment awareness and protection and was the first Hotel in the Southern Hemisphere to be awarded the ISO 14001 followed by Green Globe.
Following the success of the Labourdonnais Waterfront Hotel, Le Suffren Hotel & Marina, designed to satisfy the needs of the modern-day business traveler and holiday makers, opened in June 2004 on the new waterfront node in Port Louis.
Through its architecture, modern design, relaxed atmosphere, and its soft touch of leisure with its sandy beach, large pool area and daily catamaran cruises, Le Suffren appeal to those looking for a trendy alternative.
Nicely decorated with light wood and chrome, its 100 bedrooms combine the unique charm of a nautical setting with modern comfort and quality service.
The Labourdonnais Waterfront Hotel and Le Suffren Hotel & Marina are ideally located within walking distance of the central business district and are also within easy reach of the various cultural and tourist sites in Mauritius.

100 | DEM 2010The Stock Exchange of Mauritius Ltd.
INCOME STATEMENT (RS)
FINANCIAL REVIEW OF THE GROUP BALANCE SHEET (RS)
30 Jul 2009 2008 2007
ASSETS
Non-current assetsProperty, plant and equipment 1,054,240,529 1,027,847,059 1,023,751,084 Intangible assets 11,625,427 12,694,937 13,830,446Investment in financial assets 18,106,000 18,106,000 17,856,000 1,083,971,956 1,058,647,996 1,055,437,530 Current assetsInventories 5,851,960 4,917,171 4,282,140Trade and other receivables 28,577,940 40,142,498 30,207,592Cash and cash equivalents 5,112,369 8,644,731 6,124,502 39,542,269 53,704,400 40,614,234
Total assets 1,123,514,225 1,112,352,396 1,096,051,764
EQUITY AND LIABILITIES
Capital and reservesShare capital 575,000,000 325,000,000 325,000,000Revaluation reserve 144,753,016 394,753,016 394,753,016Retained earnings 85,280,022 64,976,969 36,026,076Shareolders’ interests 805,033,038 784,729,985 755,779,092
Non-current liabilities Borrowings 157,924,981 180,049,546 199,318,824Deferred tax liabilities 66,912,990 69,662,297 69,662,297Retirement benefit obligations 4,439,200 4,157,467 3,985,924 29,277,171 253,869,310 272,967,045
Current liabilities Trade and other payables 52,790,150 44,253,270 32,180,119Borrowings 33,713,866 26,799,831 32,575,508Current tax liabilities 2,700,000 2,700,000 2,550,000 89,204,016 73,753,101 67,305,627 Total equity and liabilities 1,123,514,225 1,112,352,396 1,096,051,764
30 Jul 2009 2008 2007
Turnover 349,684,689 346,153,516 289,708,129Cost of sales (74,474,847) (69,290,542) (60,089,421) Gross profit 275,209,842 276,862,974 229,618,708Other Operating Income 1,219,804 616,526 528,795Marketing and selling expenses (6,342,254) (5,006,514) (4,589,853)Administrative expenses (180,608,357) (166,096,207) (134,655,831)Depreciation and amortisation (24,619,921) (16,936,394) (22,661,827) Operating profit 64,859,114 89,440,385 68,239,992Interest Income 482,723 1,807,478 48,336Net finance costs (21,765,491) (33,693,679) (34,535,568)Investment income 3,677,400 1,078,000 2,165,800 Profit before taxation 47,253,746 58,632,184 35,918,560 Taxation 49,307 (2,681,291) (2,550,000) Profit for the year 47,303,053 55,950,893 33,368,560
STATISTICS
Number of ordinary shares used in calculation 50,000,000 25,000,000 25,000,000Earnings per share (Rs) 0.71 1.76 0.61Dividends per share (Rs) 0.30 0.60 0.30Net asset value per share (Rs) 14.60 28.39 27.23

DEM 2010 | 101The Stock Exchange of Mauritius Ltd.
Union Flacq Ltd
SEM Code : UFL.I0000
Classification : Investment
Registered Office : 11th Floor, Swan Group Centre, 10 Intendance Street, Port Louis
Board of Directors : Thierry LAGESSE (CHAIRMAN) Michel DOGER DE SPÉVILLE Agasthamuni GUJADHUR Dayanidhi GUJADHUR Arnaud LAGESSE J.Cyril LAGESSE Jean LAGESSE
Alternate Directors: : Cédric Doger de Spéville (Alternate Director to Michel Doger de Spéville)
Company Secretary : GML Services Financiers et Juridiques Ltée
Principal Activities : Holding Investment Company
SUMMARY INFORMATION
Union Flacq Ltd is a public company incorporated in Mauritius. It is the holding company of Flacq United Estates Limited Group (FUEL Group) and of Forward Investment and Development Enterprises Limited Group (FIDES Group) holding 51.12% and 70.78% respectively of these two Groups.
The activities of its subsidiaries are:
- Sugar Cane growing, milling and power generation via the FUEL Group
- The production and sale of macadams and bricks through its subsidiary Flacq Associated Stonemasters Limited
- Investment holding via the FIDES Group

102 | DEM 2010The Stock Exchange of Mauritius Ltd.
FINANCIAL REVIEW OF THE GROUP BALANCE SHEET (RS 000)
30 Jun 2009 2008 2007
ASSETS
Non-current assetsProperty,plant and equipment 4,838,661 4,775,091 4,880,474Investment properties 510,400 479,758 54,758Intangible assets 151,869 113,129 79,651Investments in subsidiaries - - -Investments in associates 161,219 5,942 8,694Investments in securities 1,345,141 1,401,574 1,434,351Deferred expenditure 395,358 431,995 109,935Deferred tax assets 44 41 9,094Biological assets 145,354 140,980 145,512Non-current receivables 58,643 118,575 153,825Loan receivable 6,701 10,959 14,762 7,631,390 7,478,044 6,891,056 Current assetsDeferred expenditure 101,418 82,334 91,639Biological assets 447,159 417,237 552,748Inventories 227,486 149,045 139,193Loan receivables 4,259 3,792 3,402Trade and other receivables 1,035,266 1,258,652 301,235Cash in hand and at bank 157,549 38,068 41,589 1,973,137 1,949,128 1,129,806
Total assets 9,586,527 9,427,172 8,020,862
EQUITY AND LIABILITIES
Capital and reservesStated capital 1,306,625 1,306,625 33,503Share premium 20,182 20,182 253,845Revaluation and other reserves 1,034,476 1,096,053 2,158,090Retained earnings 1,040,696 1,046,406 892,171Equity attributable to equity holders 3,401,979 3,469,266 3,337,609Minority interests 3,154,462 3,196,174 2,985,025 6,556,441 6,665,440 6,322,634
Non-current liabilities Borrowings 915,710 838,336 585,164Deferred tax liabilities 75,529 102,676 93,049Retirement benefit obligations 126,618 129,933 339,068 1,117,857 1,070,945 1,017,281
Current liabilities Trade and other payables 968,742 873,806 314,594Current tax liabilities 44,188 46,206 30,741Dividends 36,585 37,892 28,143Borrowings 862,714 732,883 307,469 1,912,229 1,690,787 680,947
Total equity and liabilities 9,586,527 9,427,172 8,020,862

DEM 2010 | 103The Stock Exchange of Mauritius Ltd.
FINANCIAL REVIEW OF THE GROUP INCOME STATEMENT (RS 000)
30 Jun 2009 2008 2007
Sales 1,857,217 1,750,261 1,726,113Sugar insurance compensation 15,427 114,990 98,086Grant receivables-VRS/ERS /Blueprint - 710,597 -Gain on revaluation of investment property 30,642 313,000 -Losses arising from changes in fair value of biological assets (6,935) (181,341) (21,650)Other operating income 134,791 235,275 288,650 2,031,142 2,942,782 2,091,199 Sugar insurance premium 96,685 106,723 112,951Cost of VRS/Blueprint/ERS - 710,597 -Cost of operations 1,506,711 1,363,476 1,361,251 1,603,396 2,180,796 1,474,202 Gross profit 427,746 761,986 616,997Other income - - 12,750Distribution cost (498) (1,078) (93)Administrative expenses (173,461) (159,181) (158,879) (173,959) (160,259) (146,222) Operating profit/(loss) 253,787 601,727 470,775Finance (cost)/revenue (101,658) (82,598) (55,057) 152,129 519,129 415,718Share of losses less profits of associates 3,188 (53) (2,895)Profit before taxation 155,317 519,076 412,823Taxation (21,320) (68,705) (42,200)Profit after tax 133,997 450,371 370,623Minority interest (73,666) (234,388) (187,657)Profit attributable to equity holders 60,331 215,983 182,966
STATISTICS
Number of ordinary shares used in calculation 130,662 130,662 130,662Earnings per share (Rs) 0.46 1.65 1.40Dividends per share (Rs) 0.32 0.42 0.42Net asset value per share (Rs) 26.04 26.55 25.54

104 | DEM 2010The Stock Exchange of Mauritius Ltd.
The Union Sugar Estates Company Limited
SEM Code : UNSE.I0000
Classification : Sugar
Registered Office : Union Ducray, Rivière Des Anguilles, Mauritius
Board of Directors : M J Francois MONTOCCHIO – (Chairman) Marie Jean Michel DOGER DE SPEVILLE F Jacques GIBLOT DUCRAY M. J Nicolas MERVEN Denis PILOT J. Pierre MARRIER D`UNIENVILLE Maurice BONIEUX Ian GIBLOT DUCRAY
Company Secretary : Navitas Corporate Services Ltd
Principal Activity : Sugar cane cultivation and other diversified activities
SUMMARY INFORMATION
THE UNION SUGAR ESTATES CO LTD (GROUPE UNION)
Present since 1896 in the South of the island, The Union Sugar Estates Co Ltd (USE) is involved in the sugar cane cultivation over 1358 hectares of land and has diversified into several clusters ranging from agro-industry, tourism, IT services and trading.
USE is a public company listed on the Development Enterprise Market.
Agro-industry
Over the centuries, Union Sugar Estates Co Ltd has developed other cultivations from flowers to vegetables and cultivation of flowers for export has been a successful venture. In collaboration with other sugar estates in the South, a new company Copesud Ltee has been set up to develop the cultivation of potatoes on a large scale and bulk warehousing for supply on the local market to further expand agricultural diversification in line with government objectives to encourage food production.
Tourism
The USE group has a 82.86% stake in Southern Cross Tourist Co Ltd (SCT) which is listed on the Development and Enterprise Market. The company owns and manages Le Preskil Beach Resort, a 200-rooms hotel of 3-plus standard situated on a prime site at Pointe Jerome, Mahebourg.
Despite the effect of the economic recession, the hotel has achieved good operational results and occupancy rate in 2009. SCT is continuously investing in the enhancement of its product and as such looks up to even better results for the coming years.
The southern region is well known for its preserved natural beauty and in line with developing a green-tourism concept, USE has created Les Lodges d’Union Ltee, which owns and manages Les Lodges d’Andrea and L’Exil which are beautifully set up in the lush vegetation of the South.

DEM 2010 | 105The Stock Exchange of Mauritius Ltd.
Services
The Group is present in various sectors ranging from IT, signage, pre-press graphics, advertising support and trading activities.
Through Uniconsults Ltd, the Group has established its presence in the IT sector and software solutions such as Sicorax Payroll, Sicorax Accounting and Sicorax Enterprise Relationship Management have become well known to the Mauritian business sector for their reliability and proven efficiency. The company also offers payroll outsourcing services to prestigious clients, a business activity line which is deemed to grow further.
Multigraphics Ltd, a subsidiary which was traditionally concentrated on graphics design and advertising support is developing towards offering web designing services which is expected to boost up the company’s profitability.
Trading Lane Ltd, the trading arm of the Group for its various subsidiaries and associates, offers procurement services to both companies of the group and external customers operating in various sectors of the economy. It has also expanded in IT hardware products.
Giblot Ducray & Cie Limitee, a fully owned subsidiary is the management company of the group. It offers company secretariat, finance and accounting, project management and human resources services to companies in the Group.
Investments
The Groupe Union owns 1 500 hectares of lands and 2 000 m2 of office space at the Caudan Waterfront as well as industrial buildings in Souillac.

106 | DEM 2010The Stock Exchange of Mauritius Ltd.
INCOME STATEMENT (RS 000)
FINANCIAL REVIEW OF THE GROUP BALANCE SHEET (RS 000)
31 Dec 2009 2008 2007
ASSETS
Non-current assets 1,745,001 1,762,721 1,830,356 Current assets 208,106 234,394 294,866
Total assets 1,953,107 1,997,115 2,125,222
EQUITY AND LIABILITIES
Capital and reservesEquity holders’ interests 1,035,401 987,781 1,019,515 Minority Interest 45,486 60,977 55,182
Non-current liabilities 435,407 512,495 554,355
Current liabilities 436,813 435,862 496,170
Total equity and liabilities 1,953,107 1,997,115 2,125,222
31 Dec 2009 2008 2007
Turnover 601,233 602,241 577,935 Operating profit 55,109 77,334 80,212 Other income 6,972 6,511 9,665 62,081 83,845 89,877 Finance costs (55,963) (87,248) (96,794)Share of result of associates 272 11,408 6,128 Profit / (Loss) before exceptional items 6,390 8,005 (789)Exceptional items 6,926 8,342 267,132 Profit before taxation 13,316 16,347 266,343 Income tax 3,164 (13,141) (2,472)Profit after taxation 16,480 3,206 263,871 Release form modernisation reserve 1,561 1,879 1,244 Profit for the year 18,041 5,085 265,115 Attributable to: Owners of the parent 42,598 (3,210) 253,994 Minority interest (24,557) 8,295 11,121
STATISTICS
Number of ordinary shares used in calculation (000) 18,900 18,900 18,900 Earnings/(loss) per share (Rs) 2.25 (0.17) 13.44 Dividends per share (Rs) - - 0.53 Net asset value per share (Rs) 54.78 52.26 53.94
DEM 2010 | 107The Stock Exchange of Mauritius Ltd.
United Bus Service Ltd
SEM Code : UBS.I0000
Classification : Transport
Registered Office : Royal Road, Les Cassis, Port Louis
Board of Directors : M.Yacoob RAMTOOLA FCA – Chairman Abdool Aleem BUNDHOO – Vice Chairman Swaleh RAMJANE FCIS MCIT Locknat Daby SEESARAM CBE M Shadman Elias HAJI ADAM FCCA Ally Afzal MOHUNGUR Yousouf SAIRALLY Fazil MADERBOCCUS Mukhtar ISMAIL
Managing Director : Swaleh RAMJANE FCIS MCIT
Company Secretary : Locknat Daby Seesaram CBE
Principal Activities : Public Transport
SUMMARY INFORMATION
United Bus Service Limited, established in 1954, is the largest private bus fleet operator in Mauritius. It has a fleet of 320 buses and operates on 52 routes. It has a labour force of 1,600 employees. It carries an average of 32 million passengers annually.

108 | DEM 2010The Stock Exchange of Mauritius Ltd.
INCOME STATEMENT (RS)
FINANCIAL REVIEW OF THE GROUP BALANCE SHEET (RS)
30 Jun 2009 2008 2007
ASSETS
Non-current assetsProperty, plant and equipment 205,418,723 167,534,354 169,294,374 Investments 92,932,787 60,677,438 28,275,388 298,351,510 228,211,792 197,569,762 Current assetsStocks 7,023,643 6,648,378 6,633,892 Trade and other receivables 48,614,085 68,011,338 36,006,513 Cash in hand and at bank 40,277,457 44,741,743 48,351,502 95,915,185 119,401,459 90,991,907
Total assets 394,266,695 347,613,251 288,561,669
EQUITY AND LIABILITIES
Capital and reservesStated Capital 49,737,832 49,737,832 49,737,832 Reserves 40,279,260 40,339,122 15,058,898
Total equity 90,017,092 90,076,954 64,796,730
LIABILITIES
Non-current liabilities Loans 7,828,334 22,369,584 28,484,584 Obligations under finance lease 92,307,614 59,970,456 44,087,540 Retirement benefit obligations 105,087,118 86,972,919 83,786,106 205,223,066 169,312,959 156,358,230
Current liabilities Bank overdrafts (unsecured) 1,159,757 7,767 - Taxation 2,897,129 - - Loans 8,226,666 16,055,000 13,138,167 Obligations under finance lease 20,282,944 10,149,202 6,286,159 Trade and other payables 66,460,041 62,011,369 47,982,383 99,026,537 88,223,338 67,406,709
Total liabilities 304,249,603 257,536,297 223,764,939
Total equity and liabilities 394,266,695 347,613,251 288,561,669
30 Jun 2009 2008 2007
Operating Revenue 517,889,428 436,976,400 411,970,506 Operating Expenses 469,672,246 382,732,539 363,799,616 Operating Surplus 48,217,182 54,243,861 48,170,890 Administrative expenses 42,214,468 39,249,592 35,025,577 Profit from operations 6,002,714 14,994,269 13,145,313 Other income 19,559,889 8,818,734 6,108,088 25,562,603 23,813,003 19,253,401 Finance costs (12,109,152) (13,634,829) (11,228,919)Profit before taxation 13,453,451 10,178,174 8,024,482 Taxation (2,897,129) - - Profit for the year 10,556,322 10,178,174 8,024,482
STATISTICS
Number of ordinary shares used in calculation 4,969,489 4,969,489 4,969,489 Earnings per share (Rs) 2.12 2.05 1.61 Dividends per share (Rs) - - - Net asset value per share (Rs) 18.11 18.13 13.04

DEM 2010 | 109The Stock Exchange of Mauritius Ltd.
United Investments Limited
SEM Code : UTIN.I0000
Classification : Investment
Registered Office : Bowen Square, Dr Ferrière Street, Port Louis
Board of Directors : Patrick GIBLOT DUCRAY – Chairman Brett Ivor CHILDS Allain DOGER DE SPEVILLE Lilladhur GUNNESS Richard KOENIG Didier MERVEN Swadicq NUTHAY
Manager : AXYS Capital Management Ltd Bowen Square, 10, Dr Ferrière Street Port Louis
Company Secretary : FWM Secretarial Services Limited, Bowen Square, Dr Ferrière Street, Port Louis
Principal Activities : Investment holding.
SUMMARY INFORMATION
The company was incorporated on 18 June 1984. UIL was until 31st December 2006 managed by United Docks Limited and as from 1st January 2007, the fund management company, AXYS Capital Management Ltd was awarded the management contract.
The Company owns 8.29% of AfrAsia Bank Ltd.

110 | DEM 2010The Stock Exchange of Mauritius Ltd.
INCOME STATEMENT (RS)
FINANCIAL REVIEW OF THE GROUP BALANCE SHEET (RS)
30 June 2009 2008 2007
ASSETS
Non-current assetsInvestments in financial assets 77,244,697 92,839,298 43,479,298 Loans 4,131,000 - - 81,375,697 92,839,298 43,479,298
Current assetsOther financial assets at fair value through profit or loss 4,600,000 3,836,000 - Trade and other receivables 1,401,395 45,535,835 43,374,217 Loans 4,131,000 10,182,000 7,206,000 Cash and cash equivalents 36,036,159 2,088,463 48,525 46,168,554 61,642,298 50,628,742
Total assets 127,544,251 154,481,596 94,108,040
EQUITY AND LIABILITIES
Capital and reservesShare capital 20,683,934 19,920,045 480,000 Share premium 68,720,396 63,984,279 - Deposit on share capital - 5,500,006 - Other reserves - 30,714,640 39,834,640 Retained earnings 24,492,216 24,838,573 30,805,546
Total equity 113,896,546 144,957,543 71,120,186
LIABILITIES
Non-current liabilitiesBorrowings - 6,722,206 7,682,137
Current liabilitiesTrade and other payables 12,927,705 1,121,916 7,440,893 Borrowings - 959,931 7,144,824 Dividends 720,000 720,000 720,000 13,647,705 2,801,847 15,305,717
Total liabilities 13,647,705 9,524,053 22,987,854
Total equity and liabilities 127,544,251 154,481,596 94,108,040
30 June 2009 2008 2007
Profit/(loss) on disposal of financial assets at fair value through profit or loss 477,500 (547,200) - Dividend income 160,000 - - Share of loss in Société - (4,840,374) (175,456)Other income 1,127,225 2,054,360 - Administrative expenses (1,486,135) (815,675) (869,083)Operating profit/(loss) 278,590 (4,148,889) (1,044,539)Interest expense (624,947) (1,818,084) (1,422,642)Loss for the year (346,357) (5,966,973) (2,467,181)
STATISTICS
Loss per share- basic (0.02) (0.36) (5.14)- diluted (0.02) (0.34) (5.14)Weighted average number of ordinary shares in issue used in calculation of basic loss per share 20,635,930 16,610,734 480,000
Weighted average number of ordinary shares in issue used in calculation of diluted loss per share 20,635,930 17,374,623 480,000
Dividends per share (Rs) - - -

DEM 2010 | 111The Stock Exchange of Mauritius Ltd.
Vital Water Bottling Co Ltd
SEM Code : VTAL.I0000
Classification : Industry
Registered Office : 6, Sir William Newton Street, Port Louis
Board of Directors : Mr. Currimjee J CURRIMJEE Mr. Fakhruddin J CURRIMJEE Mr. Mustanshir A CURRIMJEE Mr. Bashirally A CURRIMJEE Mr. Azim F CURRIMJEE Mr. Raffi CURRIMJEE Mr. Anil C CURRIMJEE Mr. Ashraf M CURRIMJEE Mr. Mazahir F E ADAMJEE Mr. Hassam VAYID Mr. Saliah M SAIT
Company Secretary : Currimjee Limited
Principal Activities : Manufacturing and bottling of water
SUMMARY INFORMATION
Vital Water Bottling Co. Ltd (‘VITAL’) was set up in 1992. Since its launch, Vital Water has dominated the domestic market. VITAL has actively sought excellence in quality and is the only company in Mauritius to have won the Mauritius National Quality Award (NQA) twice. It was the first company in Mauritius to be certified to the HACCP Food Safety Standard and is the first bottler in Mauritius to be certified ISO 22000, a distinction it received from the MSB in November 2008.
Always innovative, VITAL has the largest range of packages in Mauritius, with bottles ranging from 0.5 Litre to 5 Litres. And through its ‘Vital Fontaines’ service, offices and houses receive aesthetically designed Water Coolers with the latest technology and Vital Water delivered to their premises.
‘Vital Fontaines’ has recently been appointed distributor for Lavazza coffee in Mauritius. Lavazza is recognized throughout the world as the symbol of Italian Expresso.

112 | DEM 2010The Stock Exchange of Mauritius Ltd.
STATEMENT OF COMPREHENSIVE INCOME (RS)
FINANCIAL REVIEW OF THE GROUP STATEMENT OF FINANCIAL POSITION (RS)
31 Dec 2009 2008 2007
ASSETS
Non-current assetsProperty, plant and equipment 83,624,693 80,397,196 59,063,778 Investments in associate 1,295,833 - - 84,920,526 80,397,196 59,063,778
Current assetsInventories 14,987,659 15,177,293 13,070,178 Trade and other receivables 48,690,307 39,973,919 23,238,787 Cash in hand and at bank 2,245,982 2,193,664 519,071 65,923,948 57,344,876 36,828,036
Total assets 150,844,474 137,742,072 95,891,814
EQUITY AND LIABILITIES
Capital and reservesStated capital 21,961,080 21,961,080 21,961,080 Revaluation Reserve 2,877,748 - -Retained earnings 9,249,886 9,533,549 6,400,551
Total equity 34,088,714 31,494,629 28,361,631
Non-current liabilitiesLoans - 437,063 2,884,648 Retirement benefit obligations 7,077,485 3,451,100 3,052,980 Deferred tax 5,360,277 3,715,608 2,609,241 Obligation under finance leases 16,972,631 13,947,659 3,093,874 29,410,393 21,551,430 11,640,743
Current liabilitiesLoans 11,830,432 17,299,959 3,732,849 Obligation under finance leases 5,070,452 3,589,385 1,206,014 Taxation 939,655 853,822 2,793,897 Trade and other payables 43,792,671 49,000,615 31,660,706 Bank overdrafts (secured) 25,712,158 13,952,232 16,495,974 87,345,369 84,696,013 55,889,440
Total liabilities 116,755,762 106,247,443 67,530,183
Total equity and liabilities 150,844,475 137,742,072 95,891,814
31 Dec 2009 2008 2007
Revenue 155,094,908 148,975,428 150,785,106 Cost of sales (97,270,648) (91,640,114) (93,758,029)Gross Profit 57,824,260 57,335,314 57,027,077 Administrative expenses (20,583,815) (20,852,571) (18,111,122)Selling expenses (6,551,926) (8,340,778) (7,080,521)Distribution expenses (17,555,945) (15,403,008) (13,342,592)Other income 2,655,553 3,836,373 2,937,053 Finance costs (5,103,602) (3,142,468) (4,280,096) 10,684,525 13,432,862 17,149,799 Share of (loss)/profit of associate (153,962) - -Profit before taxation 10,530,563 13,432,862 16,836,819 Taxation (2,797,949) (1,515,432) (2,839,802)Profit for the year 7,732,614 11,917,430 13,997,017
STATISTICS
Number of ordinary shares used in calculation 2,196,108 2,196,108 2,196,108 Earnings per share (Rs) 3.52 5.43 6.37Dividends per share (Rs) 3.00 4.00 3.00Net asset value per share (Rs) 15.52 14.34 12.91