10/17/2007gzhang gcsnc c:\presentation\2008\gea_101720071 tough accountability situation great gcs...
TRANSCRIPT
10/17/2007 GZHANG GCSNC C:\Presentation\2008\GEA_10172007 1
Tough Accountability Situation Great GCS Achievement
2006-07
Presentation for
Guilford Education Alliance
Gongshu Zhang, Ed.D. Chief Officer, Accountability and Research, GCSNC
October 17, 2007, Greensboro
10/17/2007 GZHANG GCSNC C:\Presentation\2008\GEA_10172007 2
Part IBrief Introduction of North Carolina
Accountability System
10/17/2007 GZHANG GCSNC C:\Presentation\2008\GEA_10172007 3
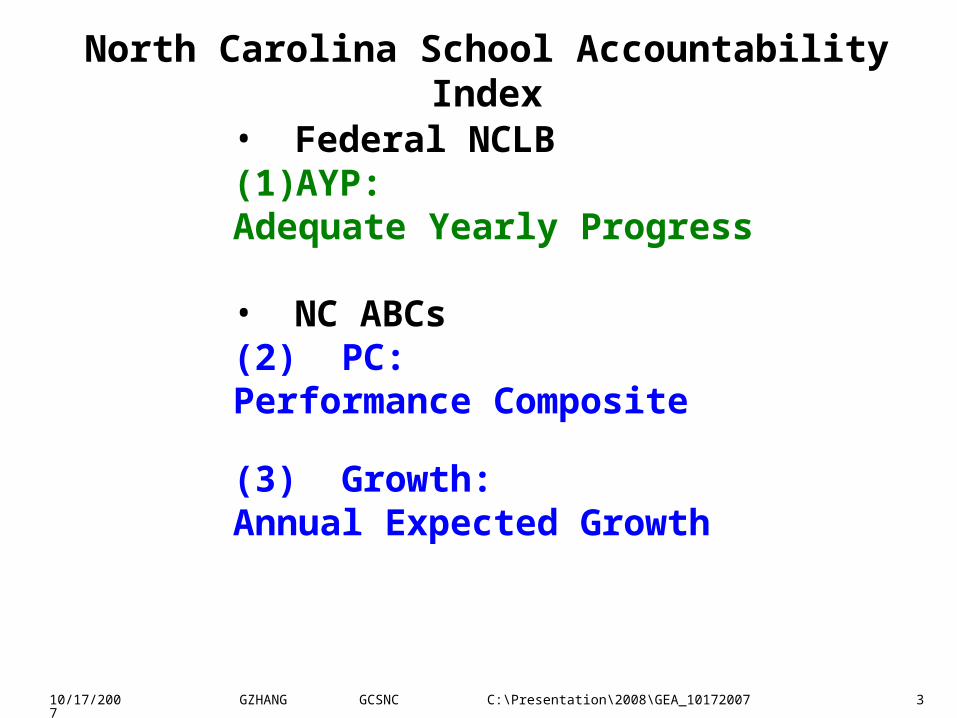
North Carolina School Accountability Index
• Federal NCLB
(1) AYP: Adequate Yearly Progress
• NC ABCs
(2) PC: Performance Composite
(3) Growth: Annual Expected Growth
10/17/2007 GZHANG GCSNC C:\Presentation\2008\GEA_10172007 4
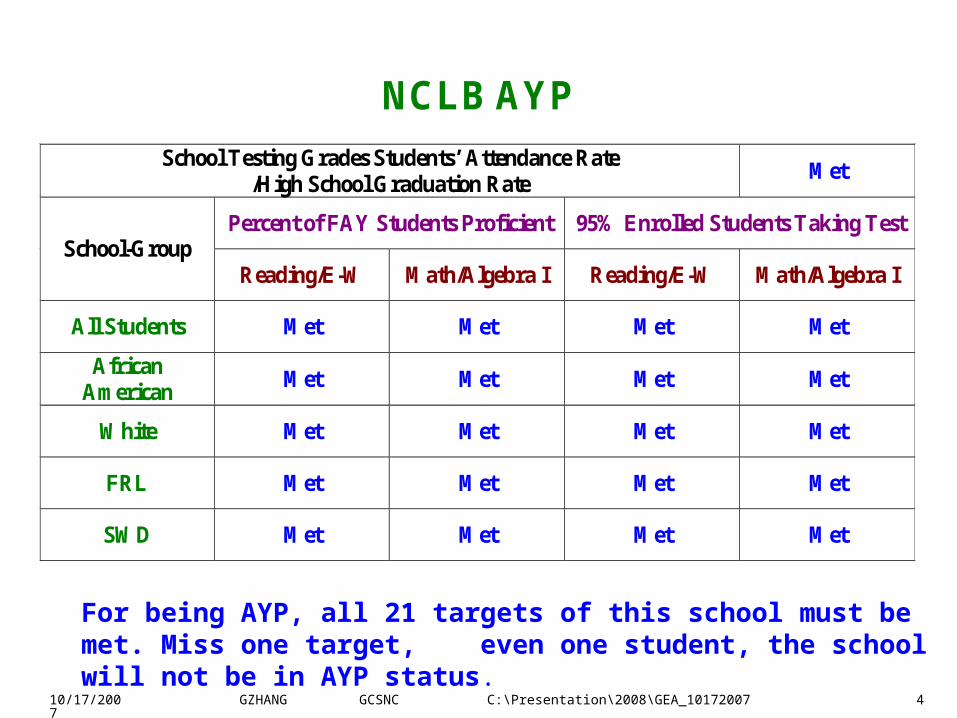
NCLB AYP
School Testing Grades Students’ Attendance Rate /High School Graduation Rate
Met
Percent of FAY Students Proficient 95% Enrolled Students Taking Test School-Group
Reading/E-W Math/Algebra I Reading/E-W Math/Algebra I
All Students Met Met Met Met
African American
Met Met Met Met
White Met Met Met Met
FRL Met Met Met Met
SWD Met Met Met Met
For being AYP, all 21 targets of this school must be met. Miss one target, even one student, the school will not be in AYP status.
10/17/2007 GZHANG GCSNC C:\Presentation\2008\GEA_10172007 5
ABCs PC
Number of all proficient students for all EOG/EOC tests
Number of all tested students for all EOG/EOC tests
10/17/2007 GZHANG GCSNC C:\Presentation\2008\GEA_10172007 6
ABCs Growth
Sum of all students’ growth C scores in EOG/EOC tests
Number of all tested students for all EOG/EOC tests
10/17/2007 GZHANG GCSNC C:\Presentation\2008\GEA_10172007 7
Part IIWe Have Been Experiencing
Tough Accountability SituationSince 2005-06
10/17/2007 GZHANG GCSNC C:\Presentation\2008\GEA_10172007 8
(1)Two Major Changes
and Their Consequences2005-06
10/17/2007 GZHANG GCSNC C:\Presentation\2008\GEA_10172007 9
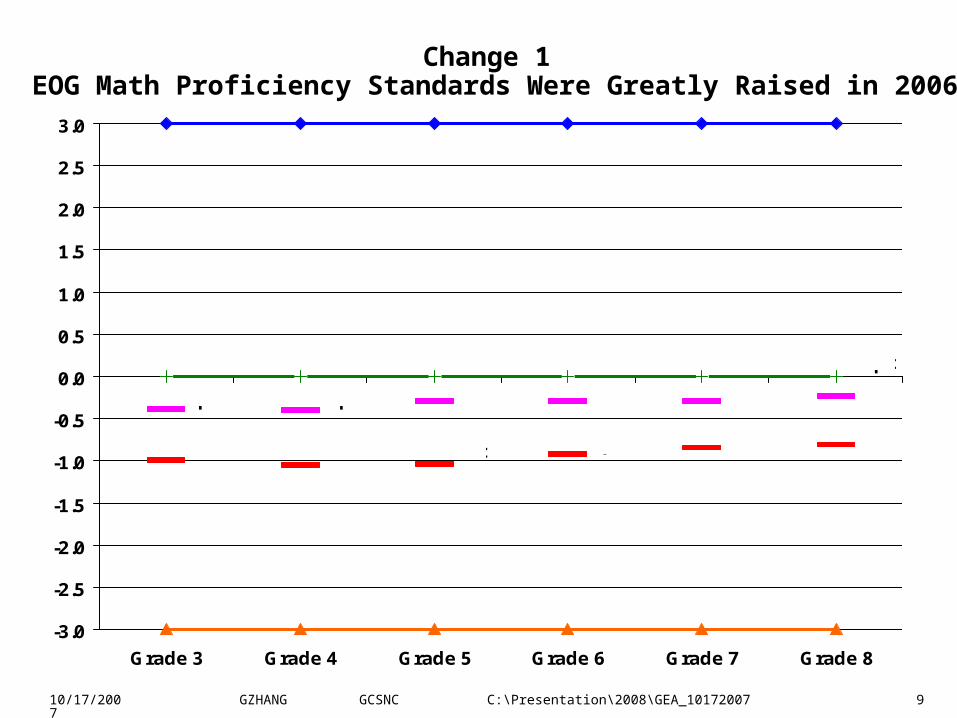
Change 1 EOG Math Proficiency Standards Were Greatly Raised in 2006
-3.0
-2.5
-2.0
-1.5
-1.0
-0.5
0.0
0.5
1.0
1.5
2.0
2.5
3.0
Grade 3 Grade 4 Grade 5 Grade 6 Grade 7 Grade 8
246/28pt 247/15pt 250/15pt261/22pt258/20pt254/18pt
339/33pt
357/41pt355/39pt352/39pt351/38pt
345/36pt
10/17/2007 GZHANG GCSNC C:\Presentation\2008\GEA_10172007 10
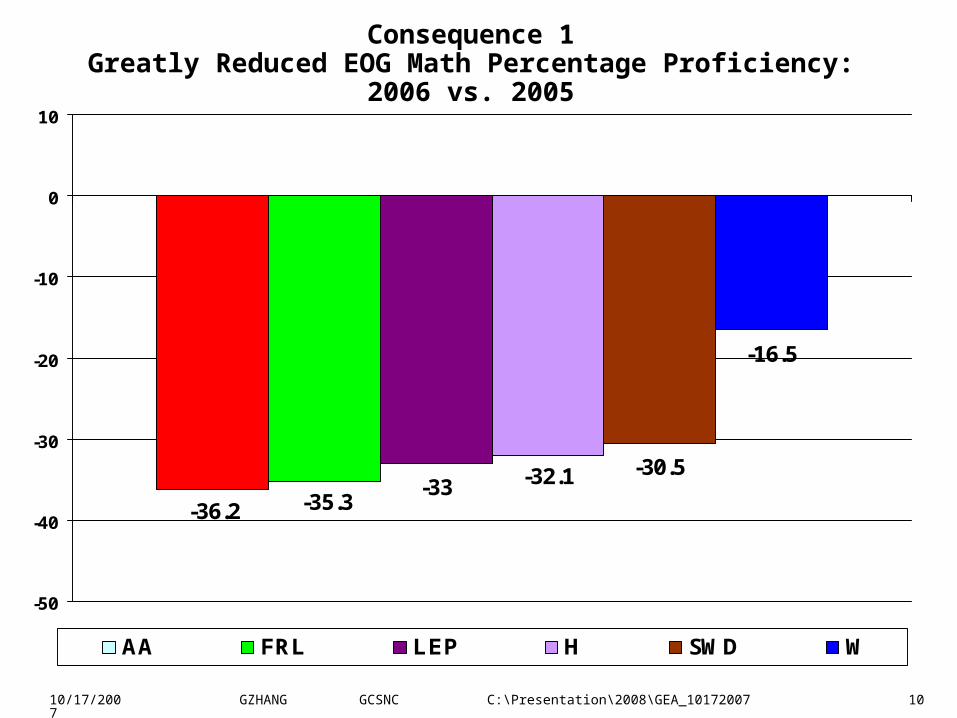
Consequence 1Greatly Reduced EOG Math Percentage Proficiency: 2006 vs. 2005
-33-30.5
-16.5
-36.2 -35.3-32.1
-50
-40
-30
-20
-10
0
10
AA FRL LEP H SWD W
10/17/2007 GZHANG GCSNC C:\Presentation\2008\GEA_10172007 11
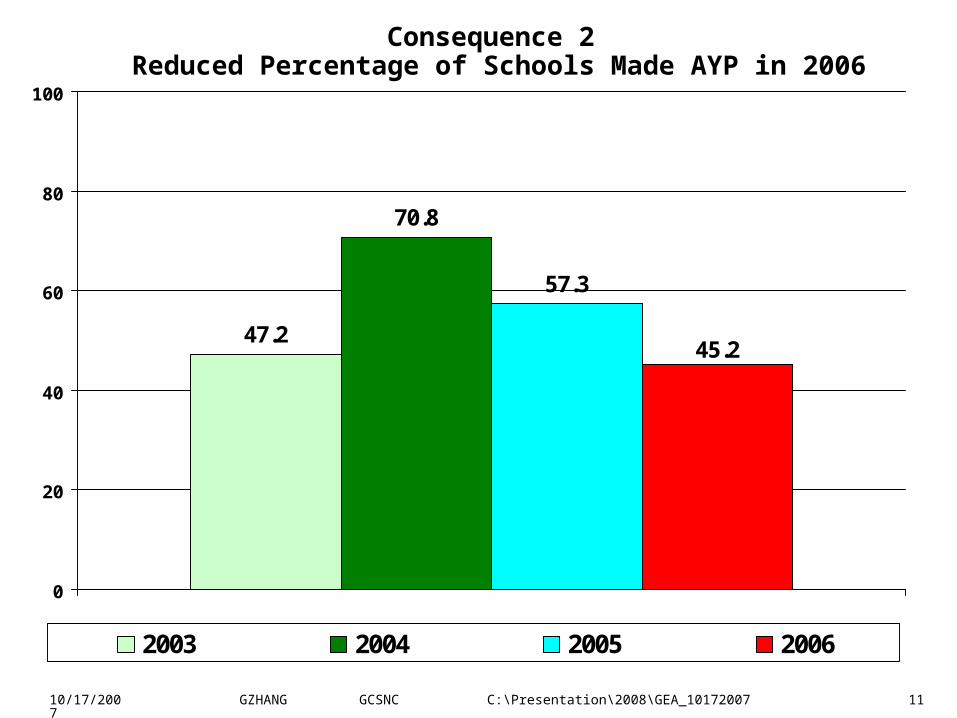
Consequence 2 Reduced Percentage of Schools Made AYP in 2006
47.2
70.8
57.3
45.2
0
20
40
60
80
100
2003 2004 2005 2006
10/17/2007 GZHANG GCSNC C:\Presentation\2008\GEA_10172007 12
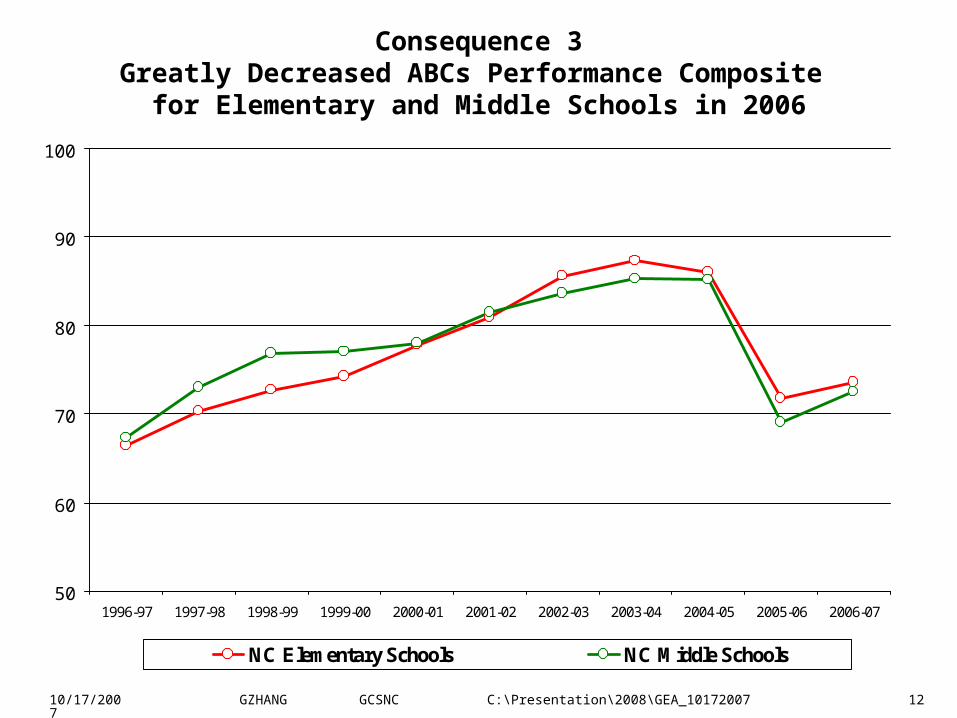
Consequence 3Greatly Decreased ABCs Performance Composite
for Elementary and Middle Schools in 2006
50
60
70
80
90
100
1996-97 1997-98 1998-99 1999-00 2000-01 2001-02 2002-03 2003-04 2004-05 2005-06 2006-07
NC Elementary Schools NC Middle Schools
10/17/2007 GZHANG GCSNC C:\Presentation\2008\GEA_10172007 13
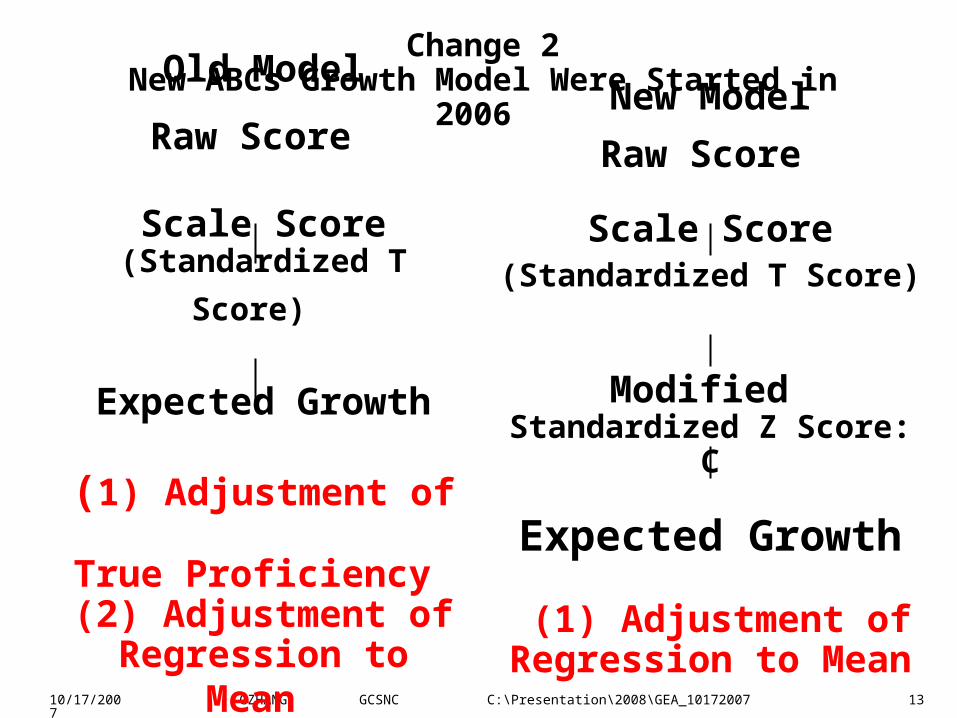
Old Model
Raw Score
Scale Score(Standardized T Score)
Expected Growth
(1) Adjustment of True Proficiency (2) Adjustment of
Regression to Mean
New Model
Raw Score
Scale Score(Standardized T Score)
Modified Standardized Z Score: C
Expected Growth
(1) Adjustment of Regression to Mean
Change 2New ABCs Growth Model Were Started in 2006
10/17/2007 GZHANG GCSNC C:\Presentation\2008\GEA_10172007 14
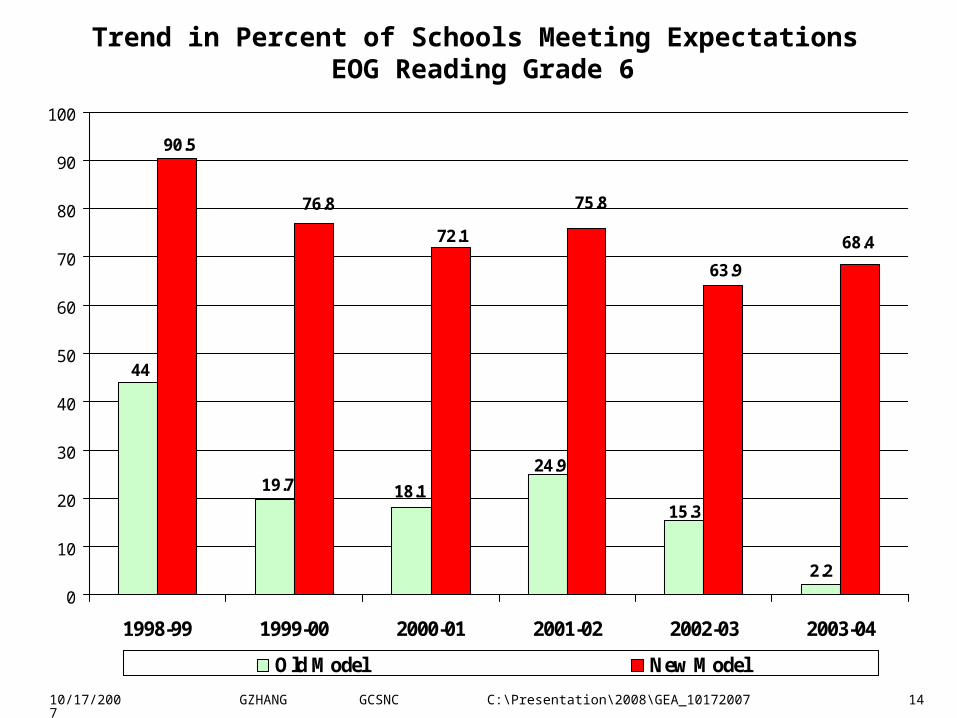
Trend in Percent of Schools Meeting Expectations EOG Reading Grade 6
2.2
15.3
24.919.7 18.1
44
76.8 75.8
63.9
68.472.1
90.5
0
10
20
30
40
50
60
70
80
90
100
1998-99 1999-00 2000-01 2001-02 2002-03 2003-04
Old Model New Model

10/17/2007 GZHANG GCSNC C:\Presentation\2008\GEA_10172007 15
Trend in Percent of Schools Meeting Expectations EOG Reading Grade 5
73
87
97.3
80.285.4
58
45
56.855
46.5
59.1
19.2
0
10
20
30
40
50
60
70
80
90
100
1998-99 1999-00 2000-01 2001-02 2002-03 2003-04
Old Model New Model
10/17/2007 GZHANG GCSNC C:\Presentation\2008\GEA_10172007 16
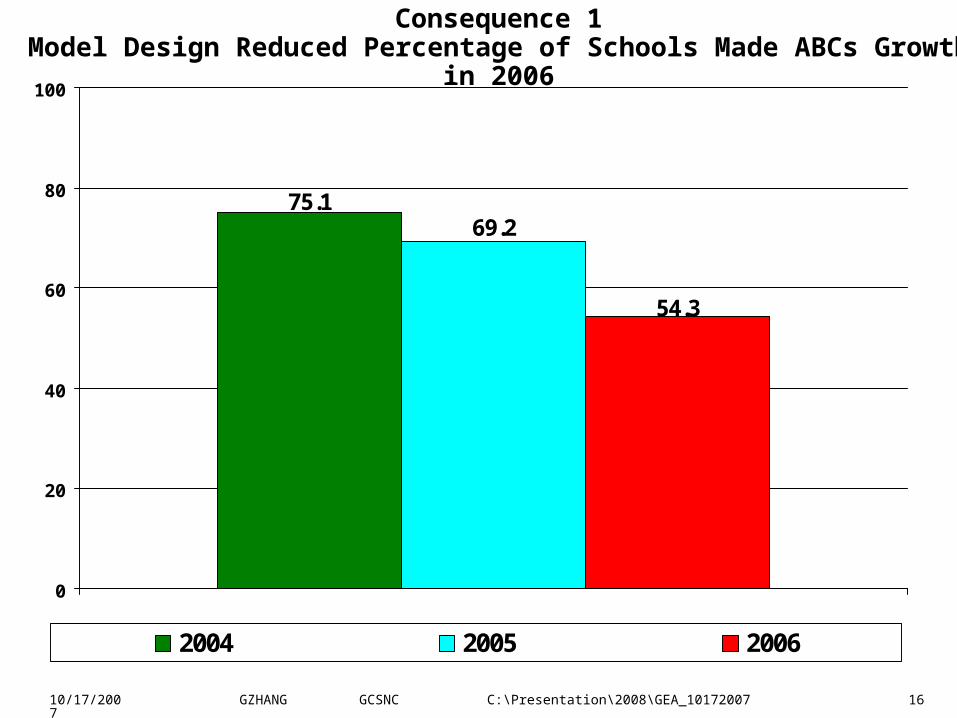
Consequence 1Model Design Reduced Percentage of Schools Made ABCs Growth in 2006
75.169.2
54.3
0
20
40
60
80
100
2004 2005 2006
10/17/2007 GZHANG GCSNC C:\Presentation\2008\GEA_10172007 17
(2)Additional Two Major Changes
and Their Consequences2006-07
10/17/2007 GZHANG GCSNC C:\Presentation\2008\GEA_10172007 18
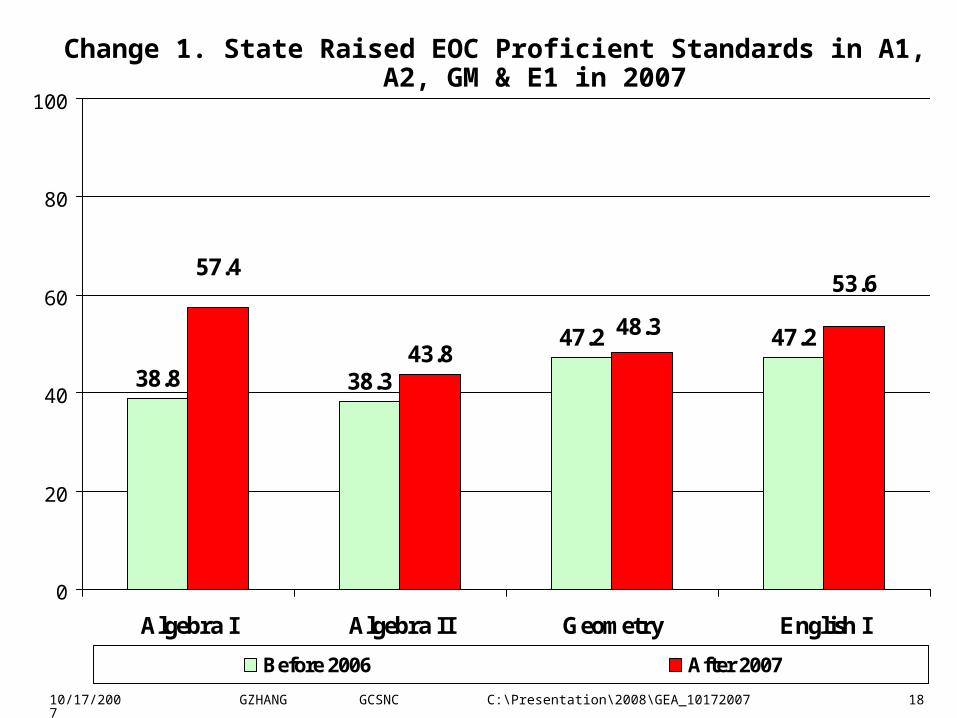
Change 1. State Raised EOC Proficient Standards in A1, A2, GM & E1 in 2007
38.8 38.3
47.2 47.243.8
57.453.6
48.3
0
20
40
60
80
100
Algebra I Algebra II Geometry English I
Before 2006 After 2007
10/17/2007 GZHANG GCSNC C:\Presentation\2008\GEA_10172007 19
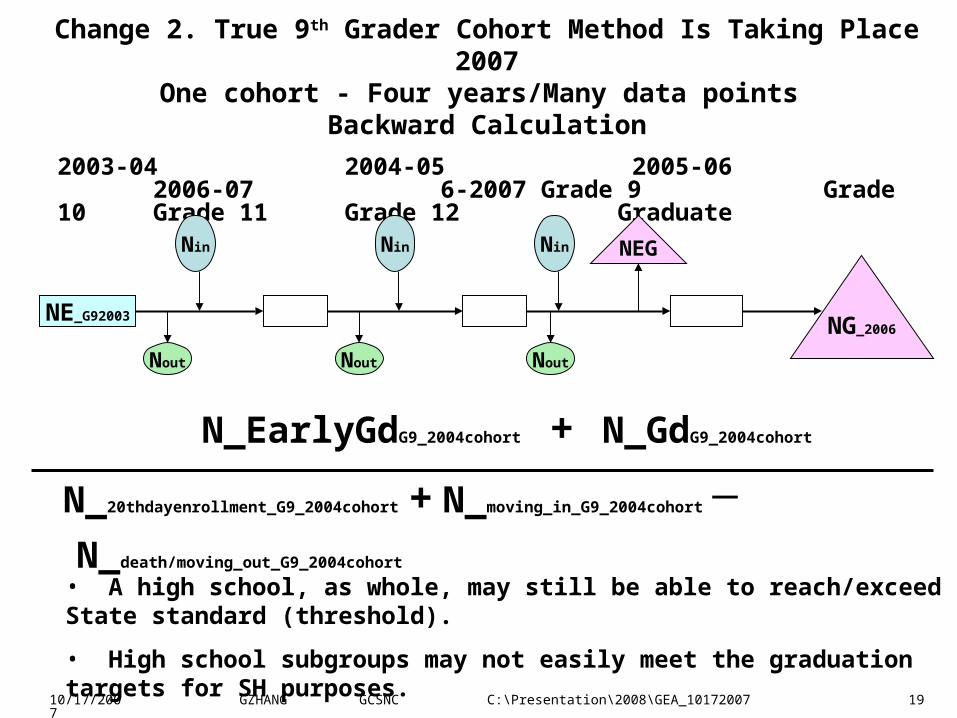
N_EarlyGdG9_2004cohort + N_GdG9_2004cohort
N_20thdayenrollment_G9_2004cohort + N_moving_in_G9_2004cohort ─ N_death/moving_out_G9_2004cohort
2003-04 2004-05 2005-06 2006-07 6-2007 Grade 9 Grade 10 Grade 11 Grade 12 Graduate
NE_G92003
Nin
Nout
Nin
Nout
Nin
Nout
NEG
NG_2006
Change 2. True 9th Grader Cohort Method Is Taking Place 2007One cohort - Four years/Many data points
Backward Calculation
• A high school, as whole, may still be able to reach/exceed State standard (threshold).
• High school subgroups may not easily meet the graduation targets for SH purposes.
10/17/2007 GZHANG GCSNC C:\Presentation\2008\GEA_10172007 20
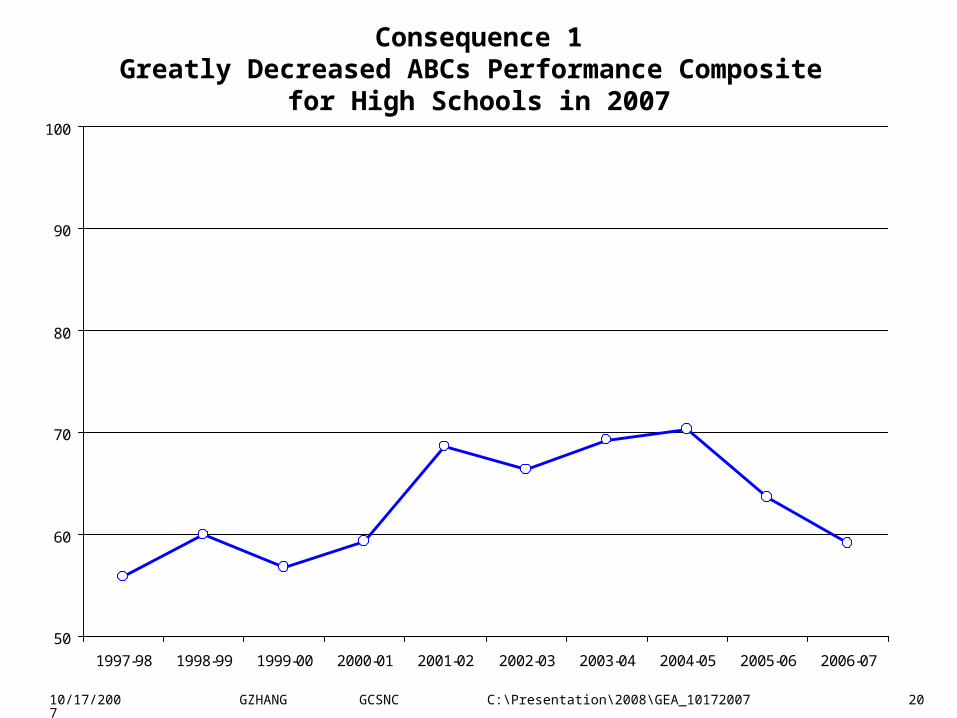
Consequence 1Greatly Decreased ABCs Performance Composite
for High Schools in 2007
50
60
70
80
90
100
1997-98 1998-99 1999-00 2000-01 2001-02 2002-03 2003-04 2004-05 2005-06 2006-07
10/17/2007 GZHANG GCSNC C:\Presentation\2008\GEA_10172007 21
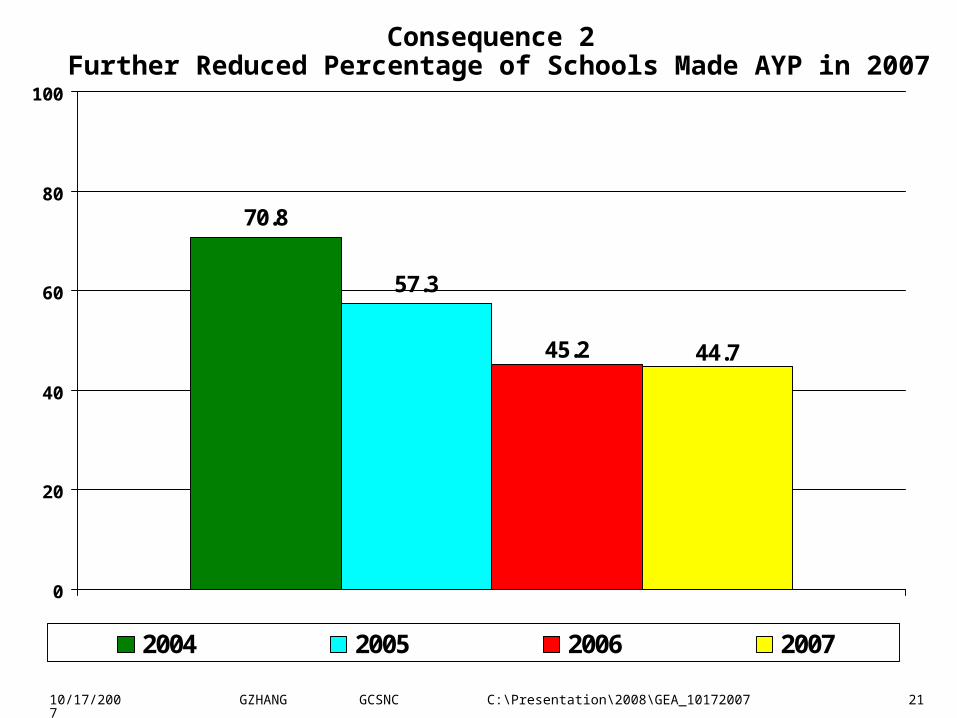
Consequence 2 Further Reduced Percentage of Schools Made AYP in 2007
70.8
57.3
45.2 44.7
0
20
40
60
80
100
2004 2005 2006 2007
10/17/2007 GZHANG GCSNC C:\Presentation\2008\GEA_10172007 22
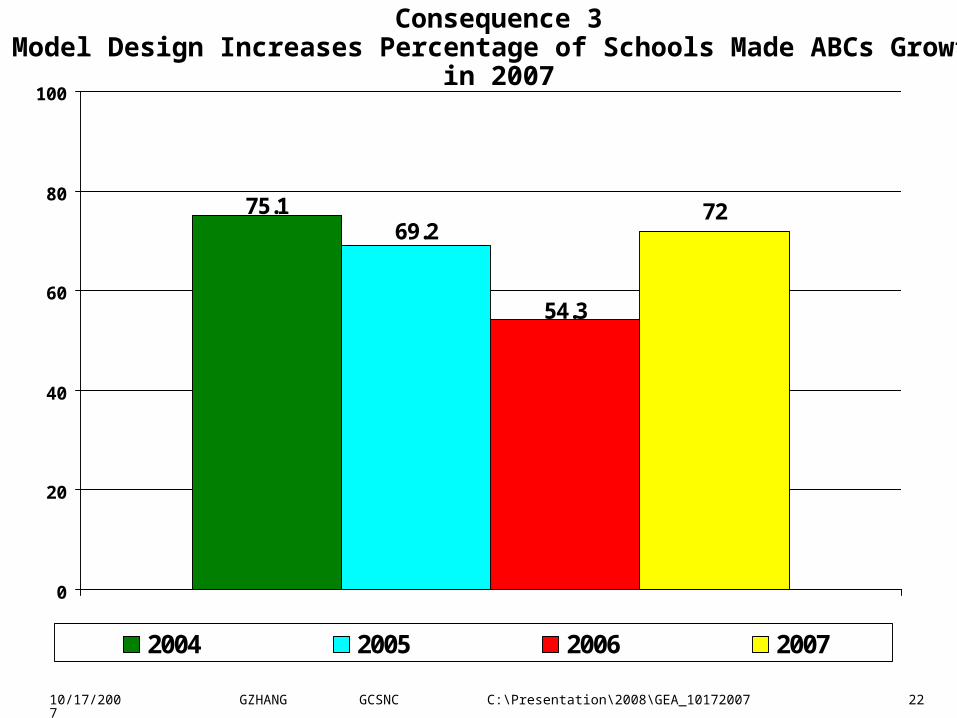
Consequence 3Model Design Increases Percentage of Schools Made ABCs Growth in 2007
7275.169.2
54.3
0
20
40
60
80
100
2004 2005 2006 2007
10/17/2007 GZHANG GCSNC C:\Presentation\2008\GEA_10172007 23
(2)Further Major Changes and Their Consequences
2007-08
10/17/2007 GZHANG GCSNC C:\Presentation\2008\GEA_10172007 24
Change 1. State will raise EOG Reading proficiency standards in 2007-08
10/17/2007 GZHANG GCSNC C:\Presentation\2008\GEA_10172007 25
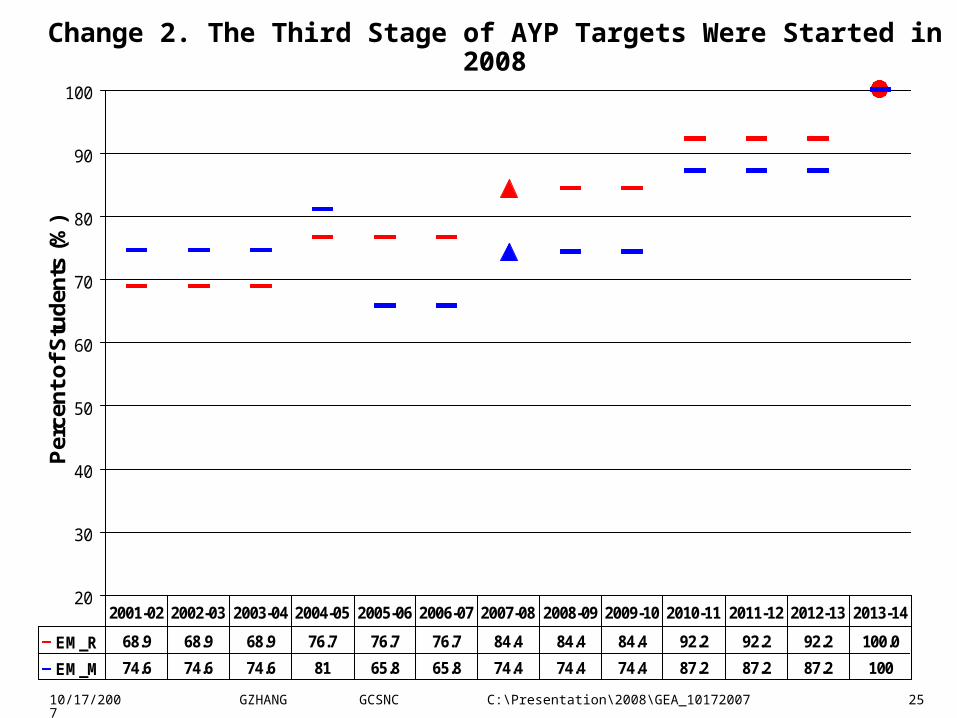
Change 2. The Third Stage of AYP Targets Were Started in 2008
20
30
40
50
60
70
80
90
100
Per
cen
t o
f S
tud
ents
(%
)
EM_R 68.9 68.9 68.9 76.7 76.7 76.7 84.4 84.4 84.4 92.2 92.2 92.2 100.0
EM_M 74.6 74.6 74.6 81 65.8 65.8 74.4 74.4 74.4 87.2 87.2 87.2 100
2001-02 2002-03 2003-04 2004-05 2005-06 2006-07 2007-08 2008-09 2009-10 2010-11 2011-12 2012-13 2013-14
10/17/2007 GZHANG GCSNC C:\Presentation\2008\GEA_10172007 26
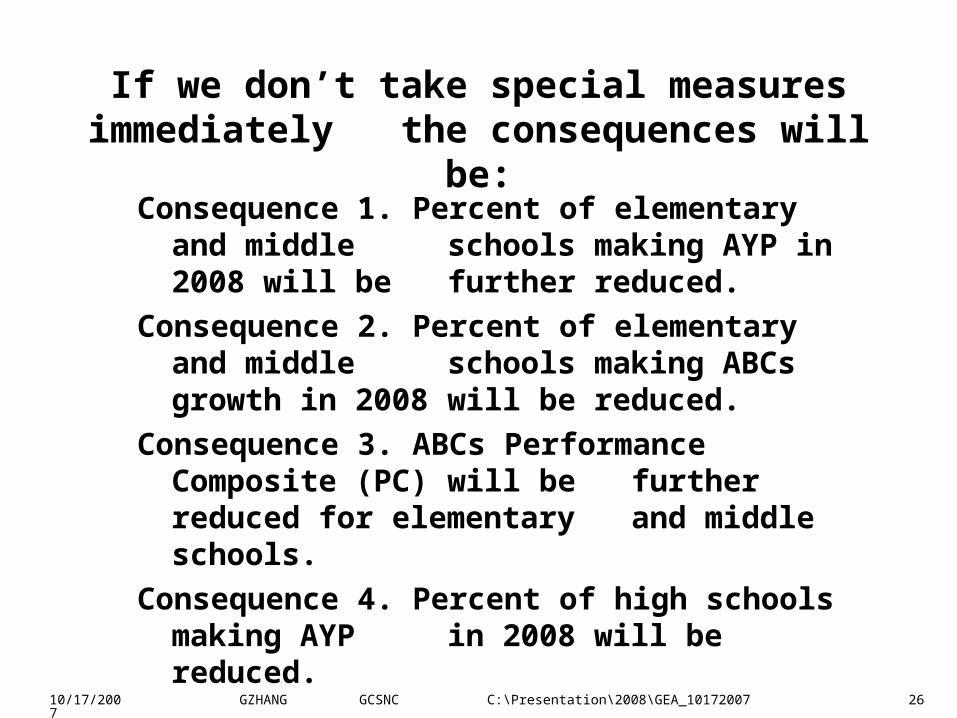
Consequence 1. Percent of elementary and middle schools making AYP in 2008 will be further reduced.
Consequence 2. Percent of elementary and middle schools making ABCs growth in 2008 will be reduced.
Consequence 3. ABCs Performance Composite (PC) will be further reduced for
elementary and middle schools.
Consequence 4. Percent of high schools making AYP in 2008 will be reduced.
If we don’t take special measures immediately the consequences will be:
10/17/2007 GZHANG GCSNC C:\Presentation\2008\GEA_10172007 27
Part IIIWork Harder and Smarter
GCS Made Great Achievement in 2006-07
10/17/2007 GZHANG GCSNC C:\Presentation\2008\GEA_10172007 28
(1)On NCLB AYP
10/17/2007 GZHANG GCSNC C:\Presentation\2008\GEA_10172007 29
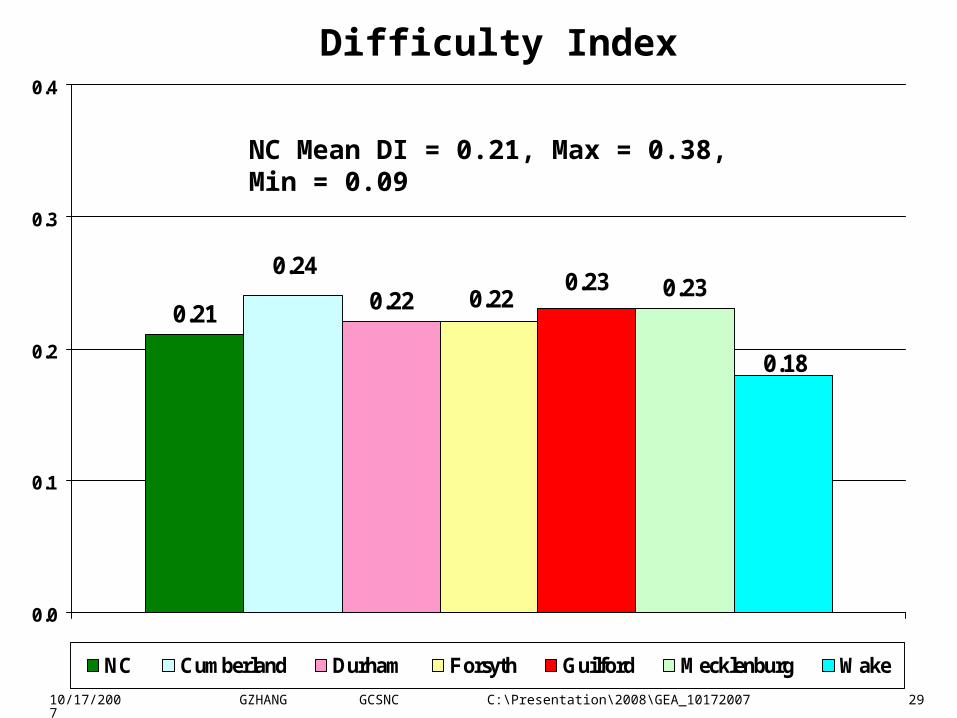
Difficulty Index
0.21 0.22 0.230.24
0.220.23
0.18
0.0
0.1
0.2
0.3
0.4
NC Cumberland Durham Forsyth Guilford Mecklenburg Wake
NC Mean DI = 0.21, Max = 0.38, Min = 0.09
10/17/2007 GZHANG GCSNC C:\Presentation\2008\GEA_10172007 30
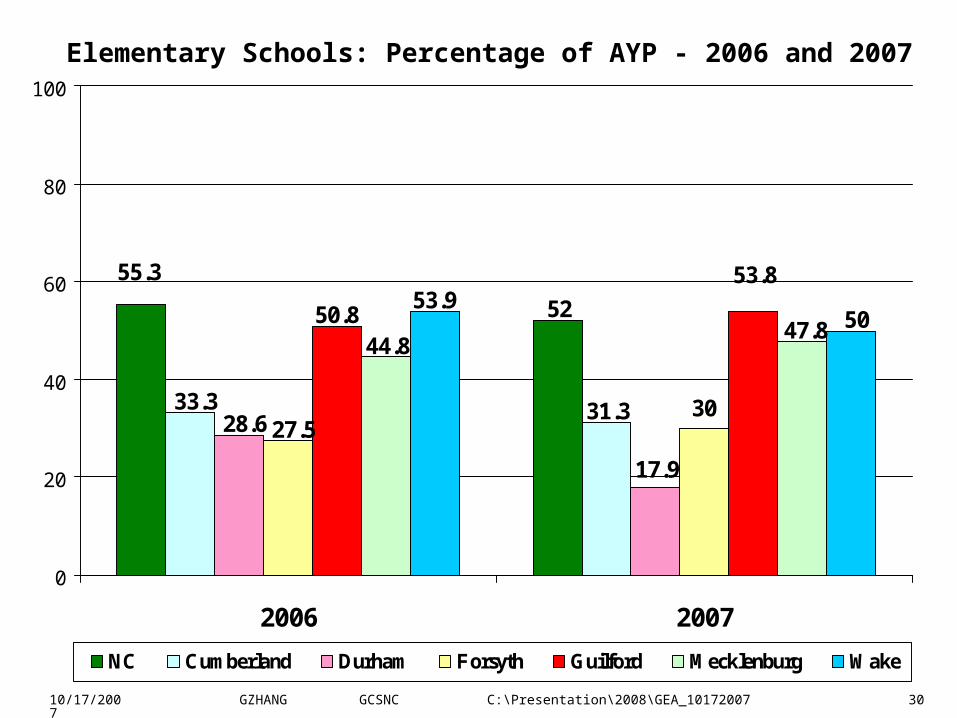
Elementary Schools: Percentage of AYP - 2006 and 2007
30
55.3
52
33.3 31.328.6
17.9
27.5
50.8
53.8
47.844.8
53.950
0
20
40
60
80
100
2006 2007
NC Cumberland Durham Forsyth Guilford Mecklenburg Wake
10/17/2007 GZHANG GCSNC C:\Presentation\2008\GEA_10172007 31
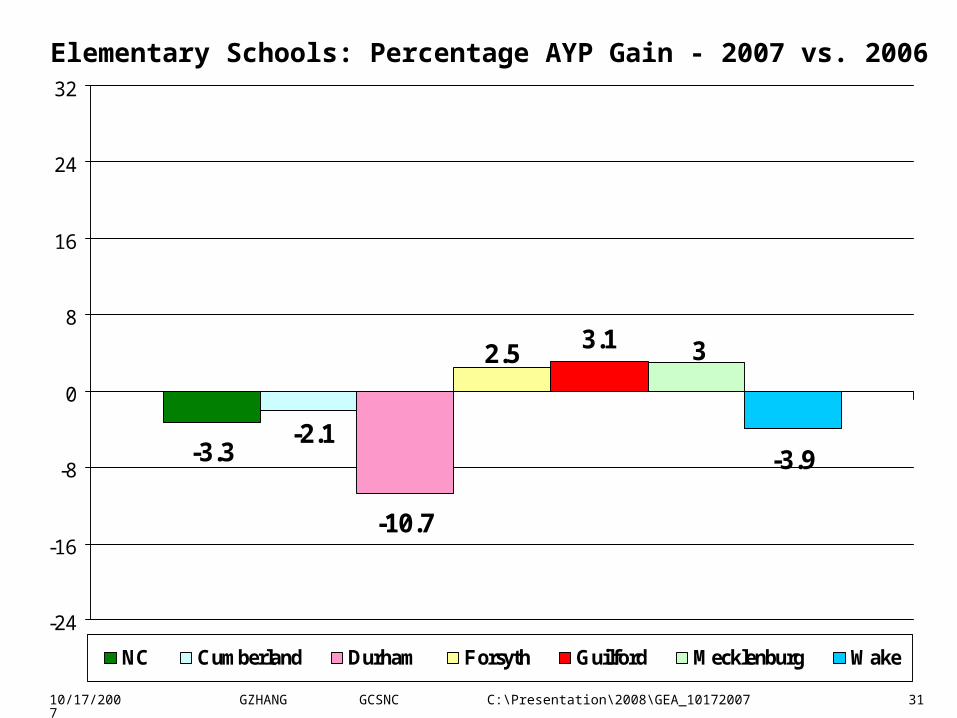
Elementary Schools: Percentage AYP Gain - 2007 vs. 2006
-3.3
-10.7
3.1
-2.1
2.5 3
-3.9
-24
-16
-8
0
8
16
24
32
NC Cumberland Durham Forsyth Guilford Mecklenburg Wake
10/17/2007 GZHANG GCSNC C:\Presentation\2008\GEA_10172007 32
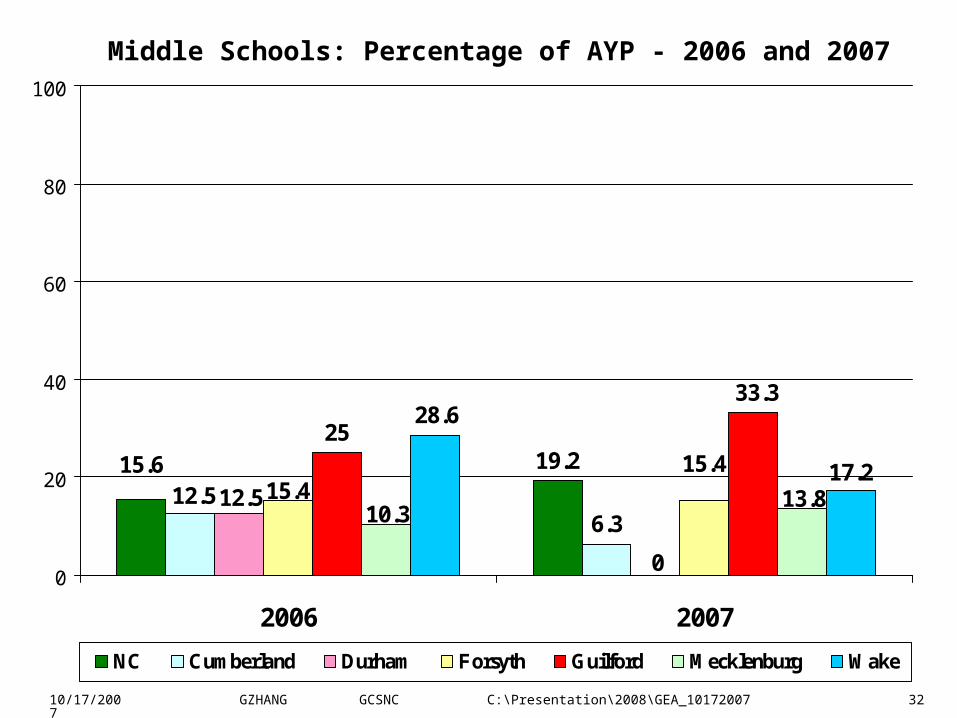
Middle Schools: Percentage of AYP - 2006 and 2007
19.225
15.612.5
6.312.5
0
15.415.4
33.3
13.810.3
28.6
17.2
0
20
40
60
80
100
2006 2007
NC Cumberland Durham Forsyth Guilford Mecklenburg Wake
10/17/2007 GZHANG GCSNC C:\Presentation\2008\GEA_10172007 33
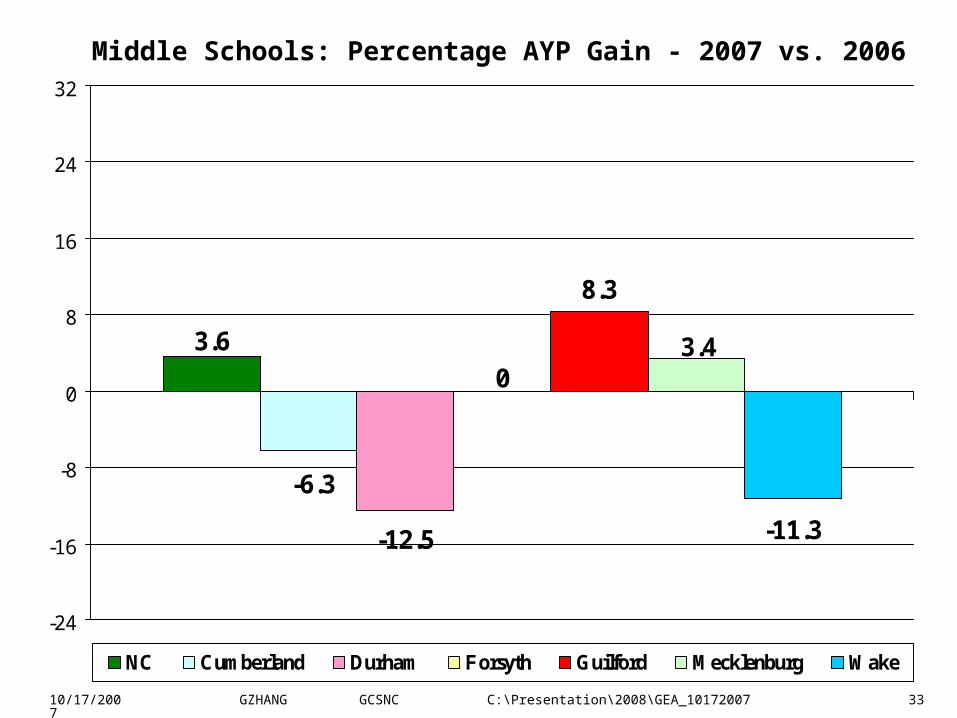
Middle Schools: Percentage AYP Gain - 2007 vs. 2006
-12.5
8.3
3.6
-6.3
03.4
-11.3
-24
-16
-8
0
8
16
24
32
NC Cumberland Durham Forsyth Guilford Mecklenburg Wake
10/17/2007 GZHANG GCSNC C:\Presentation\2008\GEA_10172007 34
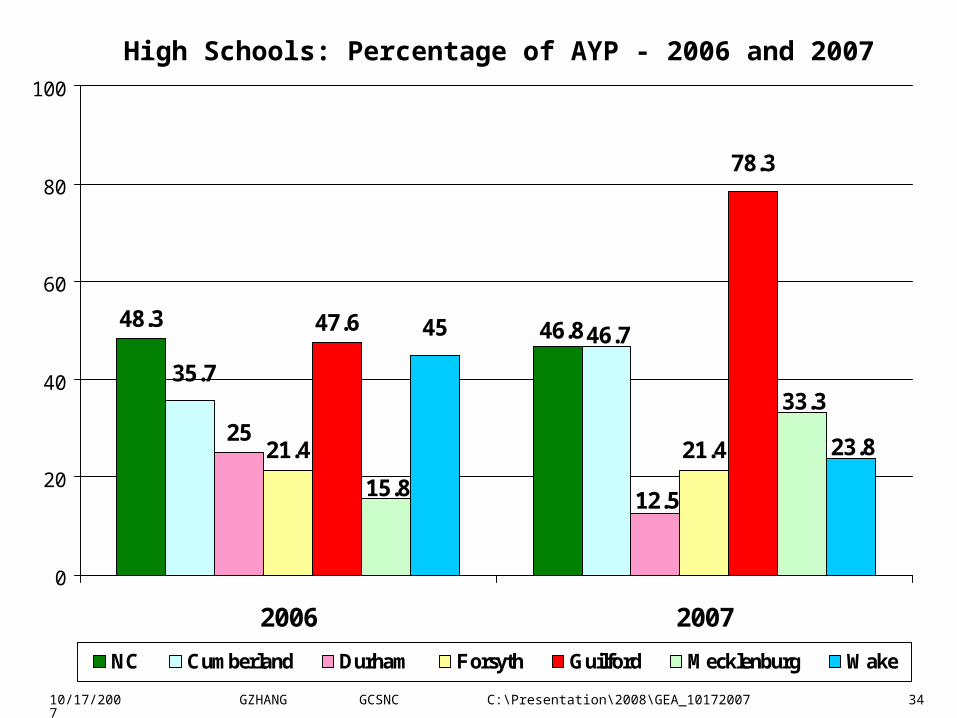
High Schools: Percentage of AYP - 2006 and 2007
48.3
2521.4 21.4
47.6 46.8
35.7
46.7
12.5
78.3
33.3
15.8
45
23.8
0
20
40
60
80
100
2006 2007
NC Cumberland Durham Forsyth Guilford Mecklenburg Wake

10/17/2007 GZHANG GCSNC C:\Presentation\2008\GEA_10172007 35
High Schools Percentage AYP Gain: 2007 vs. 2006
-1.5
11
-12.5
0
30.6
17.5
-21.2-24
-16
-8
0
8
16
24
32
NC Cumberland Durham Forsyth Guilford Mecklenburg Wake
10/17/2007 GZHANG GCSNC C:\Presentation\2008\GEA_10172007 36
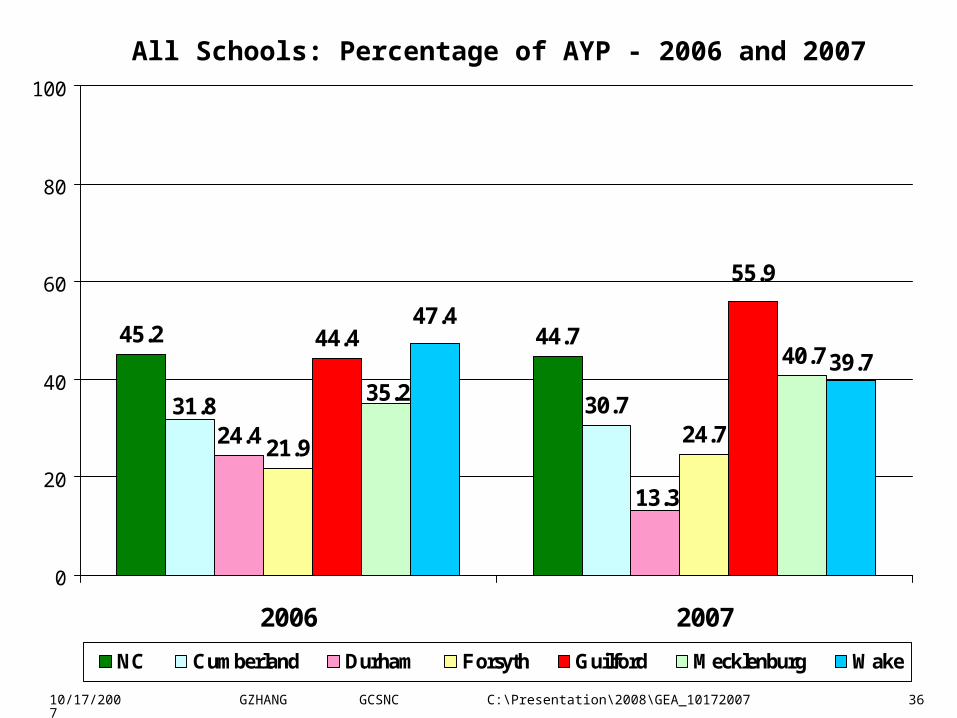
All Schools: Percentage of AYP - 2006 and 2007
45.2 44.7
24.4 21.924.7
44.4
31.8 30.7
13.3
55.9
40.7
35.2
47.4
39.7
0
20
40
60
80
100
2006 2007
NC Cumberland Durham Forsyth Guilford Mecklenburg Wake

10/17/2007 GZHANG GCSNC C:\Presentation\2008\GEA_10172007 37
All Schools: Percentage AYP Gain - 2007 vs. 2006
-0.4
-11.1
2.7
-1.1
11.4
5.5
-7.7
-24
-16
-8
0
8
16
24
32
NC Cumberland Durham Forsyth Guilford Mecklenburg Wake
10/17/2007 GZHANG GCSNC C:\Presentation\2008\GEA_10172007 38
(2)On High School Graduation Rate
10/17/2007 GZHANG GCSNC C:\Presentation\2008\GEA_10172007 39
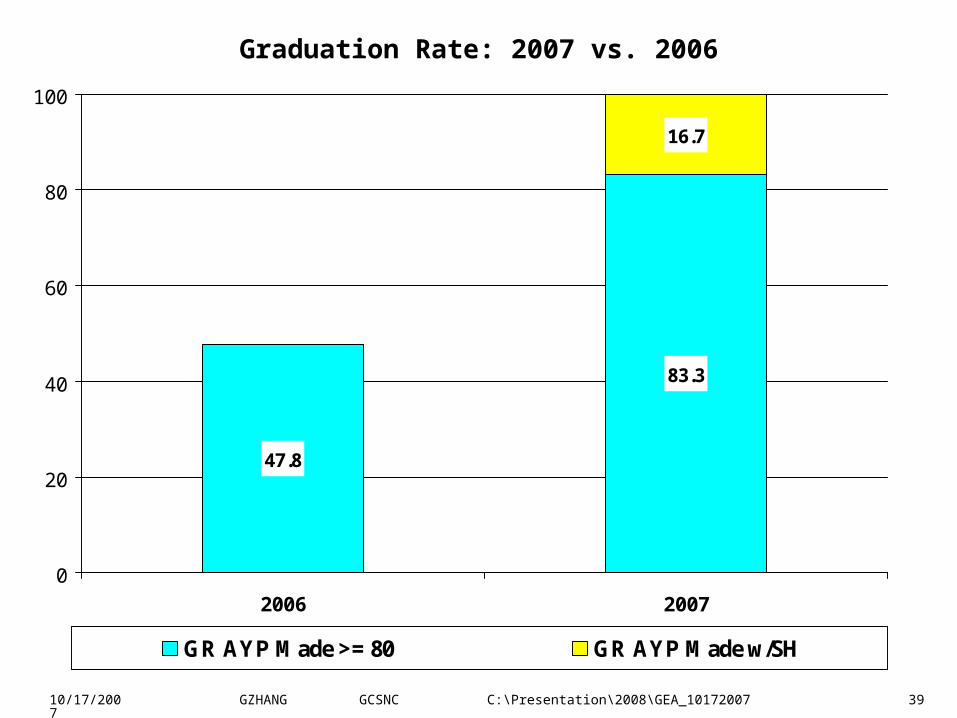
Graduation Rate: 2007 vs. 2006
47.8
83.3
16.7
0
20
40
60
80
100
2006 2007
GR AYP Made >= 80 GR AYP Made w/SH
10/17/2007 GZHANG GCSNC C:\Presentation\2008\GEA_10172007 40
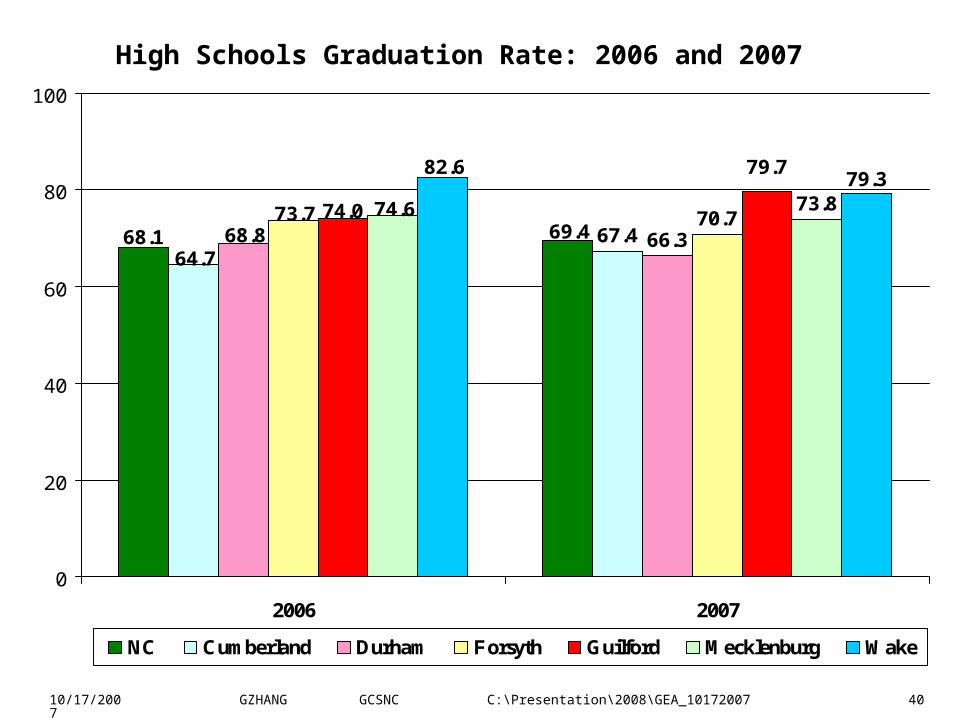
High Schools Graduation Rate: 2006 and 2007
66.370.7
73.8
68.1 69.464.7
67.468.873.7 74.0
79.7
74.6
82.679.3
0
20
40
60
80
100
2006 2007
NC Cumberland Durham Forsyth Guilford Mecklenburg Wake

10/17/2007 GZHANG GCSNC C:\Presentation\2008\GEA_10172007 41
Gain of High Schools Graduation Rate: 2007 vs. 2006
1.3
2.7
-2.5-3
5.7
-0.8
-3.3
-6
-4
-2
0
2
4
6
NC Cumberland Durham Forsyth Guilford Mecklenburg Wake
10/17/2007 GZHANG GCSNC C:\Presentation\2008\GEA_10172007 42
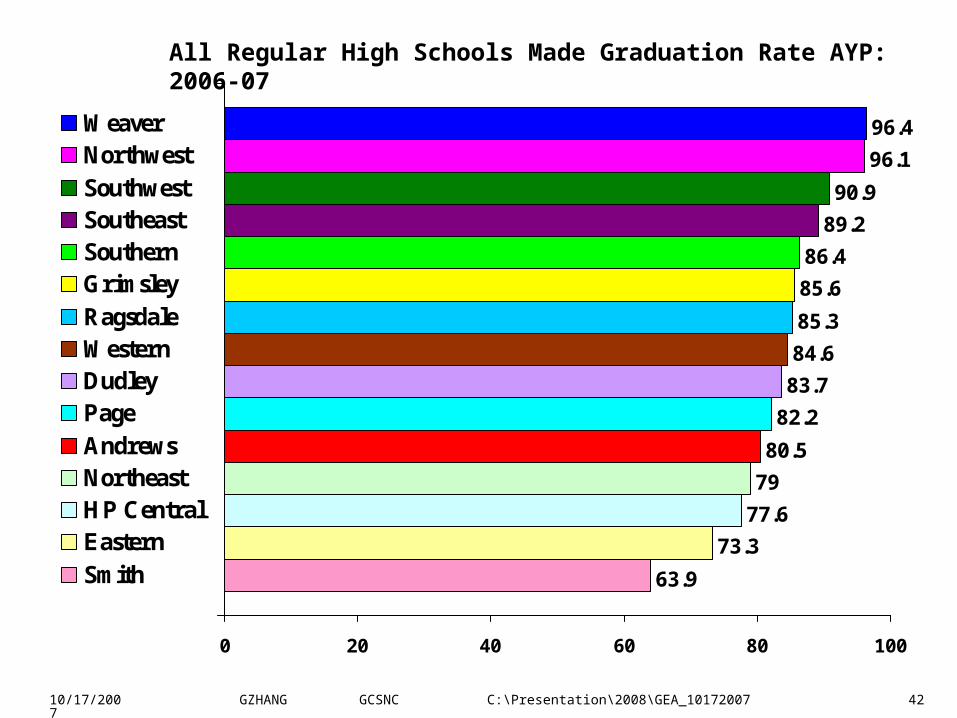
63.9
73.3
77.6
79
80.5
82.2
83.7
84.6
85.3
85.6
86.4
89.2
90.9
96.1
96.4
0 20 40 60 80 100
Weaver Northwest Southwest Southeast Southern Grimsley Ragsdale Western Dudley Page Andrews Northeast HP Central Eastern Smith
All Regular High Schools Made Graduation Rate AYP: 2006-07
10/17/2007 GZHANG GCSNC C:\Presentation\2008\GEA_10172007 43
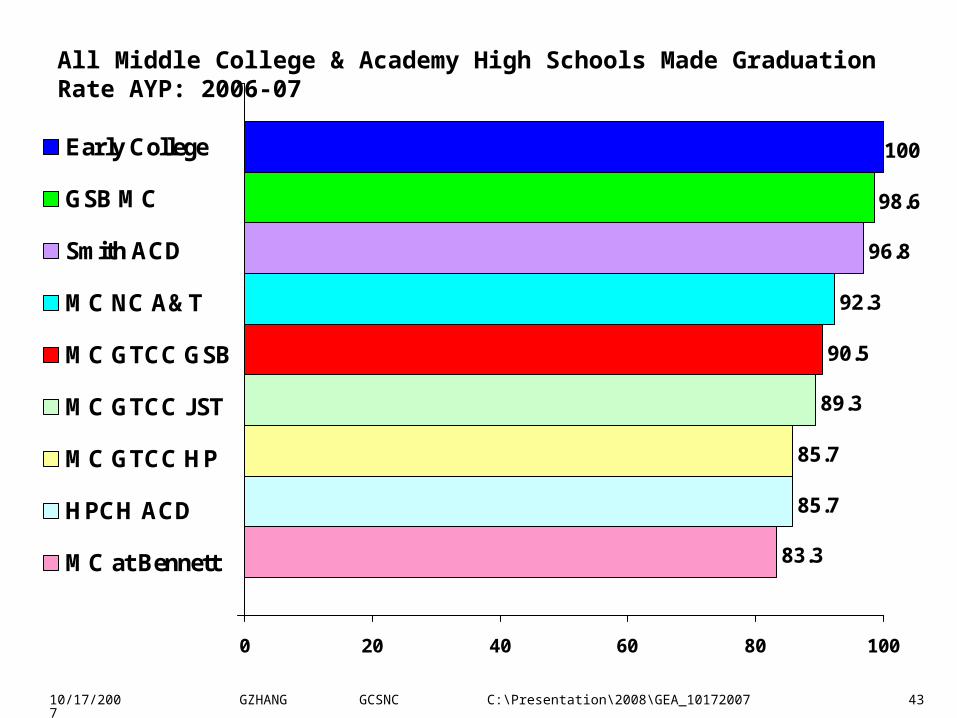
83.3
85.7
85.7
89.3
90.5
92.3
96.8
98.6
100
0 20 40 60 80 100
Early College
GSB MC
Smith ACD
MC NC A&T
MC GTCC GSB
MC GTCC JST
MC GTCC HP
HPCH ACD
MC at Bennett
All Middle College & Academy High Schools Made Graduation Rate AYP: 2006-07

10/17/2007 GZHANG GCSNC C:\Presentation\2008\GEA_10172007 44
(3)SAT Result
10/17/2007 GZHANG GCSNC C:\Presentation\2008\GEA_10172007 45
Scholastic Aptitude Test – SAT
• Assess the individual’s current readiness for college work to use in the admission, placement, and counseling for college students.
• Assess broadly applicable intellectual skills and knowledge that develop slowly over time through the individual’s experiences both in and out of school.
• Tie to common curricular objectives, not to the content of any specific course or field of study.
10/17/2007 GZHANG GCSNC C:\Presentation\2008\GEA_10172007 46
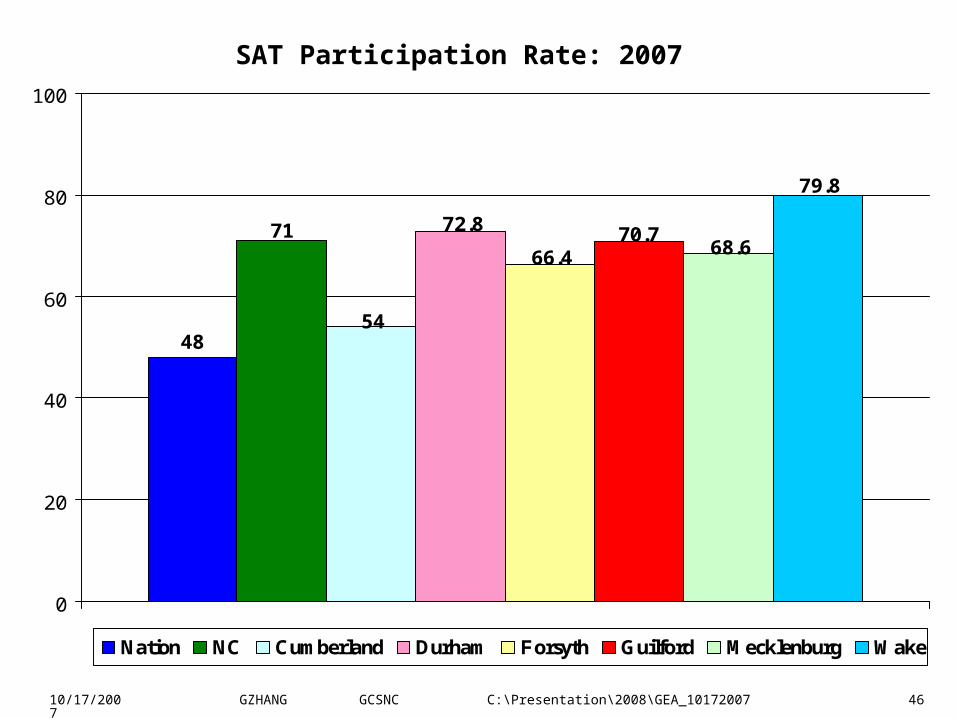
SAT Participation Rate: 2007
48
71
54
72.8
66.470.7
68.6
79.8
0
20
40
60
80
100
Nation NC Cumberland Durham Forsyth Guilford Mecklenburg Wake
10/17/2007 GZHANG GCSNC C:\Presentation\2008\GEA_10172007 47
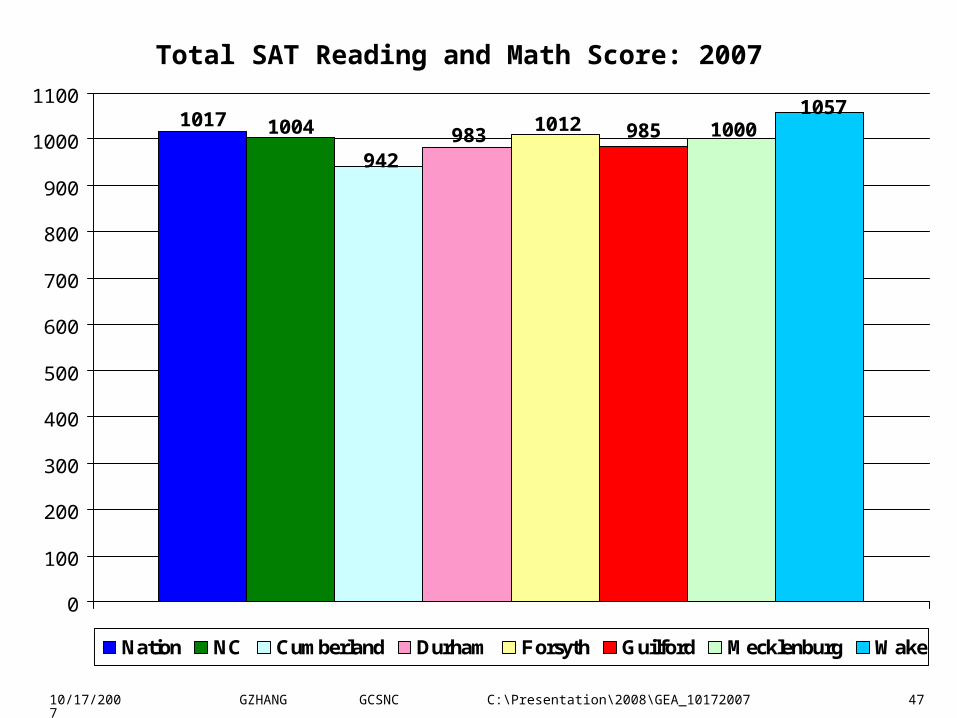
Total SAT Reading and Math Score: 2007
1017 1004
942983
1012 985 10001057
0
100
200
300
400
500
600
700
800
900
1000
1100
Nation NC Cumberland Durham Forsyth Guilford Mecklenburg Wake
10/17/2007 GZHANG GCSNC C:\Presentation\2008\GEA_10172007 48
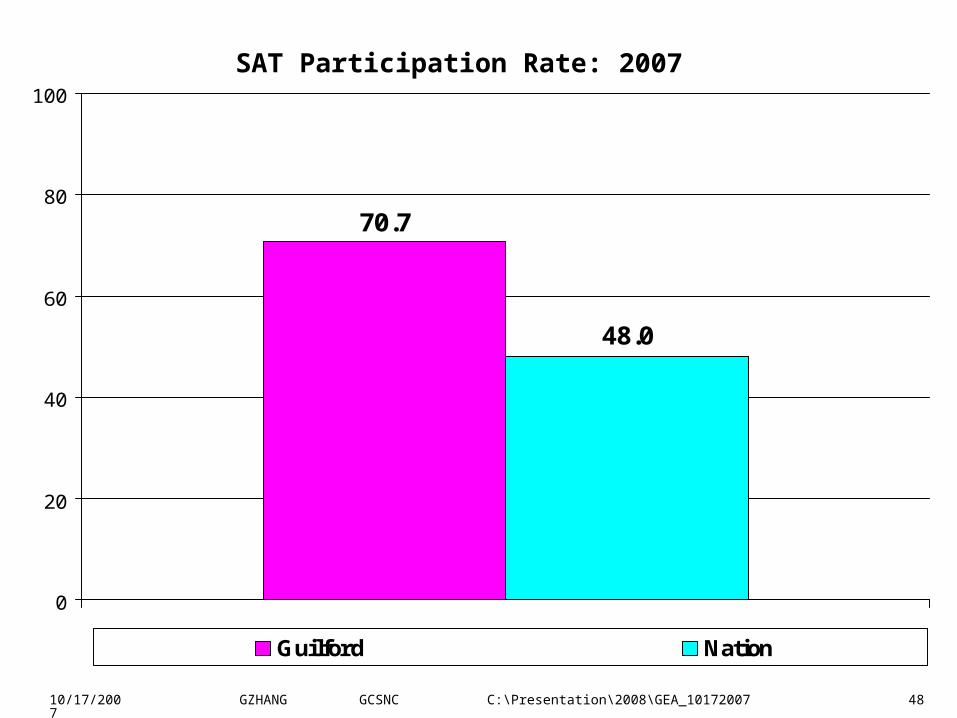
SAT Participation Rate: 2007
70.7
48.0
0
20
40
60
80
100
Guilford Nation
10/17/2007 GZHANG GCSNC C:\Presentation\2008\GEA_10172007 49
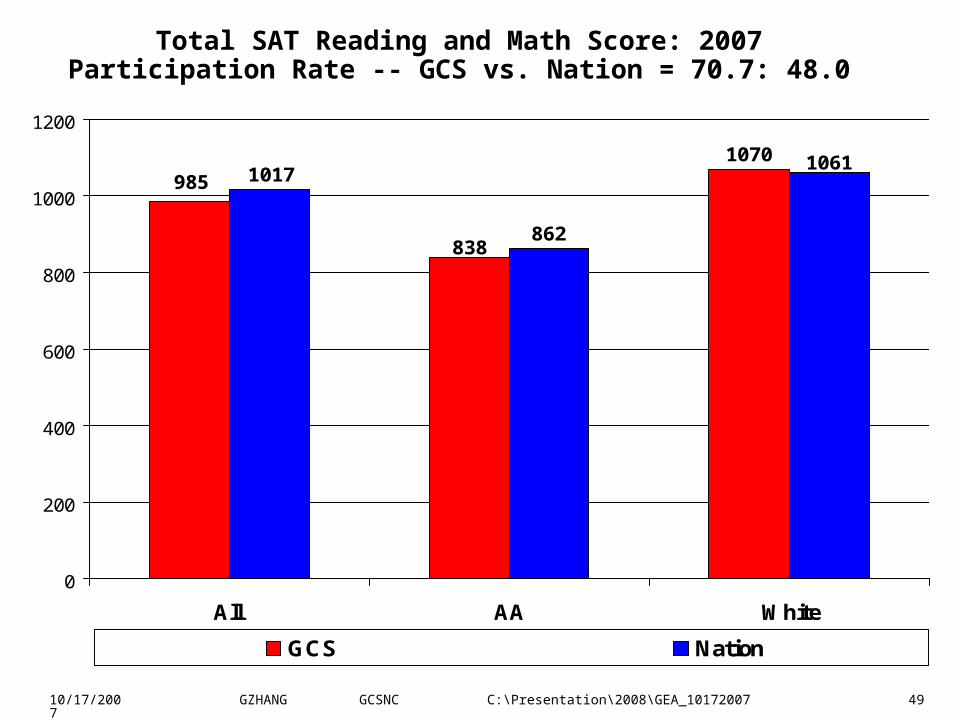
Total SAT Reading and Math Score: 2007Participation Rate -- GCS vs. Nation = 70.7: 48.0
985
1070
838
1061
862
1017
0
200
400
600
800
1000
1200
All AA White
GCS Nation

10/17/2007 GZHANG GCSNC C:\Presentation\2008\GEA_10172007 50
Total SAT Reading and Math Score: 2007 Participation Rate -- GCS vs. Nation = 48.0 : 48.0
1078
1168
922
1061
862
1017
0
200
400
600
800
1000
1200
All AA White
GCS Nation
10/17/2007 GZHANG GCSNC C:\Presentation\2008\GEA_10172007 51
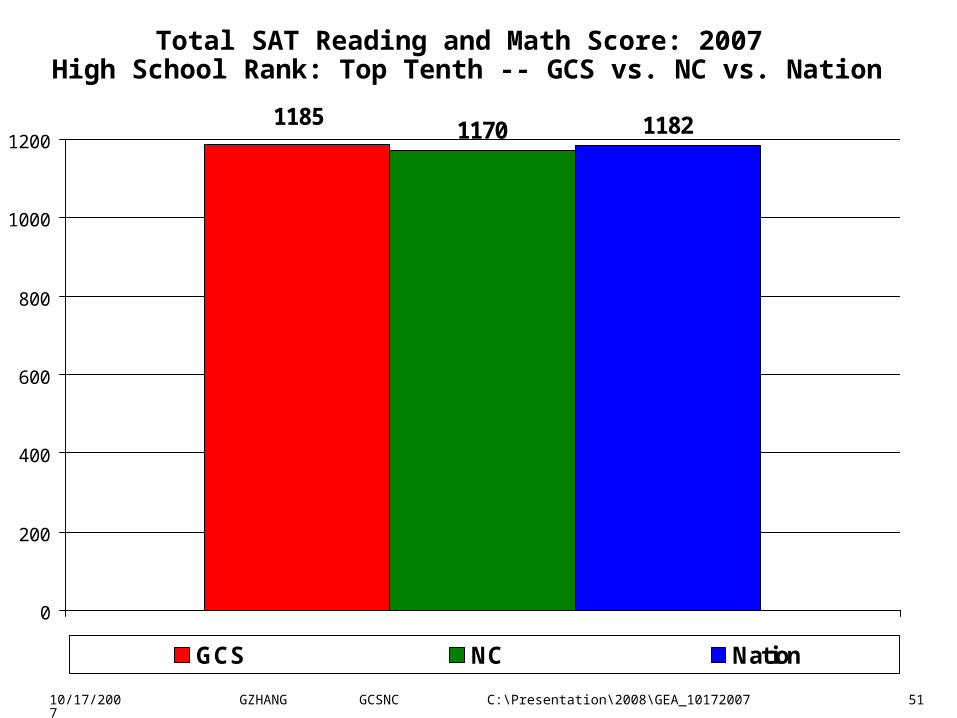
Total SAT Reading and Math Score: 2007 High School Rank: Top Tenth -- GCS vs. NC vs. Nation
11701185 1182
0
200
400
600
800
1000
1200
GCS NC Nation
10/17/2007 GZHANG GCSNC C:\Presentation\2008\GEA_10172007 52
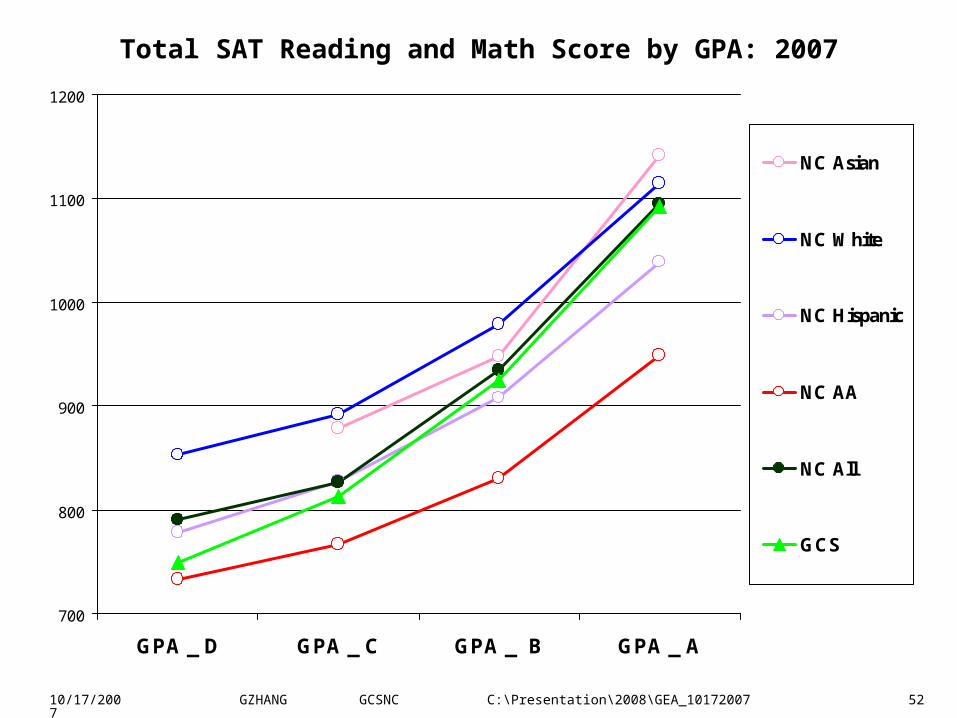
Total SAT Reading and Math Score by GPA: 2007
700
800
900
1000
1100
1200
GPA _ D GPA _ C GPA _ B GPA _ A
NC Asian
NC White
NC Hispanic
NC AA
NC All
GCS
10/17/2007 GZHANG GCSNC C:\Presentation\2008\GEA_10172007 53
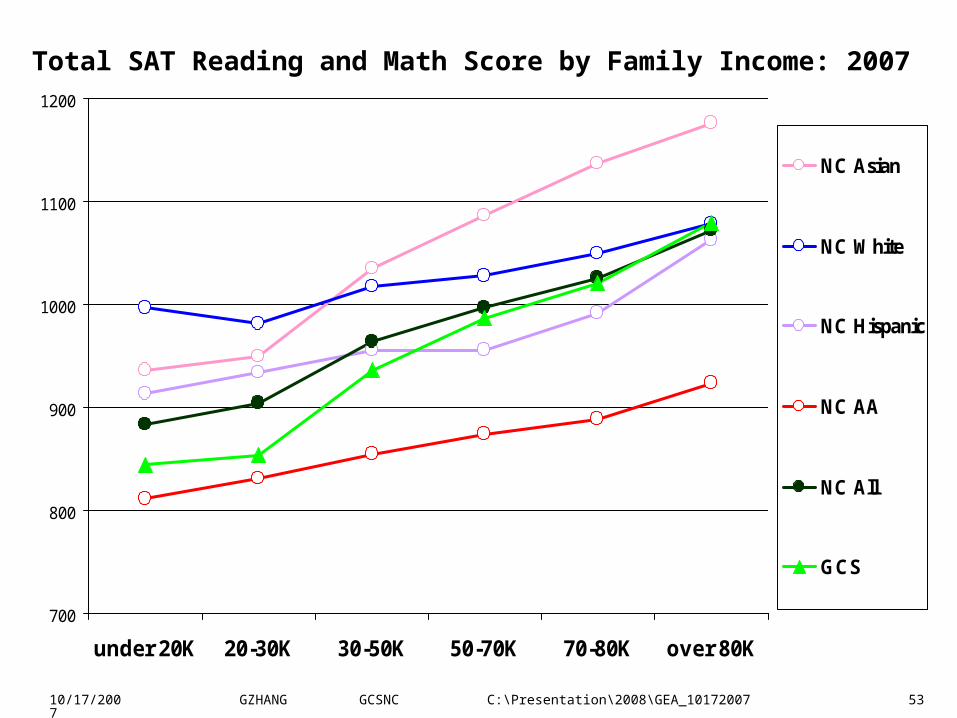
Total SAT Reading and Math Score by Family Income: 2007
700
800
900
1000
1100
1200
under 20K 20-30K 30-50K 50-70K 70-80K over 80K
NC Asian
NC White
NC Hispanic
NC AA
NC All
GCS
10/17/2007 GZHANG GCSNC C:\Presentation\2008\GEA_10172007 54
Part IVGCS Is Going to Make Continuous Progress
in 2007-08
10/17/2007 GZHANG GCSNC C:\Presentation\2008\GEA_10172007 55
(1) School Academic Focus
2007-08
http://www.gcsnc.com/friday/special/index.htm

10/17/2007 GZHANG GCSNC C:\Presentation\2008\GEA_10172007 56
1. Sustain our 2006-07 100% of schools met Graduation Rate AYP;
2. Expand the number of high schools making AYP. Seventy-eight percent of our high schools made AYP in 2006-07. We cannot regress and must work hard if all high schools are to make AYP in 2007-08;
3. Raise ABCs Performance Composite (PC) scores (the overall percentage of students who are proficient in all tested subjects) on EOC test to at least one seventh of the gap between each school’s PC in 2006-07 and 100 -- so schools can increase their PC to 100 by 2013-14;
4. Significantly improve Scholastic Aptitude Test (SAT) scores, without sacrificing the participation rate. Close the gap between GCS and Charlotte Mecklenburg within two years; close the gap between GCS and the state within four years, and close the gap between GCS and Wake County by 2013-14.
High Schools
10/17/2007 GZHANG GCSNC C:\Presentation\2008\GEA_10172007 57
1. Significantly increase EOG math scores without neglecting reading, especially for students receiving free and reduced- priced lunch and our African-American students, and pay attention to writing and science;
2. Increase the number of schools making AYP by working with low performing school-level groups under the higher EOG reading proficiency standards and higher AYP targets in both math and reading starting in 2007-08;
3. Increase ABCs PC under the new EOG reading proficiency standard starting in 2007-08. Close the gap between GCS and the state within one year and close the gap between GCS and Wake County within three years.
Middle Schools
10/17/2007 GZHANG GCSNC C:\Presentation\2008\GEA_10172007 58
1. Significantly strengthen our pre-kindergarten through second grade literacy program;
2. Significantly improve the reading scores of students receiving free and reduced-priced lunch and our African-American students and – while meeting the academic needs of other students and not ignoring other academic areas;
3. Sustain high percent of schools making AYP under the higher EOG reading proficiency standards and higher AYP targets in both math and reading starting in 2007-08;
4. Increase ABCs PC under the new EOG reading proficiency standard starting in 2007-08. Close the gap between GCS and Mecklenburg/state within one year and close the gap between GCS
and Wake within four years.
Elementary Schools
10/17/2007 GZHANG GCSNC C:\Presentation\2008\GEA_10172007 59
1. Focus on providing additional support to students receiving free and reduced meals and African-American students to achieve all three thematic goals. The achievement gap between these groups and our white and affluent students is real. Without helping African-American and free and reduced meal students make significant progress, GCS will not make needed gains in 2007-08;
2. Focus attention on our top performing academic students. We must move more of our ‘low’ Level IV students into the ‘high’ Level IV category. Simply stated, we are not challenging many of our brightest performers. We must remember the importance of differentiating instruction in our classrooms.
All Schools
10/17/2007 GZHANG GCSNC C:\Presentation\2008\GEA_10172007 60
(2) Quantified Goals for
Each School Academic Focus
2007-08
http://www.gcsnc.com/friday/special/index.htm
10/17/2007 GZHANG GCSNC C:\Presentation\2008\GEA_10172007 61
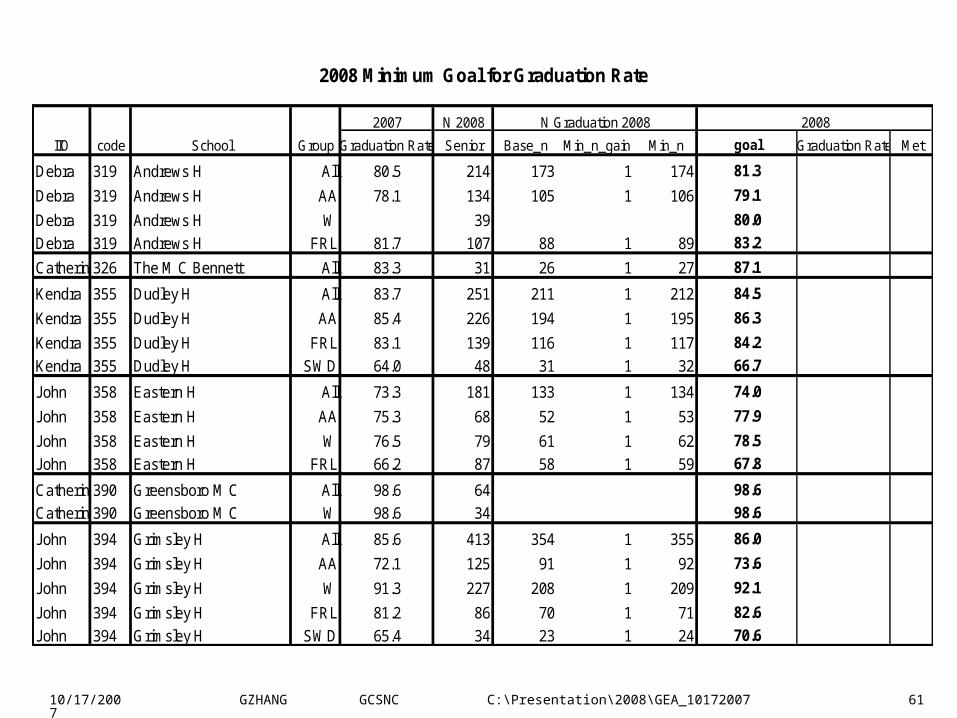
2007 N 2008
IIO code School Group Graduation Rate Senior Base_n Min_n_gain Min_n goal Graduation Rate Met
Debra 319 Andrews H All 80.5 214 173 1 174 81.3
Debra 319 Andrews H AA 78.1 134 105 1 106 79.1
Debra 319 Andrews H W 39 80.0
Debra 319 Andrews H FRL 81.7 107 88 1 89 83.2
Catherin 326 The M C Bennett All 83.3 31 26 1 27 87.1
Kendra 355 Dudley H All 83.7 251 211 1 212 84.5
Kendra 355 Dudley H AA 85.4 226 194 1 195 86.3
Kendra 355 Dudley H FRL 83.1 139 116 1 117 84.2
Kendra 355 Dudley H SWD 64.0 48 31 1 32 66.7
John 358 Eastern H All 73.3 181 133 1 134 74.0
John 358 Eastern H AA 75.3 68 52 1 53 77.9
John 358 Eastern H W 76.5 79 61 1 62 78.5
John 358 Eastern H FRL 66.2 87 58 1 59 67.8
Catherin 390 Greensboro M C All 98.6 64 98.6
Catherin 390 Greensboro M C W 98.6 34 98.6
John 394 Grimsley H All 85.6 413 354 1 355 86.0
John 394 Grimsley H AA 72.1 125 91 1 92 73.6
John 394 Grimsley H W 91.3 227 208 1 209 92.1
John 394 Grimsley H FRL 81.2 86 70 1 71 82.6
John 394 Grimsley H SWD 65.4 34 23 1 24 70.6
N Graduation 2008
2008 Minimum Goal for Graduation Rate
2008
10/17/2007 GZHANG GCSNC C:\Presentation\2008\GEA_10172007 62
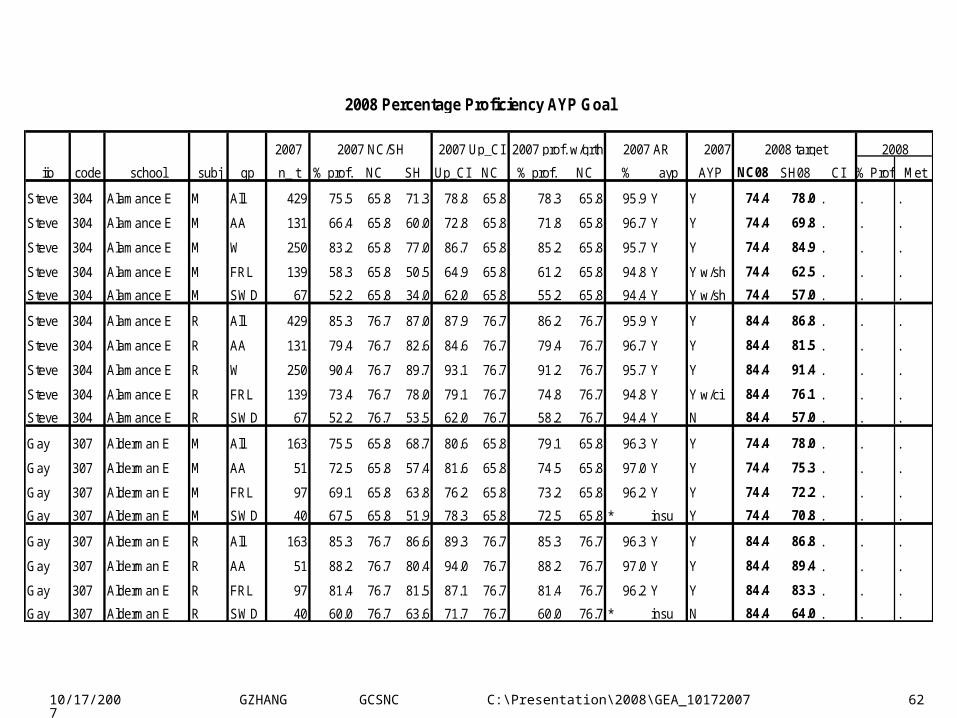
2007 2007
iio code school subj gp n_ t % prof. NC SH Up_CI NC % prof. NC % ayp AYP NC08 SH08 CI % Prof. Met
Steve 304 Alamance E M All 429 75.5 65.8 71.3 78.8 65.8 78.3 65.8 95.9 Y Y 74.4 78.0 . . .
Steve 304 Alamance E M AA 131 66.4 65.8 60.0 72.8 65.8 71.8 65.8 96.7 Y Y 74.4 69.8 . . .
Steve 304 Alamance E M W 250 83.2 65.8 77.0 86.7 65.8 85.2 65.8 95.7 Y Y 74.4 84.9 . . .
Steve 304 Alamance E M FRL 139 58.3 65.8 50.5 64.9 65.8 61.2 65.8 94.8 Y Y w/sh 74.4 62.5 . . .
Steve 304 Alamance E M SWD 67 52.2 65.8 34.0 62.0 65.8 55.2 65.8 94.4 Y Y w/sh 74.4 57.0 . . .
Steve 304 Alamance E R All 429 85.3 76.7 87.0 87.9 76.7 86.2 76.7 95.9 Y Y 84.4 86.8 . . .
Steve 304 Alamance E R AA 131 79.4 76.7 82.6 84.6 76.7 79.4 76.7 96.7 Y Y 84.4 81.5 . . .
Steve 304 Alamance E R W 250 90.4 76.7 89.7 93.1 76.7 91.2 76.7 95.7 Y Y 84.4 91.4 . . .
Steve 304 Alamance E R FRL 139 73.4 76.7 78.0 79.1 76.7 74.8 76.7 94.8 Y Y w/ci 84.4 76.1 . . .
Steve 304 Alamance E R SWD 67 52.2 76.7 53.5 62.0 76.7 58.2 76.7 94.4 Y N 84.4 57.0 . . .
Gay 307 Alderman E M All 163 75.5 65.8 68.7 80.6 65.8 79.1 65.8 96.3 Y Y 74.4 78.0 . . .
Gay 307 Alderman E M AA 51 72.5 65.8 57.4 81.6 65.8 74.5 65.8 97.0 Y Y 74.4 75.3 . . .
Gay 307 Alderman E M FRL 97 69.1 65.8 63.8 76.2 65.8 73.2 65.8 96.2 Y Y 74.4 72.2 . . .
Gay 307 Alderman E M SWD 40 67.5 65.8 51.9 78.3 65.8 72.5 65.8 * insu Y 74.4 70.8 . . .
Gay 307 Alderman E R All 163 85.3 76.7 86.6 89.3 76.7 85.3 76.7 96.3 Y Y 84.4 86.8 . . .
Gay 307 Alderman E R AA 51 88.2 76.7 80.4 94.0 76.7 88.2 76.7 97.0 Y Y 84.4 89.4 . . .
Gay 307 Alderman E R FRL 97 81.4 76.7 81.5 87.1 76.7 81.4 76.7 96.2 Y Y 84.4 83.3 . . .
Gay 307 Alderman E R SWD 40 60.0 76.7 63.6 71.7 76.7 60.0 76.7 * insu N 84.4 64.0 . . .
2008 target 2008
2008 Percentage Proficiency AYP Goal
2007 NC/SH 2007 Up_CI 2007 prof. w/grth 2007 AR
10/17/2007 GZHANG GCSNC C:\Presentation\2008\GEA_10172007 63
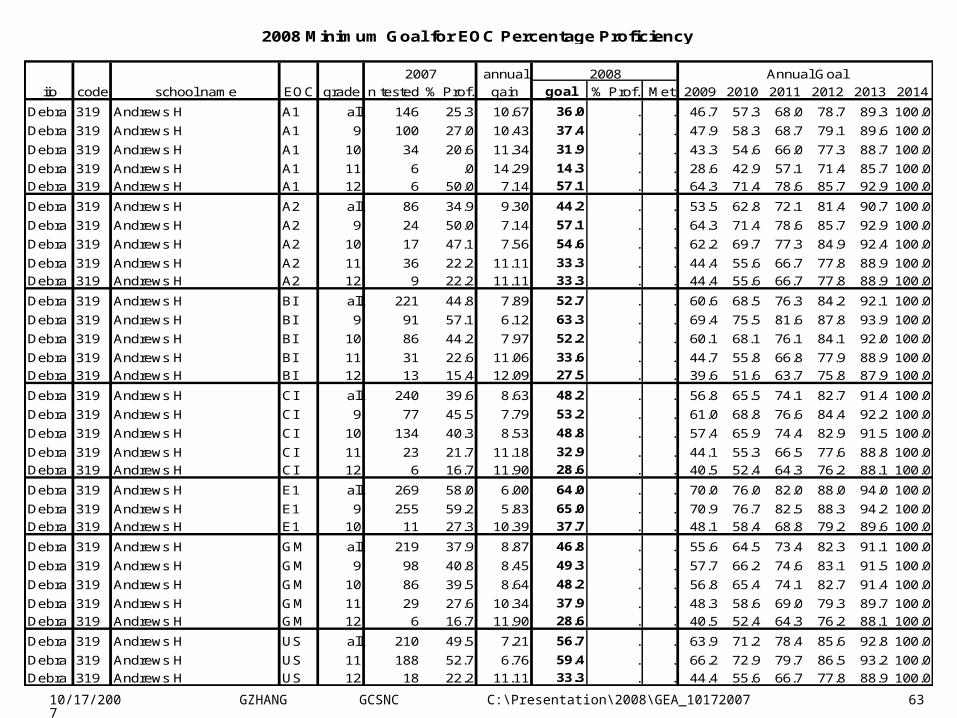
annual
iio code school name EOC grade n tested % Prof. gain goal % Prof. Met 2009 2010 2011 2012 2013 2014
Debra 319 Andrews H A1 all 146 25.3 10.67 36.0 . . 46.7 57.3 68.0 78.7 89.3 100.0
Debra 319 Andrews H A1 9 100 27.0 10.43 37.4 . . 47.9 58.3 68.7 79.1 89.6 100.0
Debra 319 Andrews H A1 10 34 20.6 11.34 31.9 . . 43.3 54.6 66.0 77.3 88.7 100.0
Debra 319 Andrews H A1 11 6 .0 14.29 14.3 . . 28.6 42.9 57.1 71.4 85.7 100.0
Debra 319 Andrews H A1 12 6 50.0 7.14 57.1 . . 64.3 71.4 78.6 85.7 92.9 100.0
Debra 319 Andrews H A2 all 86 34.9 9.30 44.2 . . 53.5 62.8 72.1 81.4 90.7 100.0
Debra 319 Andrews H A2 9 24 50.0 7.14 57.1 . . 64.3 71.4 78.6 85.7 92.9 100.0
Debra 319 Andrews H A2 10 17 47.1 7.56 54.6 . . 62.2 69.7 77.3 84.9 92.4 100.0
Debra 319 Andrews H A2 11 36 22.2 11.11 33.3 . . 44.4 55.6 66.7 77.8 88.9 100.0
Debra 319 Andrews H A2 12 9 22.2 11.11 33.3 . . 44.4 55.6 66.7 77.8 88.9 100.0
Debra 319 Andrews H BI all 221 44.8 7.89 52.7 . . 60.6 68.5 76.3 84.2 92.1 100.0
Debra 319 Andrews H BI 9 91 57.1 6.12 63.3 . . 69.4 75.5 81.6 87.8 93.9 100.0
Debra 319 Andrews H BI 10 86 44.2 7.97 52.2 . . 60.1 68.1 76.1 84.1 92.0 100.0
Debra 319 Andrews H BI 11 31 22.6 11.06 33.6 . . 44.7 55.8 66.8 77.9 88.9 100.0
Debra 319 Andrews H BI 12 13 15.4 12.09 27.5 . . 39.6 51.6 63.7 75.8 87.9 100.0
Debra 319 Andrews H CI all 240 39.6 8.63 48.2 . . 56.8 65.5 74.1 82.7 91.4 100.0
Debra 319 Andrews H CI 9 77 45.5 7.79 53.2 . . 61.0 68.8 76.6 84.4 92.2 100.0
Debra 319 Andrews H CI 10 134 40.3 8.53 48.8 . . 57.4 65.9 74.4 82.9 91.5 100.0
Debra 319 Andrews H CI 11 23 21.7 11.18 32.9 . . 44.1 55.3 66.5 77.6 88.8 100.0
Debra 319 Andrews H CI 12 6 16.7 11.90 28.6 . . 40.5 52.4 64.3 76.2 88.1 100.0
Debra 319 Andrews H E1 all 269 58.0 6.00 64.0 . . 70.0 76.0 82.0 88.0 94.0 100.0
Debra 319 Andrews H E1 9 255 59.2 5.83 65.0 . . 70.9 76.7 82.5 88.3 94.2 100.0
Debra 319 Andrews H E1 10 11 27.3 10.39 37.7 . . 48.1 58.4 68.8 79.2 89.6 100.0
Debra 319 Andrews H GM all 219 37.9 8.87 46.8 . . 55.6 64.5 73.4 82.3 91.1 100.0
Debra 319 Andrews H GM 9 98 40.8 8.45 49.3 . . 57.7 66.2 74.6 83.1 91.5 100.0
Debra 319 Andrews H GM 10 86 39.5 8.64 48.2 . . 56.8 65.4 74.1 82.7 91.4 100.0
Debra 319 Andrews H GM 11 29 27.6 10.34 37.9 . . 48.3 58.6 69.0 79.3 89.7 100.0
Debra 319 Andrews H GM 12 6 16.7 11.90 28.6 . . 40.5 52.4 64.3 76.2 88.1 100.0
Debra 319 Andrews H US all 210 49.5 7.21 56.7 . . 63.9 71.2 78.4 85.6 92.8 100.0
Debra 319 Andrews H US 11 188 52.7 6.76 59.4 . . 66.2 72.9 79.7 86.5 93.2 100.0
Debra 319 Andrews H US 12 18 22.2 11.11 33.3 . . 44.4 55.6 66.7 77.8 88.9 100.0
2008 Minimum Goal for EOC Percentage Proficiency
2007 2008 Annual Goal
10/17/2007 GZHANG GCSNC C:\Presentation\2008\GEA_10172007 64
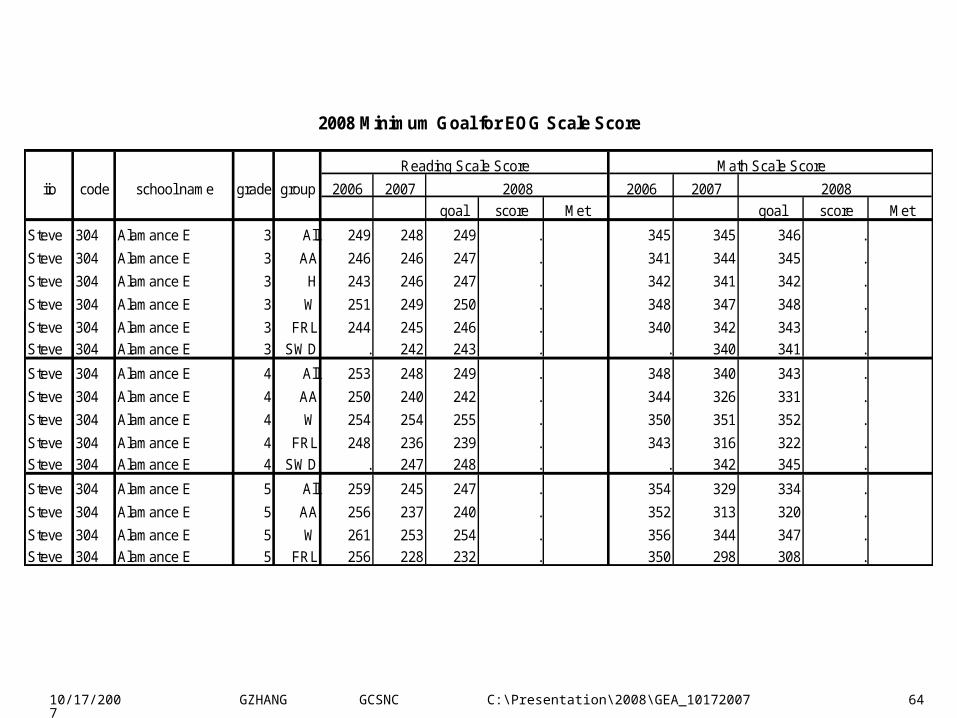
iio code school name grade group 2006 2007 2006 2007
goal score Met goal score Met
Steve 304 Alamance E 3 All 249 248 249 . 345 345 346 .
Steve 304 Alamance E 3 AA 246 246 247 . 341 344 345 .
Steve 304 Alamance E 3 H 243 246 247 . 342 341 342 .
Steve 304 Alamance E 3 W 251 249 250 . 348 347 348 .
Steve 304 Alamance E 3 FRL 244 245 246 . 340 342 343 .
Steve 304 Alamance E 3 SWD . 242 243 . . 340 341 .
Steve 304 Alamance E 4 All 253 248 249 . 348 340 343 .
Steve 304 Alamance E 4 AA 250 240 242 . 344 326 331 .
Steve 304 Alamance E 4 W 254 254 255 . 350 351 352 .
Steve 304 Alamance E 4 FRL 248 236 239 . 343 316 322 .
Steve 304 Alamance E 4 SWD . 247 248 . . 342 345 .
Steve 304 Alamance E 5 All 259 245 247 . 354 329 334 .
Steve 304 Alamance E 5 AA 256 237 240 . 352 313 320 .
Steve 304 Alamance E 5 W 261 253 254 . 356 344 347 .
Steve 304 Alamance E 5 FRL 256 228 232 . 350 298 308 .
2008 Minimum Goal for EOG Scale Score
Reading Scale Score Math Scale Score
2008 2008
10/17/2007 GZHANG GCSNC C:\Presentation\2008\GEA_10172007 65
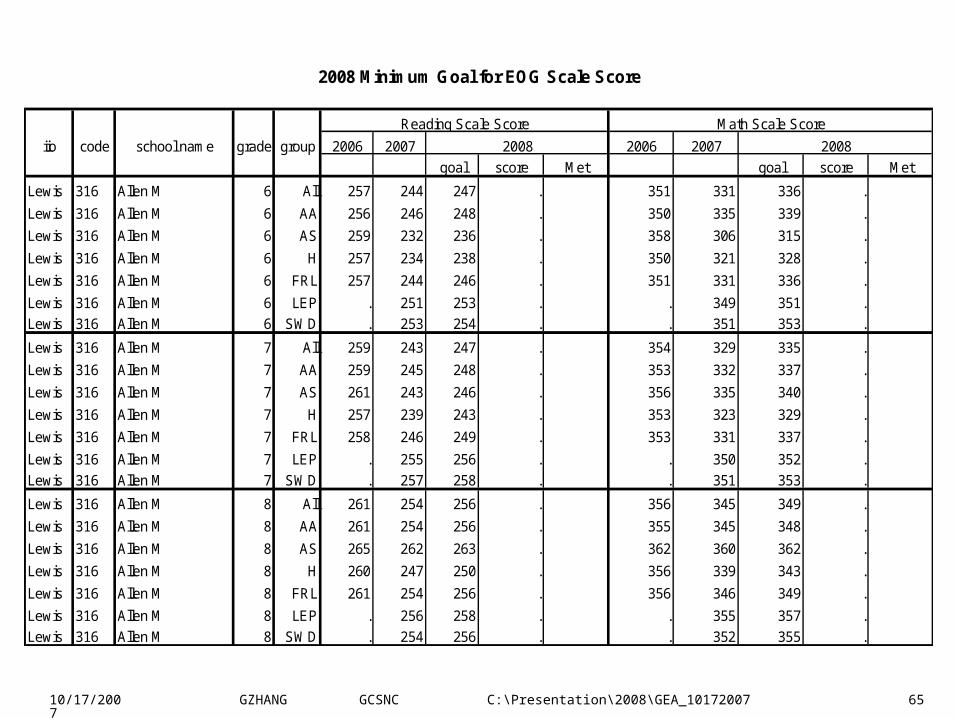
iio code school name grade group 2006 2007 2006 2007
goal score Met goal score Met
Lewis 316 Allen M 6 All 257 244 247 . 351 331 336 .
Lewis 316 Allen M 6 AA 256 246 248 . 350 335 339 .
Lewis 316 Allen M 6 AS 259 232 236 . 358 306 315 .
Lewis 316 Allen M 6 H 257 234 238 . 350 321 328 .
Lewis 316 Allen M 6 FRL 257 244 246 . 351 331 336 .
Lewis 316 Allen M 6 LEP . 251 253 . . 349 351 .
Lewis 316 Allen M 6 SWD . 253 254 . . 351 353 .
Lewis 316 Allen M 7 All 259 243 247 . 354 329 335 .
Lewis 316 Allen M 7 AA 259 245 248 . 353 332 337 .
Lewis 316 Allen M 7 AS 261 243 246 . 356 335 340 .
Lewis 316 Allen M 7 H 257 239 243 . 353 323 329 .
Lewis 316 Allen M 7 FRL 258 246 249 . 353 331 337 .
Lewis 316 Allen M 7 LEP . 255 256 . . 350 352 .
Lewis 316 Allen M 7 SWD . 257 258 . . 351 353 .
Lewis 316 Allen M 8 All 261 254 256 . 356 345 349 .
Lewis 316 Allen M 8 AA 261 254 256 . 355 345 348 .
Lewis 316 Allen M 8 AS 265 262 263 . 362 360 362 .
Lewis 316 Allen M 8 H 260 247 250 . 356 339 343 .
Lewis 316 Allen M 8 FRL 261 254 256 . 356 346 349 .
Lewis 316 Allen M 8 LEP . 256 258 . . 355 357 .
Lewis 316 Allen M 8 SWD . 254 256 . . 352 355 .
2008 Minimum Goal for EOG Scale Score
Reading Scale Score Math Scale Score
2008 2008
10/17/2007 GZHANG GCSNC C:\Presentation\2008\GEA_10172007 66
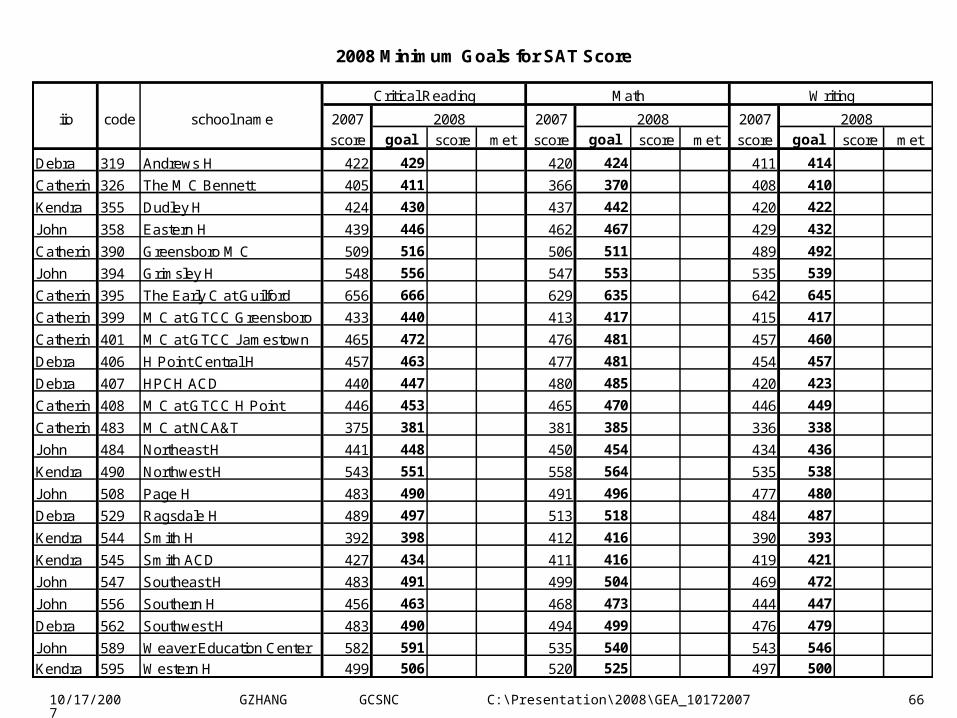
iio code school name 2007 2007 2007
score goal score met score goal score met score goal score met
Debra 319 Andrews H 422 429 420 424 411 414
Catherin 326 The M C Bennett 405 411 366 370 408 410
Kendra 355 Dudley H 424 430 437 442 420 422
John 358 Eastern H 439 446 462 467 429 432
Catherin 390 Greensboro M C 509 516 506 511 489 492
John 394 Grimsley H 548 556 547 553 535 539
Catherin 395 The Early C at Guilford 656 666 629 635 642 645
Catherin 399 M C at GTCC Greensboro 433 440 413 417 415 417
Catherin 401 M C at GTCC Jamestown 465 472 476 481 457 460
Debra 406 H Point Central H 457 463 477 481 454 457
Debra 407 HPCH ACD 440 447 480 485 420 423
Catherin 408 M C at GTCC H Point 446 453 465 470 446 449
Catherin 483 M C at NCA&T 375 381 381 385 336 338
John 484 Northeast H 441 448 450 454 434 436
Kendra 490 Northwest H 543 551 558 564 535 538
John 508 Page H 483 490 491 496 477 480
Debra 529 Ragsdale H 489 497 513 518 484 487
Kendra 544 Smith H 392 398 412 416 390 393
Kendra 545 Smith ACD 427 434 411 416 419 421
John 547 Southeast H 483 491 499 504 469 472
John 556 Southern H 456 463 468 473 444 447
Debra 562 Southwest H 483 490 494 499 476 479
John 589 Weaver Education Center 582 591 535 540 543 546
Kendra 595 Western H 499 506 520 525 497 500
2008
Writing
2008 Minimum Goals for SAT Score
Critical Reading
2008
Math
2008