10/5/20151 5 october 20151 part b dsd financial outlook
TRANSCRIPT
04/19/23 1April 19, 2023 1
PART BPART B
DSDDSD
Financial outlookFinancial outlook
2April 19, 2023 2
DSDFinancial outlook
Portfolio Committee
HIGHLIGHTSHIGHLIGHTS
• 2011 MTEF Allocations• Earmarked Allocations• Budget Structure Changes• Allocations per Programme and Economic
Classification– Summary– Operational
3Portfolio Committee
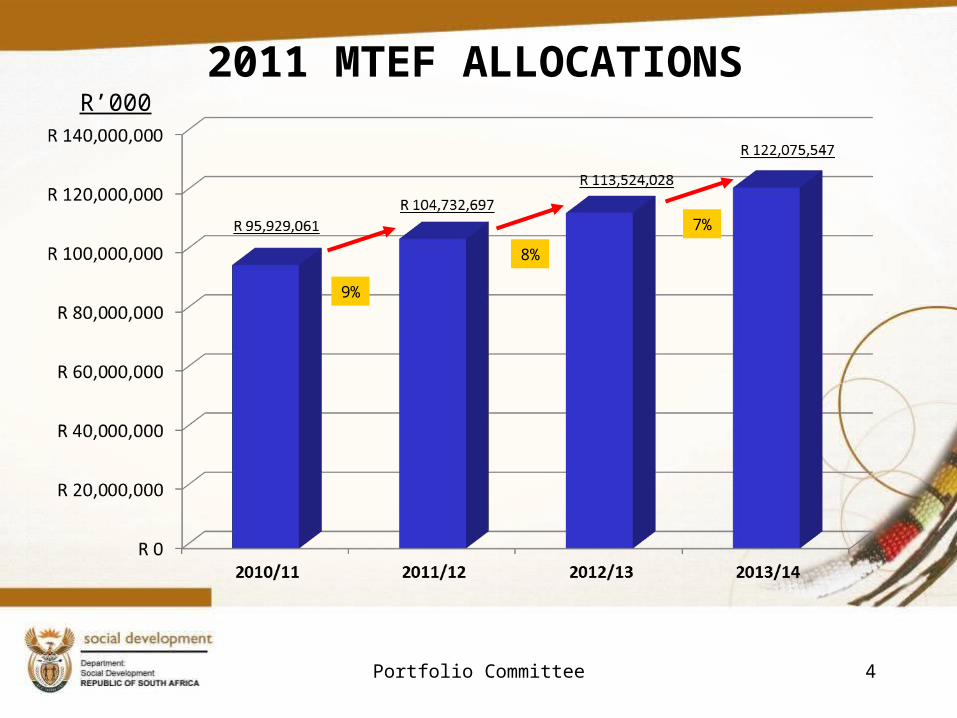
2011 MTEF ALLOCATIONSR’000
9%
8%
7%
4Portfolio Committee
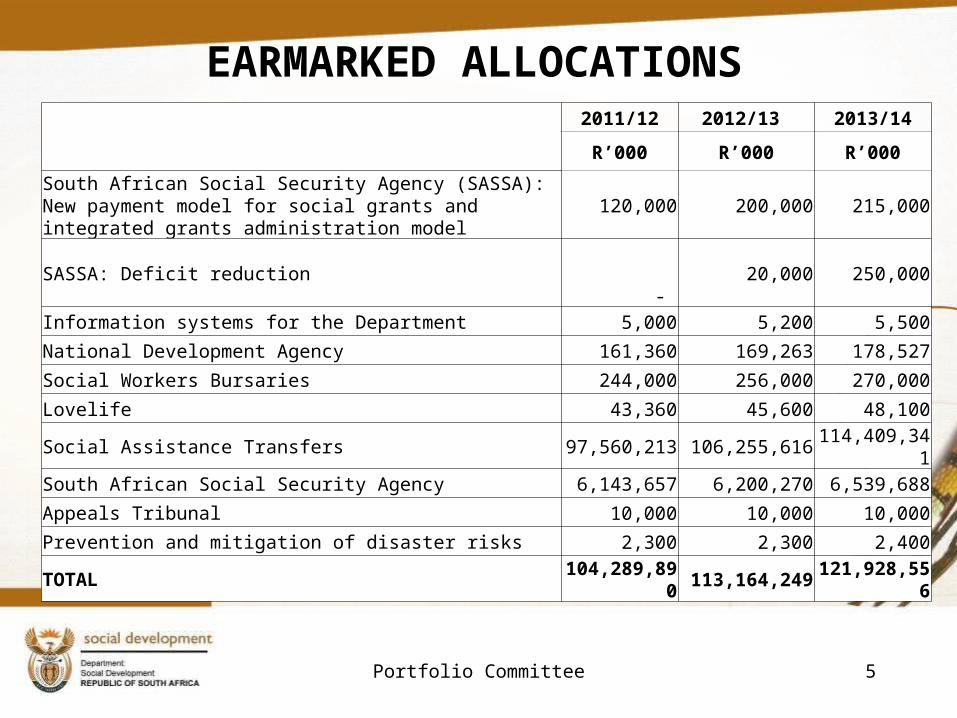
EARMARKED ALLOCATIONS
5
2011/12 2012/13 2013/14
R’000 R’000 R’000
South African Social Security Agency (SASSA): New payment model for social grants and integrated grants administration model
120,000 200,000 215,000
SASSA: Deficit reduction
- 20,000 250,000
Information systems for the Department 5,000 5,200 5,500
National Development Agency 161,360 169,263 178,527
Social Workers Bursaries 244,000 256,000 270,000
Lovelife 43,360 45,600 48,100
Social Assistance Transfers 97,560,213 106,255,616 114,409,341
South African Social Security Agency 6,143,657 6,200,270 6,539,688
Appeals Tribunal 10,000 10,000 10,000
Prevention and mitigation of disaster risks 2,300 2,300 2,400
TOTAL 104,289,890 113,164,249 121,928,556
Portfolio Committee
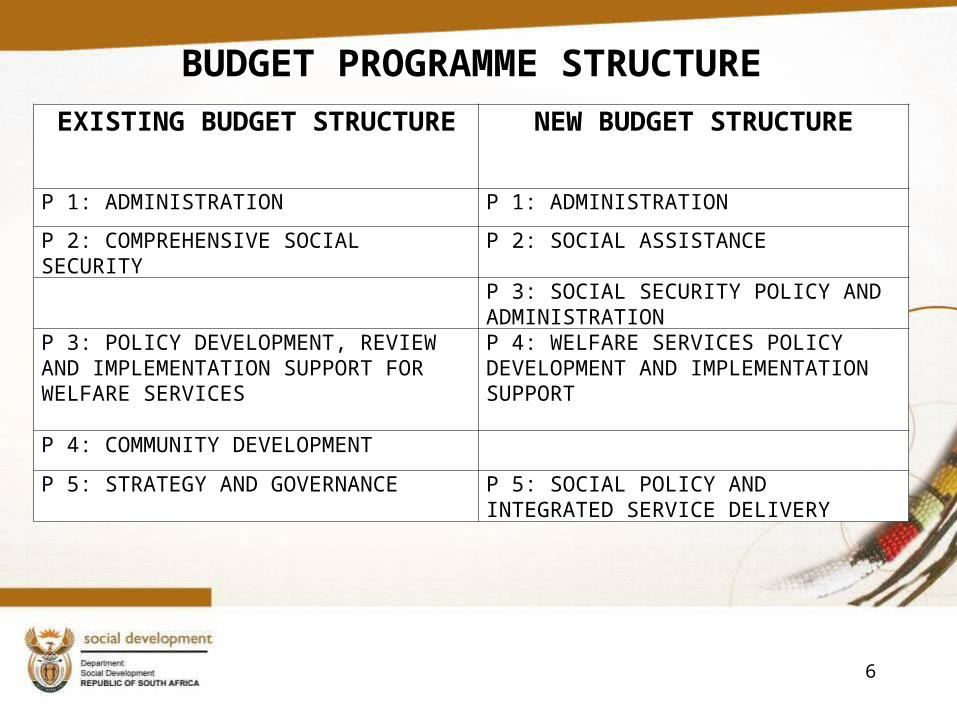
BUDGET PROGRAMME STRUCTURE
EXISTING BUDGET STRUCTURE NEW BUDGET STRUCTURE
P 1: ADMINISTRATION P 1: ADMINISTRATION
P 2: COMPREHENSIVE SOCIAL SECURITY P 2: SOCIAL ASSISTANCE
P 3: SOCIAL SECURITY POLICY AND ADMINISTRATION
P 3: POLICY DEVELOPMENT, REVIEW AND IMPLEMENTATION SUPPORT FOR WELFARE SERVICES
P 4: WELFARE SERVICES POLICY DEVELOPMENT AND IMPLEMENTATION SUPPORT
P 4: COMMUNITY DEVELOPMENT
P 5: STRATEGY AND GOVERNANCE P 5: SOCIAL POLICY AND INTEGRATED SERVICE DELIVERY
6
7
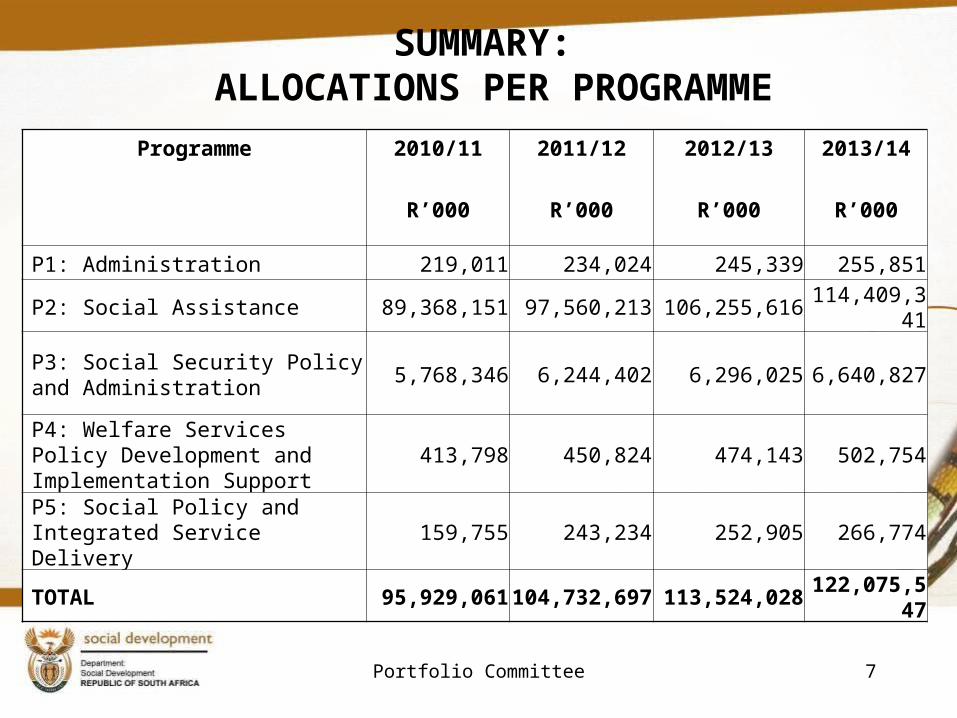
SUMMARY: ALLOCATIONS PER PROGRAMME
Programme 2010/11
R’000
2011/12
R’000
2012/13
R’000
2013/14
R’000
P1: Administration 219,011 234,024 245,339 255,851
P2: Social Assistance 89,368,151 97,560,213 106,255,616 114,409,341
P3: Social Security Policy and Administration 5,768,346 6,244,402 6,296,025 6,640,827
P4: Welfare Services Policy Development and Implementation Support
413,798 450,824 474,143 502,754
P5: Social Policy and Integrated Service Delivery 159,755 243,234 252,905 266,774
TOTAL 95,929,061 104,732,697 113,524,028 122,075,547
Portfolio Committee
8
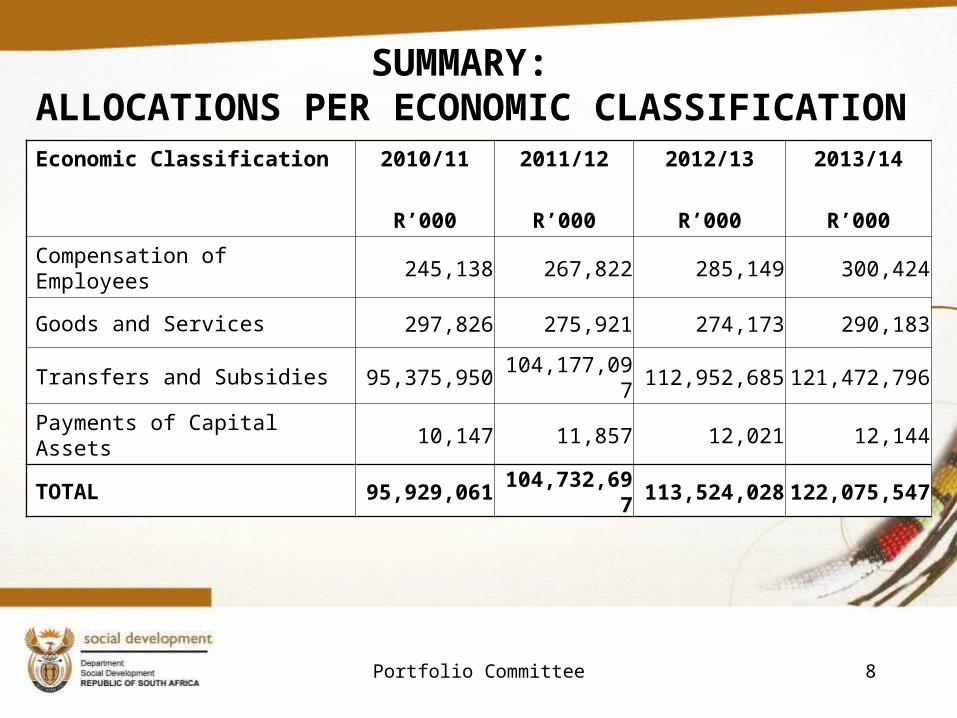
SUMMARY: ALLOCATIONS PER ECONOMIC CLASSIFICATION
Economic Classification 2010/11
R’000
2011/12
R’000
2012/13
R’000
2013/14
R’000
Compensation of Employees 245,138 267,822 285,149 300,424
Goods and Services 297,826 275,921 274,173 290,183
Transfers and Subsidies 95,375,950 104,177,097 112,952,685 121,472,796
Payments of Capital Assets 10,147 11,857 12,021 12,144
TOTAL 95,929,061 104,732,697 113,524,028 122,075,547
Portfolio Committee
9
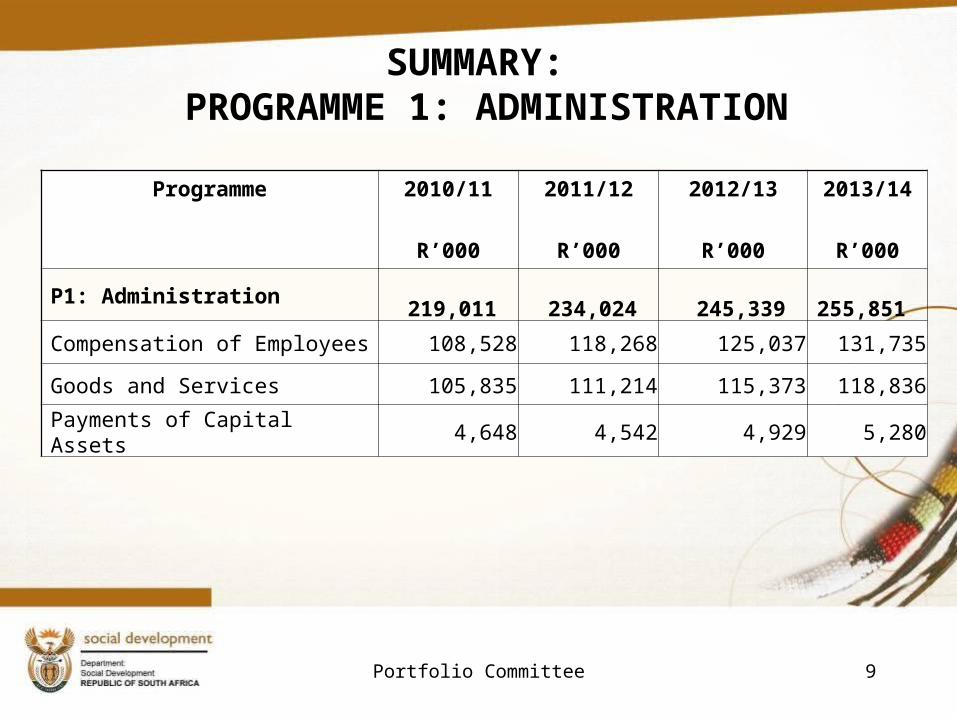
SUMMARY: PROGRAMME 1: ADMINISTRATION
Programme 2010/11
R’000
2011/12
R’000
2012/13
R’000
2013/14
R’000
P1: Administration 219,011 234,024 245,339 255,851
Compensation of Employees 108,528 118,268 125,037 131,735
Goods and Services 105,835 111,214 115,373 118,836
Payments of Capital Assets 4,648 4,542 4,929 5,280
Portfolio Committee
10
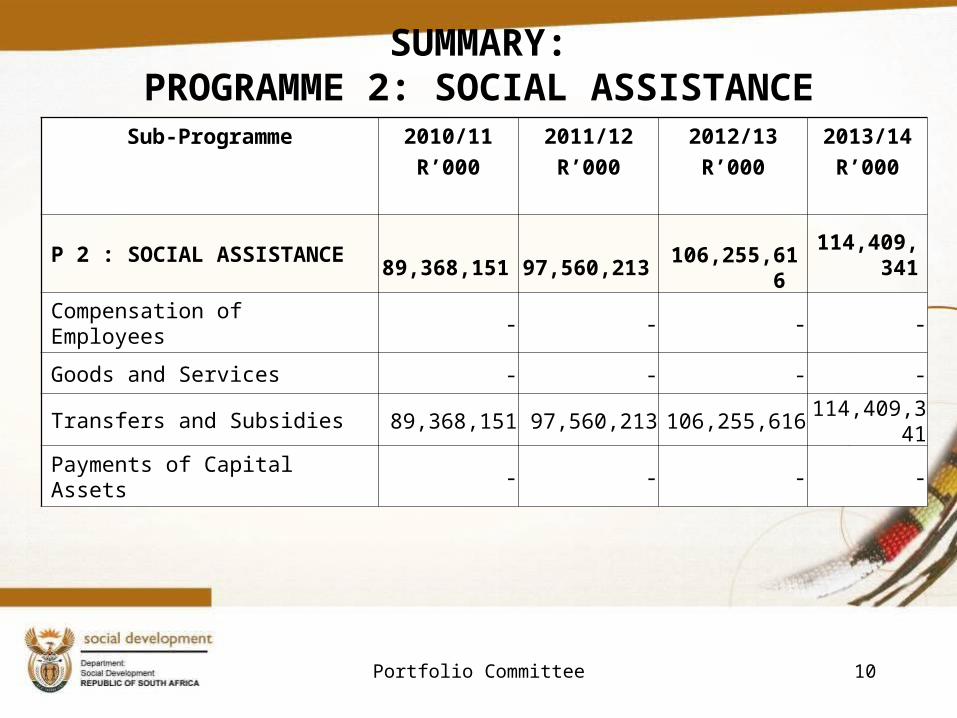
SUMMARY:PROGRAMME 2: SOCIAL ASSISTANCESub-Programme 2010/11
R’0002011/12
R’0002012/13
R’0002013/14
R’000
P 2 : SOCIAL ASSISTANCE 89,368,151 97,560,213 106,255,616 114,409,341
Compensation of Employees - - - -
Goods and Services - - - -
Transfers and Subsidies 89,368,151 97,560,213 106,255,616 114,409,341
Payments of Capital Assets - - - -
Portfolio Committee
11
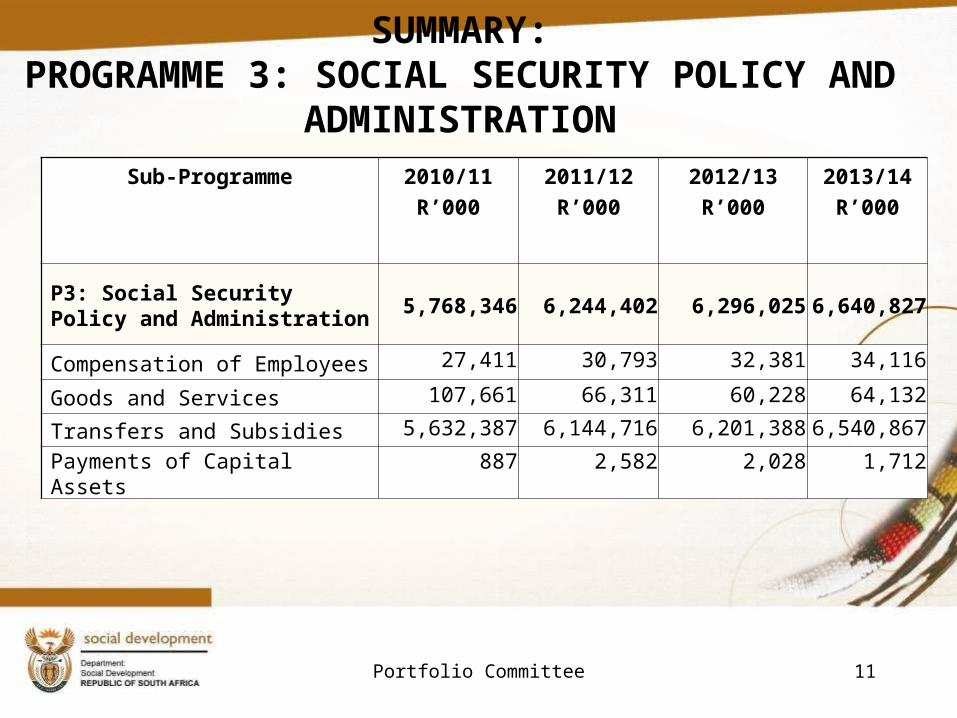
SUMMARY:PROGRAMME 3: SOCIAL SECURITY POLICY AND
ADMINISTRATIONSub-Programme 2010/11
R’0002011/12
R’0002012/13
R’0002013/14
R’000
P3: Social Security Policy and Administration 5,768,346 6,244,402 6,296,025 6,640,827
Compensation of Employees 27,411 30,793 32,381 34,116
Goods and Services 107,661 66,311 60,228 64,132
Transfers and Subsidies 5,632,387 6,144,716 6,201,388 6,540,867
Payments of Capital Assets 887 2,582 2,028 1,712
Portfolio Committee
12
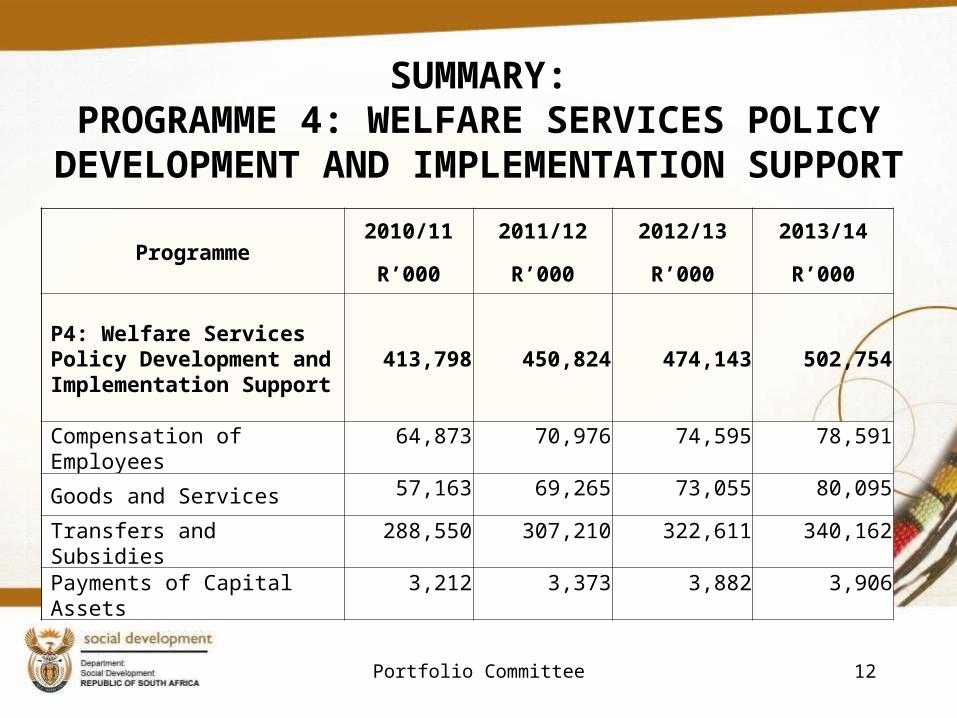
SUMMARY:PROGRAMME 4: WELFARE SERVICES POLICY
DEVELOPMENT AND IMPLEMENTATION SUPPORT
Programme2010/11 2011/12 2012/13 2013/14
R’000 R’000 R’000 R’000
P4: Welfare Services Policy Development and Implementation Support
413,798 450,824 474,143 502,754
Compensation of Employees 64,873 70,976 74,595 78,591
Goods and Services 57,163 69,265 73,055 80,095
Transfers and Subsidies 288,550 307,210 322,611 340,162
Payments of Capital Assets 3,212 3,373 3,882 3,906
Portfolio Committee
13
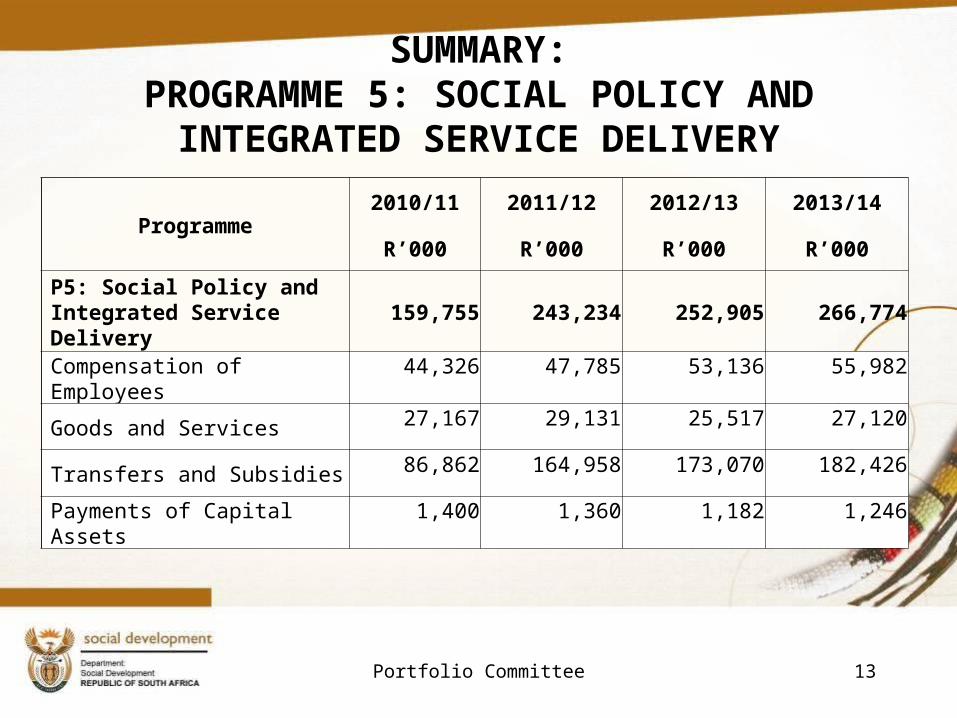
SUMMARY:PROGRAMME 5: SOCIAL POLICY AND
INTEGRATED SERVICE DELIVERY
Programme2010/11 2011/12 2012/13 2013/14
R’000 R’000 R’000 R’000
P5: Social Policy and Integrated Service Delivery 159,755 243,234 252,905 266,774
Compensation of Employees 44,326 47,785 53,136 55,982
Goods and Services 27,167 29,131 25,517 27,120
Transfers and Subsidies 86,862 164,958 173,070 182,426
Payments of Capital Assets 1,400 1,360 1,182 1,246
Portfolio Committee
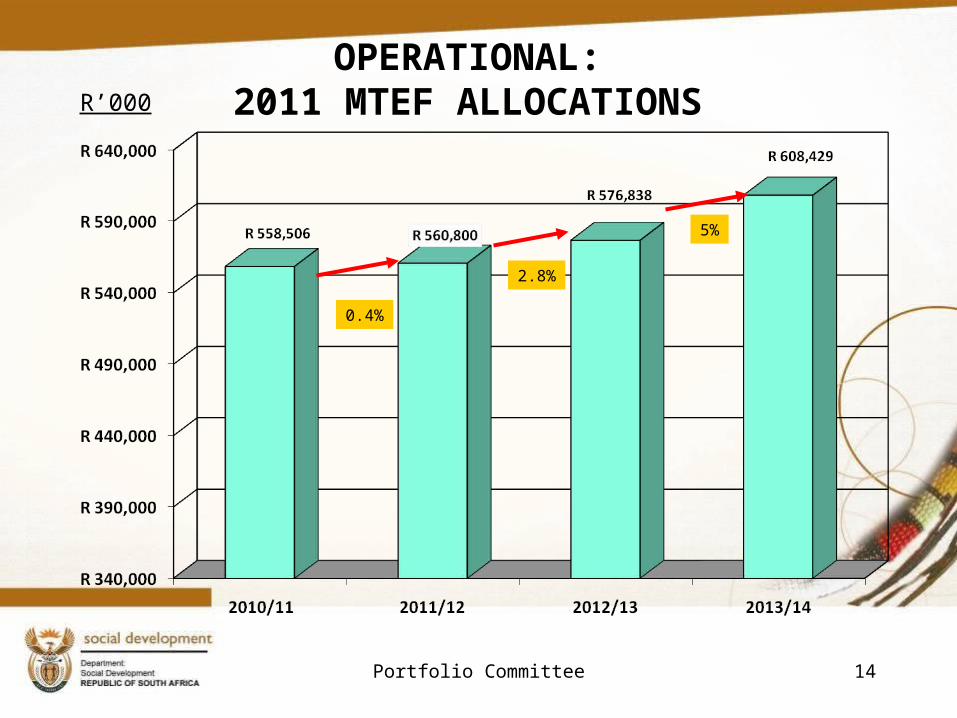
OPERATIONAL: 2011 MTEF ALLOCATIONS R’000
0.4%
2.8%
5%
14Portfolio Committee
15
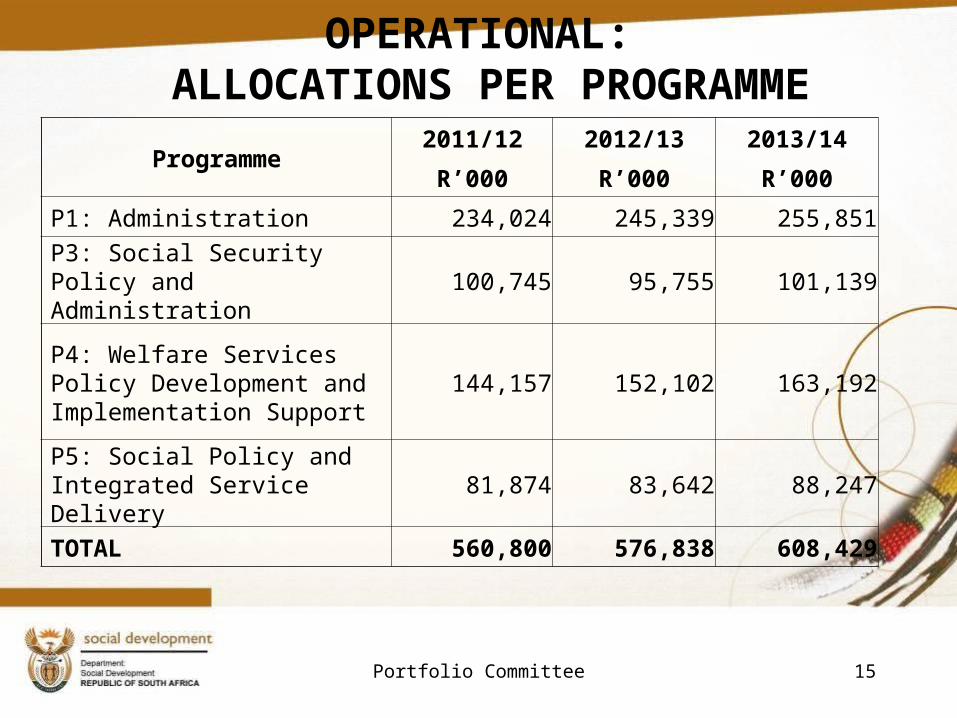
OPERATIONAL: ALLOCATIONS PER PROGRAMME
Programme2011/12 2012/13 2013/14
R’000 R’000 R’000
P1: Administration 234,024 245,339 255,851
P3: Social Security Policy and Administration 100,745 95,755 101,139
P4: Welfare Services Policy Development and Implementation Support
144,157 152,102 163,192
P5: Social Policy and Integrated Service Delivery 81,874 83,642 88,247
TOTAL 560,800 576,838 608,429
Portfolio Committee
16
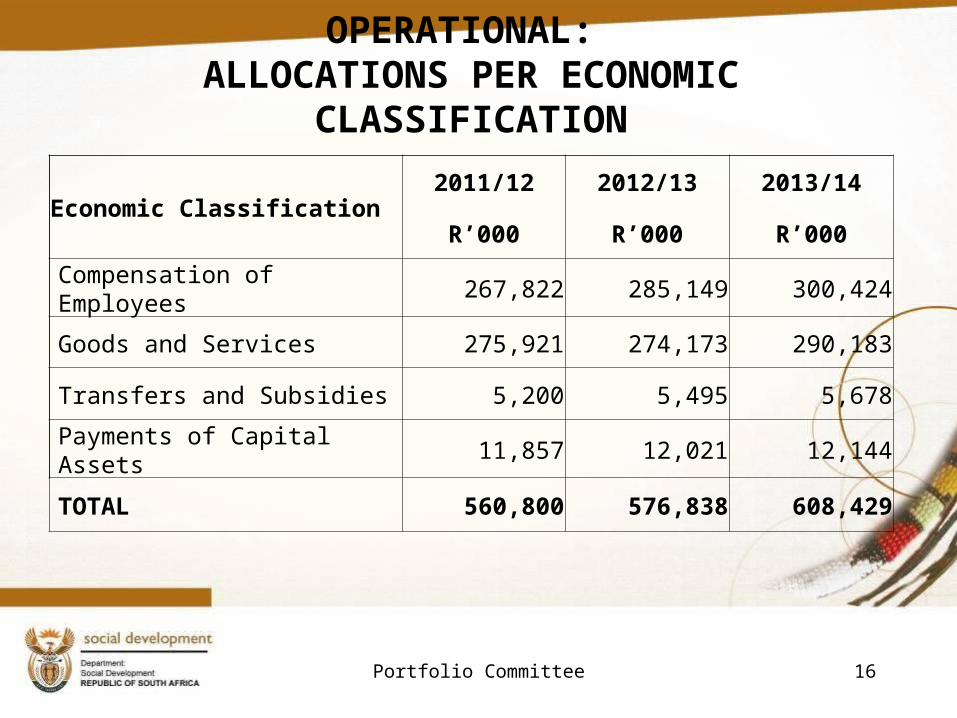
OPERATIONAL: ALLOCATIONS PER ECONOMIC
CLASSIFICATION
Economic Classification2011/12 2012/13 2013/14
R’000 R’000 R’000
Compensation of Employees 267,822 285,149 300,424
Goods and Services 275,921 274,173 290,183
Transfers and Subsidies 5,200 5,495 5,678
Payments of Capital Assets 11,857 12,021 12,144
TOTAL 560,800 576,838 608,429
Portfolio Committee
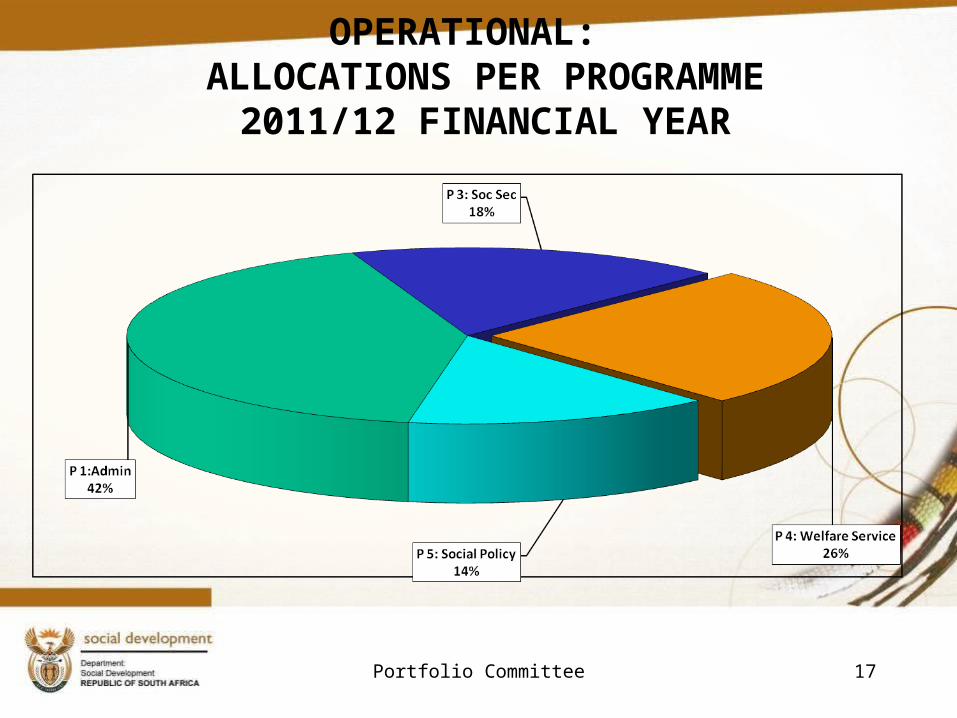
OPERATIONAL: ALLOCATIONS PER PROGRAMME
2011/12 FINANCIAL YEAR
17Portfolio Committee
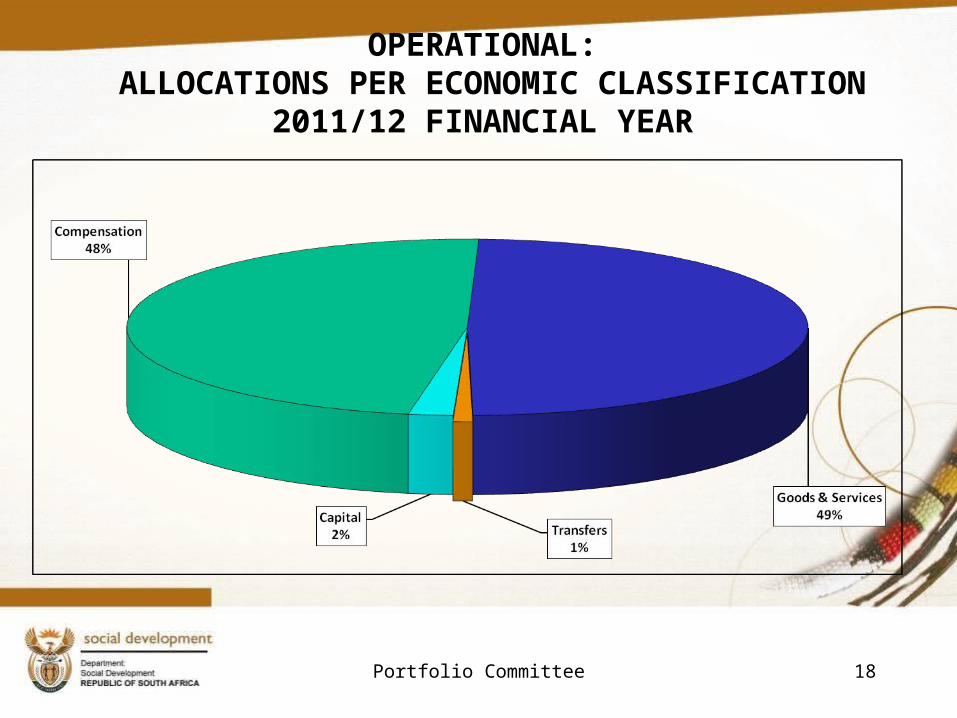
OPERATIONAL: ALLOCATIONS PER ECONOMIC CLASSIFICATION
2011/12 FINANCIAL YEAR
18Portfolio Committee
04/19/23 19April 19, 2023 19
THANK YOUTHANK YOU