107122 copper clays scoping study final · copper mines of tasmania pty ltd copper clays scoping...
TRANSCRIPT
COPPER CLAYS SCOPING STUDY
COPPER MINES OF TASMANIA PTY LTD

Level 19 114 William Street
MELBOURNE VIC 3000 AUSTRALIA
T +61 3 8601 3300 F +61 3 8601 3399
Ground Floor 9 Havelock Street
WEST PERTH WA 6005 AUSTRALIA
T +61 8 6330 1100 F +61 8 6330 1199
Level 12 179 North Quay
BRISBANE QLD 4000 AUSTRALIA
T +61 7 3839 0099 F +61 7 3839 0077
Ground Floor 4 Greenhill Road
WAYVILLE SA 5034 AUSTRALIA
T +61 8 8201 1800 F +61 8 8201 1899
Level 7, Nicholsons House Nicholsons Walk, Maidenhead
BERKSHIRE SL6 1LD UNITED KINGDOM T +44 1628 778 256 F +44 1628 638 956
Suite 1040, 609 Granville Street PO Box 10327, Pacific Centre VANCOUVER BC V7Y 1G5
CANADA T +1 604 669 0044 F +1 604 669 1120
www.amcconsultants.com.au
AMC Consultants Pty Ltd ABN 58 008 129 164
COPPER CLAYS SCOPING STUDY
COPPER MINES OF TASMANIA PTY LTD
AMC 107122 April 2008

COPPER MINES OF TASMANIA PTY LTD Copper Clays Scoping Study
AMC 107122 : April 2008 i
EXECUTIVE SUMMARY
AMC was requested by Copper Mines of Tasmania Pty Ltd (CMT) to prepare a scoping study for the King Lyell Copper Clays. The study aimed to identify whether the potential of the deposit justifies spending the money required to gather further data to proceed with a Feasibility Study process.
While the project still has a very high level of uncertainty, AMC believes there is a justification to proceed with the work required to take the project to the next level of evaluation, namely, a Pre-feasibility study.
The Copper Clays project has the potential to provide value to CMT. The analysis suggests a pre-tax NPV at an 8% discount rate (NPV8%) of around A$10M to A$20M for the base case copper price of US$6,700 /t, should prices remain at the present level of US$8,000 /t the project will generate a pre-tax NPV of A$20M to A$30M. This is based on a pit containing approximately 900,000t of ore at a grade of 1.9% Cu and a mass based strip ratio of 6:1.
Presently there is a very high level of uncertainty as there is limited geological, geotechnical and metallurgical understanding of the deposit. This would need to be addressed before the project could commence. As the geographical extent of the project is limited, the total cost of addressing these issues should not be high.
The Pre-feasibility study should address the various mining and processing options, selecting the best for final analysis and costing in a Feasibility Study that would then form a basis for the investment decision. The cost of the final Feasibility Study would depend on the results from the Pre-feasibility study and the level of surety required by CMT prior to proceeding with the project.
As part of the Feasibility Study, plans and protocols would need to be developed to manage the risk presented by the water in the Iron Blow open pit.
Taking the project to feasibility decision point is likely to take two years with a cost of approximately A$4M. This will need to be confirmed as the project progresses, particularly the cost of the feasibility study which is dependant on the outcome of the pre-feasibility study.
The first major milestone is the completion of drilling and geological interpretation and modelling. The scoping study should be revisited at that stage to confirm there is value in moving to pre-feasibility.
Risk Analysis
The major risks which will require to be addressed before a decision can be made to proceed with the project are:
• Geological Model – The geological model is based on poor quality data. Further drilling and analysis is required to bring it to a JORC Indicated or measured standard.

COPPER MINES OF TASMANIA PTY LTD Copper Clays Scoping Study
AMC 107122 : April 2008 ii
• Iron Blow Water – The water presents a danger of sudden inrush. A plan is required to remove the water and ensure the pit remains dry for the period of mining. This may require significant remedial action.
• Historic Waste Dumps and Clay Slopes – Both of these present a significant danger of collapse. The extent of the risk needs to be further evaluated through geotechnical analysis, design and operating protocols developed to minimise the danger.
• Metallurgical – There is presently limited metallurgical understanding of the mineralised zones. There is a risk that the material will need crushing to liberate the native copper or the copper may be in a form which cannot be separated by gravity. A well structured metallurgical test program will be required to address this issue.
There are a number of other waste dumping, environmental and heritage risks which need to be addressed prior to mining. While these are important they do not have the similar potential to lead to failure of the project as the issues listed above.
Geological Review
The geological review of the King Lyell Copper Clays deposit included a preliminary check of the existing geological database; preparation of a geological block model and identifying any additional geological work required to conduct a pre-feasibility study.
AMC produced two models, a conservative model and an optimistic Upside model of the copper clays. The Upside model has been used as a means of identifying further potential of the deposit, hence it has been used for the scoping study to decide if additional expense would justify gathering data to confirm this potential.
The Upside Model for the CMT Copper Clays King Lyell deposit contains 1.7 Mt to 1.9 Mt at 1.4% to 1.6% copper at a cut off grade of 0.7% copper.
These results are not classified in accordance with the Australasian Code for Reporting of Exploration Results, Mineral Resources and Ore Reserves, 2004 edition (JORC Code) due to insufficient confidence in the data on which they are based.
There are a number of factors that affect confidence in the data and hence the estimate:
• The drill hole dataset is limited to thirteen holes in the central portion of the model, the mineralised zone was extrapolated up and down dip of the known ore zone.
• No information was available on QA/QC aspects of the sample and assay data sets, and a reproducibility test failed on the 1970/71 assay data (Wills 1995).
• There is no density data available in the current drill hole database.
• Inaccurate topographic surface.
• Lack of recovery and void data.
To bring the estimation to a standard where it can be classified under the JORC code, an infill drilling programme is required. The drilling would be located mainly in the

COPPER MINES OF TASMANIA PTY LTD Copper Clays Scoping Study
AMC 107122 : April 2008 iii
western extent of the area, requiring a minimum of sixteen cased diamond drill holes on a 50m X 50m grid enabling the validation of the geological interpretation. All mineralisation should be sampled using coring to ensure good recoveries and enable geotechnical evaluations.
Consistent geological logging of future holes will alleviate discrepancies found in the current database. This will enable a good understanding of the geology and mineralisation allowing the construction of geological wireframes that will provide greater confidence in defining the mineralisation.
It is recommended that bulk density tests be carried out on samples from any future drilling. This is particularly important as there may be considerable variability in bulk density depending on the copper grade. There may also be a large variability of bulk density between the ore zone and waste.
In summary, to upgrade the mineral resource and to validate the existing work any future drilling should include but not be restricted to:
• Geological and geotechnical logging.
• Collection of samples for assay sample submission.
• Collection of samples for and calculation of bulk density measurements.
• The inclusion of checks, blanks and standards to provide industry standard QA/QC data.
• Measurement of recovery of core with particular emphasis on the mineralised zone.
• Establishment of the location of existing voids for previous workings in relation to existing and new drilling.
• Validation of new data against existing data to increase confidence in the drill hole database.
Geotechnical
The geotechnical assessment of the King Lyell Copper Clays deposit included a review of data available, assessment of the geotechnical materials for design parameters based on the data available, and recommendations for further investigation and analysis.
The conclusions from the assessment were:
• The six lithologies in the project area can be grouped into three sets of distinguishable geotechnical engineering materials. Each of these materials is expected to differ in behaviour when exposed.
• The inter-ramp slope angles that should be used in preliminary pit design are:
- 25º to 30º for Material 1, the clays.
- 35º to 40º for Material 2, the Pioneer Sandstone, the Gordon Limestone and the Gordon Shale.

COPPER MINES OF TASMANIA PTY LTD Copper Clays Scoping Study
AMC 107122 : April 2008 iv
- 48º for Material 3, the Owen Conglomerate.
• Based on the interpreted projection of the lithology expected to daylight in the pit, the pit may be zoned into three, with the NE and upper NW walls at an inter-ramp angle of 40º to 48º, the mid section of the E wall at an inter-ramp angle of 35º to 40º and the SE, SW and lower NW walls at an inter-ramp angle of 25º to 30º.
• The Number five Tunnel, the 323m adit and the Batchelor shaft will be intersected during excavation. Without prior dewatering, disturbing the number five tunnel would cause water inflow into the pit and potential pit slope instability. The impacts of intersecting the other two old workings are difficult to predict because little is known about their current condition.
• The general working equipment suitable for use in this material would be a bulldozer to rip where required and an excavator for loading the material.
• Old Iron Blow dumps may have to be removed entirely due to the cohesionless nature of the loose aggregate, which would otherwise leave the material difficult to stabilise and hazardous for operations.
• In light of the limited geotechnical data available, a thorough geotechnical drilling and laboratory testing programme will be required to advance this project to the standard required for pre-feasibility and feasibility studies. Benefits realised will be in the increased accuracy of optimum design parameters and reduce expenditure during the future studies.
• It is recommended that five to six orientated, HQ triple tube geotechnical holes are drilled and logged geotechnically and structurally. A testing programme should include shear and triaxial strength testing, UCS and tensile strength testing, particle size distribution analysis, Atterberg Limits testing and mineralogical identification. Geo-hydrological testing must be included in the programme.
Metallurgical Assessment
This analysis is based on limited metallurgical data, an inspection of the site, examination of a limited number of samples and discussions with CMT personnel. It has necessarily included an assessment of the potential process response of Copper Clays ore. This is yet to be confirmed by specific metallurgical test work. Hence all the conclusions regarding process routes, recoveries, concentrate grade and costs need confirmation by test work and further analysis.
The analysis identified gravity separation as the process method with the best potential.
Operating and capital costs were generated based on a process route with:
• Grizzly and Jaw crusher.
• Surge bin.
• Trommel scrubber.
• Screens and cyclones.
• In-line pressure jigs.

COPPER MINES OF TASMANIA PTY LTD Copper Clays Scoping Study
AMC 107122 : April 2008 v
It is estimated this process would recover 65% of the contained copper. The estimated capital and operating cost are shown in Table 1.
Table 1 Processing Operating and Capital Cost
Annual Throughput (ktpa) Cost Item 250 500 Capital Cost All new equipment (MA$) 8.00 13.00 Refurbished second-hand equipment (MA$) 6.00 9.50 Operating Cost (A$/t) 10.00 7.50
Mining Options and Cost The proposed mining fleet consists of:
• One 80t Excavator.
• Four 40t articulated six wheel drive trucks.
• One 40t tracked dozer.
• One 12t Motor grader.
Six wheel drive articulated trucks will allow operations to continue in the wet conditions regularly seen at Queenstown, which would make the site clays un-trafficable for rigid body trucks.
Due to the potential difficulties operating on narrow benches above 2,330 mRl, in the area of the existing waste dumps, an additional dozer has been assumed and mining rates reduced by 20% above 2,330 mRl.
The estimated operating cost is:
• Mining.
- Above 2,330 mRl – A$5.00 /t of rock.
- Below 2,330 mRl – A$3.50 /t of rock.
• Grade control – A$1.00 /t ore.
Capital cost is estimated at A$1,750k. This includes de-watering the Iron Blow and treating the water prior to release into the environment. Other items included are shown in Table 2.

COPPER MINES OF TASMANIA PTY LTD Copper Clays Scoping Study
AMC 107122 : April 2008 vi
Table 2 Mining Capital Cost
Item Cost (k$) Site Access Road 25 Vehicle Washdown 25 Contractor Mobilisation 50 Workshop 50 Hardstand 50 Office and Crib Room 50 Item Cost (k$) Dewatering 100 Power Reticulation 50 IT and Coms 20 Security and Safety 50 Water Reticulation 50 Sediment Traps 25 Fuel Storage 50 Contingency (30%) 179 TOTAL 774
LG Optimisation
Lersch-Grossman Optimisation (LG) is a process used to identify the optimal limit of an open pit. The process considers the potential revenue generated from a block of material, the cost of mining the block material and the cost of mining the blocks above for access. The blocks which must be mined to access an ore block are selected based on overall slope angle including batters, berms and ramps. If the result of the net revenue of the cost is positive, the increment, including the ore block and those which must be mined to access it, are added to the shell. The process considers deeper and deeper material until the increment does not add value. This is considered the optimal limit under the financial scenario being tested. The process is run iteratively with increasing commodity prices to generate a suite of shells increasing in size which can be evaluated under a range of financial scenarios. This analysis provides an understanding of the potential return from a shell and the financial risks associated with selecting a particular shell as the basis of design work if the inputs are different to those forecast.
LG analysis identified potential for a pit with approximately 900,000t to 1,000,000t of mill feed at a grade of 1.9% Cu with a strip ratio of around 6.0 t:t. This would provide between 10,000t and 11,000t of recovered Cu. A pit this size is close to optimal for copper prices of between US$5,000 /t and US$8,000 /t.
Figure 1 shows how the operating surplus for commodity prices above US$5,000 /t grows up to shells containing between 900 kt and 1,000 kt of mill feed. Above this the surplus starts to drop, then falls dramatically when the shells jump in size from 1,100 kt of mill feed to more than 1,500 kt. For the very low sensitivity case none of the shells generates a positive discounted surplus.
COPPER MINES OF TASMANIA PTY LTD Copper Clays Scoping Study
AMC 107122 : April 2008 vii
Figure 1 LG Optimisation and Pit Total Mill Feed vs. Operating Cash Surplus and Strip Ratio
(20.0)
(10.0)
-
10.0
20.0
30.0
40.0
- 500.0 1,000.0 1,500.0 2,000.0 2,500.0Mill Feed (kt)
Ope
ratin
g Su
rplu
s (M
A$)
-
2.0
4.0
6.0
8.0
10.0
12.0
Surplus @ $2,000/t Cu Surplus @ $5,000/t Cu Surplus @ $6,700/t CuSurplus @ $8,000/t Cu Pit Surplus @$6,700/t Pit Strip RatioStrip Ratio
Mine Design and Scheduling
At a cut off grade (COG) of 0.5% copper the conceptual design contains 6.4 million tonnes of rock, of which 950,000t is mill feed at a grade of 1.8% Cu containing 16,600t of copper and providing 10,800t of recovered copper. This gives a strip ratio of 5.9:1.
The conceptual pit design has contents which very closely replicate the LG optimisation results. This validates the optimisation as a good estimate of the potential mill feed quantity, head grade and strip ratio, when operational and access constraints are applied.
The schedule highlights the need for a twelve month pre-stripping period followed by approximately four years of treatment giving a project life of five years.
The contents of the pit are shown in Table 3 and the schedule in Table 4.

COPPER MINES OF TASMANIA PTY LTD Copper Clays Scoping Study
AMC 107122 : April 2008 viii
Table 3 Conceptual Design Contents Level Rock Mill Feed mRl kt kt % Cu t Cu t Cu Rec
2,390 0 - - - - 2,385 14 - - - - 2,380 59 - - - - 2,375 125 - - - - 2,370 93 - - - - 2,365 176 - - - - 2,360 132 - - - - 2,355 249 - - - - 2,350 143 0 0.8% 2 2 2,345 239 5 1.3% 62 40 2,340 238 10 1.3% 132 86 2,335 403 18 1.2% 221 144 2,330 219 13 1.1% 150 98 2,325 436 20 1.1% 224 146 2,320 230 20 1.4% 283 184 2,315 559 55 1.6% 870 565 2,310 208 43 1.8% 779 507 2,305 753 103 1.9% 2,001 1,301 2,300 203 54 1.5% 836 544 2,295 645 101 2.0% 2,007 1,305 2,290 140 57 2.7% 1,512 983 2,285 434 90 1.8% 1,597 1,038 2,280 84 40 2.2% 866 563 2,275 272 94 1.4% 1,275 829 2,270 96 58 1.6% 936 609 2,265 122 66 1.4% 915 595 2,260 49 36 1.5% 552 359 2,255 65 52 2.3% 1,187 771 2,250 16 13 1.7% 221 144 Total 6,403 948 1.8% 16,631 10,810
COPPER MINES OF TASMANIA PTY LTD Copper Clays Scoping Study
AMC 107122 : April 2008 ix
Table 4 Schedule
Period TOTAL Y1H1 Y1H2 Y2H1 Y2H2 Y3H1 Y3H2 Y4H1 Y4H2 Y5H1 Y5H2 Y6H1
PhysicalsMining
Total Movements kt 6,402.8 750.0 1,500.0 1,500.0 750.0 750.0 750.0 402.8 - - - -Ore Mined
Tonnes kt 947.7 - 53.5 161.9 129.3 148.4 210.3 244.3 - - - -Grade % 1.8% - 1.2% 1.7% 1.8% 2.2% 1.7% 1.7% - - - -Metal t 16,631 - 650 2,674 2,299 3,295 3,645 4,069 - - - -
ROM StocksTonnes kt - - 36.9 41.2 64.6 149.9 269.2 144.2 19.2 - -Grade % - - 1.7% 1.8% 2.2% 1.7% 1.7% 1.7% 1.7% - -Metal t - - 610 733 1,435 2,598 4,500 2,411 321 - -
Mill FeedTonnes kt 947.7 - 53.5 125.0 125.0 125.0 125.0 125.0 125.0 125.0 19.2 -Grade % 1.8% - 1.2% 1.7% 1.7% 2.1% 2.0% 1.7% 1.7% 1.7% 1.7% -Metal t 16,631 - 650 2,065 2,176 2,593 2,481 2,167 2,090 2,090 321 -
Mill ProductionConcentrate t 24,023 - 939 2,982 3,143 3,745 3,584 3,130 3,018 3,018 464 -Grade % 45.0% - 45.0% 45.0% 45.0% 45.0% 45.0% 45.0% 45.0% 45.0% 45.0% -Metal t 10,810 - 423 1,342 1,414 1,685 1,613 1,408 1,358 1,358 209 -
Financial Analysis
The project produces a positive NPV8% for copper prices greater than US$5,000 /t but has a negative NPV8% for the low sensitivity case of US$2,000 /t. The base case has an operating margin of around 50% of revenue. While this is a good margin the short project life, three and a half years of full plant production, keeps the base case NPV8% low at ~A$18M. This does offer an opportunity should more mill feed be identified to extend the mine life and increase the NPV8%.
The cashflow schedule is shown in Table 5.

COPPER MINES OF TASMANIA PTY LTD Copper Clays Scoping Study
AMC 107122 : April 2008 x
Table 5 Cashflow Schedule
Period TOTAL Y1H1 Y1H2 Y2H1 Y2H2 Y3H1 Y3H2 Y4H1 Y4H2 Y5H1 Y5H2 Y6H1
RevenueGross Revenue (On Payable Metal)
US$8,000/t Cu MUS$ 83.5 - 3.3 10.4 10.9 13.0 12.5 10.9 10.5 10.5 1.6 -US$6,700/t Cu MUS$ 70.0 - 2.7 8.7 9.2 10.9 10.4 9.1 8.8 8.8 1.4 -US$5,000/t Cu MUS$ 52.2 - 2.0 6.5 6.8 8.1 7.8 6.8 6.6 6.6 1.0 -US$2,000/t Cu MUS$ 20.9 - 0.8 2.6 2.7 3.3 3.1 2.7 2.6 2.6 0.4 -
Realisation CostsTreatment Cost MUS$ 1.1 - 0.0 0.1 0.1 0.2 0.2 0.1 0.1 0.1 0.0 -Refining Charge MUS$ 1.1 - 0.0 0.1 0.1 0.2 0.2 0.1 0.1 0.1 0.0 -Transport MUS$ 3.6 - 0.1 0.4 0.5 0.6 0.5 0.5 0.5 0.5 0.1 -TOTAL MUS$ 5.8 - 0.2 0.7 0.8 0.9 0.9 0.7 0.7 0.7 0.1 -
Exchange Rate 0.86 0.86 0.86 0.86 0.86 0.86 0.86 0.86 0.86 0.86 0.86
Net RevenueUS$8,000/t Cu MA$ 90.4 - 3.5 11.2 11.8 14.1 13.5 11.8 11.4 11.4 1.7 -US$6,700/t Cu MA$ 74.7 - 2.9 9.3 9.8 11.6 11.1 9.7 9.4 9.4 1.4 -US$5,000/t Cu MA$ 54.0 - 2.1 6.7 7.1 8.4 8.1 7.0 6.8 6.8 1.0 -US$2,000/t Cu MA$ 17.6 - 0.7 2.2 2.3 2.7 2.6 2.3 2.2 2.2 0.3 -
CostsRoyalty (5.00% of Net Revenue)
US$8,000/t Cu MA$ - 0.2 0.6 0.6 0.7 0.7 0.6 0.6 0.6 0.1 -US$6,700/t Cu MA$ - 0.1 0.5 0.5 0.6 0.6 0.5 0.5 0.5 0.1 -US$5,000/t Cu MA$ - 0.1 0.3 0.4 0.4 0.4 0.4 0.3 0.3 0.1 -US$2,000/t Cu MA$ - 0.0 0.1 0.1 0.1 0.1 0.1 0.1 0.1 0.0 -
OperatingMining MA$ 25.5 3.8 7.3 5.3 2.6 2.6 2.6 1.4 - - - -Grade Control MA$ 0.9 - 0.1 0.2 0.1 0.1 0.2 0.2 - - - -Treatment MA$ 9.5 - 0.5 1.3 1.3 1.3 1.3 1.3 1.3 1.3 0.2 -Admin MA$ 0.9 - 0.1 0.1 0.1 0.1 0.1 0.1 0.1 0.1 0.0 -TOTAL MA$ 36.9 3.8 7.9 6.8 4.1 4.1 4.2 3.0 1.4 1.4 0.2 -
CapitalMining MA$ 1.8 1.8Plant MA$ 6.0 2.0 2.0 2.0TOTAL MA$ 7.8 3.8 2.0 2.0 - - - - - - - -
Re-habilitationMining MA$ 0.8 0.8Plant MA$ (1.5) (1.5)TOTAL MA$ (0.8) - - - - - - - - - - (0.8)
CashflowUndiscounted
US$8,000/t Cu MA$ (7.5) (6.5) 1.9 7.1 9.2 8.6 8.2 9.4 9.4 1.4 0.8US$6,700/t Cu MA$ (7.5) (7.1) 0.0 5.1 6.9 6.4 6.2 7.5 7.5 1.2 0.8US$5,000/t Cu MA$ (7.5) (7.9) (2.4) 2.6 3.9 3.4 3.7 5.1 5.1 0.8 0.8US$2,000/t Cu MA$ (7.5) (9.3) (6.7) (1.9) (1.5) (1.7) (0.9) 0.7 0.7 0.1 0.8
DiscountedUS$8,000/t Cu MA$ (7.2) (6.1) 1.7 6.1 7.6 6.8 6.2 6.9 6.7 1.0 0.5US$6,700/t Cu MA$ (7.2) (6.6) 0.0 4.4 5.7 5.1 4.7 5.5 5.3 0.8 0.5US$5,000/t Cu MA$ (7.2) (7.3) (2.2) 2.2 3.2 2.7 2.8 3.7 3.6 0.5 0.5US$2,000/t Cu MA$ (7.2) (8.6) (6.0) (1.7) (1.3) (1.4) (0.7) 0.5 0.5 0.1 0.5
NPV 8%
US$8,000/t Cu MA$ 30.3US$6,700/t Cu MA$ 18.3US$5,000/t Cu MA$ 2.6US$2,000/t Cu MA$ (25.1)
COPPER MINES OF TASMANIA PTY LTD Copper Clays Scoping Study
AMC 107122 : April 2008 xi
QUALITY CONTROL
The signing of this statement confirms this report has been prepared and checked in accordance with the AMC Peer Review Process. AMC’s Peer Review Policy can be viewed at www.amcconsultants.com.au.
Project Manager
James Stoddart
1 April 2008
Signed Date
Peer Reviewer
Peter McCarthy 1 April 2008 Signed Date
IMPORTANT INFORMATION ABOUT THIS REPORT Confidentiality This document and its contents are confidential and may not be disclosed, copied, quoted or published unless AMC Consultants Pty Ltd (“AMC”) has given its prior written consent. AMC accepts no liability for any loss or damage arising as a result of any person other than the named client acting in reliance on any information, opinion or advice contained in this document. This document may not be relied upon by any person other than the client, its officers and employees. Information AMC accepts no liability and gives no warranty as to the accuracy or completeness of information provided to it by or on behalf of the client or its representatives and takes no account of matters that existed when the document was transmitted to the client but which were not known to AMC until subsequently. Currency This document supersedes any prior documents (whether interim or otherwise)
dealing with any matter that is the subject of this document. Recommendations AMC accepts no liability for any matters arising if any recommendations contained in this document are not carried out, or are partially carried out, without further advice being obtained from AMC. Outstanding Fees No person (including the client) is entitled to use or rely on this document and its contents at any time if any fees (or reimbursement of expenses) due to AMC by its client are outstanding. In those circumstances, AMC may require the return of all copies of this document. JORC Requirements If a Client wishes to publish a mineral resource or ore reserve estimate prepared by AMC, it must first obtain the Competent Person’s written consent, not only to the estimate being published but also to the form and context of the published statement. The published statement must include a statement that the Competent Person’s written consent has been obtained.

COPPER MINES OF TASMANIA PTY LTD Copper Clays Scoping Study
AMC 107122 : April 2008 xii
CONTENTS
EXECUTIVE SUMMARY
1 INTRODUCTION ................................................................................................... 1 1.1 Location and History..................................................................................... 1 1.2 Copper Clays Deposits................................................................................. 1 1.3 Weather........................................................................................................ 1 1.4 Site Conditions ............................................................................................. 3
2 GEOLOGICAL REVIEW........................................................................................ 5 2.1 Introduction................................................................................................... 5 2.2 Geology ........................................................................................................ 6 2.3 Data Provided............................................................................................... 6 2.4 Work Undertaken ......................................................................................... 7 2.5 Data Validation ............................................................................................. 7 2.6 Geological Interpretation .............................................................................. 8 2.7 Statistical Evaluation of Drill Hole Data ........................................................ 9
2.7.1 Compositing.................................................................................. 10 2.8 Mineral Resource Estimation ..................................................................... 11
2.8.1 Block Model Parameters .............................................................. 11 2.8.2 Resource Estimation .................................................................... 12 2.8.3 Bulk Density.................................................................................. 12
2.9 Results ....................................................................................................... 13 2.9.1 Upside Model Contents ................................................................ 13
3 GEOTECHNICAL ASSESSMENT....................................................................... 15 3.1 Data Review and Assessment ................................................................... 16 3.2 Site Conditions ........................................................................................... 16
3.2.1 Local Geotechnical – Geological Units......................................... 16 3.2.2 Geological Structures ................................................................... 18 3.2.3 Old Development and Workings................................................... 19
3.3 Geotechnical Assessment.......................................................................... 20 3.4 Geotechnical Parameters for Pit Design .................................................... 22 3.5 Recommendations ..................................................................................... 23
3.5.1 Drilling........................................................................................... 24 3.5.2 Laboratory and Field Testing........................................................ 25
4 METALLURGICAL ASSESSMENT ..................................................................... 26 4.1 Historical Background ................................................................................ 26 4.2 Mineralogical Assessment.......................................................................... 27 4.3 Metallurgical Test Work.............................................................................. 28 4.4 Conceptual Process Design ....................................................................... 29 4.5 Capital and Operating Cost Estimation ...................................................... 31 4.6 Metallurgical Test work Requirements ....................................................... 31 4.7 Tailings and Waste Disposal ...................................................................... 32
5 MINING OPTIONS AND MINING COSTS........................................................... 33 5.1 Mining Method and Equipment................................................................... 33 5.2 Mining Costs............................................................................................... 36
5.2.1 Operating Cost ............................................................................. 36

COPPER MINES OF TASMANIA PTY LTD Copper Clays Scoping Study
AMC 107122 : April 2008 xiii
5.2.2 Capital Cost .................................................................................. 37 5.3.3 Site Rehabilitation Cost ................................................................ 37
5.3 Dilution and Mining Recovery..................................................................... 38 6 LG OPTIMISATION ............................................................................................. 39
6.1 LG Inputs and Cut off Grades .................................................................... 39 6.2 LG Slope Parameters................................................................................. 40 6.3 LG Optimisation Results............................................................................. 41
7 CONCEPTUAL OPEN PIT DESIGN, WASTE DUMPS AND SCHEDULING...... 44 7.1 Design Parameters..................................................................................... 44 7.2 Conceptual Pit Design................................................................................ 44 7.3 Conceptual Design Contents...................................................................... 47 7.4 Waste Disposal .......................................................................................... 50 7.5 Schedule .................................................................................................... 51
8 FINANCIAL ANALYSIS ....................................................................................... 54 9 PROJECT DEVELOPMENT SCHEDULE AND COST........................................ 58 10 RISK ANALYSIS.................................................................................................. 59
10.1 Geological Model........................................................................................ 59 10.2 Iron Blow Water.......................................................................................... 60 10.3 Historic Waste Dumps................................................................................ 60 10.4 Clays in Slopes........................................................................................... 61 10.5 Metallurgical ............................................................................................... 61 10.6 Waste Dumps............................................................................................. 62 10.7 Environmental and Heritage....................................................................... 62
11 CONCLUSIONS AND RECOMMENDATIONS.................................................... 63 12 REFERENCES .................................................................................................... 64
TABLES Table 2.1 Raw Drill Hole Data Statistics for the Copper Mineralised Zone .................. 9 Table 2.2 Composited 1m Drill Hole Statistics for the Copper Mineralised Zone....... 10 Table 2.3 Block Model Parameters ............................................................................ 12 Table 2.4 Search and Estimation Parameters............................................................ 12 Table 2.5 Global Tonnes within Copper Mineralised Zones....................................... 13 Table 2.6 CMT Copper Clays King Lyell Upside Model ............................................. 13 Table 3.1 Descriptions of the Major Geotechnical – Geological Units ....................... 17 Table 3.2 Preliminary Inter-ramp Design Angles........................................................ 22 Table 4.1 Processing Operating and Capital Cost ..................................................... 26 Table 4.2 Processing Operating and Capital Cost ..................................................... 31 Table 5.1 Haulage Productivity .................................................................................. 35 Table 5.2 Hourly Equipment Operating Cost.............................................................. 36

COPPER MINES OF TASMANIA PTY LTD Copper Clays Scoping Study
AMC 107122 : April 2008 xiv
Table 5.3 Capital Cost................................................................................................ 37 Table 6.1 LG Optimisation Parameters ...................................................................... 39 Table 6.2 Cut off Grade.............................................................................................. 40 Table 7.1 Conceptual Design Contents...................................................................... 48 Table 7.2 Schedule .................................................................................................... 53 Table 8.1 Physical and Financial Parameters ............................................................ 54 Table 8.2 Cashflow Schedule..................................................................................... 55
FIGURES
Figure 1.1 Average Monthly Rainfall for Queenstown ................................................... 2 Figure 1.2 Average Number of Days per Month with Greater than 1 mm of Rain for
Queenstown ................................................................................................. 3 Figure 1.3 King Lyell Copper Clays Site Photo ............................................................. 4 Figure 1.4 Iron Blow Open Pit Photo ............................................................................. 4 Figure 2.1 Location of Drill Holes King Lyell Deposit..................................................... 8 Figure 2.2 Log Probability Plot of Raw Cu % ................................................................ 9 Figure 2.3 Log Histogram Plot of Raw Cu %............................................................... 10 Figure 2.4 Log Probability Plot of 1m Composited Cu % ............................................ 11 Figure 2.5 Log Histogram Plot of 1m Composited Cu %............................................. 11 Figure 3.1 A. Mineralised Clay, in a Gully Above the Copper Clay Deposit. B. Gordon
Limestone Outcrop at the Site of the Copper Clay Deposit........................ 18 Figure 3.2 Structures and Old Development Around the King Lyell Deposit ............... 19 Figure 3.3 Photograph of the Iron Blow Dumps, Looking South West Down a Gully,
Above the Copper Clays Deposit ............................................................... 20 Figure 3.4 Interpreted Projection of the Lithology’s Exposed in the Preliminary Pit
Design ........................................................................................................ 22 Figure 3.5 Suggested Geotechnical Drill Dole Design ................................................ 24 Figure 5.1 Loading Rate vs. Bucket Size – AMC Benchmarking Database ................ 34 Figure 5.2 Truck Cycle Times vs. Haul Distance – AMC Benchmarking Database .... 35 Figure 6.1 LG Optimisation Total Pit Contents vs. Recovered Copper ....................... 41 Figure 6.2 LG Optimisation Total Mill Feed vs. Operating Cash Surplus .................... 42 Figure 7.1 Conceptual Pit Design................................................................................ 45 Figure 7.2 Conceptual Pit and Topography 2,340 mRl ............................................... 46 Figure 7.3 Conceptual Pit and Topography 2,375 mRl ............................................... 47
COPPER MINES OF TASMANIA PTY LTD Copper Clays Scoping Study
AMC 107122 : April 2008 xv
Figure 7.4 LG Optimisation and Mill Feed vs. Recovered Copper .............................. 49 Figure 7.5 LG Optimisation and Pit Total Mill Feed vs. Operating Cash Surplus and
Strip Ratio................................................................................................... 49 Figure 7.6 Isometric View of Conceptual Pit and Waste Dumps ................................. 50 Figure 7.7 Schedule – Waste and Mill Feed Mining .................................................... 51 Figure 7.8 Schedule – Mill Feed Treatment and ROM Stocks .................................... 52 Figure 8.1 Cumulative Cashflow.................................................................................. 56 Figure 8.2 Operating Cost Sensitivity .......................................................................... 57
APPENDICES
APPENDIX A AMC PRE-SCOPING REPORT APPENDIX B PREVIOUS STUDIES APPENDIX C DRILL HOLES PROVIDED APPENDIX D PLOTS OF WIREFRAMES APPENDIX E HOLES USED IN ESTIMATING TONNES AND GRADE APPENDIX F COMPARISON OF MODEL CONTENTS APPENDIX G UPSIDE MODEL SECTIONS APPENDIX H COPPER CLAY CORE PHOTOGRAPHS
Distribution list: 2 copies to Mr Scott Clyde, Copper Mines of Tasmania 1 copies to Mr Praveen Sharma, Copper Mines of Tasmania site 1 copies to Mr Andy Tunstall, Copper Mines of Tasmania site 1 copy to AMC Melbourne office

COPPER MINES OF TASMANIA PTY LTD Copper Clays Scoping Study
AMC 107122 : April 2008 1
1 INTRODUCTION
AMC Consultants Pty Ltd (AMC) was requested by Copper Mines of Tasmania Pty Ltd (CMT) to prepare a scoping study for the King Lyell Copper Clays. The study aimed to identify whether the potential of the deposit justifies spending the money required to gather further data to proceed with the feasibility study process.
An initial high-level assessment by AMC prior to the scoping study identified sufficient potential to proceed with the scoping study. The report from this review is in Appendix A.
1.1 Location and History
The Copper Clays deposits are located on the West coast of Tasmania, to the east of the pass over looking Queenstown close to the small community of Gormanston. The deposits are adjacent to the Lyell Highway and approximately 5 km from Queenstown.
The Copper Clays deposits have been known since the late 1800’s and were mined between 1892 and 1910 producing 2,750t of copper. This mining was by both alluvial hydraulic and underground mining.
The most recent study of the Copper Clays took place in 1995 and was reviewed in 1998. No development commenced on the basis of this work though some further resource definition drilling occurred.
The 1995 study has an extensive discussion on the history and geological understanding of the Copper Clays. The 1995 report and the 1998 review are included as Appendix B.
1.2 Copper Clays Deposits
There are three copper clay deposits identified in the area; King Lyell, Lyell Consols and Lyell Blocks. Prior to commencement of the scoping study, CMT reviewed the copper clays and decided the study should be based on the King Lyell deposit alone.
The King Lyell deposit is the shallowest with better grade then either the Lyell Consols or the Lyell Blocks. The early underground mining ceased due to difficult ground conditions, as would be expected mining in clays. The generally low grade and small extent of the deposits, coupled with the likely very high cost of mining safely in the anticipated conditions led to underground mining not being considered as a potential option. Hence, if the scoping study does not identify enough potential to further develop the King Lyell deposit as an open pit, it can be assumed that there would be no potential to develop the Lyell Consols or the Lyell Blocks.
1.3 Weather
As the Copper Clays project is mining mainly clays high rainfall will be a significant issue.

COPPER MINES OF TASMANIA PTY LTD Copper Clays Scoping Study
AMC 107122 : April 2008 2
Figure 1.1 shows the average monthly rainfall for Queenstown and Figure 1.2 shows the average number of days with greater than 1 mm of rainfall.
Figure 1.1 Average Monthly Rainfall for Queenstown

COPPER MINES OF TASMANIA PTY LTD Copper Clays Scoping Study
AMC 107122 : April 2008 3
Figure 1.2 Average Number of Days per Month with Greater than 1 mm of Rain for Queenstown
Queenstown has an average of approximately 2,500 mm of rain per annum falling on a little less than 200 days of the year. While the majority of the rain falls between April and October, even the driest month, February has close to 100 mm of rain. The number of days with rain shows a similar characteristic with the most rain days being between April and October, and February having the least number of rain days.
Combining this data suggests the average rain day has between 9.5 mm and 14 mm/day. This implies that the rainfall occurs throughout the year, with the potential for significant rainfall events at any time of the year.
1.4 Site Conditions
The photograph in Figure 1.3 shows the valley floor under which the King Lyell copper clays are situated.
COPPER MINES OF TASMANIA PTY LTD Copper Clays Scoping Study
AMC 107122 : April 2008 4
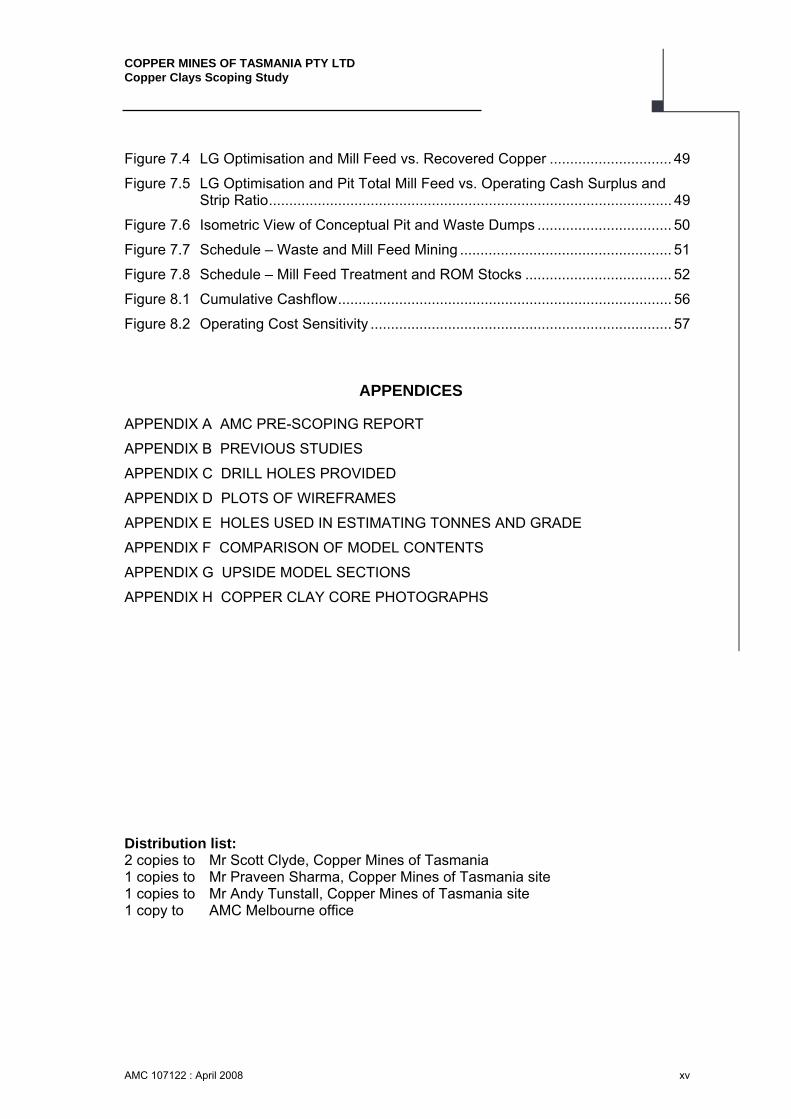
Figure 1.3 King Lyell Copper Clays Site Photo
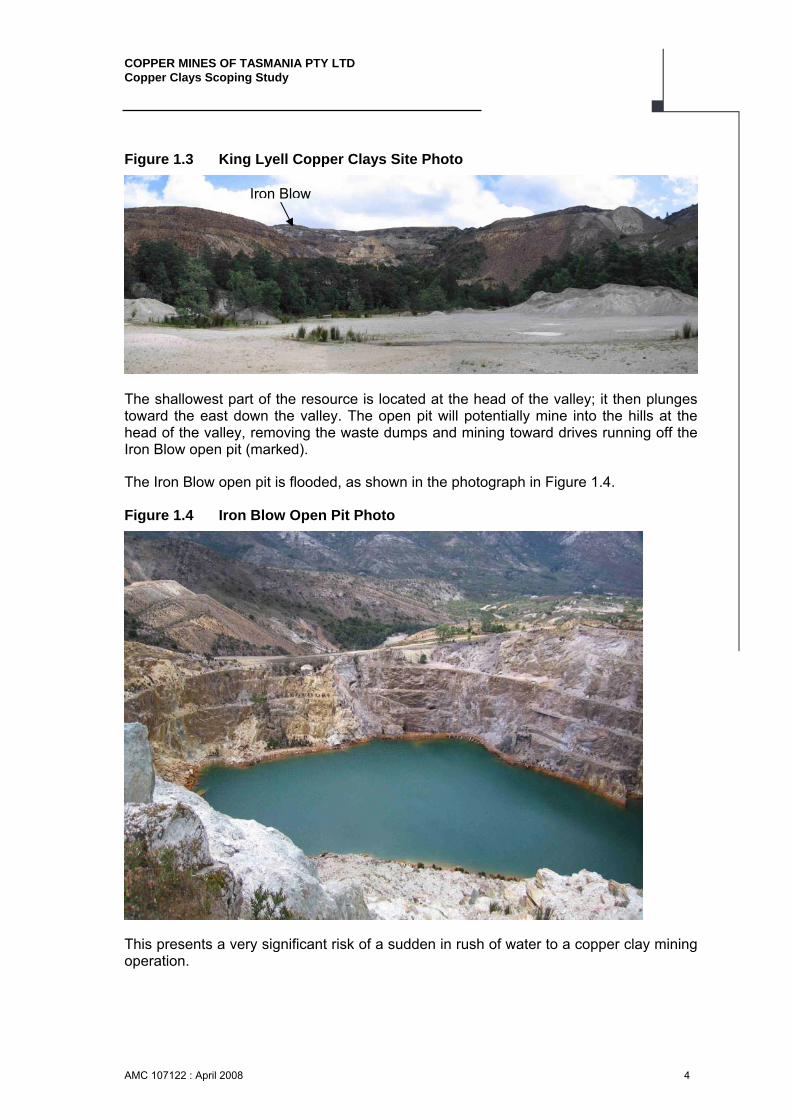
The shallowest part of the resource is located at the head of the valley; it then plunges toward the east down the valley. The open pit will potentially mine into the hills at the head of the valley, removing the waste dumps and mining toward drives running off the Iron Blow open pit (marked).
The Iron Blow open pit is flooded, as shown in the photograph in Figure 1.4.
Figure 1.4 Iron Blow Open Pit Photo
This presents a very significant risk of a sudden in rush of water to a copper clay mining operation.
Iron Blow

COPPER MINES OF TASMANIA PTY LTD Copper Clays Scoping Study
AMC 107122 : April 2008 5
2 GEOLOGICAL REVIEW
2.1 Introduction
The AMC geological review of the King Lyell Copper Clays deposit included a preliminary check of the existing geological database; preparation of a geological block model and identifying any additional geological work required to conduct a pre-feasibility study.
AMC produced two models, a conservative model and an optimistic Upside Model of the copper clays. The Upside model has been used as a means of identifying further potential of the deposit, hence it has been used for the scoping study to decide if additional expense would justify gathering data to confirm this potential.
The Upside Model for the CMT Copper Clays King Lyell deposit contains 1.7 Mt to 1.9 Mt at 1.4% to 1.6% copper at a cut off grade of 0.7% copper.
These results are not classified in accordance with the Australasian Code for Reporting of Exploration Results, Mineral Resources and Ore Reserves, 2004 edition (JORC Code) due to insufficient confidence in the data on which they are based.
There are a number of factors that affect confidence in the data and hence the estimate:
• The drill hole dataset is limited to thirteen holes in the central portion of the model, the mineralised zone was extrapolated up and down dip of the known ore zone.
• No information was available on QA/QC aspects of the sample and assay data sets, and a reproducibility test failed on the 1970/71assay data (Wills 1995).
• There is no density data available in the current drill hole database.
• Inaccurate topographic surface.
• Lack of recovery and void data.
To bring the estimation to a standard where it can be classified under the JORC code an infill drilling programme is required. The drilling would be located mainly in the western extent of the area, requiring a minimum of 16 cased diamond drill holes on a 50m X 50m grid enabling the validation of the geological interpretation. All mineralisation should be sampled using coring to ensure good recoveries and enable geotechnical evaluations.
Consistent geological logging of future holes will alleviate discrepancies found in the current database. This will enable a good understanding of the geology and mineralisation allowing the construction of geological wireframes that will provide greater confidence in defining the mineralisation.
It is recommended that bulk density tests be carried out on samples from any future drilling. This is particularly important, as there may be considerable variability in bulk density depending on the copper grade. There may also be a large variability of bulk density between the ore zone and waste.

COPPER MINES OF TASMANIA PTY LTD Copper Clays Scoping Study
AMC 107122 : April 2008 6
In summary, to upgrade the mineral resource and to validate the existing work any future drilling should include but not be restricted to:
• Geological and geotechnical logging.
• Collection of samples for assay sample submission.
• Collection of samples for and calculation of bulk density measurements.
• The inclusion of checks blanks and standards to provide industry standard QA/QC data.
• Measurement of recovery of core with particular emphasis on the mineralised zone.
• Establishment of the location of existing voids for previous workings in relation to existing and new drilling.
• Validation of new data against existing data to increase confidence in the drill hole database.
2.2 Geology
The sedimentary sequences of the King Lyell area were deposited in a shallow continental shelf environment, during the early Ordovician through to the middle Devonian. The sequences, for the most part, sit unconformably atop of the Cambrian Mt Read Volcanics. They are made up of the Owen Conglomerate Group, the Pioneer Beds and the Gordon Limestone. Post depositional deformation at the time of the Tabberabbera Orogeny resulted in folding and faulting of the sequences. Several phases of mineralisation occurred in the region, with the Copper Clays being one of the more recent. It is uncertain the exact timing of the mineralisation, but it has been suggested it coincides with Quaternary glaciations as fluvioglacial deposits from the Linda Glacial stage cover the mineralised clays (Wills, 1996).
The Copper Clays are located in the Western Linda Graben, east of the Great Lyell Fault, south of the North Lyell Fault and north of the Owen Spur Fault. The deposits are found at altitudes between 200m and 600m in synclinal valleys under water courses, concurrent with WNW trending Tabberabbera faults.
There are many theories on the genesis of the Copper Clays ore. The paper by Wills (1996) outlines the theories and prevailing arguments. He surmises (direct quotation) “The Copper Clay deposits have geometries which are sub-parallel to the present land surface. They are thought to have formed by native copper precipitation after neutralisation of copper bearing acid groundwater by reaction with Gordon Limestone”.
2.3 Data Provided
The following data was provided by CMT:
• Digital tables in Access Database format of drill hole collars, down hole surveys and assays, in AMG, IMPMINE, METMINE and working grid.

COPPER MINES OF TASMANIA PTY LTD Copper Clays Scoping Study
AMC 107122 : April 2008 7
• Digital solids in Surpac format of the copper mineralisation, lithological units and faults located on the working grid.
• Digital topographic surface in Surpac format, located on the working grid.
• Report ‘King Lyell Copper Clays – 1995 Open Cut Potential’ by K. Wills, 1995.
• Report ‘King Lyell Copper Clays – 1998 Evaluation’ by T. Weston, 1998.
• Core photographs of the 2005 drilling programme (05KLD series).
2.4 Work Undertaken
The following work was undertaken in Datamine based on the working grid:
• Load drill hole data into Datamine and apply preliminary checks.
• Load wireframes into Datamine and perform a preliminary check on the geological interpretation.
• Construct three-dimensional wireframe of copper mineralisation using an approximate 0.3% copper cut off, ensuring drill holes intersections are included.
• Subset drill data on mineralisation wireframe.
• Conduct statistical analyses of copper grade.
• Composite drill hole assay files.
• Establish estimation parameters and select estimation method.
• Construct block model and estimate copper grade.
• Cut model to topography.
• Evaluate model contents.
• Make recommendations for additional work required to enable a Pre-feasibility study to be carried out and upgrade the model contents to a reportable mineral resource in accordance with the JORC1 Code.
2.5 Data Validation
The digital drill hole data of seventeen holes was loaded into Datamine for limited validation. No obvious import errors were detected.
The validation process checked for the following inconsistencies:
• Collar co-ordinates outside of range.
• Consistent FROM and TO values in all files.
• Duplicate records, duplicate holes.
Appendix C contains a list of all holes in the King Lyell drill database.
1 the Australasian Code for Reporting of Exploration Results, Mineral Resources and Ore Reserves, 2004 edition
COPPER MINES OF TASMANIA PTY LTD Copper Clays Scoping Study
AMC 107122 : April 2008 8
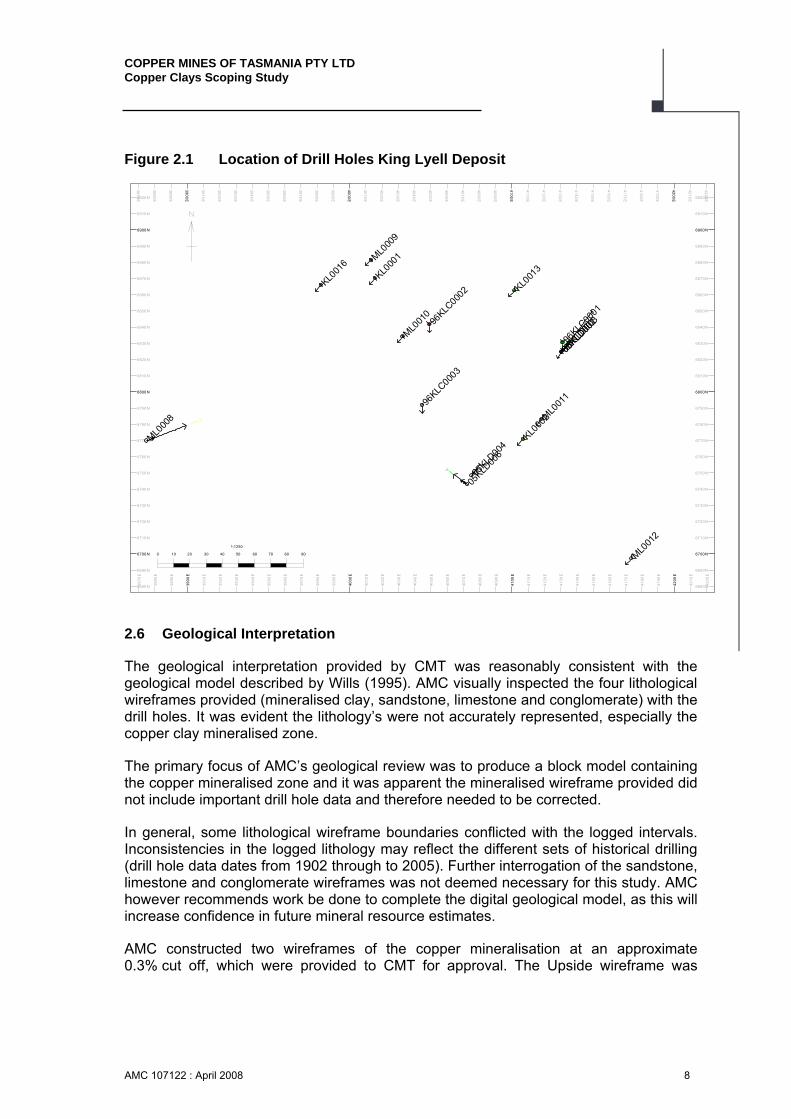
Figure 2.1 Location of Drill Holes King Lyell Deposit
3870 E
387
0 E
3880 E
388
0 E
3890 E
389
0 E
3900 E
390
0 E
3910 E
391
0 E
3920 E
392
0 E
3930 E
393
0 E
3940 E
394
0 E
3950 E
395
0 E
3960 E
396
0 E
3970 E
397
0 E
3980 E
398
0 E
3990 E
399
0 E
4000 E
400
0 E
4010 E
401
0 E
4020 E
402
0 E
4030 E 4
030
E
4040 E
404
0 E
4050 E
405
0 E
4060 E
406
0 E
4070 E
407
0 E
4080 E
408
0 E
4090 E
409
0 E
4100 E
410
0 E
4110 E
411
0 E
4120 E
412
0 E
4130 E
413
0 E
4140 E
414
0 E
4150 E
415
0 E
4160 E
416
0 E
4170 E
417
0 E
4180 E
418
0 E
4190 E
419
0 E
4200 E
420
0 E
4210 E
421
0 E
4220 E
422
0 E
6680 N 6680 N
6690 N 6690 N
6700 N 6700 N
6710 N 6710 N
6720 N 6720 N
6730 N 6730 N
6740 N 6740 N
6750 N 6750 N
6760 N 6760 N
6770 N 6770 N
6780 N 6780 N
6790 N 6790 N
6800 N 6800 N
6810 N 6810 N
6820 N 6820 N
6830 N 6830 N
6840 N 6840 N
6850 N 6850 N
6860 N 6860 N
6870 N 6870 N
6880 N 6880 N
6890 N 6890 N
6900 N 6900 N
6910 N 6910 N
6920 N 6920 N
KL000
1
KL000
2
KL001
3KL0
016
ML000
8
ML000
9
ML001
0
ML001
1
ML001
2
05KLD
001
05KLD
002
05KLD
003
05KLD
004
05KLD
006
96KLC
0001
96KLC
0002
96KLC
0003
0 10 20 30 40 50 60 70 80 90
1:1250
2.6 Geological Interpretation
The geological interpretation provided by CMT was reasonably consistent with the geological model described by Wills (1995). AMC visually inspected the four lithological wireframes provided (mineralised clay, sandstone, limestone and conglomerate) with the drill holes. It was evident the lithology’s were not accurately represented, especially the copper clay mineralised zone.
The primary focus of AMC’s geological review was to produce a block model containing the copper mineralised zone and it was apparent the mineralised wireframe provided did not include important drill hole data and therefore needed to be corrected.
In general, some lithological wireframe boundaries conflicted with the logged intervals. Inconsistencies in the logged lithology may reflect the different sets of historical drilling (drill hole data dates from 1902 through to 2005). Further interrogation of the sandstone, limestone and conglomerate wireframes was not deemed necessary for this study. AMC however recommends work be done to complete the digital geological model, as this will increase confidence in future mineral resource estimates.
AMC constructed two wireframes of the copper mineralisation at an approximate 0.3% cut off, which were provided to CMT for approval. The Upside wireframe was

COPPER MINES OF TASMANIA PTY LTD Copper Clays Scoping Study
AMC 107122 : April 2008 9
modelled using the relevant drill hole data, whilst extending up and down dip of the ore body (beyond drill hole information) to represent exploration potential. The Conservative wireframe was also modelled to contain all relevant data, but did not extend greatly beyond the existing drilling. Appendix D contains plots of the three wireframe with drill hole intercepts.
2.7 Statistical Evaluation of Drill Hole Data
A subset of the 13 drill holes located within the Upside copper mineralised zone wireframe was used for statistical evaluation. Appendix E contains a list of all holes used in the mineral resource estimation. Table 2.1 contains the raw drill hole data statistics for the copper mineralised zone.
Table 2.1 Raw Drill Hole Data Statistics for the Copper Mineralised Zone
No. Samples Max Min Mean Median Std Dev Variance
Co-eff Variation
Length (m) 146 14 0.04 1.51 1.52 1.14 1.3 0.76
Copper (%) 141 15.5 0.01 1.22 0.57 2.13 4.54 1.75
A log probability plot and log histogram plot for copper percent assays are shown in Figures 2.2 and 2.3. These figures show one population of data and can be grouped for the estimation. It also suggests that grade distribution is relatively continuous.
Figure 2.2 Log Probability Plot of Raw Cu %

COPPER MINES OF TASMANIA PTY LTD Copper Clays Scoping Study
AMC 107122 : April 2008 10
Figure 2.3 Log Histogram Plot of Raw Cu %
2.7.1 Compositing
To assist in providing the best block grade estimates requiring samples to be of a consistent sample support the drill hole assay samples were composited to one metre down-hole composites. The statistics for the composites are shown in Table 2.2. Figures 2.4 and 2.5 show the log probability and log histogram plot for the composited copper assays. This demonstrates the compositing has maintained the integrity of the database.
Table 2.2 Composited 1m Drill Hole Statistics for the Copper Mineralised Zone
No. Samples Max Min Mean Median Std Dev Variance
Co-eff Variation
Length (m) 220 1 0.54 0.99 1 0.06 0.004 0.06
Copper (%) 206 14.16 0.01 1.22 0.63 1.8 3.23 1.48

COPPER MINES OF TASMANIA PTY LTD Copper Clays Scoping Study
AMC 107122 : April 2008 11
Figure 2.4 Log Probability Plot of 1m Composited Cu %
Figure 2.5 Log Histogram Plot of 1m Composited Cu %
2.8 Mineral Resource Estimation
2.8.1 Block Model Parameters
AMC prepared an Upside and a Conservative model using two copper mineralised zone wireframes at an approximate 0.3% copper cut off prepared by AMC and honouring the original geological interpretation provided by CMT.

COPPER MINES OF TASMANIA PTY LTD Copper Clays Scoping Study
AMC 107122 : April 2008 12
The block models were constructed with the parameters shown in Table 2.4.
Table 2.3 Block Model Parameters Model Parameters Easting Northing RL
Origin 3,800 6,600 2,100 Number of cells 15 12 30 Cell size (m) 30 30 10 Minimum sub cell size (m) 7.5 7.5 0.01
The small sub cell size in the RL direction was used to allow the topographic surface to be accurately defined.
Model volumes were calculated and checked against the volume within the mineralised zone wireframe outline for model validation.
2.8.2 Resource Estimation
The inverse distance squared method was used for grade estimation.
The search directions were oriented along strike and down dip. The rotation occurred around the cardinal axis. The order of rotation is Z axis, Y axis and then X axis.
Table 2.5 lists the search and estimation parameters used.
Table 2.4 Search and Estimation Parameters Parameters Size
Search Radius X 50m Y 75m Z 10m
Rotation of Search Ellipse X axis 10° Y axis -30° Z axis 60°
Search Range Multiply Factor 1st Pass 1 2nd Pass 2 3rd Pass 4
Number of samples 1st Pass (Min/Max) 4 / 30 2nd Pass (Min/Max) 4 / 30 3rd Pass (Min/Max) 2 / 20
2.8.3 Bulk Density
Bulk density measurements were not included in the drill hole data set provided. AMC used a default density of 2.2 t/m3 based on clay, copper and waste rock densities from standard values contained in the Field Geologists’ Manual of the AusIMM (Monograph 9).

COPPER MINES OF TASMANIA PTY LTD Copper Clays Scoping Study
AMC 107122 : April 2008 13
The bulk density used in previous estimates was discussed in the report by K. Wills, 1995. Wills suggests a specific gravity (SG) of 2.1 t/m3 for resource estimation purposes. Wills also suggests the SG of clay is 2.6 t/m3 while applying the principle that voids making up 20% of the area, reducing the SG to 2.1 t/m3. This figure is reasonable; however, even if the voids are present, the initial density of 2.6 t/m3 for clay is high. The Field Geologist’s Manual suggests the density of clay is 1.9 t/m3. Wills also states that work by Batchelor in 1902, measured the SG of King Lyell clay at 2.08 t/m3 yet used 2.4 t/m3 in tonnage estimations. This density may have resulted in an over estimation of tonnes in Batchelor’s estimate.
2.9 Results
All of the available drill hole data was used. AMC also created a model using the original CMT wireframe of the mineralised zone to compare the results. Table 2.3 shows the differences between the global (no cut off applied) tonnages and grade. It shows that the initial CMT interpretation was excluding data. Appendix F has further comparisons of the three models.
Table 2.5 Global Tonnes within Copper Mineralised Zones
Copper Mineralisation Tonnes Cu% AMC Upside Model 2.9 Mt 1.07 AMC Conservative Model 2.5 Mt 0.90 CMT Initial Model 2.4 Mt 0.64
2.9.1 Upside Model Contents
Due to limitations of the scope of work and limited data, the grade and tonnage estimation focused on defining Upside Model tonnages and grade delineated by the drilling.
The grade and tonnage estimates in this report have not been classified in accordance with the Australasian Code for Reporting of Exploration Results, Mineral Resources and Ore Reserves, 2004 edition (the “JORC Code”).
The contents for the Upside Model copper mineralised zone model at a 0.7% copper cut off is shown in Table 2.6. See Appendix F for the global figures from the Upside model generated. See Appendix G for plots of the copper model.
Table 2.6 CMT Copper Clays King Lyell Upside Model
Mineralisation Type Cut Off Grade (%) Mt Cu (%)
Copper 0.7 1.7 to 1.9 1.4 to 1.6 Note These figures are for company internal use only and must not be released publicly except under section 18 of the JORC code which requires using a range of figures and must include all qualifying statements.

COPPER MINES OF TASMANIA PTY LTD Copper Clays Scoping Study
AMC 107122 : April 2008 14
The primary reasons for not classifying the results as a Mineral Resource under the JORC Code are:
• The drill hole dataset is limited to thirteen holes in the central portion of the model. The mineralised zone was extrapolated up and down dip of the known ore zone.
• No information was available on QA/QC aspects of the sample and assay data sets.
• There is no density data available in the current drill hole database.
• Inaccurate topographic surface.
• Lack of recovery and void data.
It is noted by Wills (1995) that re-assay of the 1970/71 samples gave significantly different results. This casts uncertainty on the validity of assay data within the current drill hole database. Sections produced through the model have also highlighted the need for the natural surface to be surveyed accurately. Old workings have been identified throughout the King Lyell deposit and data to delineate voids is necessary to estimate recoverable tonnes, though probably immaterial to the Upside Model contents. Poor recoveries and contamination were highlighted as issues in previous drilling. Procedures should be put in place in future drilling programmes to counter these problems.

COPPER MINES OF TASMANIA PTY LTD Copper Clays Scoping Study
AMC 107122 : April 2008 15
3 GEOTECHNICAL ASSESSMENT
The geotechnical assessment of the King Lyell Copper Clays deposit included a review of data available, assessment of the geotechnical materials for design parameters based on the data available, and recommendations for further investigation and analysis.
The conclusions from the assessment were:
• The six lithologies in the project area can be grouped into three sets of distinguishable geotechnical engineering materials. Each of these materials is expected to differ in behaviour when exposed.
• The inter-ramp slope angles that should be used in preliminary pit design are:
- 25º to 30º for Material 1, the clays.
- 35º to 40º for Material 2, the Pioneer Sandstone, the Gordon Limestone and the Gordon Shale.
- 48º for Material 3, the Owen Conglomerate.
• Based on the interpreted projection of the lithology expected to daylight in the pit, the pit may be zoned into three, with the NE and upper NW walls at an inter-ramp angle of 40º to 48º, the mid section of the E wall at an inter-ramp angle of 35º to 40º and the SE, SW and lower NW walls at an inter-ramp angle of 25º to 30º.
• The number five tunnel, the 323m adit and the Batchelor shaft will be intersected during excavation. Without prior dewatering disturbing the number five tunnel would cause water inflow into the pit and potential pit slope instability. The impacts of intersecting the other two old workings are difficult to predict because little is known about their current condition.
• The general working equipment suitable for use in this material would be a bulldozer to rip where required and an excavator for loading the material.
• Old Iron Blow dumps may have to be removed entirely due to the cohesion less nature of the loose aggregate, which would otherwise leave the material difficult to stabilise and hazardous for operations.
• In light of the limited geotechnical data available, a thorough geotechnical drilling and laboratory testing programme will be required to advance this project to the standard required for pre-feasibility and feasibility studies. Benefits realised will be in the increased accuracy of optimum design parameters and reduce expenditure during the future studies.
• It is recommended that five to six orientated, HQ triple tube geotechnical holes are drilled and logged geotechnically and structurally. A testing programme should include shear and triaxial strength testing, UCS and tensile strength testing, particle size distribution analysis, Atterberg Limits testing and mineralogical identification. Geo-hydrological testing must be included in the programme.

COPPER MINES OF TASMANIA PTY LTD Copper Clays Scoping Study
AMC 107122 : April 2008 16
3.1 Data Review and Assessment
Assessing the geotechnical potential for open pit mining the King Lyell deposit required an estimate of the material properties to predict their behaviour, in terms of excavation and stability.
To assist with the geotechnical assessment of the King Lyell deposit CMT provided AMC with lithological logs for drill holes:
• 05KL001, 05KL002, 05KL003, 05KL004, 05KL005 and 05KL006 (incomplete) drilled in 2005.
• 96KLC0001, 96KLC0002 and 96KLC0003 drilled in 1996.
• KL0013 drilled in 1971.
• KL0001, KL0002 and KL0016 drilled in1970.
• ML0008, ML0009, ML0010, ML0011 and ML0012 drilled in1902.
Drill core photographs of:
• 05KL001 (missing photos for core between 0m to 18m), 05KL002, 05KL003, 05KL004 and 05KL006 (missing photos for core between 0m to 52m).
The drill core photographs are included in Appendix H.
Surpac wireframe files:
• Lithology of the King Lyell Copper Clays site.
• Location and inferred dip of local faults.
• Topography for the King Lyell Copper Clays and Iron Blow site and wireframes for the old development at the site including development tunnels, adits and shafts proximal to the proposed open pit.
3.2 Site Conditions
3.2.1 Local Geotechnical – Geological Units
Six rock types were intersected in the core photographs available for the 2005 drill holes. These are characterised in Table 3.1. Due to the limited amount of data, assumptions on the physical properties of the material have been based on the core photographs, visual deductions during the site visit and the lithological logs.

COPPER MINES OF TASMANIA PTY LTD Copper Clays Scoping Study
AMC 107122 : April 2008 17
Table 3.1 Descriptions of the Major Geotechnical – Geological Units
Unit Intersected in Drill holes
Weathering, Structure
and Texture
Geotechnical Property Description and Comments
Clays
05KL001 05KL002 05KL003 05KL004 05KL006
Completely weathered,
some oxidation of
clays, mottled appearance
Expected to be cohesive but weak in strength, will crumble under firm blows with the point of a geological hammer, may be peeled by a pocket knife, spatially variable weathering and alteration. Described by site personnel as saturated with approximately 20% moisture content. Desiccated appearance when dried out.
Mineralised clays 05KL002
Completely weathered,
oxidised with some black
mottling
Expected to be similar to the clays described above, may contain visible mineralisation with variable concentration. Site personnel advised that nodular fragments with native copper within them were common in the mineralised unit of clay. These nodules will be much stronger than the clay but are not expected to alter the geotechnical properties of the clay.
Gordon Limestone 05KL006
Partially to completely weathered,
massive
Strength estimated from core review suggests the limestone is a weak highly fragmented material. The observed limestone outcrop site suggests a shallow indentation will result from a firm blow with the point of a geological hammer.
Pioneer Sandstone
05KL002 05KL003 05KL006
Slightly to partially
weathered, massive
Expected to be medium to weak in strength. The strength will be influenced significantly by the degree of weathering. Likely to be gritty where highly weathered, large amount of fragmented core therefore material probably has a low structural integrity. Occasionally oxidised, indicating water movement through the material.
Owen Conglomerate
05KL002 05KL003 05KL006
Slightly to completely weathered, large sub-angular
fragments
Expected to be strong, requiring more than one blow of a geological hammer to fracture it, low degree of fragmentation and moderate structural integrity. Areas of complete weathering are expected to have a low strength and poor structural integrity. Observed high angle jointing with oxidised surface, though this may not be dominant characteristic.
Gordon Shale
05KL004
Slightly to partially
weathered, fissile
appearance
Likely to be weak to moderately strong, requiring more than a single blow to fracture the material, strength is expected to be weaker when loading perpendicular to the bedding. Moderate fragmentation and moderate structural integrity.

COPPER MINES OF TASMANIA PTY LTD Copper Clays Scoping Study
AMC 107122 : April 2008 18
Outcrops for two of the six lithology’s were observed during the site visit. These were the mineralised clay unit (Figure 3.1a) and the Gordon Limestone (Figure3.1b).
Figure 3.1 A. Mineralised Clay, in a Gully Above the Copper Clay Deposit. B. Gordon Limestone Outcrop at the Site of the Copper Clay Deposit
A. B.
3.2.2 Geological Structures
Three faults roughly bound the King Lyell deposit (Figure 3.2). These are the Gormanston fault which strikes approximately NW to SE, the Great Lyell fault which strikes approx. N to S and the King Lyell fault which strikes almost parallel to the Gormanston fault and cuts through the centre of the deposit.
Very little is known about the faults. Their strike and extension have been digitised from old surface maps. The dips have been inferred and there is no data on the possible presence or flow rate of water on the faults.

COPPER MINES OF TASMANIA PTY LTD Copper Clays Scoping Study
AMC 107122 : April 2008 19
Figure 3.2 Structures and Old Development Around the King Lyell Deposit
3.2.3 Old Development and Workings
In conjunction with the geotechnical-geological site conditions and the structural deformation of the area, the influence of any previous development and workings must be considered so as to thoroughly assess the geotechnical potential of the project.
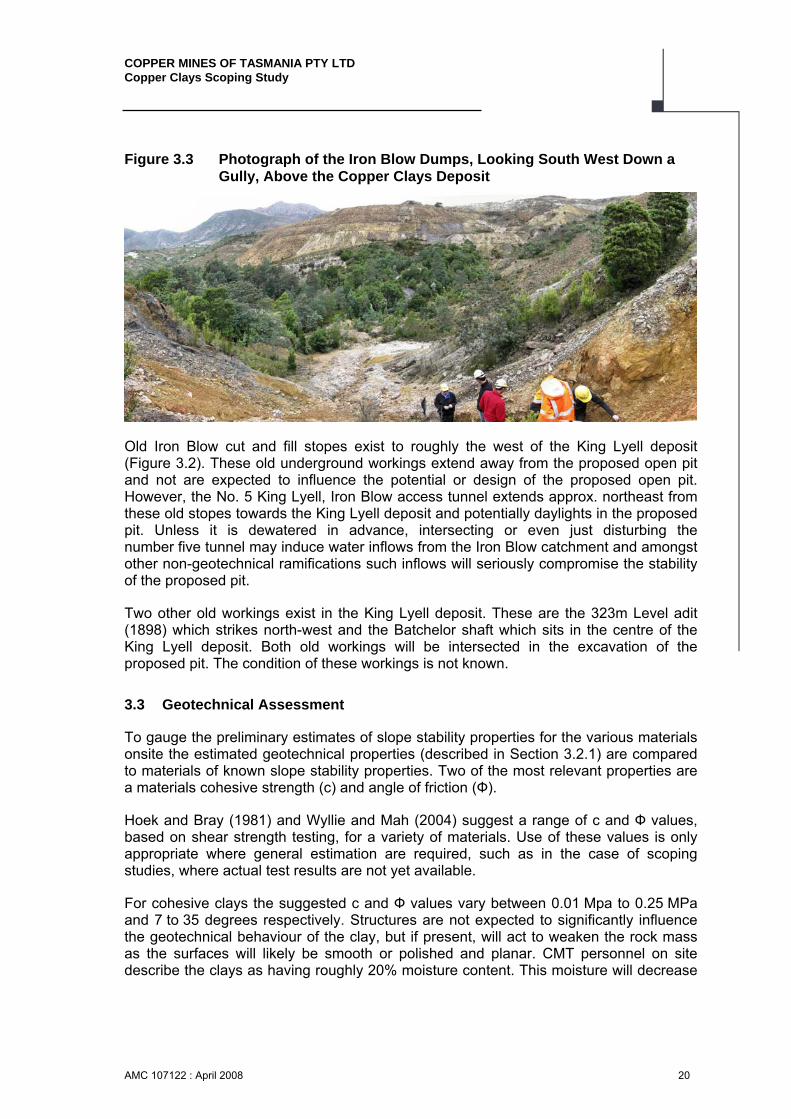
The Iron Blow Open Cut (Figure 3.2), located to the WNW of the King Lyell Copper Clays deposit, was worked from 1823 to 1929. Waste rock from the workings was dumped over the eastern and north-eastern walls of the Iron Blow, creating un-engineered dumps which flank the King Lyell deposit (Figure 3.3).
COPPER MINES OF TASMANIA PTY LTD Copper Clays Scoping Study
AMC 107122 : April 2008 20
Figure 3.3 Photograph of the Iron Blow Dumps, Looking South West Down a Gully, Above the Copper Clays Deposit
Old Iron Blow cut and fill stopes exist to roughly the west of the King Lyell deposit (Figure 3.2). These old underground workings extend away from the proposed open pit and not are expected to influence the potential or design of the proposed open pit. However, the No. 5 King Lyell, Iron Blow access tunnel extends approx. northeast from these old stopes towards the King Lyell deposit and potentially daylights in the proposed pit. Unless it is dewatered in advance, intersecting or even just disturbing the number five tunnel may induce water inflows from the Iron Blow catchment and amongst other non-geotechnical ramifications such inflows will seriously compromise the stability of the proposed pit.
Two other old workings exist in the King Lyell deposit. These are the 323m Level adit (1898) which strikes north-west and the Batchelor shaft which sits in the centre of the King Lyell deposit. Both old workings will be intersected in the excavation of the proposed pit. The condition of these workings is not known.
3.3 Geotechnical Assessment
To gauge the preliminary estimates of slope stability properties for the various materials onsite the estimated geotechnical properties (described in Section 3.2.1) are compared to materials of known slope stability properties. Two of the most relevant properties are a materials cohesive strength (c) and angle of friction (Ф).
Hoek and Bray (1981) and Wyllie and Mah (2004) suggest a range of c and Ф values, based on shear strength testing, for a variety of materials. Use of these values is only appropriate where general estimation are required, such as in the case of scoping studies, where actual test results are not yet available.
For cohesive clays the suggested c and Ф values vary between 0.01 Mpa to 0.25 MPa and 7 to 35 degrees respectively. Structures are not expected to significantly influence the geotechnical behaviour of the clay, but if present, will act to weaken the rock mass as the surfaces will likely be smooth or polished and planar. CMT personnel on site describe the clays as having roughly 20% moisture content. This moisture will decrease

COPPER MINES OF TASMANIA PTY LTD Copper Clays Scoping Study
AMC 107122 : April 2008 21
the cohesive strength and angle of friction of the clay, therefore decreasing the slope angle at which this material may be excavated without failure. If it is not possible to drain the clays an optimal overall slope angle will not be achievable and it is expected the bench and inter-ramp slopes will bulge at the toe and will most likely result in failure. Mottled colouring indicates fluctuating water table levels, which will again affect the optimal overall slope angle achievable if the material cannot be drained.
Soft sedimentary rocks such as shale may vary in c and Ф values between 1 Mpa to 2 MPa and 25 to 35 degrees, respectively. Considering the high weathering and low structural integrity of the Gordon shale observed in the core photographs these values may overestimate the slope stability properties of the site material. Slightly more conservative values are recommended for the preliminary design of the pit where the pit limits intersect this rock type. Also to be considered in assessing the slope stability of the Gordon shale is the laminated nature of shale and the fissile behaviour when the material is exposed. From the limited observable Gordon shale intersected in drill hole 05KL004, artificial breaks sub-parallel to the bedding are frequent, forming high alpha angles to the drill core (which dips between 80 and 90 degrees). Slope instability and failure are probable where the exposed shale-bedding dips into the pit.
Limestone and sandstone are described by Hoek and Bray (1981) as being hard sedimentary rocks with c and Ф values ranging between 10 to 30 MPa and 35 to 40 degrees respectively. However, both the Gordon limestone and the Pioneer sandstone are, in some places, highly weathered and therefore likely to be weak resulting in lower cohesive strengths and friction angles. As with the Gordon shale the conservative values, compared to the typical values, should be used when these materials daylight in the pit limit.
A conglomerate is a hard sedimentary rock, but depending on the matrix binding the conglomerate fragments, the strength will vary significantly. The matrix of the Owen conglomerate is unknown but higher range c and Ф values may be expected as the rock in the core photographs appears to have an overall high structural integrity, with infrequent fragmentation. Wyllie and Mah (2004) suggest the angle of friction for a conglomerate is more likely to be similar to that of high friction rock types such as basalts and granites. The strength of the conglomerate is expected to be greater than all the other materials in the proposed pit. An area of intense weathering was identified from the core photographs. The boundaries defining the weathering are sharp, suggesting the weathering occurred along a structure and is not indicative of the general geotechnical condition of the conglomerate.
Little is known about the materials which make up the dumps flanking the King Lyell deposit, other than the placement of the material was not engineered. It can be assumed that the dumps will be cohesion less (Ф = 0 degrees), un-graded and uncompacted, baring slight compaction due to environmental exposure over time. The loose aggregate material is likely to have angles of friction between 30 to 50 degrees and taking into consideration the method of placement, the material will be sitting at the meta-stable angle of repose, between stability and failure. Excavation of the dumps will require stabilisation at the base of the dump but ultimately the entire dump may have to be removed to achieve stability in the walls above the proposed pit.

COPPER MINES OF TASMANIA PTY LTD Copper Clays Scoping Study
AMC 107122 : April 2008 22
3.4 Geotechnical Parameters for Pit Design
Although there are essentially six different lithologies intersected by the 2005 drill holes, these materials may be grouped into three sets with similar geotechnical properties. Upon exposure these sets can be expected to differ in behaviour. Based on this grouping the inter-ramp design angle for each material has been defined (Table 3.2).
Table 3.2 Preliminary Inter-ramp Design Angles
Material Inter-ramp angle (degrees) Comments
1 Clays 25 to 30 Achievable only with active draining
2 Pioneer Sandstone, Gordon Limestone and Gordon Shale
35 to 40 Assumed to be free draining although the shale may need draining
3 Owen Conglomerate 48
An interpreted projection of the lithology’s which are expected to daylight in the pit limit is shown in Figure 3.4. This interpretation has been based on the lithological model provided by CMT and a preliminary pit design by AMC. It is important to note that the lithology model has been designed on a limited number of drill holes, especially up-valley where there are no drill holes to confirm the rock types. For optimised geotechnical design parameters the lithology model will need to be rigorously defined through a planned geological drilling and interpretation programme.
Figure 3.4 Interpreted Projection of the Lithology’s Exposed in the Preliminary Pit Design

COPPER MINES OF TASMANIA PTY LTD Copper Clays Scoping Study
AMC 107122 : April 2008 23
The preliminary pit design may be zoned into three:
• The NE and upper NW walls (Zone 1), in which the dominant materials are the Pioneer sandstone and Owen conglomerate. The suggested inter-ramp angle is between 40º and 48º.
• The Pit floor and a portion of the E wall (Zone 2), in which the dominant material is limestone, with a suggested inter-ramp slope angle of 35º to 40º.
• The SE, SW and lower NW walls (Zone 3), in which the dominant materials are the mineralised and un-mineralised clay and the suggested inter-ramp angle is 25º to 30º.
It can be expected that the rock types which daylight may change with the collection of more exact data and the re-optimisation of the pit design.
The proposed pit is likely to intersect with the King Lyell fault. Although it is unknown whether there is water in the fault, it can be assumed that the rock mass around the fault will be poorer in quality and instability more likely.
The number five tunnel, the 323m adit and the Bachelor shaft will daylight in the pit walls. Water inflow from the Iron blow through the number five tunnel will cause serious pit slope instability and will have to be mitigated before excavation begins. The condition of the remaining old workings is unknown therefore the impact of their exposure, on the stability of the pit walls, is unpredictable. Monitoring will be required during the excavation in these areas.
General working equipment which would be suitable for use in this material includes a bulldozer to rip where required and an excavator for loading the material. Small areas of stronger rock may be encountered, due to special variability in weathering, in which case paddock-blasting may be necessary.
The cohesion less nature of the dump material may make its removal difficult as the load of the working equipment may not be supported, presenting a hazard. Excavating only sections of the dumps may also cause uncontrollable instability therefore it may be beneficial to remove the entire dump if part is required to be excavated.
3.5 Recommendations
The geotechnical material properties have been judged from a limited amount of data. Any further geotechnical assessment of the King Lyell deposit will require a testing programme that includes drilling specific geotechnical-focused drill holes and laboratory testing to validate and quantify the preliminary geotechnical estimates. The benefits from investing time and capital into the data collection for the understanding of the geotechnical-geological model will be seen in the reduced expenditure during the feasibility assessment.
The following work will provide the data required for a pre-feasibility and feasibility assessments on the King Lyell deposit.

COPPER MINES OF TASMANIA PTY LTD Copper Clays Scoping Study
AMC 107122 : April 2008 24
3.5.1 Drilling
Initially five to six geotechnical diamond drill holes will be required. They should be orientated, HQ triple tube drill holes and should be logged geotechnically and structurally. The drill holes should target the final pit walls and align with the pit wall angles. Suggested locations are detailed in Table 3.3 and are shown in Figure 3.5. The exact positions may have access or other such issues and may have to be moved to accommodate for site conditions. Drilling to define a more rigorous geological model should also be logged for geotechnical purposes.
Table 3.3 Suggested Geotechnical Drill Hole Design
BHID Easting Northing RL Azimuth Dip Length (m) GTDH_1 4003.7 6764.9 2328 46.1 41 111 GTDH_2 3905.4 7000.7 2397 137.7 36 241 GTDH_3 4019.7 6994.1 2363 169.6 37 162 GTDH_4 4127.4 7024.5 2392 190.6 41 209 GTDH_5 4223.6 6872.1 2348 253.5 41 144 GTDH_6 4174.4 6773.1 2302 297.6 37 85
Figure 3.5 Suggested Geotechnical Drill Dole Design

COPPER MINES OF TASMANIA PTY LTD Copper Clays Scoping Study
AMC 107122 : April 2008 25
3.5.2 Laboratory and Field Testing
Testing on each material that will be excavated should be carried out to determine material properties. At least three samples per material type, per test type will be required. The testing programme should include shear box and triaxial strength testing to determine c and Ф values, UCS and tensile strength testing of the rock material, particle size distribution (PDS) testing using both the sieve and hydrometer methods, Atterberg limits testing to determine Plastic Limits (PL) and Liquid Limits (LL) of the clays, mineralogical identification of the clays using X-Ray Diffraction (XRD) and hydrological testing using a series of observation and pumping wells to determine the hydrogeology influences on the geotechnical pit design.

COPPER MINES OF TASMANIA PTY LTD Copper Clays Scoping Study
AMC 107122 : April 2008 26
4 METALLURGICAL ASSESSMENT
This analysis is based on limited metallurgical data, an inspection of the site, examination of a limited number of samples and discussions with CMT personnel. It has necessarily included an assessment of the potential process response of Copper Clays ore. This is yet to be confirmed by specific metallurgical test work. Hence all the conclusions regarding process routes, recoveries, concentrate grade and costs need confirmation by test work and further analysis.
The analysis identified gravity separation as the process method with the best potential. Operating and capital costs were generated based on a process route with:
• Grizzly and Jaw crusher.
• Surge bin.
• Trommel scrubber.
• Screens and cyclones.
• In-line pressure jigs.
It is estimated this process would recover 65% of the contained copper. The estimated capital and operating cost are shown in Table 4.1.
Table 4.1 Processing Operating and Capital Cost
Annual Throughput (ktpa)
250 500 All New Equipment (MA$) 8.00 13.00 Refurbished 2nd Hand Equipment (MA$) 6.00 9.50 (A$/t) 10.00 7.50
4.1 Historical Background
The Copper Clays deposits were originally mined between 1892 and 1910 producing approximately 2,750t of copper. Processing of the ore was carried out using coarse grinding of the ore, hydraulic classification and separation of the copper minerals using shaking tables to produce a gravity concentrate. According to historical records this assayed in excess of 70% Cu from Lyell Blocks and closer to 60% Cu from Lyell Consols.
However a lower grade middlings product was also reported; a product that assayed about 20% Cu and which contained significant ironstone. Copper recoveries were reported at circa 70%. It is noted that the Lyell Blocks ore was higher grade than the Lyell Consols ore, a consideration which potentially contributed to the grade difference in the concentrates. The average ore grade treated in the latter stages of this early operating period averaged circa 1% Cu.

COPPER MINES OF TASMANIA PTY LTD Copper Clays Scoping Study
AMC 107122 : April 2008 27
4.2 Mineralogical Assessment
Mineralogical investigations have identified that the copper is present primarily as native copper and cuprite in the upper sections of the deposit transitioning to sulphides at depth. The dominant sulphide mineral is chalcocite although minor chalcopyrite, bornite and covellite have been reported. The dominant gangue minerals include quartz, clays and haematite plus magnetite and carbonates.
A mineralogical assessment of September 2005 on samples from drill hole CMPKL02 reported the copper distribution in sequential depth intervals. From 43m to 47m depth, 91.4% of the copper was present as native copper and 4.5% as cuprite with 2.4% as chalcocite. In the 47m to 51m interval, the proportion of native copper decreased to 84.4% while the proportion of chalcocite increased to 10.3%. At 51m to 55m depth, the proportion of the copper present in chalcocite increased to 94.7% with no native copper being reported.
The mineralogical profile thus indicated dominant native copper in the upper sections of the deposit transitioning to dominant chalcocite at depth. Note however that the samples examined in this mineralogical investigation were fine sized in an approximate 38 µm to sub-10 µm size range such that there was no indication of the coarse particle liberation characteristics.
Drilling logs from earlier Lyell Blocks and Lyell Consols holes indicated a similar copper distribution profile. Typically, native copper is noted in the upper sections of holes and although sulphides are not always reported, when they are observed it is normally at depth.
The native copper was variously described as being present as pebbled or being located along joints and fracture zones. The sulphides were not always described in detail but in some instances were noted to be finely disseminated. The gangue minerals frequently reported included clays, haematite, limonite, quartzite, dolomite and limestone.
While some hard gangue components have been noted such as the ironstone, it has been reported that 75% to 80% of the deposit is present as clays in some form. It will be necessary to quantify the actual materials handling characteristics of the deposit as these factors will have a direct impact on the viability of processing options.
In conjunction with the historical processing data, some interpolation of the mineralogical information might be made in relation to potential mineral processing treatment options for the Copper Clays. It should be stressed however that these interpretations should be regarded as conceptual only and that mineralogical and metallurgical investigations will be required to properly define a process design.
• The Chilean Mill used in the historical operation would have produced a sand sized product which would have been consistent with the operation of shaking tables. The hydraulic separation sequence would have separated the copper-bearing sands from the gangue clay component.
• The production of the historical 70% Cu high grade concentrate from the shaking tables indicated a high native copper content, suggesting a reasonable liberation of the native copper at the sands sizing consistent with the mineralogical

COPPER MINES OF TASMANIA PTY LTD Copper Clays Scoping Study
AMC 107122 : April 2008 28
observation that the native copper occurred as pebbles and along joints and faulting.
• The production of the low grade 20% Cu middlings component which contained ironstone conforms with the mineralogical data that noted the presence of haematite and magnetite, high SG minerals that would report to gravity concentrate with the native copper.
• The copper sulphide minerals were apparently not targeted in the historical operation and these minerals would not be amenable to gravity separation. It should be noted that the flotation technology which is generally used to recover sulphide minerals was not available at the time that the historical operation was functioning.
It is assumed that a contemporary gravity processing technique could be applied for the recovery of the native copper but that the copper sulphide mineralisation would require the application of flotation technology. The presence of the high SG gangue minerals would however lower the average grade of a gravity concentrate. It is also understood that whereas the historical operation generally treated ore in a 1% Cu to 3% Cu head grade range, the current resource may be below these limits. The lower head grade will likely produce lower recovery levels. For these reasons it is probable that a gravity circuit on the current Copper Clays will generate a lower average concentrate grade at lower copper recovery levels compared to the historical operation.
It has been estimated that for the treatment of the Copper Clays, a 65% copper recovery into a 45% Cu gravity concentrate might be anticipated in the upper sections of the deposit which contain native copper with some cuprite as the dominant copper mineralisation. It has been assumed that moderate liberation of this copper mineralisation would occur at a relatively coarse size. It has also been assumed that the chalcocite which dominates at depth would be present as locked mineral in harder gangue materials and as such would not be amenable to gravity processing. A contemporary fine grinding and flotation approach would be required for the efficient recovery of the copper sulphide minerals.
4.3 Metallurgical Test Work
To date, little relevant metallurgical test work has been carried out into the treatment characteristic of the Copper Clays. Test work conducted in 1966 considered flotation processing as the sole means of treating the Copper Clays, perhaps because this material had been considered to be a supplementary feedstock for the existing flotation plant. As might be anticipated, it was shown that the Copper Clays had to be de-slimed to remove the clay component of the ore to obtain a controllable flotation operation. Depending upon the sample tested between 15% and 50% of the copper was lost in the de-slime tail. This outcome indicates that the potential for copper loss that might ensue in an ore washing step in any contemporary process design requires investigation.
Of the de-slimed sands product however, the flotation response tended to vary with the head grade of the ore. With a high grade 2.3% Cu ore, a flotation concentrate assaying 27% Cu was obtained at 71% overall copper recovery. As the head grade decreased

COPPER MINES OF TASMANIA PTY LTD Copper Clays Scoping Study
AMC 107122 : April 2008 29
to 0.9% Cu however, the concentrate grade and copper recovery level decreased to 17% Cu and 71% recovery respectively.
While processing native copper in a sulphide flotation regime is possible, the recovery efficiency is not usually high. The malleable native copper tends to form platelets during the grinding process that are inherently difficult to physically lift in the flotation operation. As such, it is usually preferable to recover native copper by gravity means. On the other hand the covellite in the ore should be quite amenable to flotation treatment.
In relation to the 1996 test work, there is no indication regarding the constitution of the samples that were tested. However as was concluded at that time, it is apparent that the use of flotation alone would not represent a viable option for the treatment of the Copper Clays. A process route should be developed that utilised the different characteristics of the copper and the gangue minerals as they occur throughout the deposit. As such, the treatment route that is applied to process ore from the upper sections of the deposit in which native copper dominates will likely be different from the optimum treatment route for the lower segments of the deposit in which chalcocite represents the dominant form of copper mineralisation.
4.4 Conceptual Process Design
It has been suggested that the dominant copper mineral in the Copper Clays is native copper which is present as a liberated component in a soft clay gangue. It has also been suggested that the gangue comprises 75% to 80% clays, this is generally supported by statements that in recent drilling exercises only about 10% of the ore was hard rock. The two other major associated gangue lithologies of limestone and detrital sediments have however been described as being generally un-mineralised.
In the 1995 review by KJA Wills entitled ‘Open Cut Potential of the Copper Clays Area’, it was proposed that the copper in the Copper Clays could be distributed as of the order of 80% in native copper with 10% as cuprite and the remainder in sulphides, particularly chalcocite. Because the cuprite is generally associated with the native copper, minerals that together account for circa 90% of the copper in the Copper Clays, it is logical that the conceptual process design focus on the recovery of these minerals in preference to the recovery of the sulphides. That is not to say however that the recovery of copper from the sulphide mineralisation should be ignored totally. It is more that it should not be the principal driver in the selection of a treatment route.
For the reasons previously mentioned, gravity processing techniques would be more appropriate to the recovery of the native copper than would flotation. The process design has therefore been based upon gravity processing.
As well, because the gangue mineralisation comprises circa 80% clays, it is suggested that conventional grinding of the ore would not be an appropriate comminution process ahead of the gravity recovery circuit. With the ore comprising circa 80% clays, it would only be the remaining circa 20% of hard rock that would be amenable to comminution by a grinding process. With minimal hard ore in the deposit, it would be unlikely that there would be sufficient rock media to render SAG milling as a suitable process and although ball milling might well be applied to this ore, the associated capital and operating cost

COPPER MINES OF TASMANIA PTY LTD Copper Clays Scoping Study
AMC 107122 : April 2008 30
could not be justified. The equipment would have to be sized to be able to process all of the ore to grind only the 20% hard rock component. Any grinding mill in this case would essentially act as a very expensive slurrying machine.
To that end, it is suggested that the most appropriate treatment approach would be to utilise a trommel scrubber at the head of the circuit to wash out the clay component of the gangue and so nominally remove circa 80% of the mass as a barren gangue early in the process route. A grizzley and jaw grusher would be located ahead of the scrubber control the size of the hard rock component entering the treatment circuit.
The ore would be reclaimed by front-end loader from a ROM stockpile and dumped into a feed bin protected by a grizzley. Ore would be drawn from the feed bin and fed into the jaw crusher. The crushed product would be conveyed to a surge hopper ahead of the scrubber where water would be added and the ore washed to liberate the native copper from the clays. The scrubber discharge product would be separated into a number of size fractions for separate treatment as appropriate.
The appropriate size split for the scrubber discharge would have to be determined by relevant test work. However it might be presumed that the target feed size for the gravity circuit would be circa -20 mm + 0.5 mm. The +20 mm material which would nominally have originated from the hard rock component of the deposit would be conveyed to a coarse rejects stockpile. The copper assay of this product would be monitored and if it ensued that the copper assay was sufficiently high potentially due to the presence of a locked chalcocite fraction, then it would be trucked to the existing flotation plant to be processed through a conventional grinding and flotation sequence.
The clay material in the scrubber discharge product would potentially be separated by a combination of screens and cyclones to be discharged as a barren slimes component. This slimes tailings would be thickened to reclaim process water with the underflow from the thickener being pumped to a tailings dam for residue storage.
The sands component from the scrubber discharge product would become the feed to the gravity separation circuit. For the present exercise, it has been assumed a series of In-line Pressure Jigs would be utilised as the principal gravity recovery technique. This incorporates contemporary processing technology. The jigs would generate a high SG sinks components and a lower SG floats component. The floats would be conveyed to a gravity circuit tailings stockpile while the sinks would become the value concentrate. The floats component would likely contain the copper sulphide mineralisation when that was present in the ore. Hence this product would be analysed and as with the coarse rejects material, conveyed to the existing flotation plant for further treatment when the copper assay justified such action. When the copper assay was low, both the coarse rejects and the gravity circuit floats products would be transferred to a waste materials stockpile.
The gravity circuit concentrate would contain the native copper together with other high SG gangue minerals such as the ironstone type products. It is also anticipated that some gangue will remain locked to the native copper material. Due to dilution it has been estimated that a grade of circa 45% Cu might be anticipated in the gravity circuit concentrate. As has been previously mentioned, with the indicated copper grade of the deposit being around 1% Cu and with the copper recovery being generally influenced by

COPPER MINES OF TASMANIA PTY LTD Copper Clays Scoping Study
AMC 107122 : April 2008 31
the head grade, it is anticipated that a copper recovery of circa 65% will be achieved by this process.
In relation to the disposal of the Copper Clays gravity concentrate, it has been assumed that the gravity product would be blended with the filtered concentrate from the existing flotation plant for despatch to market. In this regard however, it will also be necessary to consult with the current customers to ensure that the native copper concentrate is an amenable material for which appropriate payment will be received. There may be issues in this regard as the current flotation concentrate is processed by conventional smelting techniques that are geared to the chemical interactions between sulphide minerals and the various fluxes used in the smelting process.
4.5 Capital and Operating Cost Estimation
Preliminary capital and operating cost estimates have been generated for the indicated process design as shown in Table 4.2. Two ore treatment rates were considered, processing either 250,000 or 500,000 tonnes of ore per annum. In addition, two equipment formats were evaluated, with one scenario considering the use of all new equipment while the alternative case assumed that some refurbished second hand equipment would be incorporated in the circuit.
Table 4.2 Processing Operating and Capital Cost
Annual
Throughput (ktpa) 250 500 All New Equipment (MA$) 8.00 13.00 Refurbished 2nd Hand Equipment (MA$) 6.00 9.50 (A$/t) 10.00 7.50
It should be noted that with current market conditions, the cost of refurbished second hand equipment is not significantly lower than the cost of new equipment. However it does have the advantage of a reduced delivery time. In the same vein, it should also be noted that these current market conditions mean that well maintained equipment will hold its capital value reasonably well.
4.6 Metallurgical Test work Requirements
At present, the provisional process design has been based upon a liberal interpretation of the limited available data. In order to enable a detailed process design to be carried out, it will be necessary to perform the appropriate metallurgical investigations.
The level of risk associated with the process design will be an inverse function of the extent of the metallurgical information which is available for that design. As essentially no specific Copper Clays metallurgical data exist at present, it will be necessary to generate the full spectrum of design information. As a ball park estimate, a cost of circa A$150,000 would potentially be incurred for a metallurgical test work programme (not including sample collection) at a level that would permit a feasibility standard assessment of the project to be prepared.

COPPER MINES OF TASMANIA PTY LTD Copper Clays Scoping Study
AMC 107122 : April 2008 32
The test work programme would be structured to address the gravity recovery of the native copper although an assessment of the beneficiation of the copper sulphide mineralisation would also have to be considered. The test work would also incorporate a mineralogical investigation to assess the ore from a metallurgical perspective in order to identify the mineralogical associations and the likely liberation characteristics.
As suggested, test work would focus on gravity processing, primarily by laboratory investigation. However because of the difficulty in assessing such techniques on a small scale, pilot treatment of a small bulk sample may be justified towards the end of the investigation if a representative bulk sample can be readily obtained. In general however, the metallurgical investigation would have to define the relative proportions of the value mineralisation and gangue, the scrubbing characteristics of the ore and the likely constitution of the scrubbed products as well as the gravity recovery response of the sands fraction.
Although the test work would largely address the recovery of the dominant native copper mineralisation, it will also be necessary to consider the beneficiation route that might be applied to the copper sulphide minerals, particularly if this component of the ore was to be processed through the existing flotation plant. To that end it would be necessary to identify the comminution characteristics of the relative gravity circuit reject products in addition to the flotation characteristics.
Finally, as the gangue mineralisation comprises approximately 80% clays which will be discharged to a tailings dam, it will be necessary to quantify the thickening and settling characteristics of these clays in order to define an appropriate treatment route. It could well ensue that these clays are inherently difficult to settle and thicken such that specific deposition requirements and residence volumes may be required in the tailings dam to ensure that any discharge water has been effectively clarified. Considerable effort may be needed to assess the dewatering characteristics of these clays.
4.7 Tailings and Waste Disposal
Cost has been included in the operating expense for disposal of tailings, but no tails dam location has been identified. For the purpose of the study it has been assumed the tails will be disposed of in the Iron Blow open pit. If this is not the case additional cost will be incurred constructing a suitable tails dam.
Use of the Iron Blow to dispose of tailings may lead to additional liabilities being taken on by CMT above those associated with a new tails dam.

COPPER MINES OF TASMANIA PTY LTD Copper Clays Scoping Study
AMC 107122 : April 2008 33
5 MINING OPTIONS AND MINING COSTS
The proposed mining fleet consists of:
• One 80t Excavator.
• Four 40t articulated six wheel drive trucks.
• One 40t tracked dozer.
• One 12t Motor grader.
Six wheel drive articulated trucks will allow operations to continue in the wet conditions regularly seen at Queenstown, which would make the site clays un-trafficable for rigid body trucks.
Due to the potential difficulties operating on narrow benches above 2,330 mRl, in the area of the existing waste dumps, an additional dozer has been assumed and mining rates reduced by 20% above 2,330 mRl.
The estimated operating cost is:
• Mining:
- Above 2,330 mRl – A$5.00 /t of rock.
- Below 2,330 mRl – A$3.50 /t of rock.
• Grade control – A$1.00/t ore.
Capital cost is estimated at A$1,750k, this includes de-watering the Iron Blow.
5.1 Mining Method and Equipment
The major issues influencing selection of mining method and equipment are:
• Ground Conditions – The rock being mined for the copper clays project will be predominantly clay. The exposed material suggests that it should be possible to excavate without blasting and with only minimal ripping of hard zones. This is supported by exploration geologists who reported that only 5% of the material provided any resistance to drilling.
• Weather Conditions – As discussed the area has on average close to 2,500 mm of rain per annum on approximately 200 days of the year. This coupled with the generally soft ground conditions will create difficulties in maintaining running surfaces.
• Project Size – Initial analysis suggested the project will have in the region of 5 Mt of rock being mined over a period of three to four years. This will give annual mining rates of between 1.2 Mtpa and 2 Mtpa.
While the ground and weather conditions will make operations difficult at times, and may preclude using rigid body trucks, AMC believes it will be possible to mine the deposit using an excavator and six wheel drive articulated trucks. Due to the poor ground conditions it has been assumed a tracked dozer will be required full time to rip where

COPPER MINES OF TASMANIA PTY LTD Copper Clays Scoping Study
AMC 107122 : April 2008 34
required and maintain floors around the digging area. A grader has also been assumed to be required full time to maintain running surfaces.
Assuming an annual production rate of 1.5 Mtpa, this will only require a single excavator. Single shift operations for eleven hrs per day, six days per week and forty eight weeks per year, this gives 2,970 engine hours per annum, if the machine operates for 90% of this time the total effective operating hours will be 2,673 hours per annum. Assuming a 2.2t /bcm bulk density, achieving 1.5 Mtpa will require a rate of 255 bcm/hr.
The graph in Figure 5.1 compares the volumetric loading rate to bucket size for the AMC open pit benchmarking database. The point in blue is a 4.5 m3 bucket which gives a loading rate of 260 bcm/hr. The volumetric loading rate has been selected as the low density will lead to the bucket being full with material before the machine lifting capacity has been reached.
Figure 5.1 Loading Rate vs. Bucket Size – AMC Benchmarking Database
0
500
1,000
1,500
2,000
2,500
0 5 10 15 20 25 30 35 40 45 50
Bucket Size (m3)
Load
ing
Rat
e (b
cm/h
r)
This is the size of bucket normally associated with an 80t excavator such as a Komatsu PC800.
An excavator of this size would be appropriate to load 40t articulated trucks. The graph in Figure 5.2 compares truck cycle time to haul distances for the AMC benchmarking database.
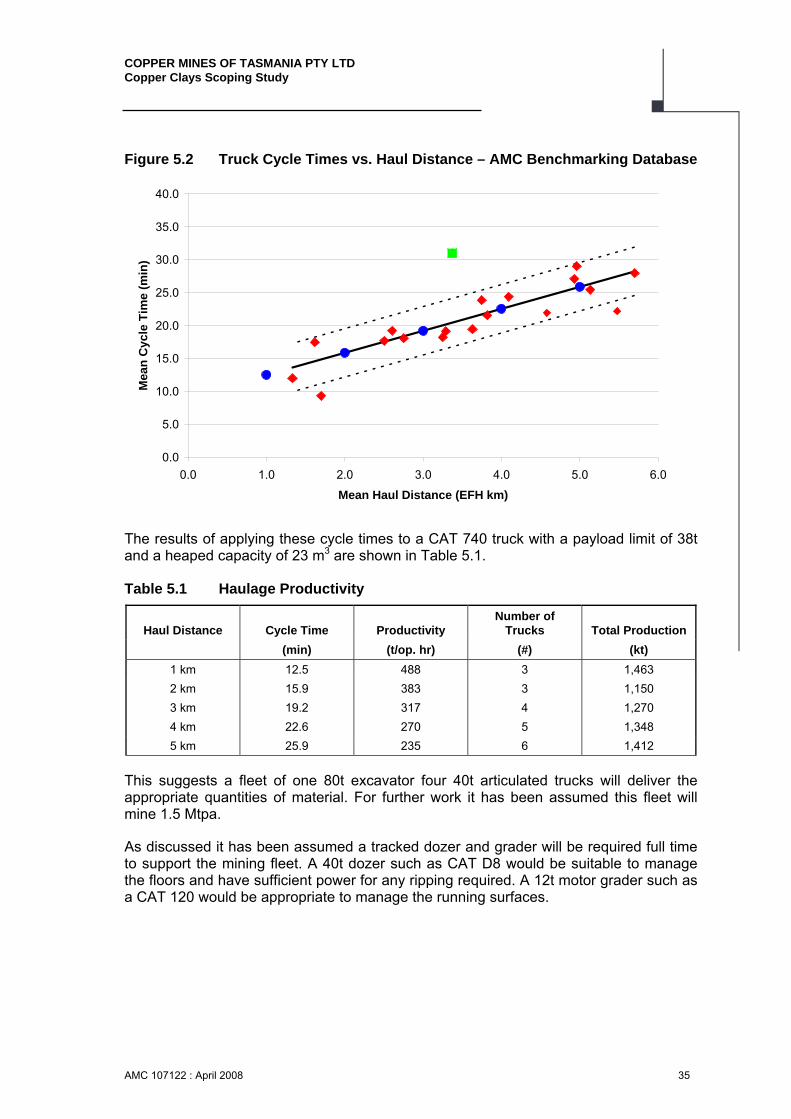
COPPER MINES OF TASMANIA PTY LTD Copper Clays Scoping Study
AMC 107122 : April 2008 35
Figure 5.2 Truck Cycle Times vs. Haul Distance – AMC Benchmarking Database
0.0
5.0
10.0
15.0
20.0
25.0
30.0
35.0
40.0
0.0 1.0 2.0 3.0 4.0 5.0 6.0
Mean Haul Distance (EFH km)
Mea
n C
ycle
Tim
e (m
in)
The results of applying these cycle times to a CAT 740 truck with a payload limit of 38t and a heaped capacity of 23 m3 are shown in Table 5.1.
Table 5.1 Haulage Productivity
Haul Distance Cycle Time Productivity Number of
Trucks Total Production (min) (t/op. hr) (#) (kt)
1 km 12.5 488 3 1,463 2 km 15.9 383 3 1,150 3 km 19.2 317 4 1,270 4 km 22.6 270 5 1,348 5 km 25.9 235 6 1,412
This suggests a fleet of one 80t excavator four 40t articulated trucks will deliver the appropriate quantities of material. For further work it has been assumed this fleet will mine 1.5 Mtpa.
As discussed it has been assumed a tracked dozer and grader will be required full time to support the mining fleet. A 40t dozer such as CAT D8 would be suitable to manage the floors and have sufficient power for any ripping required. A 12t motor grader such as a CAT 120 would be appropriate to manage the running surfaces.

COPPER MINES OF TASMANIA PTY LTD Copper Clays Scoping Study
AMC 107122 : April 2008 36
5.2 Mining Costs
5.2.1 Operating Cost
Hourly hire rates (including operator and fuel) for the type of equipment required are based on what is presently being charged on the West coast of Tasmania. The rates are shown in Table 5.2.
Table 5.2 Hourly Equipment Operating Cost
Rate Equipment
($/eng. Hr.) Komatsu PC800 Excavator 340 CAT 740 Articulated Truck 220 CAT D8 Tracked Dozer 267 CAT 120 Grader 190 CAT 980 FEL 190
Assuming a fleet of four trucks, and one excavator, dozer and grader are working 2,970 hrs pa, the total cost will be A$5.0 Mpa. With a mining rate of 1.5 Mtpa, the unit cost will be A$3.33 /t mined.
In the upper benches, above 2,330 mRl, due to the mining clays and the waste dumps additional ancillary cost will be incurred. It has been assumed an additional dozer will be required and the mining rate has been reduced by 20%. This makes the total cost A$5.8M for 1.2 Mt, giving a unit cost of A$4.81.
It is not possible to estimate accurately the quantity of material in the waste dumps, but AMC believe it is unlikely to be more than 10% of the material above 2,330 mRl, this is approximately 100,000 m3.
Additional to this site will require geology and mining supervision, assuming this is the equivalent of one full time person, allowing for a vehicle and on costs this will cost approximately A$250 kpa, or A$0.17 /t.
This gives a total rock mining cost of A$3.50 /t below 2,330 mRl and A$5.00 /t above 2,330 mRl.
Due to the low strength of the clays being mined no drill and blast cost has been assumed. If D&B is required the geotechnical assessment suggests this will be isolated areas requiring paddock blasting. The cost of this is likely to be around A$0.50 /t for a maximum of 20% of the pit. This would equate to an average additional cost of A$0.10 /t. Sensitivity analysis suggests this will not be sufficient to influence the decision to proceed further with the pre-feasibility process.
No additional cost has been included for sheeting. AMC believe that despite excavating a pit in clays, the six wheel drive articulated trucks will operate efficiently with minimal sheeting supplied from material selectively stockpiled from mining the Iron Blow waste dumps. This is based on experience of seeing similar trucks operating in wet clays in
COPPER MINES OF TASMANIA PTY LTD Copper Clays Scoping Study
AMC 107122 : April 2008 37
Laos during the wet season. Should sheeting be required it will be for a maximum of 20 benches, assuming a 200m length, 15m wide and 1m thick, this will be a total of 60,000 m3 of sheeting. If this were to cost A$20 /m3 the total cost would equate to an additional A$0.20 /t. This has been included in the cost sensitivity.
Grade control drilling is estimated to cost ~$60.00 /m and assays presently cost A$13.00 /sample. Hence a total cost has been estimated at A$75.00 /m. Assuming a 10m x 5m pattern, that 70% of the drilling will be in ore and a bulk density of 2.2 t/bcm, grade control cost will be:
$75.00 / (50 m3 x 2.2 x 70%) = A$1.00 /t of ore
5.2.2 Capital Cost
The mining capital estimate is A$1.75M. This includes A$1.0M for treating 500 kt of water pumped from the Iron Blow at a cost of A$2/t (provided by CMT), and A$750k for general site set up. The items included are shown in Table 5.2.
Table 5.3 Capital Cost
Cost Item (k$)
Site Access Road 25 Vehicle Washdown 25 Contractor Mobilisation 50 Workshop 50 Hardstand 50 Office and Crib Room 50 Dewatering 100 Power Reticulation 50 IT and Coms 20 Security and Safety 50 Water Reticulation 50 Sediment Traps 25 Fuel Storage 50 Contingency (30%) 179 TOTAL 774
5.3.3 Site Rehabilitation Cost
Mine site rehabilitation has been estimated at A$750k, this includes:
• 1,200 hrs of equipment hire at A$250 /hr to A$300k.
• 4 km of fence at A$50 /m to A$200k.
• Revegetation and other activities to A$250k.
It has been assumed the plant will have salvage value of 50% of its capital cost of A$6M, of this A$1.5m will be required for deconstruction, transport and site rehabilitation, leaving a surplus of A$1.5M.

COPPER MINES OF TASMANIA PTY LTD Copper Clays Scoping Study
AMC 107122 : April 2008 38
5.3 Dilution and Mining Recovery
The mineralised zone is reasonably wide, ~40m, and the material on the boundary contains some copper so dilutant material will generally have some grade. Hence only minimal dilution, 5% with 95% recovery, has been assumed. The dilutant has been assumed to have no grade.

COPPER MINES OF TASMANIA PTY LTD Copper Clays Scoping Study
AMC 107122 : April 2008 39
6 LG OPTIMISATION
Lersch-Grossman Optimisation (LG) identified potential for a pit with approximately 900 kt to 1,000 kt of ore at a grade of 1.9% Cu with a strip ratio of around 6.0 t:t. This would provide between 10 kt and 11 kt of recovered Cu.
Optimisation was performed using the Whittle programming 4X implementation of the Lersch-Grossman open pit optimisation algorithm.
6.1 LG Inputs and Cut off Grades
The parameters used for the LG are shown in Table 6.1.
Table 6.1 LG Optimisation Parameters
Costs
Mining Rock Above 2,330mRl $5.00 /t rock Below 2,330mRl $3.50 /t rock Treatment $10.00 /t ore Grade Control & Geology $1.00 /t ore Administration $1.00 /t ore
Mining and Treatment Factors
Dilution 5.0% Mining Recovery 95.0% Metallurgical Recovery 65.0% Concentrate Grade 45.0% Cu
Copper Price
High Sensitivity US$8,000 /t Base Case US$6,700 /t Low Sensitivity US$5,000 /t Very Low Sensitivity US$2,000 /t
Exchange Rate 0.86 US$/A$
Discounting Factors
Cost of capital 8.0% Treatment rate 250.00 ktpa
Royalty 5.0% of net revenue
Realisation Costs
Transport US$150 /t concentrate Treatment Charge US$45 /t concentrate Refining Charge US$0.05 /lb Cu Consolidated US$533 /t Cu in conc. Payable Metal 96.6% Cu in conc.

COPPER MINES OF TASMANIA PTY LTD Copper Clays Scoping Study
AMC 107122 : April 2008 40
The mining, treatment and grade control costs have been discussed earlier. An administration cost of A$1.00/t of ore has been assumed to allow for any additional administration required above the present CMT operation.
The mining and treatment factors were discussed under the relevant sections.
Copper prices were selected in discussion with CMT to cover a range of potential scenarios and test the sensitivity of the project to factors which influence revenue.
Realisation costs were provided by CMT and the royalty was taken from the recent benchmarking study.
The LG input parameters give the cut off grades shown in Table 6.2.
Table 6.2 Cut off Grade
Cut off Grade
Copper Net Revenue
High Sensitivity $7,948 /t Base Case $6,561 /t Low Sensitivity $4,747 /t Very Low Sensitivity $1,546 /t
Ore Costs $12.00 /t ore
Mill Feed COG
High Sensitivity 0.23% Base Case 0.28% Low Sensitivity 0.39% Very Low Sensitivity 1.19%
Mining COG
High Sensitivity 0.24% Base Case 0.30% Low Sensitivity 0.41% Very Low Sensitivity 1.25%
The COG for the very low sensitivity at US$2,000 /t gets close to the head grade of the deposit at ~1.5% Cu. The large jump in COG between US$5,000 /t and US$2,000 /t is due to a significant quantity of the realisation costs being fixed per tonne of contained copper regardless of the commodity price.
6.2 LG Slope Parameters
The slope parameters used in the LG optimisation are based on the geotechnical analysis described in Section 3. Initial optimisation and design work indicated a relatively high wall; over 100m in places, to the north of the pit would be formed in relatively competent rock. This area was given an inter-ramp wall angle of 45º. The southern wall exposed two different geological domains; below 2,280 mRl the wall will be excavated in oxidised limestone. This is considered to be free draining and of medium strength and

COPPER MINES OF TASMANIA PTY LTD Copper Clays Scoping Study
AMC 107122 : April 2008 41
an inter-ramp wall angle of 37º was applied. Above 2,280 mRl the wall will be excavated in highly weathered clays which will not be free draining; an inter-ramp angle of 27º was applied in this area.
6.3 LG Optimisation Results
LG optimisations were run generating a suite of shells ranging in size from 1.5 Mt of rock to 22 Mt. The contents were then classified as mill feed and waste, and operating cash surpluses estimated based on the parameters in Table 6.1. The results of this are shown in Figure 6.1 and 6.2.
Figure 6.1 LG Optimisation Total Pit Contents vs. Recovered Copper
-
2.0
4.0
6.0
8.0
10.0
12.0
14.0
16.0
18.0
- 200.0 400.0 600.0 800.0 1,000.0 1,200.0 1,400.0 1,600.0 1,800.0 2,000.0Mill Feed (kt)
Rec
over
ed C
oppe
r (kt
)
Cu Recovered @ US$2,000/t Cu Recovered @ US$5,000/tCu Recovered @ US$6,700/t Cu Recovered @ US$8,000/t

COPPER MINES OF TASMANIA PTY LTD Copper Clays Scoping Study
AMC 107122 : April 2008 42
Figure 6.2 LG Optimisation Total Mill Feed vs. Operating Cash Surplus
(20.0)
(10.0)
-
10.0
20.0
30.0
40.0
- 500.0 1,000.0 1,500.0 2,000.0 2,500.0Mill Feed (kt)
Ope
ratin
g Su
rplu
s (M
A$)
0.0
2.0
4.0
6.0
8.0
10.0
12.0
Surplus @ $2,000/t Cu Surplus @ $4,000/t Cu Surplus @ $6,700/t CuSurplus @ $8,000/t Cu Strip Ratio
The graph in Figure 6.1 shows how the shells grow from 300 kt of mill feed to 1,000 kt, steadily adding recovered metal. The slight decrease in the gradient of the line as the pit size increases indicates the material being added is of reducing grade.
Above 1,100 kt the shells jump in size to over 1,500 kt of mill feed, the gradient drops further and the lines begin to diverge. This indicates there is a break in the geological continuity and the shells have to increase in size significantly to add more mill feed. The drop in gradient and lines diverging indicates the material being added is of lower grade and getting close to the cut off grade. The contained metal line for the US$2,000 /t case is much lower than the other three cases due to the COG increasing significantly transferring more of the mineralisation to waste.
Figure 6.2 shows how the operating surplus with copper prices greater than US$5,000 /t grows up to shells with between 900 kt and 1,000 kt of mill feed. Above this the surplus starts to drop, then falls dramatically when the shells jump in size from 1,100 kt of mill feed to more than 1,500 kt. For the very low sensitivity case none of the shells generate a positive discounted surplus.
The flat strip ratio line up between 300 kt and 650 kt indicates the incremental material being added has a similar strip ratio but decreasing grade, above 650 kt the strip ratio begins to increase, implying better grade ore is being added to the shells.
A shell with between 900 kt and 1,000 kt of mill feed with a strip ratio of a little over 6:1 will give close to the optimal outcome for copper prices between US$5,000 /t and US$8.000 /t. This was selected as the basis for detailed design as it provides the optimal outcome at the base case and offers significant upside if the present prices are

COPPER MINES OF TASMANIA PTY LTD Copper Clays Scoping Study
AMC 107122 : April 2008 43
maintained. Also, it would be difficult to justify the capital required based on a mill feed quantity less the ~1 Mt as it would not provide a long enough project life.

COPPER MINES OF TASMANIA PTY LTD Copper Clays Scoping Study
AMC 107122 : April 2008 44
7 CONCEPTUAL OPEN PIT DESIGN, WASTE DUMPS AND SCHEDULING
The conceptual design has contents which very closely replicate the LG optimisation. This validates the optimisation as a good estimate of the potential mill feed quantity, head grade and strip ratio, when operational and access constraints are applied.
The schedule highlights the need for a twelve month pre-stripping period followed by approximately four years of treatment giving a project life of five years.
7.1 Design Parameters
The design has been based on a fleet of 40t six wheel drive articulated trucks. This equipment has better climbing capability than standard rigid body trucks allowing 1:7 gradient ramps to be used. The ramps are single lane, 10m wide, with potential for a passing bay approximately half way down the pit. This is acceptable as less than half of the total pit contents are below the start of the ramp, and by the time this section of the pit is being mined production will be down to a single fleet as all the benches have significant quantities of ore.
Working areas have been designed at no less than 10m wide.
The slope batter configurations have been designed to honour the inter-ramp angle used in the LG optimisation:
• North Wall – 20m batters at 60º with 7m wide berms.
• South Wall below 2,290 mRl – 20m batters at 50º with 7m wide berms.
• South Wall above 2,290 mRl – 10m batters at 40º with 7m berms.
7.2 Conceptual Pit Design
The conceptual pit design is shown in Figure 7.1.

COPPER MINES OF TASMANIA PTY LTD Copper Clays Scoping Study
AMC 107122 : April 2008 45
Figure 7.1 Conceptual Pit Design
The ramp has been designed to exit the pit at the lowest point in the topography 2,305 mRl. For the initial 30m vertically the ramp runs along the southern wall, in the hanging wall of the deposit. At approximately 2,270 mRl the ramp switches to the north side of the deposit and runs down the footwall. As the deposit is dipping relatively gently in this area, around 25º the ramp can be accommodated without incurring additional waste movements.
Between 2,305 mRl and 2,360 mRl benches are being mined which run the round the full head of the valley. This is illustrated in Figure 7.2.

COPPER MINES OF TASMANIA PTY LTD Copper Clays Scoping Study
AMC 107122 : April 2008 46
Figure 7.2 Conceptual Pit and Topography 2,340 mRl
In this region it should be possible to develop temporary ramps to access the benches and have two fleets working if required.
Above 2,360 mRl the benches break into distinct sections, this is shown in Figure 7.3. It will not be reasonable to access these with ramps, and the material between 2,360 mRl and 2,400 mRl will require significant dozing to make it accessible with an excavator. Between 2,365 mRl and 2,400 mRl there is around 400 kt of rock.

COPPER MINES OF TASMANIA PTY LTD Copper Clays Scoping Study
AMC 107122 : April 2008 47
Figure 7.3 Conceptual Pit and Topography 2,375 mRl
7.3 Conceptual Design Contents
At a COG of 0.5% copper the conceptual design contains 6.4 Mt of rock, of which 950 kt is mill feed at a grade of 1.8% Cu containing 16.6 kt of copper and providing 10.8 kt of recovered copper. This gives a strip ratio of 5.9:1.
The detailed contents are shown in Table 7.1.

COPPER MINES OF TASMANIA PTY LTD Copper Clays Scoping Study
AMC 107122 : April 2008 48
Table 7.1 Conceptual Design Contents
Level Rock Mill Feed mRl kt kt % Cu t Cu t Cu Rec
2,390 0 - - - - 2,385 14 - - - - 2,380 59 - - - - 2,375 125 - - - - 2,370 93 - - - - 2,365 176 - - - - 2,360 132 - - - - 2,355 249 - - - - 2,350 143 0 0.8% 2 2 2,345 239 5 1.3% 62 40 2,340 238 10 1.3% 132 86 2,335 403 18 1.2% 221 144 2,330 219 13 1.1% 150 98 2,325 436 20 1.1% 224 146 2,320 230 20 1.4% 283 184 2,315 559 55 1.6% 870 565 2,310 208 43 1.8% 779 507 2,305 753 103 1.9% 2,001 1,301 2,300 203 54 1.5% 836 544 2,295 645 101 2.0% 2,007 1,305 2,290 140 57 2.7% 1,512 983 2,285 434 90 1.8% 1,597 1,038 2,280 84 40 2.2% 866 563 2,275 272 94 1.4% 1,275 829 2,270 96 58 1.6% 936 609 2,265 122 66 1.4% 915 595 2,260 49 36 1.5% 552 359 2,255 65 52 2.3% 1,187 771 2,250 16 13 1.7% 221 144 Total 6,403 948 1.8% 16,631 10,810
These contents are compared to the LG optimisation results in Figures 7.4 and 7.5.

COPPER MINES OF TASMANIA PTY LTD Copper Clays Scoping Study
AMC 107122 : April 2008 49
Figure 7.4 LG Optimisation and Mill Feed vs. Recovered Copper
-
2.0
4.0
6.0
8.0
10.0
12.0
14.0
16.0
18.0
- 200 400 600 800 1,000 1,200 1,400 1,600 1,800 2,000Mill Feed (kt)
Rec
over
ed C
oppe
r (kt
)
Cu Recovered @ US$2,000/t Cu Recovered @ US$5,000/t Cu Recovered @ US$6,700/tCu Recovered @ US$8,000/t Pit
Figure 7.5 LG Optimisation and Pit Total Mill Feed vs. Operating Cash Surplus and Strip Ratio
(20.0)
(10.0)
-
10.0
20.0
30.0
40.0
- 500.0 1,000.0 1,500.0 2,000.0 2,500.0Mill Feed (kt)
Ope
ratin
g Su
rplu
s (M
A$)
-
2.0
4.0
6.0
8.0
10.0
12.0
Surplus @ $2,000/t Cu Surplus @ $5,000/t Cu Surplus @ $6,700/t CuSurplus @ $8,000/t Cu Pit Surplus @$6,700/t Pit Strip RatioStrip Ratio
The mill feed provided by the pit design leads to a similar quantity of recovered copper to the optimisation runs, a strip ratio slightly below optimisation shells and a surplus in line with the optimisation shells. This indicates that the design has closely replicated the

COPPER MINES OF TASMANIA PTY LTD Copper Clays Scoping Study
AMC 107122 : April 2008 50
optimisation. This validates the results of the optimisation as good estimation of the potential of the copper clays.
7.4 Waste Disposal
Waste disposal is restricted by Lyell Highway to the south and the proximity to Gormanston. Conceptual designs have been prepared to assess the volume of the Iron Blow open pit and valley to the east of the deposit. These designs are shown in the isometric view in Figure 7.6.
Figure 7.6 Isometric View of Conceptual Pit and Waste Dumps
Allowing for a 30% swell the capacities are:
• Iron Blow Open Pit – 1,400,000 m3 or 1,000,000 bcm (assumed an additional 40m available below the present water surface).
• Valley Dump – 2.7 Mm3 or 2.1 Mbcm.
As the design will generate ~2.5 Mbcm of waste these dumps would have sufficient volume, including disposal of the tails in the Iron Blow.
The major issues with these locations would be:
• The Iron blow open pit has heritage values associated with it and back filling the pit may not be acceptable.
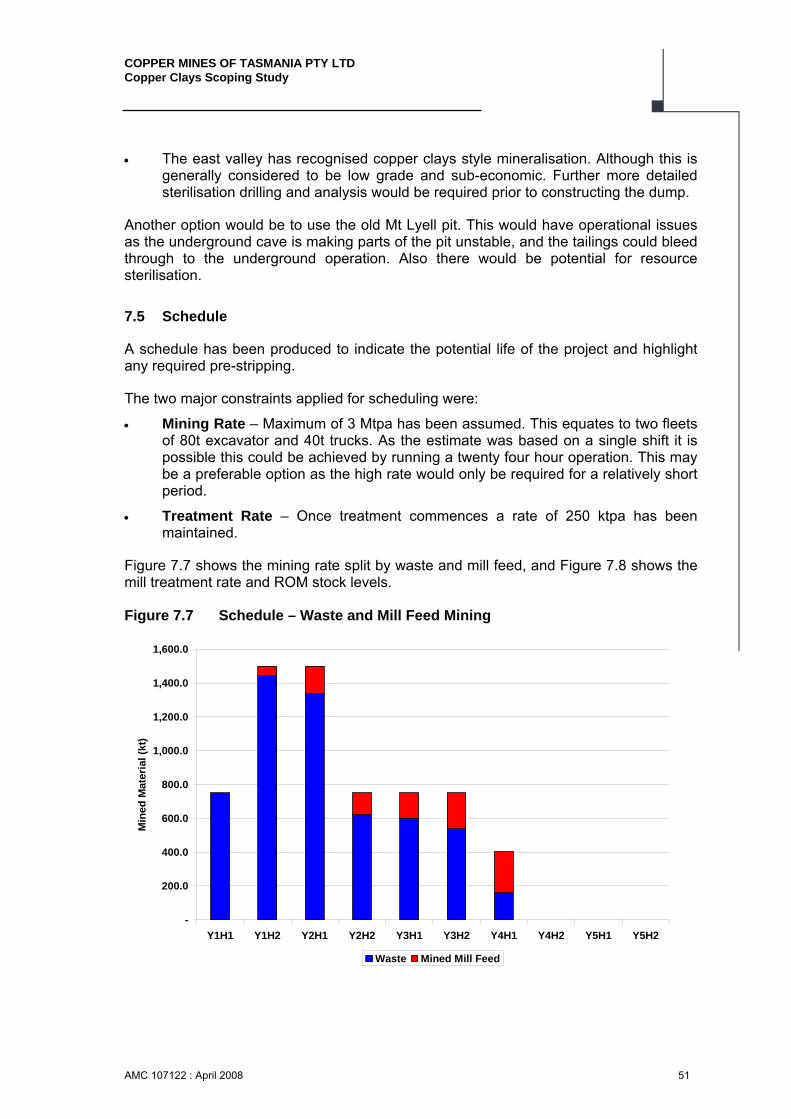
COPPER MINES OF TASMANIA PTY LTD Copper Clays Scoping Study
AMC 107122 : April 2008 51
• The east valley has recognised copper clays style mineralisation. Although this is generally considered to be low grade and sub-economic. Further more detailed sterilisation drilling and analysis would be required prior to constructing the dump.
Another option would be to use the old Mt Lyell pit. This would have operational issues as the underground cave is making parts of the pit unstable, and the tailings could bleed through to the underground operation. Also there would be potential for resource sterilisation.
7.5 Schedule
A schedule has been produced to indicate the potential life of the project and highlight any required pre-stripping.
The two major constraints applied for scheduling were:
• Mining Rate – Maximum of 3 Mtpa has been assumed. This equates to two fleets of 80t excavator and 40t trucks. As the estimate was based on a single shift it is possible this could be achieved by running a twenty four hour operation. This may be a preferable option as the high rate would only be required for a relatively short period.
• Treatment Rate – Once treatment commences a rate of 250 ktpa has been maintained.
Figure 7.7 shows the mining rate split by waste and mill feed, and Figure 7.8 shows the mill treatment rate and ROM stock levels.
Figure 7.7 Schedule – Waste and Mill Feed Mining
-
200.0
400.0
600.0
800.0
1,000.0
1,200.0
1,400.0
1,600.0
Y1H1 Y1H2 Y2H1 Y2H2 Y3H1 Y3H2 Y4H1 Y4H2 Y5H1 Y5H2
Min
ed M
ater
ial (
kt)
Waste Mined Mill Feed

COPPER MINES OF TASMANIA PTY LTD Copper Clays Scoping Study
AMC 107122 : April 2008 52
Figure 7.8 Schedule – Mill Feed Treatment and ROM Stocks
-
50.0
100.0
150.0
200.0
250.0
300.0
Y1H1 Y1H2 Y2H1 Y2H2 Y3H1 Y3H2 Y4H1 Y4H2 Y5H1 Y5H2
Mill
Fee
d an
d R
OM
Sto
cks
(kt)
Treated Mill Feed ROM Stock
A period of almost twelve months of mining is required prior to treatment commencing. This is stripping the sides of the hills at the head of the valley to access the mill feed in the valley floor. The mining rate has been kept low for the initial six months to account for the potential difficulties of mining the upper benches.
After a year of mining at 3 Mtpa to access the mill feed, the mining has been maintained at 1.5 Mtpa, a single fleet of equipment operating on a single shift. Regardless of this low mining rate there is a build up of in excess of twelve months of mill feed. There may be potential to slow the rate further but this will most likely increase the unit cost and increase the risk of losing ore if there is a wall failure.
In the feasibility study there will be potential to optimise the mining and treatment rates. There is no value in doing this presently due to the low level of accuracy of the mineralisation model and treatment parameters.
The schedule highlights the need for a twelve month pre-stripping period followed by approximately four years of treatment giving a project life of five years.
The detail of the schedule is shown in Table 7.2.

COPPER MINES OF TASMANIA PTY LTD Copper Clays Scoping Study
AMC 107122 : April 2008 53
Table 7.2 Schedule
Period TOTAL Y1H1 Y1H2 Y2H1 Y2H2 Y3H1 Y3H2 Y4H1 Y4H2 Y5H1 Y5H2 Y6H1
PhysicalsMining
Total Movements kt 6,402.8 750.0 1,500.0 1,500.0 750.0 750.0 750.0 402.8 - - - -Ore Mined
Tonnes kt 947.7 - 53.5 161.9 129.3 148.4 210.3 244.3 - - - -Grade % 1.8% - 1.2% 1.7% 1.8% 2.2% 1.7% 1.7% - - - -Metal t 16,631 - 650 2,674 2,299 3,295 3,645 4,069 - - - -
ROM StocksTonnes kt - - 36.9 41.2 64.6 149.9 269.2 144.2 19.2 - -Grade % - - 1.7% 1.8% 2.2% 1.7% 1.7% 1.7% 1.7% - -Metal t - - 610 733 1,435 2,598 4,500 2,411 321 - -
Mill FeedTonnes kt 947.7 - 53.5 125.0 125.0 125.0 125.0 125.0 125.0 125.0 19.2 -Grade % 1.8% - 1.2% 1.7% 1.7% 2.1% 2.0% 1.7% 1.7% 1.7% 1.7% -Metal t 16,631 - 650 2,065 2,176 2,593 2,481 2,167 2,090 2,090 321 -
Mill ProductionConcentrate t 24,023 - 939 2,982 3,143 3,745 3,584 3,130 3,018 3,018 464 -Grade % 45.0% - 45.0% 45.0% 45.0% 45.0% 45.0% 45.0% 45.0% 45.0% 45.0% -Metal t 10,810 - 423 1,342 1,414 1,685 1,613 1,408 1,358 1,358 209 -

COPPER MINES OF TASMANIA PTY LTD Copper Clays Scoping Study
AMC 107122 : April 2008 54
8 FINANCIAL ANALYSIS
The cashflow schedule generated a pre-tax NPV8% of more than A$30M for the base case copper price of US$6,500 /t. The NPV8% remains positive for all commodity prices tested greater than US$3,500 /t. The NPV8% has low sensitivity to changes in cost with the base case NPV changing by ~10% for a 20% change in operating cost.
Cashflow was scheduled based on the physical schedule and the financial and physical inputs shown in Table 8.1. These are the same as the LG optimisation inputs.
Table 8.1 Physical and Financial Parameters
Costs Mining Rock Above 2,330 mRl $5.00 /t rock Below 2,330 mRl $3.50 /t rock Treatment $10.00 /t ore Grade Control & Geology $1.00 /t ore Administration $1.00 /t ore Mining and Treatment Factors Dilution 5.0% Mining Recovery 95.0% Metallurgical Recovery 65.0% Concentrate Grade 45.0% Cu Copper Price High Sensitivity US$8,000 /t Base Case US$6,700 /t Low Sensitivity US$5,000 /t Very Low Sensitivity US$2,000 /t Exchange Rate 0.86 US$/A$ Discounting Factors Cost of capital 8.0% Treatment rate 250.00 ktpa Royalty 5.0% of net revenue Realisation Costs Transport US$150 /t concentrate Treatment Charge US$45 /t concentrate Refining Charge US$0.05 /lb Cu Consolidated US$533 /t Cu in conc. Payable Metal 96.6% Cu in conc.
Capital allowed for includes:
• Construction of a treatment plant – A$6M.
• Dewatering Iron Blow, mobilisation of mining fleet and set up of site – A$1,750k.
• Site rehabilitation – A$750k.
• Sale of the plant – A$1.5M credit.

COPPER MINES OF TASMANIA PTY LTD Copper Clays Scoping Study
AMC 107122 : April 2008 55
Table 8.2 shows the cashflow schedule for the project.
Table 8.2 Cashflow Schedule
Period TOTAL Y1H1 Y1H2 Y2H1 Y2H2 Y3H1 Y3H2 Y4H1 Y4H2 Y5H1 Y5H2 Y6H1
RevenueGross Revenue (On Payable Metal)
US$8,000/t Cu MUS$ 83.5 - 3.3 10.4 10.9 13.0 12.5 10.9 10.5 10.5 1.6 -US$6,700/t Cu MUS$ 70.0 - 2.7 8.7 9.2 10.9 10.4 9.1 8.8 8.8 1.4 -US$5,000/t Cu MUS$ 52.2 - 2.0 6.5 6.8 8.1 7.8 6.8 6.6 6.6 1.0 -US$2,000/t Cu MUS$ 20.9 - 0.8 2.6 2.7 3.3 3.1 2.7 2.6 2.6 0.4 -
Realisation CostsTreatment Cost MUS$ 1.1 - 0.0 0.1 0.1 0.2 0.2 0.1 0.1 0.1 0.0 -Refining Charge MUS$ 1.1 - 0.0 0.1 0.1 0.2 0.2 0.1 0.1 0.1 0.0 -Transport MUS$ 3.6 - 0.1 0.4 0.5 0.6 0.5 0.5 0.5 0.5 0.1 -TOTAL MUS$ 5.8 - 0.2 0.7 0.8 0.9 0.9 0.7 0.7 0.7 0.1 -
Exchange Rate 0.86 0.86 0.86 0.86 0.86 0.86 0.86 0.86 0.86 0.86 0.86
Net RevenueUS$8,000/t Cu MA$ 90.4 - 3.5 11.2 11.8 14.1 13.5 11.8 11.4 11.4 1.7 -US$6,700/t Cu MA$ 74.7 - 2.9 9.3 9.8 11.6 11.1 9.7 9.4 9.4 1.4 -US$5,000/t Cu MA$ 54.0 - 2.1 6.7 7.1 8.4 8.1 7.0 6.8 6.8 1.0 -US$2,000/t Cu MA$ 17.6 - 0.7 2.2 2.3 2.7 2.6 2.3 2.2 2.2 0.3 -
CostsRoyalty (5.00% of Net Revenue)
US$8,000/t Cu MA$ - 0.2 0.6 0.6 0.7 0.7 0.6 0.6 0.6 0.1 -US$6,700/t Cu MA$ - 0.1 0.5 0.5 0.6 0.6 0.5 0.5 0.5 0.1 -US$5,000/t Cu MA$ - 0.1 0.3 0.4 0.4 0.4 0.4 0.3 0.3 0.1 -US$2,000/t Cu MA$ - 0.0 0.1 0.1 0.1 0.1 0.1 0.1 0.1 0.0 -
OperatingMining MA$ 25.5 3.8 7.3 5.3 2.6 2.6 2.6 1.4 - - - -Grade Control MA$ 0.9 - 0.1 0.2 0.1 0.1 0.2 0.2 - - - -Treatment MA$ 9.5 - 0.5 1.3 1.3 1.3 1.3 1.3 1.3 1.3 0.2 -Admin MA$ 0.9 - 0.1 0.1 0.1 0.1 0.1 0.1 0.1 0.1 0.0 -TOTAL MA$ 36.9 3.8 7.9 6.8 4.1 4.1 4.2 3.0 1.4 1.4 0.2 -
CapitalMining MA$ 1.8 1.8Plant MA$ 6.0 2.0 2.0 2.0TOTAL MA$ 7.8 3.8 2.0 2.0 - - - - - - - -
Re-habilitationMining MA$ 0.8 0.8Plant MA$ (1.5) (1.5)TOTAL MA$ (0.8) - - - - - - - - - - (0.8)
CashflowUndiscounted
US$8,000/t Cu MA$ (7.5) (6.5) 1.9 7.1 9.2 8.6 8.2 9.4 9.4 1.4 0.8US$6,700/t Cu MA$ (7.5) (7.1) 0.0 5.1 6.9 6.4 6.2 7.5 7.5 1.2 0.8US$5,000/t Cu MA$ (7.5) (7.9) (2.4) 2.6 3.9 3.4 3.7 5.1 5.1 0.8 0.8US$2,000/t Cu MA$ (7.5) (9.3) (6.7) (1.9) (1.5) (1.7) (0.9) 0.7 0.7 0.1 0.8
DiscountedUS$8,000/t Cu MA$ (7.2) (6.1) 1.7 6.1 7.6 6.8 6.2 6.9 6.7 1.0 0.5US$6,700/t Cu MA$ (7.2) (6.6) 0.0 4.4 5.7 5.1 4.7 5.5 5.3 0.8 0.5US$5,000/t Cu MA$ (7.2) (7.3) (2.2) 2.2 3.2 2.7 2.8 3.7 3.6 0.5 0.5US$2,000/t Cu MA$ (7.2) (8.6) (6.0) (1.7) (1.3) (1.4) (0.7) 0.5 0.5 0.1 0.5
NPV 8%
US$8,000/t Cu MA$ 30.3US$6,700/t Cu MA$ 18.3US$5,000/t Cu MA$ 2.6US$2,000/t Cu MA$ (25.1)
The project produces a positive NPV8% for copper prices greater than US$5,000 /t, but has a negative NPV8% for the US$2,000 /t sensitivity case. The base case has an operating margin of around 50% of revenue. While this is a good margin the short project life, 3½ years of full plant production keeps the base case pre-tax NPV8% low

COPPER MINES OF TASMANIA PTY LTD Copper Clays Scoping Study
AMC 107122 : April 2008 56
at ~$18M. This does offer an opportunity should more mill feed be identified to extend the mine life and increase the NPV8%.
Figure 8.1 shows the cumulative undiscounted cashflow for each of the copper price scenarios.
Figure 8.1 Cumulative Cashflow
(40.0)
(30.0)
(20.0)
(10.0)
-
10.0
20.0
30.0
40.0
50.0
Y1H1 Y1H2 Y2H1 Y2H2 Y3H1 Y3H2 Y4H1 Y4H2 Y5H1 Y5H2 Y6H1
Cum
ulat
ive
Und
isco
unte
d C
ashf
low
($M
)
US$8,000/t Cu US$6,700/t Cu US$5,000/t Cu US$2,000/t Cu
For both the base case (US$6,500/t Cu) and the optimistic case (US$8,000 /t Cu) the project is cash positive by the beginning of Year three. The conservative case (US$5,000 /t Cu) becomes cash positive during Year three, while the very conservative case (US$3,500 /t Cu) struggles to pay back the capital.
The projects sensitivity to changes in cost was tested for a range from -20% to +20% for all costs including TC and RC charges. The results are shown in Figure 8.2.
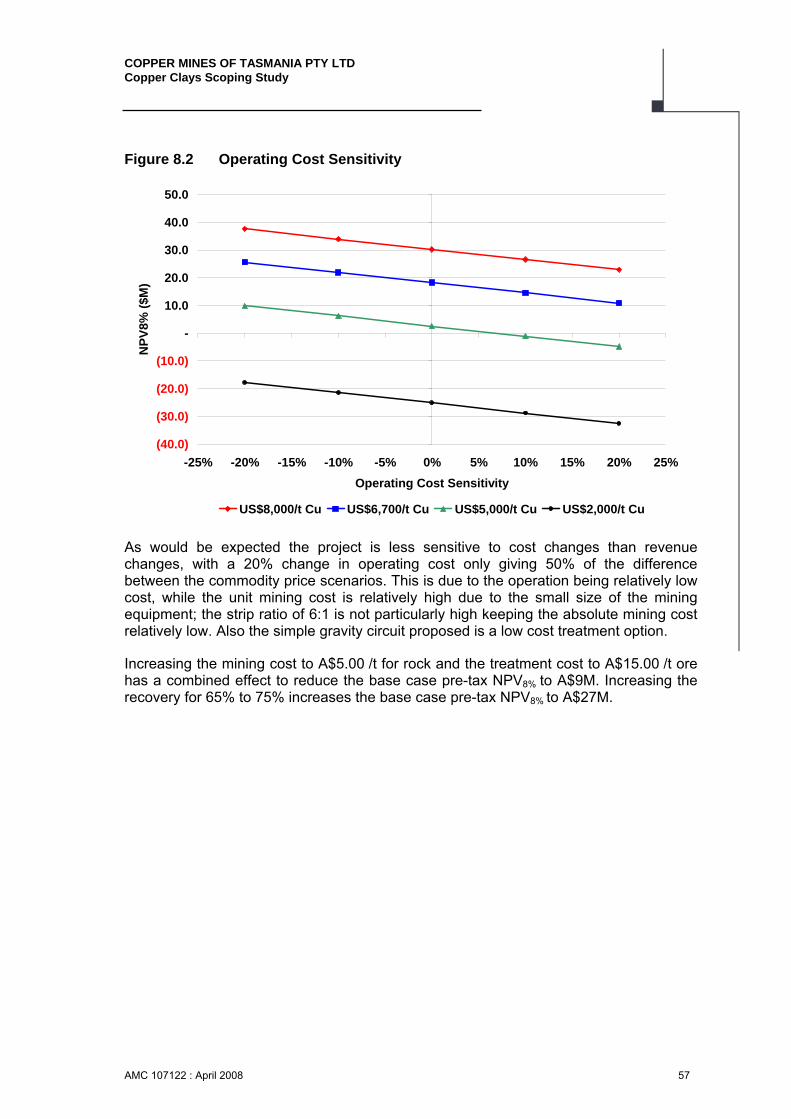
COPPER MINES OF TASMANIA PTY LTD Copper Clays Scoping Study
AMC 107122 : April 2008 57
Figure 8.2 Operating Cost Sensitivity
(40.0)
(30.0)
(20.0)
(10.0)
-
10.0
20.0
30.0
40.0
50.0
-25% -20% -15% -10% -5% 0% 5% 10% 15% 20% 25%Operating Cost Sensitivity
NPV
8% ($
M)
US$8,000/t Cu US$6,700/t Cu US$5,000/t Cu US$2,000/t Cu
As would be expected the project is less sensitive to cost changes than revenue changes, with a 20% change in operating cost only giving 50% of the difference between the commodity price scenarios. This is due to the operation being relatively low cost, while the unit mining cost is relatively high due to the small size of the mining equipment; the strip ratio of 6:1 is not particularly high keeping the absolute mining cost relatively low. Also the simple gravity circuit proposed is a low cost treatment option.
Increasing the mining cost to A$5.00 /t for rock and the treatment cost to A$15.00 /t ore has a combined effect to reduce the base case pre-tax NPV8% to A$9M. Increasing the recovery for 65% to 75% increases the base case pre-tax NPV8% to A$27M.

COPPER MINES OF TASMANIA PTY LTD Copper Clays Scoping Study
AMC 107122 : April 2008 58
9 PROJECT DEVELOPMENT SCHEDULE AND COST
Prior to making the decision to proceed with the project the following tasks will need to be completed:
• Diamond drilling programme – This will be required to gather data for geological analysis, metallurgical test work and geotechnical test work.
• Geological interpretation and modelling.
• Metallurgical and geotechnical test work.
• Pre-feasibility and feasibility studies for:
- Mining.
- Metallurgy and plant design.
- Tails dam location and design.
- Environmental and cultural impact.
AMC estimates the diamond drilling, geological interpretation and test work programs will take nine to twelve months to complete and cost approximately A$3M. The pre-feasibility and feasibility studies will require at least twelve months after completion of the drilling and test work programmes. The studies will cost around A$1M to A$1.5M.
Hence to take the project to the feasibility decision point is likely to take two years and cost approximately A$4M. This will need to be confirmed as the project progresses, particularly the cost of the feasibility study as this will be dependant on the outcome of the pre-feasibility study.
The first major milestone would be completion on the drilling and geological interpretation and modelling. The scoping study should be revisited at that stage to confirm there is value in moving to pre-feasibility.

COPPER MINES OF TASMANIA PTY LTD Copper Clays Scoping Study
AMC 107122 : April 2008 59
10 RISK ANALYSIS
The major risks which will require to be addressed before a decision can be made to proceed with the project are:
• Geological Model – The geological model is based on poor quality data. Further drilling and analysis is required to bring it to a JORC Indicated or measured standard.
• Iron Blow Water – The water presents a danger of sudden in rush. A plan is required to remove the water and ensure it remains dry for the period of mining. This may require significant remedial action.
• Historic Waste Dumps and Clay Slopes – Both these present a significant danger of collapse. The extent of the risk needs to be further evaluated through geotechnical analysis, and design and operating protocols developed to minimise the danger.
• Metallurgical – There is presently limited metallurgical understanding of the mineralised zones. There is a danger of the material needing crushing to liberate the native copper or the copper being in a form which cannot be separated by gravity. A well structured metallurgical test programme will be required to address this issue.
There are a number of other waste dumping, environmental and heritage risks which need to be addressed prior to mining. While these are important they do not have the similar potential to lead to failure of the project as the issues listed above.
10.1 Geological Model
The geological model is based on sparse data, some of which is very difficult to verify and maybe of dubious quality. This is discussed in detail in Section 2.
Risk – The resource modelled is not present (tonnes or grade).
Likelihood – There is a very high likelihood of this occurring without significant drilling and resource estimation work.
Remedial Action – A structured drilling and resource interpretation process is essential before any decision on mining can be made.
One of the key issues with the model is density. The density used was 2.2t /bcm. As there is potential that this is too high, the financial sensitivity was tested by changing the density and hence tonnage of the feed. The effects on the NPV8% were:
• 2.2t /bcm NPV8% $18M
• 2.0t /bcm NPV8% $16M
• 1.8t /bcm NPV8% $14M
Clearly confirming the density of the ore is a key risk which needs to be addressed.

COPPER MINES OF TASMANIA PTY LTD Copper Clays Scoping Study
AMC 107122 : April 2008 60
10.2 Iron Blow Water
A significant quantity of water is contained in the Iron Blow open pit, the surface of which is between 50m and 100m above the base of the valley where operations will occur. An adit is known to run from below the water level out into the hill side likely to be mined for the copper clays project. It is not know if this has been deliberately plugged or if it has collapsed, the latter is more likely. The position of the blockage is not known. There is no ramp into the pit to allow water to be easily pumped and provide access to the adit for remedial work.
Risk – There is significant energy stored in the water and mining the slope below before remedial work has removed the water exposes CMT to a potentially catastrophic sudden inrush with a risk of major damage to equipment and injury or death to personnel.
Likelihood – There is a very high likelihood of this occurring if remedial work is not performed prior to mining.
Remedial Action – The water will need to be removed prior to mining commencing. The contained water will require treatment prior to release. Pumping will need to continue to keep the water low and/or the adit will need remedial work to allow drainage. Lack of access will make these major tasks.
Opportunities – The Iron Blow water also presents a risk to the underground mine. A vent shaft is close by (~100m). Should a connection occur this presents a risk of a sudden inrush into the underground mine. Hence the cost of the remedial work may not need to be born by the open pit project.
Threats – Environmental responsibility for Iron Blow passes to CMT once any work is done on the site. If draining the water or other remedial work triggers this liability the additional cost may need to be accounted for (fully or partially) by the project.
10.3 Historic Waste Dumps
Waste from the Iron Blow has been tipped directly onto the slope above the working area. The material underneath the waste dumps is clay. There is seemingly no engineering design that has ‘keyed’ the waste into the material below. As discussed earlier, AMC believe the volume is unlikely to be more than 100,000 m3.
Risk – As the waste dumps have been tipped from the top they have formed at the angle of rill, this means there is no factor of safety and they will be close to collapse. Mining the slope below the waste dump presents a risk of a failure.
Likelihood – There is a high likelihood the dump will collapse if mining occurs below.
Remedial Action – The waste dump will require to be removed before work on the valley floor commences. Mining the dumps independently is not an option as equipment working on the top of the waste dump could trigger a failure. The waste dumps will require to be mined with the clay underneath them.

COPPER MINES OF TASMANIA PTY LTD Copper Clays Scoping Study
AMC 107122 : April 2008 61
10.4 Clays in Slopes
The natural slopes above the valley floor are clays sat on more competent weathered rock. These are likely to be saturated due to high rainfall, and below the Iron Blow, due to the adit running from the pit.
Risk – Mining the toe of the slopes at angles steeper than the natural surface angle will present a risk of failure of the slope. This is exacerbated by the waste dumps sitting on the slopes. Mining from the top will expose the clay and the contact between the clay and harder material to rainfall. This will increase the likelihood of a failure.
Likelihood – There is a high likelihood of a failure.
Remedial Action – If the slope is to be mined the pit designs will need to take the walls back to competent material, and mining protocols will need to be developed which will allow the slopes to dry after significant rainfall prior to mining recommencing. This may prevent mining from occurring during the winter months. Where a slope has had waste dumped on it protocols will be required which limit the time and the manner in which equipment works on the dumped material. This may involve using a dozer push down the dump to a lower level before it is excavated.
10.5 Metallurgical
It is believed the mineralised material is predominantly soft clay with liberated native copper which can be extracted by feeding directly to a gravity circuit. Some of the associated material may be hard and require comminution if any contained copper is to be extracted. The copper clays mineralogy is not presently well defined to assess this risk. Although it has been suggested that native copper represents the dominant copper mineral, other copper minerals such as cuprite, chalcocite, covellite, bornite and chalcopyrite have also been reported, with the sulphides likely becoming more abundant at depth. These copper minerals could be potentially recovered by gravity processing if they were present as liberated components in low SG clays, but more complex treatment options would be required if a significant proportion of the copper mineralisation was contained within the hard rock segment of the deposit.
Risk – Copper which is not in the form of native copper in soft clay will have a very poor recovery. It is unlikely that the amounts of hard rock material will be sufficient to justify a comminution circuit. The grade of any gravity circuit tail generated is likely to be lower than the underground ore head grade so that feeding a low grade gravity circuit tail into the already overloaded comminution circuit in the existing mill will displace better grade material. Also, feeding clay ore directly into the plant in conjunction with underground sulphide ore will have a deleterious effect on the overall process response and hence reduce copper recovery. Thus, combining either the clay ore or a gravity circuit tail with the main plant feed is not acceptable.
Likelihood – Hard zones, ~5% of the drilling, and areas of chalcopyrite have been noted. The extent of these is not fully understood, so the risk of a significant drop in recovery is moderate to high.

COPPER MINES OF TASMANIA PTY LTD Copper Clays Scoping Study
AMC 107122 : April 2008 62
Remedial Action – A well structure metallurgical test programme is required estimate the true quantities of material types.
10.6 Waste Dumps
The areas presently identified as potential waste dump sites have potential heritage and resource sterilisation issues. There are limited other options for waste disposal. Prior to commencement further investigation and analysis will be required to estimate the potential of resources which could be sterilised to assess the trade off between other not identified options and loosing access to the resources in the dump area.
10.7 Environmental and Heritage
Additional Environmental and heritage risks include:
• Water Discharge – Control of pit and site stormwater, and process discharge water quality, particularly turbidity. Also the impact of discharge on Linda Creek and Lake Burbury, this will require sediment retention / water treatment system.
• Tailings management – This presents a risk due to high clay and water content leading to poor settling. A suitable tailings dam site not yet identified.
• Acid Mine Drainage – Generation of acid drainage from waste rock and open cut during and post operation. Waste will need to be assessed for acid generation capacity (NAG etc.).
• Local community – Noise, vibration and dust from operation has potential to disturb the local community.
• Disturbance of cultural heritage sites – There are a few sites with cultural significance identified in the Godden Mackay assessment of 1994 upslope of the resource. The Iron Blow open cut is also an identified site that may require appropriate approvals if it is to be used for tailings / waste disposal.
• Disturbance of geo heritage features – Part of the area includes the listed geo-heritage feature of the ‘Linda Moraine’. This is a regional feature and exposure could be useful for further academic study.
• Disturbance to flora – Potential for threatened species will require a flora and fauna habitat survey prior to disturbance.
• Hydrocarbon management – A protocol for spill / contamination prevention and incident response will be required.
• Weed Management – Control of weed and plant disease (phytophthora) will require equipment wash down and inspection.

COPPER MINES OF TASMANIA PTY LTD Copper Clays Scoping Study
AMC 107122 : April 2008 63
11 CONCLUSIONS AND RECOMMENDATIONS
While the project still has a very high level of uncertainty AMC believes there is a justification to proceed with the work required to take the project to the next level of evaluation, which would be a Pre-feasibility study.
The Copper Clays project has the potential provide significant value to CMT, the analysis suggests the NPV at an 8% discount rate (NPV8%) around A$10M to A$20M for the base case copper price of US$6,700 /t, should prices remain at the present level of US$8,000 /t the project will generate a pre-tax NPV of approximately A$25M. This is based on a pit containing approximately 900,000t of ore at a grade of 1.9% Cu and a mass based strip ratio of 6:1.
Presently there is a very high level of uncertainty as there is limited geological, geotechnical and metallurgical understanding of the deposit. This would need to be addressed before the project could commence. As the geographical extent of project is limited, the total cost of addressing these issues should not be high.
The Pre-feasibility study should address the various mining and processing options, selecting the best for final analysis and costing in a Feasibility Study that would then form a basis for the investment decision. The cost of the final Feasibility Study would depend on the results from the Pre-feasibility study and the level of comfort required by CMT prior to proceeding with the project.
As part of the Feasibility Study plans and protocols would need to be developed to manage the risk presented by the water in the Iron Blow open pit.
COPPER MINES OF TASMANIA PTY LTD Copper Clays Scoping Study
APPENDIX A
AMC PRE-SCOPING REPORT
AMC 107122 : March 2008

Level 19, 114 William Street MELBOURNE VIC 3000 AUSTRALIA
Telephone +61 3 8601 3300 Facsimile +61 3 8601 3399
Ground Floor, 9 Havelock Street PERTH WA 6005 AUSTRALIA
Telephone +61 8 9481 6611 Facsimile +61 8 9481 6622
Level 12, 179 North Quay BRISBANE QLD 4000 AUSTRALIA
Telephone +61 7 3839 0099 Facsimile +61 7 3839 0077
www.amcconsultants.com.au
AMC Consultants Pty Ltd ABN 58 008 129 164
10 December 2007 Scot Clyde General Manager Copper Mines of Tasmania Dear Scot
DRAFT Copper Clays Pre-scoping Review – AMC 107122 AMC has performed an initial review of the Copper Clays project and recommends that the scoping study should proceed, but the analysis in this report should be reviewed at the end of or shortly after the initial site visit to confirm it is worth progressing with the full proposed scope of the scoping study. This review will include more expert opinion on the geotechnical and metallurgical aspects of the study, more detailed analysis of the mining issues, and use the geological model which AMC understands CMT are presently completing. The analysis suggests that the project is marginal applying conservative but realistic parameters, but if slightly more optimistic parameters could be achieved the project has potential to provide a significant operating surplus, possibly in excess of A$40M. This is undiscounted and includes no capital or depreciation. Yours sincerely, James Stoddart Principal Mining Engineer Distribution list: 3 copies to Mr xxx, xxx site 2 copies to Ms xxx, xxx site 1 copy to AMC xxx office
Copper Mines of Tasmania DRAFT Copper Clays
107122 Pre-scoping report v1.doc : 11 December 2007 2
QUALITY CONTROL
The signing of this statement confirms this report has been prepared and checked in accordance with the AMC Peer Review Process. AMC’s Peer Review Policy can be viewed at www.amcconsultants.com.au.
Project Manager
Type PM’s name in cell above, then delete this line of text
Signed Date
Peer Reviewer
Type PR’s name in cell above,
then delete this line of text Signed Date
IMPORTANT INFORMATION ABOUT THIS REPORT
Confidentiality This document and its contents are confidential and may not be disclosed, copied, quoted or published unless AMC Consultants Pty Ltd (“AMC”) has given its prior written consent. AMC accepts no liability for any loss or damage arising as a result of any person other than the named client acting in reliance on any information, opinion or advice contained in this document. This document may not be relied upon by any person other than the client, its officers and employees. Information AMC accepts no liability and gives no warranty as to the accuracy or completeness of information provided to it by or on behalf of the client or its representatives and takes no account of matters that existed when the document was transmitted to the client but which were not known to AMC until subsequently. Currency This document supersedes any prior documents (whether interim or otherwise)
dealing with any matter that is the subject of this document. Recommendations AMC accepts no liability for any matters arising if any recommendations contained in this document are not carried out, or are partially carried out, without further advice being obtained from AMC. Outstanding Fees No person (including the client) is entitled to use or rely on this document and its contents at any time if any fees (or reimbursement of expenses) due to AMC by its client are outstanding. In those circumstances, AMC may require the return of all copies of this document. JORC Requirements If a Client wishes to publish a mineral resource or ore reserve estimate prepared by AMC, it must first obtain the Competent Person’s written consent, not only to the estimate being published but also to the form and context of the published statement. The published statement must include a statement that the Competent Person’s written consent has been obtained.

Copper Mines of Tasmania DRAFT Copper Clays
107122 Pre-scoping report v1.doc : 11 December 2007 3
1 Introduction
AMC was requested to perform a quick, three day, review of the Copper Clays project prior to commencement of a scoping study. The purpose was to identify if there was any possibility of a project being developed on the potential resources and hence any value in proceeding with the proposed scoping study.
2 Analysis
CMT provided wireframes of the topography and the mineralized zone. To date no resource model has been provided. The wireframes were filled with blocks to produce a rock model with the mineralised zone flagged. The Whittle Programming 4X software was used to generate two suites of shells based on this model; one with 35º wall angles and one with 45º wall angles. These shells provided ore and waste volumes which could then be analysed for a range of physical and financial parameters. The base case set of parameters used was: • Head grade to mill 1.5% Cu • Dry bulk density 2.2 t/bcm • Mill recovery 65% • Mining cost A$7.50/t rock • Treatment cost A$10.00/t ore • Realisation cost US$700/t Cu • Copper price US$5,000/t • Exchange rate US$0.85 : A$1.00 The realisation cost is based on: • Treatment cost US$50/t concentrate • Refining cost US$0.05/lb (US$110/t Cu) • Transport US$100/t concentrate • Concentrate grade 45% Cu • Payable metal 95% These parameters are considered as conservative but realistic. To test the potential upside a set of optimistic but realistic parameters were tested. The changes were: • Head grade to mill 1.8% Cu • Dry bulk density 2.4 t/bcm • Mill recovery 70% The head grade chosen is marginally higher than that used in the 1997 analysis (1.4% Cu) but lower than the 1997 estimate for the western region of 2% Cu. As the LG shells focus on the better grade material near the Batchelor shaft the base case and upside cases seem appropriate.

Copper Mines of Tasmania DRAFT Copper Clays
107122 Pre-scoping report v1.doc : 11 December 2007 4
The density is higher than AMC would have anticipated; our experience is that the bulk densities of clays can be 1.6 or even lower. The 1997 analysis used ~2.5. 2.2 was selected in discussion with the site geologists. Mill recovery and costs are based on experience of similar gravity plants. Mining cost is high, but the conditions will require either significant sheeting or use of six wheel drive trucks. Additionally, the mining rate will be low and the potential for wet weather conditions will reduce the utilisation of the mining fleet. The cost is based on recent experience with 40t six wheel drive trucks mining clay in tropical conditions. The ore contents, strip ratios and un-discounted operating base case and upside case surpluses for the 35º and 45º suites of shells are shown in Figures 1 and 2. The operating surpluses have no capital or depreciation included and are only indicative of potential results. Figure 1 35º Shell Pit Contents, Strip Ratio and Base Case and Upside Case Operating Surpluses
-
5.0
10.0
15.0
20.0
25.0
30.0
35.0
40.0
45.0
- 500.0 1,000.0 1,500.0 2,000.0 2,500.0Ore tonnage (kt)
Ope
ratin
g Su
rplu
s (M
A$)
0.0
1.0
2.0
3.0
4.0
5.0
6.0
7.0
8.0
9.0
Strip
Rat
io (t
:t)
Upside Case Surplus Strip Ratio Base Case Surplus

Copper Mines of Tasmania DRAFT Copper Clays
107122 Pre-scoping report v1.doc : 11 December 2007 5
Figure 2 45º Shell Pit Contents, Strip Ratio and Base Case and Upside Case Operating Surpluses
-
5.0
10.0
15.0
20.0
25.0
30.0
35.0
40.0
45.0
- 500.0 1,000.0 1,500.0 2,000.0 2,500.0 3,000.0Ore tonnage (kt)
Ope
ratin
g Su
rplu
s (M
A$)
0.0
1.0
2.0
3.0
4.0
5.0
6.0
7.0
8.0
9.0
Strip
Rat
io (t
:t)
Upside Case Surplus Strip Ratio Base Case Surplus The analysis suggests that the base case using 35º slopes generates little or no surplus, but the upside 35º case generates around A$20M surplus from a pit containing approximately 1Mt of ore. The 45º base case highlights that the result is sensitive to slope angle generating an additional A$15M compared to the 35º base case. When the upside parameters are applied the contained ore increases to over 1.5Mt and the surplus increases to over A$40M.
3 Risks
The major risks for the project are: • Resource – The drilling is limited, some dating back to 1902. This represents a major
risk for grade, extent and density. Clearly this is a potential opportunity with improved grade or quantities.
• Mining – The material is predominantly soft clay which will be difficult to traffic and may require specialist mining equipment or transporting significant amounts of material into the pit.
• Weather/Water – The pit will go below the valley floor level at the head of a drainage. Coupled with the high rainfall this presents a risk of flooding and will most probably limit when the pit can be mined. Additionally, the Iron Blow pit is flooded and sits above the likely pit location; this may present a significant risk of water in-rush. It will also lead to high levels of moisture in the wall rocks.

Copper Mines of Tasmania DRAFT Copper Clays
107122 Pre-scoping report v1.doc : 11 December 2007 6
4 Conclusions
The analysis suggests that while the project is marginal applying conservative but realistic parameters, if slightly more optimistic parameters could be achieved the project has potential to provide a significant operating surplus. AMC recommends that the scoping study should proceed, but this analysis should be reviewed at the end of or shortly after the initial site visit to confirm it worth progressing with the full proposed scope of the scoping study.

107122 pre-scoping report v1.doc Appendix C - 1

COPPER MINES OF TASMANIA PTY LTD Copper Clays Scoping Study
APPENDIX B
PREVIOUS STUDIES
AMC 107122 : March 2008


COPPER MINES OF TASMANIA PTY LTD Copper Clays Scoping Study
APPENDIX C
DRILL HOLES PROVIDED
AMC 107122 : March 2008

Appendix x1 List of holes in drill database KL0001 KL0002 KL0013 KL0016 ML0008 ML0009 ML0010 ML0011 ML0012 05KLD001 05KLD002 05KLD003 05KLD004 05KLD006 96KLC0001 96KLC0002 96KLC0003

COPPER MINES OF TASMANIA PTY LTD Copper Clays Scoping Study
APPENDIX D
PLOTS OF WIREFRAMES
AMC 107122 : March 2008

3990 E
399
0 E
4000 E
400
0 E
4010 E
401
0 E
4020 E
402
0 E
4030 E
403
0 E
4040 E
404
0 E
4050 E
405
0 E
4060 E
406
0 E
4070 E
407
0 E
4080 E
408
0 E
4090 E
409
0 E
4100 E
410
0 E
4110 E
411
0 E
4120 E
412
0 E
4130 E
413
0 E
4140 E
414
0 E
4150 E
415
0 E
4160 E
416
0 E
4170 E
417
0 E
4180 E
418
0 E
4190 E
419
0 E
4200 E
420
0 E
4210 E
421
0 E
4220 E
422
0 E
4230 E
423
0 E
4240 E
424
0 E
4250 E
425
0 E
4260 E
426
0 E
4270 E
427
0 E
6764 N 6764 N
6768 N 6768 N
6772 N 6772 N
6776 N 6776 N
6780 N 6780 N
6784 N 6784 N
6788 N 6788 N
6792 N 6792 N
KL000
2ML0
008
ML001
105KLD
004
96KLC
0003
0.020.040.010.010.050.110.020.060.020.020.020.12
0.050.621.840.060.070.090.080.070.2
0.28
0.10.20.40.2
0.20.40.20.20.2
0.10.40.70.10.10.20.20.50.20.2
0.1
0.10.20.20.30.20.30.20.40.20.20.10.10.10.10.1
0.10.30.30.1
0.20.30.20.30.30.40.50.30.50.52.82.50.80.80.70.80.310.40.50.30.20.21.21.2
0.15170.02690.00840.00970.0050.00430.00460.00430.00340.00420.00360.00380.00380.00360.00220.00190.0020.00170.00120.00410.01430.00350.00340.00180.00160.00170.00490.00490.0086
KL000
2
ML001
1
96KLC
0003
0.020.040.010.010.050.110.020.060.020.020.020.120.050.621.840.060.070.090.080.070.20.28
0.20.30.20.30.30.40.50.30.50.52.82.50.80.80.70.80.310.40.50.30.20.21.21.2
0.15170.02690.00840.00970.0050.00430.00460.00430.00340.00420.00360.00380.00380.00360.00220.00190.0020.00170.00120.00410.01430.00350.00340.00180.00160.00170.00490.00490.0086
WIREFRAMES
CMT interpretation
AMC conservative interpretation
AMC optimistic interpretation
CMT Copper Clays - King Lyell Deposit
Section 6780.00 N
Scale 1:1000 Date: 18/01/08 AMC Consultants Pty Ltd
6710 N
671
0 N
6720 N
672
0 N
6730 N
673
0 N
6740 N
674
0 N
6750 N
675
0 N
6760 N
676
0 N
6770 N
677
0 N
6780 N
678
0 N
6790 N
679
0 N
6800 N
680
0 N
6810 N
681
0 N
6820 N
682
0 N
6830 N
683
0 N
6840 N
684
0 N
6850 N
685
0 N
6860 N
686
0 N
6870 N
687
0 N
6880 N
688
0 N
6890 N
689
0 N
6900 N
690
0 N
6910 N
691
0 N
6920 N
692
0 N
2210 Elev 2210 Elev
2220 Elev 2220 Elev
2230 Elev 2230 Elev
2240 Elev 2240 Elev
2250 Elev 2250 Elev
2260 Elev 2260 Elev
2270 Elev 2270 Elev
2280 Elev 2280 Elev
2290 Elev 2290 Elev
2300 Elev 2300 Elev
2310 Elev 2310 Elev
4118 E 4118 E 4120 E 4120 E 4122 E 4122 E 4124 E 4124 E 4126 E 4126 E 4128 E 4128 E 4130 E 4130 E 4132 E 4132 E 4134 E 4134 E 4136 E 4136 E 4138 E 4138 E 4140 E 4140 E
6630 N
663
0 N
6640 N
664
0 N
6650 N
665
0 N
6660 N
666
0 N
6670 N
667
0 N
6680 N
668
0 N
6690 N
669
0 N
6700 N
670
0 N
6710 N
671
0 N
6720 N
672
0 N
6730 N
673
0 N
6740 N
674
0 N
6750 N
675
0 N
6760 N
676
0 N
6770 N
677
0 N
6780 N
678
0 N
6790 N
679
0 N
6800 N
680
0 N
6810 N
681
0 N
6820 N
682
0 N
6830 N
683
0 N
KL000
2
ML001
105
KLD00
1
05KLD
002
05KLD
003
96KLC
0001
0.020.040.010.010.05
0.110.020.060.020.020.020.12
0.050.621.840.060.070.090.080.070.2
0.28
0.20.30.20.30.30.40.50.30.50.52.82.50.80.80.70.80.310.40.50.30.20.21.21.2
0.010.0050.0050.0050.010.010.010.010.010.020.020.020.010.020.010.01
0.010.0050.0050.0050.0050.0050.0050.0050.010.010.010.010.010.040.160.20.170.180.290.970.740.860.410.341.350.410.060.040.050.050.040.010.030.040.030.010.010.010.010.0050.270.050.0050.005
0.0050.005
0.0050.005
0.0050.005
0.0050.005
0.0050.005
0.0050.005
0.0050.005
0.0050.005
0.0050.005
0.0050.005
0.0050.005
0.0050.005
0.0050.005
0.180.010.320.320.005
0.0050.005
0.00970.00480.00610.00590.00580.00550.00570.07460.07460.00580.00360.00270.00320.00240.0030.0030.020.030.040.060.140.140.20.310.380.620.530.771.051.312.113.250.540.240.220.080.050.070.070.070.030.030.01
0.01
M
05KLD
001
05KLD
002
05KLD
003
96KLC
0001
0.20.30.20.30.30.40.50.30.50.52.82.50.80.80.70.80.310.40.50.30.20.21.21.2
0.01
0.005
0.005
0.0050.01
0.01
0.01
0.01
0.01
0.02
0.02
0.02
0.01
0.02
0.01
0.01
0.01
0.005
0.005
0.005
0.005
0.005
0.005
0.005
0.01
0.01
0.01
0.01
0.01
0.04
0.16
0.20.17
0.18
0.29
0.97
0.74
0.86
0.41
0.34
1.35
0.41
0.06
0.04
0.05
0.05
0.04
0.01
0.03
0.04
0.03
0.01
0.01
0.01
0.01
0.005
0.27
0.05
0.005
0.005
0.005
0.005
0.005
0.005
0.005
0.005
0.005
0.005
0.005
0.005
0.005
0.005
0.005
0.005
0.00
0 00
0.00970.00480.00610.00590.00580.00550.00570.07460.07460.00580.00360.00270.00320.00240.0030.0030.020.030.040.060.140.140.20.310.380.620.530.771.051.312.113.250.540.240.220.080.050.070.070.070.030.030.010.01
WIREFRAMES
CMT interpretation
AMC conservative interpretation
AMC optimistic interpretation
CMT Copper Clays - King Lyell Depos it
Section 4130.00 E
Scale 1:750 Date: 18/01/08 AMC Consultants Pty Ltd

6750 N
675
0 N
6755 N
675
5 N
6760 N
676
0 N
6765 N
676
5 N
6770 N
677
0 N
6775 N
677
5 N
6780 N
678
0 N
6785 N
678
5 N
6790 N
679
0 N
6795 N
679
5 N
6800 N
680
0 N
6805 N
680
5 N
2222 Elev 2222 Elev
2223 Elev 2223 Elev
2224 Elev 2224 Elev
2225 Elev 2225 Elev
2226 Elev 2226 Elev
2227 Elev 2227 Elev
2228 Elev 2228 Elev
2229 Elev 2229 Elev
2230 Elev 2230 Elev
2231 Elev 2231 Elev
2232 Elev 2232 Elev
2233 Elev 2233 Elev
2234 Elev 2234 Elev
2235 Elev 2235 Elev
2236 Elev 2236 Elev
2237 Elev 2237 Elev
2238 Elev 2238 Elev
2239 Elev 2239 Elev
2240 Elev 2240 Elev
2241 Elev 2241 Elev
2242 Elev 2242 Elev
2243 Elev 2243 Elev
2244 Elev 2244 Elev
2245 Elev 2245 Elev
2246 Elev 2246 Elev
2247 Elev 2247 Elev
2248 Elev 2248 Elev
2249 Elev 2249 Elev
2250 Elev 2250 Elev
4127 E 4127 E 4127.5 E 4127.5 E
4128 E 4128 E 4128.5 E 4128.5 E
4129 E 4129 E 4129.5 E 4129.5 E
4130 E 4130 E 4130.5 E 4130.5 E
4131 E 4131 E 4131.5 E 4131.5 E
4132 E 4132 E 4132.5 E 4132.5 E
4133 E 4133 E
6705 N
670
5 N
6710 N
671
0 N
6715 N
671
5 N
6720 N
672
0 N
6725 N
672
5 N
6730 N
673
0 N
6735 N
673
5 N
6740 N
674
0 N
6745 N
674
5 N
6750 N
675
0 N
6755 N
675
5 N
0.05
0.62
1.84
0.06
0.07
0.09
0.08
0.07
0.3
0.4
0.5
0.3
0.5
0.5
2.8
2.5
0.8
0.8
0.7
0.8
0.3
1
0.4
0.5
0.3
0.2
0.2
1 2
WIREFRAMES
CMT interpretation
AMC conservative interpretation
AMC optimistic interpretation
CMT Copper Clays - King Lyell Depos it
Section 4130.00 E
Scale 1:200 Date: 18/01/08 AMC Consultants Pty Ltd
6804 N
680
4 N
6805 N
680
5 N
6806 N
680
6 N
6807 N
680
7 N
6808 N
680
8 N
6809 N
680
9 N
6810 N
681
0 N
6811 N
681
1 N
6812 N
681
2 N
6813 N
681
3 N
6814 N
681
4 N
6815 N
681
5 N
6816 N
681
6 N
6817 N
681
7 N
6818 N
681
8 N
6819 N
681
9 N
6820 N
682
0 N
6821 N
682
1 N
6822 N
682
2 N
6823 N
682
3 N
6824 N
682
4 N
6825 N
682
5 N
6826 N
682
6 N
6827 N
682
7 N
6828 N
682
8 N
6829 N
682
9 N
6830 N
683
0 N
6831 N
683
1 N
6832 N
683
2 N
6833 N
683
3 N
6834 N
683
4 N
6835 N
683
5 N
6836 N
683
6 N
6837 N
683
7 N
6838 N
683
8 N
6839 N
683
9 N
6840 N
684
0 N
6841 N
684
1 N
6842 N
684
2 N
6843 N
684
3 N
6844 N
684
4 N
6845 N
684
5 N
6846 N
684
6 N
2246 Elev 2246 Elev
2247 Elev 2247 Elev
2248 Elev 2248 Elev
2249 Elev 2249 Elev
2250 Elev 2250 Elev
2251 Elev 2251 Elev
2252 Elev 2252 Elev
2253 Elev 2253 Elev
2254 Elev 2254 Elev
2255 Elev 2255 Elev
2256 Elev 2256 Elev
2257 Elev 2257 Elev
2258 Elev 2258 Elev
2259 Elev 2259 Elev
2260 Elev 2260 Elev
2261 Elev 2261 Elev
2262 Elev 2262 Elev
2263 Elev 2263 Elev
2264 Elev 2264 Elev
2265 Elev 2265 Elev
2266 Elev 2266 Elev
2267 Elev 2267 Elev
4128 E 4128 E
4128.5 E 4128.5 E
4129 E 4129 E
4129.5 E 4129.5 E
4130 E 4130 E
4130.5 E 4130.5 E
4131 E 4131 E
4131.5 E 4131.5 E
4132 E 4132 E
6709 N
670
9 N
6710 N
671
0 N
6711 N
671
1 N
6712 N
671
2 N
6713 N
671
3 N
6714 N
671
4 N
6715 N
671
5 N
6716 N
671
6 N
6717 N
671
7 N
6718 N
671
8 N
6719 N
671
9 N
6720 N
672
0 N
6721 N
672
1 N
6722 N
672
2 N
6723 N
672
3 N
6724 N
672
4 N
6725 N
672
5 N
6726 N
672
6 N
6727 N
672
7 N
6728 N
672
8 N
6729 N
672
9 N
6730 N
673
0 N
6731 N
673
1 N
6732 N
673
2 N
6733 N
673
3 N
6734 N
673
4 N
6735 N
673
5 N
6736 N
673
6 N
6737 N
673
7 N
6738 N
673
8 N
6739 N
673
9 N
6740 N
674
0 N
6741 N
674
1 N
6742 N
674
2 N
6743 N
674
3 N
6744 N
674
4 N
6745 N
674
5 N
6746 N
674
6 N
6747 N
674
7 N
6748 N
674
8 N
6749 N
674
9 N
6750 N
675
0 N
6751 N
675
1 N
0.01
0.04
0.16
0.2
0.17
0.18
0.29
0.97
0.74
0.86
0.41
0.34
1.35
0.41
0.06
0.04
0.05
0.05
0.04
0.01
0.03
0.04
0.04
0.06
0.14
0.14
0.2
0.31
0.38
0.62
0.53
0.77
1.05
1.31
2.11
3.25
0.54
0.24
0.22
0.08
0.05
0.07
0.07
WIREFRAMES
CMT interpretation
AMC conservative interpretation
AMC optimistic interpretation
CMT Copper Clays - King Lyell Depos it
Section 4130.00 E
Scale 1:150 Date: 18/01/08 AMC Consultants Pty Ltd
6710 N
671
0 N
6720 N
672
0 N
6730 N
673
0 N
6740 N
674
0 N
6750 N
675
0 N
6760 N
676
0 N
6770 N
677
0 N
6780 N
678
0 N
6790 N
679
0 N
6800 N
680
0 N
6810 N
681
0 N
6820 N
682
0 N
6830 N
683
0 N
6840 N
684
0 N
6850 N
685
0 N
6860 N
686
0 N
6870 N
687
0 N
6880 N
688
0 N
6890 N
689
0 N
6900 N
690
0 N
6910 N
691
0 N
6920 N
692
0 N
2210 Elev 2210 Elev
2220 Elev 2220 Elev
2230 Elev 2230 Elev
2240 Elev 2240 Elev
2250 Elev 2250 Elev
2260 Elev 2260 Elev
2270 Elev 2270 Elev
2280 Elev 2280 Elev
2290 Elev 2290 Elev
2300 Elev 2300 Elev
2310 Elev 2310 Elev
4018 E 4018 E 4020 E 4020 E 4022 E 4022 E 4024 E 4024 E 4026 E 4026 E 4028 E 4028 E 4030 E 4030 E 4032 E 4032 E 4034 E 4034 E 4036 E 4036 E 4038 E 4038 E 4040 E 4040 E
6630 N
663
0 N
6640 N
664
0 N
6650 N
665
0 N
6660 N
666
0 N
6670 N
667
0 N
6680 N
668
0 N
6690 N
669
0 N
6700 N
670
0 N
6710 N
671
0 N
6720 N
672
0 N
6730 N
673
0 N
6740 N
674
0 N
6750 N
675
0 N
6760 N
676
0 N
6770 N
677
0 N
6780 N
678
0 N
6790 N
679
0 N
6800 N
680
0 N
6810 N
681
0 N
6820 N
682
0 N
6830 N
683
0 N
KL000
1
ML000
9
ML001
096
KLC00
02
96KLC
0003
0.010.020.080.120.10.041.133.470.831.061.990.14
5.215.520.60.80.71.21.22.3
1.9
2.44.810.60.42.42.421.42.41.80.90.413.3
0.10.10.20.5
0.30.50.30.50.20.20.1
0.04130.03380.0130.00780.00190.00340.00480.00480.00340.00290.00450.00430.01682.21.7911.41.935.620.80.240.190.170.160.180.230.150.110.210.40.120.030.060.11.160.010.11.171.651.40.30.3
0.15170.02690.00840.00970.0050.00430.00460.00430.00340.00420.00360.00380.00380.00360.00220.00190.0020.00170.00120.00410.01430.00350.00340.00180.00160.00170.00490.00490.0086
ML001
0
6KLC
0003
0.10.10.20.50.30.50.30.50.20.20.1
WIREFRAMES
CMT interpretation
AMC conservative interpretation
AMC optimistic interpretation
CMT Copper Clays - King Lyell Depos it
Section 4030.00 E
Scale 1:750 Date: 18/01/08 AMC Consultants Pty Ltd
6825 N
682
5 N
6830 N
683
0 N
6835 N
683
5 N
6840 N
684
0 N
6845 N
684
5 N
6850 N
685
0 N
6855 N
685
5 N
6860 N
686
0 N
6865 N
686
5 N
6870 N
687
0 N
6875 N
687
5 N
6880 N
688
0 N
6885 N
688
5 N
6890 N
689
0 N
2266 Elev 2266 Elev
2267 Elev 2267 Elev
2268 Elev 2268 Elev
2269 Elev 2269 Elev
2270 Elev 2270 Elev
2271 Elev 2271 Elev
2272 Elev 2272 Elev
2273 Elev 2273 Elev
2274 Elev 2274 Elev
2275 Elev 2275 Elev
2276 Elev 2276 Elev
2277 Elev 2277 Elev
2278 Elev 2278 Elev
2279 Elev 2279 Elev
2280 Elev 2280 Elev
2281 Elev 2281 Elev
2282 Elev 2282 Elev
2283 Elev 2283 Elev
2284 Elev 2284 Elev
2285 Elev 2285 Elev
2286 Elev 2286 Elev
2287 Elev 2287 Elev
2288 Elev 2288 Elev
2289 Elev 2289 Elev
2290 Elev 2290 Elev
2291 Elev 2291 Elev
2292 Elev 2292 Elev
2293 Elev 2293 Elev
2294 Elev 2294 Elev
2295 Elev 2295 Elev
2296 Elev 2296 Elev
2297 Elev 2297 Elev
2298 Elev 2298 Elev
2299 Elev 2299 Elev
2300 Elev 2300 Elev
2301 Elev 2301 Elev
2302 Elev 2302 Elev
4026 E 4026 E 4026.5 E 4026.5 E
4027 E 4027 E 4027.5 E 4027.5 E
4028 E 4028 E 4028.5 E 4028.5 E
4029 E 4029 E 4029.5 E 4029.5 E
4030 E 4030 E 4030.5 E 4030.5 E
4031 E 4031 E 4031.5 E 4031.5 E
4032 E 4032 E 4032.5 E 4032.5 E
4033 E 4033 E 4033.5 E 4033.5 E
6695 N
669
5 N
6700 N
670
0 N
6705 N
670
5 N
6710 N
671
0 N
6715 N
671
5 N
6720 N
672
0 N
6725 N
672
5 N
6730 N
673
0 N
6735 N
673
5 N
6740 N
674
0 N
6745 N
674
5 N
6750 N
675
0 N
6755 N
675
5 N
6760 N
676
0 N
6765 N
676
5 N
0.01
0.02
0.08
0.12
0.1
0.04
1.13
3.47
0.83
1.06
1.99
0.14
0.8
0.7
1.2
1.2
2.3
1.9
2.4
4.8
1
0.6
0.4
2.4
2.4
2
1.4
2.4
1.8
0.9
0.413.3
0.1
0.1
0.2
0.5
0.3
0.5
0.3
0.5
0.2
0.013
0.0078
0.0019
0.0034
0.0048
0.0048
0.0034
0.0029
0.0045
0.0043
0.0168
2.2
1.79
11.4
1.93
5.62
0.8
0.24
0.19
0.17
0.16
0.18
0.23
WIREFRAMES
CMT interpretation
AMC conservative interpretation
AMC optimistic interpretation
CMT Copper Clays - King Lyell Depos it
Section 4030.00 E
Scale 1:250 Date: 18/01/08 AMC Consultants Pty Ltd

COPPER MINES OF TASMANIA PTY LTD Copper Clays Scoping Study
APPENDIX E
HOLES USED IN ESTIMATING TONNES AND GRADE
AMC 107122 : March 2008

Appendix x3 List of holes used for resource estimation KL0001 KL0002 KL0013 KL0016 ML0008 ML0009 ML0010 ML0011 ML0012 05KLD002 05KLD006 96KLC0001 96KLC0002

COPPER MINES OF TASMANIA PTY LTD Copper Clays Scoping Study
APPENDIX F
COMPARISON OF MODEL CONTENTS
AMC 107122 : March 2008

ESTIMATE GENERATED using AMC optimistic wireframe cu_optr/pt14/01/2008
Global ResourceZONE TONNES Cu%Waste ########Ore ######## 1.07
Resource with CUT OFF GRADE > 0.7%ZONE TONNES Cu %Ore ######## 1.53
ESTIMATE GENERATED using AMC conservative wireframe cu_wftr/pt11/01/2008
Global ResourceZONE TONNES Cu%Waste ########Ore ######## 0.90
Resource with CUT OFF GRADE > 0.7%ZONE TONNES Cu %Ore ######## 1.61
ESTIMATE GENERATED USING CMT cu_mintr/pt17/01/2008
Global ResourceZONE TONNES Cu%Waste ########
Ore ######## 0.64
Resource with CUT OFF GRADE > 0.7%ZONE TONNES Cu %
Ore 919,227 1.23
RAW STATISTICS
AMC Raw drillholedata subset withincu_optr/pt (Exploration potential)
No. Samples Max Min Mean Std Dev Variance
Co-eff
VariationLength (m) 146 14 0.04 1.51 1.14 1.3 0.76Copper (%) 141 15.5 0.01 1.22 2.13 4.54 1.75
AMC Raw drillholedata subset withincu_wftr/pt (conservative)
No. Samples Max Min Mean Std Dev Variance
Co-eff
VariationLength (m) 142 14 0.04 1.52 1.15 1.32 N/ACopper (%) 137 15.5 0.01 1.15 1.88 3.55 N/ACMT Raw drillholedata subset withincu_mintr/pt
No. Samples Max Min Mean Std Dev Variance
Co-eff
VariationLength (m) 140 3.05 0.31 1.44 0.51 0.26 N/ACopper (%) 133 11.4 0.002 0.84 1.38 1.92 N/A

COMPOSITED STATISTICSAMC Composited1m drillhole datasubset withincu_optr/pt (Exploration potential)
No. Samples Max Min Mean Std Dev
Variance Co-eff
VariationLength (m) 220 0.54 1 0.99 0.06 0.004 0.06
Copper (%) 206 14.16 0.01 1.22 1.8 3.23 1.48
AMC Composited1m drillhole datasubset withincu_wftr/pt (conservative)
No. Samples Max Min Mean Std Dev
Variance Co-eff
VariationLength (m) 215 0.54 1 0.99 0.06 0.004 0.06Copper (%) 201 14.16 0.01 1.21 1.75 3.06 N/A
CMT Composited1m drillhole datasubset withincu_mintr/pt
No. Samples Max Min Mean Std Dev
Variance Co-eff
VariationLength (m) 201 1 0.50 0.99 0.05 0.002 N/ACopper (%) 193 11.4 0.002 0.86 1.25 1.57 N/A

COPPER MINES OF TASMANIA PTY LTD Copper Clays Scoping Study
APPENDIX G
UPSIDE MODEL SECTIONS
AMC 107122 : March 2008

6710 N
671
0 N
6720 N
672
0 N
6730 N
673
0 N
6740 N
674
0 N
6750 N
675
0 N
6760 N
676
0 N
6770 N
677
0 N
6780 N
678
0 N
6790 N
679
0 N
6800 N
680
0 N
6810 N
681
0 N
6820 N
682
0 N
6830 N
683
0 N
6840 N
684
0 N
6850 N
685
0 N
6860 N
686
0 N
6870 N
687
0 N
6880 N
688
0 N
6890 N
689
0 N
6900 N
690
0 N
6910 N
691
0 N
6920 N
692
0 N
6930 N
693
0 N
6940 N
694
0 N
6950 N
695
0 N
2210 Elev 2210 Elev
2220 Elev 2220 Elev
2230 Elev 2230 Elev
2240 Elev 2240 Elev
2250 Elev 2250 Elev
2260 Elev 2260 Elev
2270 Elev 2270 Elev
2280 Elev 2280 Elev
2290 Elev 2290 Elev
2300 Elev 2300 Elev
2310 Elev 2310 Elev
2320 Elev 2320 Elev
2330 Elev 2330 Elev
4020 E 4020 E 4022 E 4022 E 4024 E 4024 E 4026 E 4026 E 4028 E 4028 E 4030 E 4030 E 4032 E 4032 E 4034 E 4034 E 4036 E 4036 E 4038 E 4038 E 4040 E 4040 E
6610 N
661
0 N
6620 N
662
0 N
6630 N
663
0 N
6640 N
664
0 N
6650 N
665
0 N
6660 N
666
0 N
6670 N
667
0 N
6680 N
668
0 N
6690 N
669
0 N
6700 N
670
0 N
6710 N
671
0 N
6720 N
672
0 N
6730 N
673
0 N
6740 N
674
0 N
6750 N
675
0 N
6760 N
676
0 N
6770 N
677
0 N
6780 N
678
0 N
6790 N
679
0 N
6800 N
680
0 N
6810 N
681
0 N
6820 N
682
0 N
6830 N
683
0 N
6840 N
684
0 N
6850 N
685
0 N
KL000
1
ML000
9
ML001
096
KLC00
02
96KLC
0003
0.010.020.080.120.10.041.133.470.831.061.990.14
5.215.520.60.80.71.21.22.3
1.9
2.44.810.60.42.42.421.42.41.80.90.413.3
0.10.10.20.5
0.30.50.30.50.20.20.1
0.04130.03380.0130.00780.00190.00340.00480.00480.00340.00290.00450.00430.01682.21.7911.41.935.620.80.240.190.170.160.180.230.150.110.210.40.120.030.060.11.160.010.11.171.651.40.30.3
0.15170.02690.00840.00970.0050.00430.00460.00430.00340.00420.00360.00380.00380.00360.00220.00190.0020.00170.00120.00410.01430.00350.00340.00180.00160.00170.00490.00490.0086
ML001
0
002
KLC00
030.10.10.20.50.30.50.30.50.20.20.1
Cu %
[ ABSENT]
[ 0. 0012, 0. 1]
[ 0. 1, 0. 3]
[ 0. 3, 0. 5]
[ 0. 5, 0. 8]
[ 0. 8, 1. 2]
[ 1. 2, 3]
[ 3, 7]
[ 7, 15. 6]
CMT Copper Clays - King Lyell Copper Model
Section 4030.00 E
Scale 1:850 Date: 18/01/08 AMC Consultants Pty Ltd
6720 N
672
0 N
6730 N
673
0 N
6740 N
674
0 N
6750 N
675
0 N
6760 N
676
0 N
6770 N
677
0 N
6780 N
678
0 N
6790 N
679
0 N
6800 N
680
0 N
6810 N
681
0 N
6820 N
682
0 N
6830 N
683
0 N
6840 N
684
0 N
6850 N
685
0 N
6860 N
686
0 N
6870 N
687
0 N
6880 N
688
0 N
6890 N
689
0 N
6900 N
690
0 N
6910 N
691
0 N
6920 N
692
0 N
6930 N
693
0 N
2220 Elev 2220 Elev
2230 Elev 2230 Elev
2240 Elev 2240 Elev
2250 Elev 2250 Elev
2260 Elev 2260 Elev
2270 Elev 2270 Elev
2280 Elev 2280 Elev
2290 Elev 2290 Elev
2300 Elev 2300 Elev
2310 Elev 2310 Elev
2320 Elev 2320 Elev
4068 E 4068 E 4070 E 4070 E 4072 E 4072 E 4074 E 4074 E 4076 E 4076 E 4078 E 4078 E 4080 E 4080 E 4082 E 4082 E 4084 E 4084 E 4086 E 4086 E 4088 E 4088 E 4090 E 4090 E
6630 N
663
0 N
6640 N
664
0 N
6650 N
665
0 N
6660 N
666
0 N
6670 N
667
0 N
6680 N
668
0 N
6690 N
669
0 N
6700 N
670
0 N
6710 N
671
0 N
6720 N
672
0 N
6730 N
673
0 N
6740 N
674
0 N
6750 N
675
0 N
6760 N
676
0 N
6770 N
677
0 N
6780 N
678
0 N
6790 N
679
0 N
6800 N
680
0 N
6810 N
681
0 N
6820 N
682
0 N
6830 N
683
0 N
KL001
3
05KLD
004
05KLD
006
0.030.02
0.02
0.040.040.020.050.050.110.16
4.7161.420.380.40.630.310.491.730.540.840.330.130.320.15
0.41
0.010.0050.0050.010.0050.0050.0050.0050.0050.0050.0050.0050.0050.0050.0050.0050.0050.0050.0050.0050.005
0.0050.0050.0050.0050.0050.0050.0050.0050.010.0050.0050.010.0050.0050.0050.0050.0050.0050.0050.0050.0050.005
0.010.010.010.020.010.010.010.010.010.010.020.010.010.010.010.020.020.01
0.020.020.020.020.010.020.010.010.010.010.010.010.010.010.010.01
05KLD
004
05KLD
0.01
0.005
0.005
0.01
0.005
0.005
0.005
0.005
0.005
0.005
0.005
0.005
0.005
0.005
0.005
0.005
0.005
0.005
0.005
0.005
0.005
0.005
0.005
0.005
0.005
0.005
0.005
0.005
0.005
0.01
0.005
0.005
0.01
0.005
0.005
0.005
0.005
0.005
0.005
0.005
0.005
0.005
0.005
Cu %
[ ABSENT]
[ 0. 0012, 0. 1]
[ 0. 1, 0. 3]
[ 0. 3, 0. 5]
[ 0. 5, 0. 8]
[ 0. 8, 1. 2]
[ 1. 2, 3]
[ 3, 7]
[ 7, 15. 6]
CMT Copper Clays - King Lyell Copper Model
Section 4080.00 E
Scale 1:750 Date: 18/01/08 AMC Consultants Pty Ltd

6720 N
672
0 N
6730 N
673
0 N
6740 N
674
0 N
6750 N
675
0 N
6760 N
676
0 N
6770 N
677
0 N
6780 N
678
0 N
6790 N
679
0 N
6800 N
680
0 N
6810 N
681
0 N
6820 N
682
0 N
6830 N
683
0 N
6840 N
684
0 N
6850 N
685
0 N
6860 N
686
0 N
6870 N
687
0 N
6880 N
688
0 N
6890 N
689
0 N
6900 N
690
0 N
6910 N
691
0 N
6920 N
692
0 N
6930 N
693
0 N
2220 Elev 2220 Elev
2230 Elev 2230 Elev
2240 Elev 2240 Elev
2250 Elev 2250 Elev
2260 Elev 2260 Elev
2270 Elev 2270 Elev
2280 Elev 2280 Elev
2290 Elev 2290 Elev
2300 Elev 2300 Elev
2310 Elev 2310 Elev
2320 Elev 2320 Elev
4118 E 4118 E 4120 E 4120 E 4122 E 4122 E 4124 E 4124 E 4126 E 4126 E 4128 E 4128 E 4130 E 4130 E 4132 E 4132 E 4134 E 4134 E 4136 E 4136 E 4138 E 4138 E 4140 E 4140 E
6630 N
663
0 N
6640 N
664
0 N
6650 N
665
0 N
6660 N
666
0 N
6670 N
667
0 N
6680 N
668
0 N
6690 N
669
0 N
6700 N
670
0 N
6710 N
671
0 N
6720 N
672
0 N
6730 N
673
0 N
6740 N
674
0 N
6750 N
675
0 N
6760 N
676
0 N
6770 N
677
0 N
6780 N
678
0 N
6790 N
679
0 N
6800 N
680
0 N
6810 N
681
0 N
6820 N
682
0 N
6830 N
683
0 N
KL000
2
ML001
105
KLD00
1
05KLD
002
05KLD
003
96KLC
0001
0.020.040.010.010.05
0.110.020.060.020.020.020.12
0.050.621.840.060.070.090.080.070.2
0.20.30.20.30.30.40.50.30.50.52.82.50.80.80.70.80.310.40.50.30.20.21.21.2
0.010.0050.0050.0050.010.010.010.010.010.020.020.020.010.020.010.01
0.010.0050.0050.0050.0050.0050.0050.0050.010.010.010.010.010.040.160.20.170.180.290.970.740.860.410.341.350.410.060.040.050.050.040.010.030.040.030.010.010.010.010.0050.270.050.0050.005
0.0050.005
0.0050.005
0.0050.005
0.0050.005
0.0050.005
0.0050.005
0.0050.005
0.0050.005
0.0050.005
0.0050.005
0.0050.005
0.0050.005
0.0050.005
0.180.010.320.320.0050.0050.005
0.00970.00480.00610.00590.00580.00550.00570.07460.07460.00580.00360.00270.00320.00240.0030.0030.020.030.040.060.140.140.20.310.380.620.530.771.051.312.113.250.540.240.220.080.050.070.070.070.030.030.01
0.01
M
05KLD
001
05KLD
002
05KLD
003
96KLC
0001
0.20.30.20.30.30.40.50.30.50.52.82.50.80.80.70.80.310.40.50.30.20.21.21.2
0.01
0.005
0.005
0.0050.01
0.01
0.01
0.01
0.01
0.02
0.02
0.02
0.01
0.02
0.01
0.01
0.01
0.005
0.005
0.005
0.005
0.005
0.005
0.005
0.01
0.01
0.01
0.01
0.01
0.04
0.16
0.20.17
0.18
0.29
0.97
0.74
0.86
0.41
0.34
1.35
0.41
0.06
0.04
0.05
0.05
0.04
0.01
0.03
0.04
0.03
0.01
0.01
0.01
0.01
0.005
0.27
0.05
0.005
0.005
0.005
0.005
0.005
0.005
0.005
0.005
0.005
0.005
0.005
0.005
0.005
0.005
0.005
0.005
0.00
0 00
0.00970.00480.00610.00590.00580.00550.00570.07460.07460.00580.00360.00270.00320.00240.0030.0030.020.030.040.060.140.140.20.310.380.620.530.771.051.312.113.250.540.240.220.080.050.070.070.070.030.030.010.01
Cu %
[ ABSENT]
[ 0. 0012, 0. 1]
[ 0. 1, 0. 3]
[ 0. 3, 0. 5]
[ 0. 5, 0. 8]
[ 0. 8, 1. 2]
[ 1. 2, 3]
[ 3, 7]
[ 7, 15. 6]
CMT Copper Clays - King Lyell Copper Model
Section 4130.00 E
Scale 1:750 Date: 18/01/08 AMC Consultants Pty Ltd
6590 N
659
0 N
6600 N
660
0 N
6610 N
661
0 N
6620 N
662
0 N
6630 N
663
0 N
6640 N
664
0 N
6650 N
665
0 N
6660 N
666
0 N
6670 N
667
0 N
6680 N
668
0 N
6690 N
669
0 N
6700 N
670
0 N
6710 N
671
0 N
6720 N
672
0 N
6730 N
673
0 N
6740 N
674
0 N
6750 N
675
0 N
6760 N
676
0 N
6770 N
677
0 N
6780 N
678
0 N
6790 N
679
0 N
6800 N
680
0 N
6810 N
681
0 N
6820 N
682
0 N
6830 N
683
0 N
2180 Elev 2180 Elev
2190 Elev 2190 Elev
2200 Elev 2200 Elev
2210 Elev 2210 Elev
2220 Elev 2220 Elev
2230 Elev 2230 Elev
2240 Elev 2240 Elev
2250 Elev 2250 Elev
2260 Elev 2260 Elev
2270 Elev 2270 Elev
2280 Elev 2280 Elev
2290 Elev 2290 Elev
2300 Elev 2300 Elev
4170 E 4170 E 4172 E 4172 E 4174 E 4174 E 4176 E 4176 E 4178 E 4178 E 4180 E 4180 E 4182 E 4182 E 4184 E 4184 E 4186 E 4186 E 4188 E 4188 E 4190 E 4190 E
6610 N
661
0 N
6620 N
662
0 N
6630 N
663
0 N
6640 N
664
0 N
6650 N
665
0 N
6660 N
666
0 N
6670 N
667
0 N
6680 N
668
0 N
6690 N
669
0 N
6700 N
670
0 N
6710 N
671
0 N
6720 N
672
0 N
6730 N
673
0 N
6740 N
674
0 N
6750 N
675
0 N
6760 N
676
0 N
6770 N
677
0 N
6780 N
678
0 N
6790 N
679
0 N
6800 N
680
0 N
6810 N
681
0 N
6820 N
682
0 N
6830 N
683
0 N
6840 N
684
0 N
6850 N
685
0 N
ML001
2
0.1
0.20.2
0.3
0.10.3
0.2
0.1
0.70.20.20.50.60.50.40.20.30.50.40.50.70.30.1
11.51.41.71.1
10.70.40.30.60.40.30.30.40.2
ML001
0.10.20.20.30.10.30.20.10.70.20.20.50.60.50.40.20.30.50.40.50.70.30.111.51.41.71.110.70.40.30.60.40.30.30.40.20.10.40.40.10.1
Cu %
[ ABSENT]
[ 0. 0012, 0. 1]
[ 0. 1, 0. 3]
[ 0. 3, 0. 5]
[ 0. 5, 0. 8]
[ 0. 8, 1. 2]
[ 1. 2, 3]
[ 3, 7]
[ 7, 15. 6]
CMT Copper Clays - King Lyell Copper Model
Section 4180.00 E
Scale 1:850 Date: 18/01/08 AMC Consultants Pty Ltd
6700 N
670
0 N
6710 N
671
0 N
6720 N
672
0 N
6730 N
673
0 N
6740 N
674
0 N
6750 N
675
0 N
6760 N
676
0 N
6770 N
677
0 N
6780 N
678
0 N
6790 N
679
0 N
6800 N
680
0 N
6810 N
681
0 N
6820 N
682
0 N
6830 N
683
0 N
6840 N
684
0 N
6850 N
685
0 N
6860 N
686
0 N
6870 N
687
0 N
6880 N
688
0 N
6890 N
689
0 N
6900 N
690
0 N
6910 N
691
0 N
6920 N
692
0 N
6930 N
693
0 N
6940 N
694
0 N
2240 Elev 2240 Elev
2250 Elev 2250 Elev
2260 Elev 2260 Elev
2270 Elev 2270 Elev
2280 Elev 2280 Elev
2290 Elev 2290 Elev
2300 Elev 2300 Elev
2310 Elev 2310 Elev
2320 Elev 2320 Elev
2330 Elev 2330 Elev
2340 Elev 2340 Elev
2350 Elev 2350 Elev
2360 Elev 2360 Elev
3870 E 3870 E 3872 E 3872 E 3874 E 3874 E 3876 E 3876 E 3878 E 3878 E 3880 E 3880 E 3882 E 3882 E 3884 E 3884 E 3886 E 3886 E 3888 E 3888 E 3890 E 3890 E
6610 N
661
0 N
6620 N
662
0 N
6630 N
663
0 N
6640 N
664
0 N
6650 N
665
0 N
6660 N
666
0 N
6670 N
667
0 N
6680 N
668
0 N
6690 N
669
0 N
6700 N
670
0 N
6710 N
671
0 N
6720 N
672
0 N
6730 N
673
0 N
6740 N
674
0 N
6750 N
675
0 N
6760 N
676
0 N
6770 N
677
0 N
6780 N
678
0 N
6790 N
679
0 N
6800 N
680
0 N
6810 N
681
0 N
6820 N
682
0 N
6830 N
683
0 N
6840 N
684
0 N
6850 N
685
0 N
ML000
8
0.10.20.4
0.2
0.20.40.20.20.20.10.4
0.70.10.10.20.2
0.50.20.2
0.10.10.2
0.20.30.2
0.30.20.40.20.20.1
0.10.10.1
0.1
0.10.30.3
0 1
ML000
8
0.10.20.40.20.20.40.20.20.20.10.40.70.10.10.20.20.50.20.2
0.11
Cu %
[ ABSENT]
[ 0. 0012, 0. 1]
[ 0. 1, 0. 3]
[ 0. 3, 0. 5]
[ 0. 5, 0. 8]
[ 0. 8, 1. 2]
[ 1. 2, 3]
[ 3, 7]
[ 7, 15. 6]
CMT Copper Clays - King Lyell Copper Model
Section 3880.00 E
Scale 1:850 Date: 18/01/08 AMC Consultants Pty Ltd
6700 N
670
0 N
6710 N
671
0 N
6720 N
672
0 N
6730 N
673
0 N
6740 N
674
0 N
6750 N
675
0 N
6760 N
676
0 N
6770 N
677
0 N
6780 N
678
0 N
6790 N
679
0 N
6800 N
680
0 N
6810 N
681
0 N
6820 N
682
0 N
6830 N
683
0 N
6840 N
684
0 N
6850 N
685
0 N
6860 N
686
0 N
6870 N
687
0 N
6880 N
688
0 N
6890 N
689
0 N
6900 N
690
0 N
6910 N
691
0 N
6920 N
692
0 N
6930 N
693
0 N
6940 N
694
0 N
2200 Elev 2200 Elev
2210 Elev 2210 Elev
2220 Elev 2220 Elev
2230 Elev 2230 Elev
2240 Elev 2240 Elev
2250 Elev 2250 Elev
2260 Elev 2260 Elev
2270 Elev 2270 Elev
2280 Elev 2280 Elev
2290 Elev 2290 Elev
2300 Elev 2300 Elev
2310 Elev 2310 Elev
2320 Elev 2320 Elev
4070 E 4070 E 4072 E 4072 E 4074 E 4074 E 4076 E 4076 E 4078 E 4078 E 4080 E 4080 E 4082 E 4082 E 4084 E 4084 E 4086 E 4086 E 4088 E 4088 E 4090 E 4090 E
6610 N
661
0 N
6620 N
662
0 N
6630 N
663
0 N
6640 N
664
0 N
6650 N
665
0 N
6660 N
666
0 N
6670 N
667
0 N
6680 N
668
0 N
6690 N
669
0 N
6700 N
670
0 N
6710 N
671
0 N
6720 N
672
0 N
6730 N
673
0 N
6740 N
674
0 N
6750 N
675
0 N
6760 N
676
0 N
6770 N
677
0 N
6780 N
678
0 N
6790 N
679
0 N
6800 N
680
0 N
6810 N
681
0 N
6820 N
682
0 N
6830 N
683
0 N
6840 N
684
0 N
6850 N
685
0 N
KL001
3
05KLD
004
05KLD
006
0.030.020.02
0.040.040.020.050.050.110.16
4.7161.420.380.40.630.310.491.730.540.840.330.130.320.15
0.41
0.010.0050.0050.010.0050.0050.0050.0050.0050.0050.0050.0050.0050.0050.0050.0050.0050.0050.0050.0050.0050.0050.0050.0050.0050.0050.0050.0050.0050.010.0050.0050.010.0050.0050.0050.0050.0050.0050.0050.0050.0050.005
0.010.010.010.020.010.010.010.010.010.010.020.010.010.010.010.020.020.010.020.020.020.020.010.020.010.010.010.010.010.010.010.010.010.01
05KLD
005
KL
0.01
0.005
0.005
0.01
0.005
0.005
0.005
0.005
0.005
0.005
0.005
0.005
0.005
0.005
0.005
0.005
0.005
0.005
0.005
0.005
0.005
0.005
0.005
0.005
0.005
0.005
0.005
0.005
0.005
0.01
0.005
0.005
0.01
0.005
0.005
0.005
0.005
0.005
0.005
0.005
0.005
0.005
0.005
Cu %
[ ABSENT]
[ 0. 0012, 0. 1]
[ 0. 1, 0. 3]
[ 0. 3, 0. 5]
[ 0. 5, 0. 8]
[ 0. 8, 1. 2]
[ 1. 2, 3]
[ 3, 7]
[ 7, 15. 6]
CMT Copper Clays - King Lyell Copper Model
Section 4080.00 E
Scale 1:850 Date: 18/01/08 AMC Consultants Pty Ltd

6630 N
663
0 N
6640 N
664
0 N
6650 N
665
0 N
6660 N
666
0 N
6670 N
667
0 N
6680 N
668
0 N
6690 N
669
0 N
6700 N
670
0 N
6710 N
671
0 N
6720 N
672
0 N
6730 N
673
0 N
6740 N
674
0 N
6750 N
675
0 N
6760 N
676
0 N
6770 N
677
0 N
6780 N
678
0 N
6790 N
679
0 N
6800 N
680
0 N
6810 N
681
0 N
6820 N
682
0 N
6830 N
683
0 N
6840 N
684
0 N
6850 N
685
0 N
6860 N
686
0 N
6870 N
687
0 N
6880 N
688
0 N
6890 N
689
0 N
6900 N
690
0 N
6910 N
691
0 N
6920 N
692
0 N
2180 Elev 2180 Elev
2190 Elev 2190 Elev
2200 Elev 2200 Elev
2210 Elev 2210 Elev
2220 Elev 2220 Elev
2230 Elev 2230 Elev
2240 Elev 2240 Elev
2250 Elev 2250 Elev
2260 Elev 2260 Elev
2270 Elev 2270 Elev
2280 Elev 2280 Elev
2290 Elev 2290 Elev
2300 Elev 2300 Elev
2310 Elev 2310 Elev
2320 Elev 2320 Elev
4120 E 4120 E
4124 E 4124 E
4128 E 4128 E
4132 E 4132 E
4136 E 4136 E
4140 E 4140 E
6590 N
659
0 N
6600 N
660
0 N
6610 N
661
0 N
6620 N
662
0 N
6630 N
663
0 N
6640 N
664
0 N
6650 N
665
0 N
6660 N
666
0 N
6670 N
667
0 N
6680 N
668
0 N
6690 N
669
0 N
6700 N
670
0 N
6710 N
671
0 N
6720 N
672
0 N
6730 N
673
0 N
6740 N
674
0 N
6750 N
675
0 N
6760 N
676
0 N
6770 N
677
0 N
6780 N
678
0 N
6790 N
679
0 N
6800 N
680
0 N
6810 N
681
0 N
6820 N
682
0 N
6830 N
683
0 N
6840 N
684
0 N
6850 N
685
0 N
6860 N
686
0 N
6870 N
687
0 N
KL000
2
ML001
105
KLD00
1
05KLD
002
05KLD
003
96KLC
0001
0.020.040.010.010.050.110.020.060.020.020.020.12
0.050.621.840.060.070.090.080.070.2
0.28
0.20.30.20.30.30.40.50.30.50.52.82.50.80.80.70.80.310.40.50.30.20.21.21.2
0.010.0050.0050.0050.010.010.010.010.010.020.020.020.010.020.010.01
0.010.0050.0050.0050.0050.0050.0050.0050.010.010.010.010.010.040.160.20.170.180.290.970.740.860.410.341.350.410.060.040.050.050.040.010.030.040.030.010.010.010.010.0050.270.050.0050.005
0.0050.005
0.0050.0050.005
0.0050.005
0.0050.005
0.0050.005
0.0050.0050.005
0.0050.0050.005
0.0050.005
0.0050.005
0.0050.0050.005
0.0050.0050.180.01
0.320.320.005
0.0050.005
0.00970.00480.00610.00590.00580.00550.00570.07460.07460.00580.00360.00270.00320.00240.0030.0030.020.030.040.060.140.140.20.310.380.620.530.771.051.312.113.250.540.240.220.080.050.070.070.070.030.030.010.01
M
05KLD
001
05KLD
002
05KLD
003
96KLC
00010.20.30.20.30.30.40.50.30.50.52.82.50.80.80.70.80.310.40.50.30.20.21.21.2
0.01
0.005
0.005
0.0050.01
0.01
0.01
0.01
0.01
0.02
0.02
0.02
0.01
0.02
0.01
0.01
0.01
0.005
0.005
0.005
0.005
0.005
0.005
0.005
0.01
0.01
0.01
0.01
0.01
0.04
0.16
0.20.17
0.18
0.29
0.97
0.74
0.86
0.41
0.34
1.35
0.41
0.06
0.04
0.05
0.05
0.04
0.01
0.03
0.04
0.03
0.01
0.01
0.01
0.01
0.005
0.27
0.05
0.005
0.0050.0
050.0
050.0
050.0
050.0
050.0
050.0
050.0
050.0
050.0
050.0
050.0
050.0
050.0
050.0
050.0
050.0
050.0
050.0
050.0
0500
500
500
55
0.00970.00480.00610.00590.00580.00550.00570.07460.07460.00580.00360.00270.00320.00240.0030.0030.020.030.040.060.140.140.20.310.380.620.530.771.051.312.113.250.540.240.220.080.050.070.070.070.030.030.010.01
Cu %
[ ABSENT]
[ 0. 0012, 0. 1]
[ 0. 1, 0. 3]
[ 0. 3, 0. 5]
[ 0. 5, 0. 8]
[ 0. 8, 1. 2]
[ 1. 2, 3]
[ 3, 7]
[ 7, 15. 6]
CMT Copper Clays - King Lyell Copper Model
Section 4130.00 E
Scale 1:1000 Date: 18/01/08 AMC Consultants Pty Ltd

COPPER MINES OF TASMANIA PTY LTD Copper Clays Scoping Study
APPENDIX H
COPPER CLAYS CORE PHOTOGRAPHS
AMC 107122 : March 2008

28 March 2008 AMC 107122 : CMT Copper Clays
1
A U
S T R
A L I A N
CMT Copper Clays: KL001 core Trays 1-2 : ~18.2 m-32.2 m (EOH)
~18.2 m
32.2 m(EOH)

28 March 2008 AMC 107122 : CMT Copper Clays
1
A U
S T R
A L I A N
CMT Copper Clays: KL002 core Trays 1-4 : ~24.5 m-51.6 m
~24.5 m
~41.5 m
~41.5 m
51.6 m
28 March 2008 AMC 107122 : CMT Copper Clays
2
A U
S T R
A L I A N
CMT Copper Clays: KL002 core Trays 5-8 : 51.6 m-~71.7 m
51.6 m
62.8 m
62.8 m
~71.7 m

28 March 2008 AMC 107122 : CMT Copper Clays
3
A U
S T R
A L I A N
CMT Copper Clays: KL002 core Tray 9 : ~71.7 m-72.2 m (EOH)
~71.7 m
72.2 m (EOH)
28 March 2008 AMC 107122 : CMT Copper Clays
1
A U
S T R
A L I A N
CMT Copper Clays: KL003 core Trays 1-4 : ~4.7 m-~36.0 m
~4.7 m
~15.7 m
~15.7 m
~36.0 m

28 March 2008 AMC 107122 : CMT Copper Clays
2
A U
S T R
A L I A N
CMT Copper Clays: KL003 core Trays 5 : ~36.0 m-43.0 m (EOH)
~36.0 m
43.0 m (EOH)

28 March 2008 AMC 107122 : CMT Copper Clays
1
A U
S T R
A L I A N
CMT Copper Clays: KL004 core Trays 1-4 : ~3.7 m-31.9 m
~3.7 m
15.0 m
~15.8 m
31.9 m

28 March 2008 AMC 107122 : CMT Copper Clays
2
A U
S T R
A L I A N
CMT Copper Clays: KL004 core Trays 5-8 : 31.9 m-~53.3 m (EOH)
31.9 m
41.4 m
41.4 m
~53.3 m (EOH)

28 March 2008 AMC 107122 : CMT Copper Clays
1
A U
S T R
A L I A N
CMT Copper Clays: KL006 core Trays 1-4 : ~52.0 m-~75.0 m
~52.0 m
~67.0 m
~67.0 m
~75.0 m

28 March 2008 AMC 107122 : CMT Copper Clays
2
A U
S T R
A L I A N
CMT Copper Clays: KL006 core Trays 5,7-8 : ~75.0 m-93.7 m (EOH)
~75.0 m
~91.9 m
~91.9 m
93.7 m (EOH)

COPPER MINES OF TASMANIA PTY LTD Copper Clays Scoping Study
AMC 107122 : April 2008 64
12 REFERENCES
Berkman, D. A. 1989 Monograph 9. Field Geologists Manual. Third Edition, AUSIMM
Wills, K. 1996 A synthesis of Mt Lyell Geology and Exploration, Copper Mines of Tasmania Pty Ltd
Wills, K. 1995 Open Cut Potential of the Copper Clays Area Mount Lyell, Tasmania, Copper Mines of Tasmania Pty Ltd
Hoek, E. and Bray, J. 1981. Rock Slope Engineering. The Institution of Mining and Metallurgy, London, Ed. 3, pp 358.
Wyllie, D. C. and Mah, C. W. 2004. Rock Slope Engineering, Civil and Mining. Spon Press, New York, Ed. 4, pp 431.