10th annual canadian sponsorship landscape study
TRANSCRIPT
NORM O’REILLY | OHIO UNIVERSITY & T1
FEBRUARY 11, 2016
10th Annual CANADIAN SPONSORSHIP LANDSCAPE STUDYELISA BESELT & ADAM DeGRASSE | T1
Note: This is an interim report for 2016 and data is not final.

Historical SnapshotsAbout, History & Method
Sponsorship in 2015Current Realities
A Decade of Data: 2006-2015Findings & Trends
TODAY’S PRESENTATION
123
What’s NextOur Expectations4

ACKNOWLEDGEMENTS

Historical SnapshotsABOUT, HISTORY & METHOD
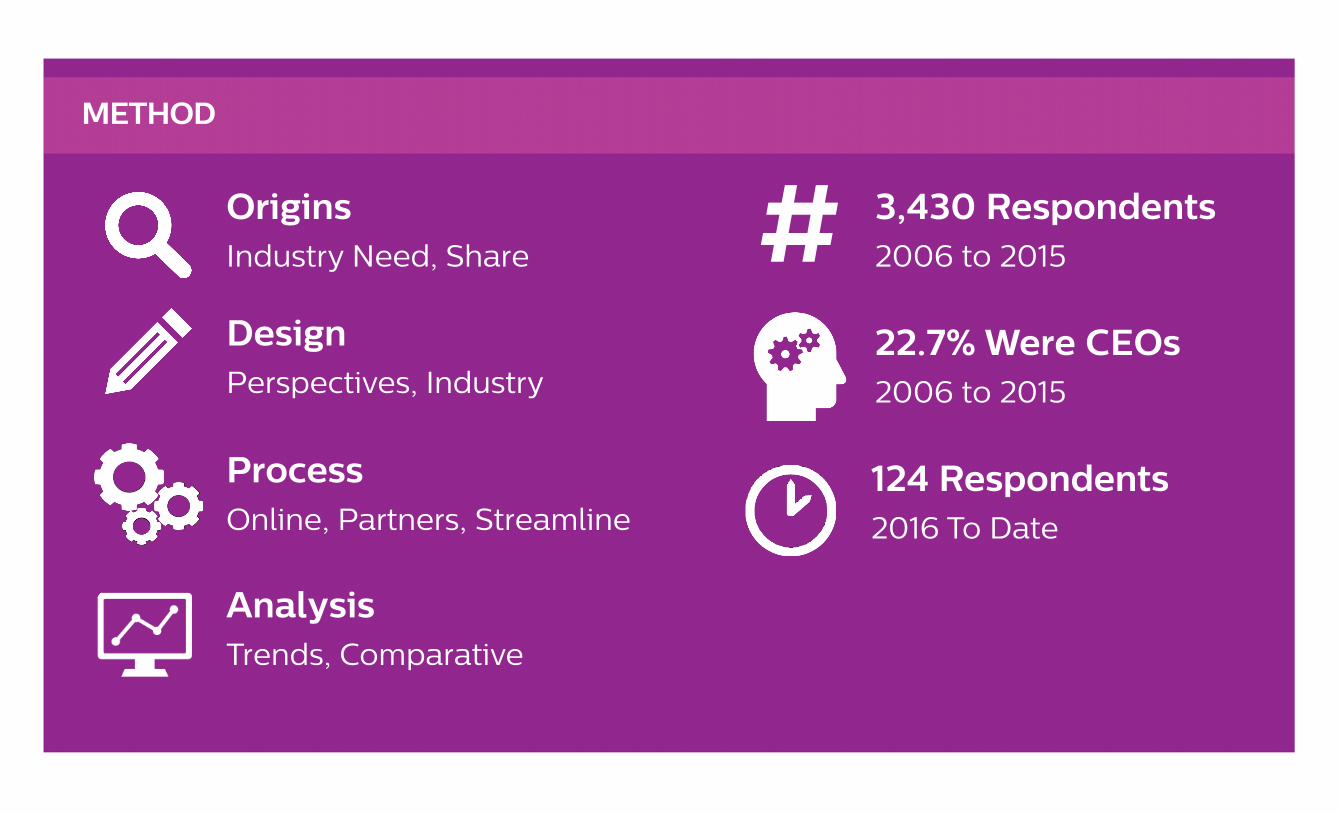
AnalysisTrends, Comparative
DesignPerspectives, Industry
OriginsIndustry Need, Share
ProcessOnline, Partners, Streamline
METHOD
124 Respondents2016 To Date
3,430 Respondents2006 to 2015#22.7% Were CEOs2006 to 2015
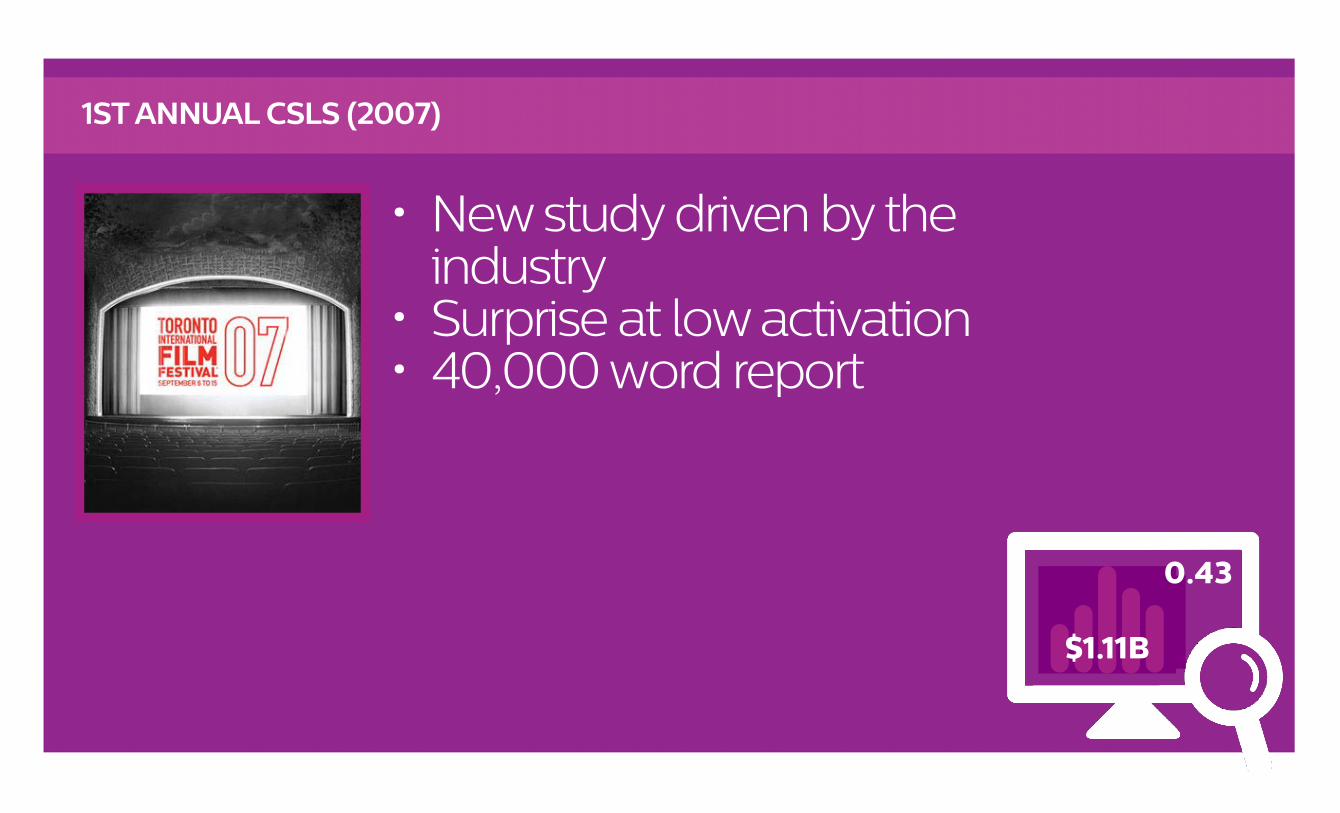
• New study driven by the industry
• Surprise at low activation• 40,000 word report
1ST ANNUAL CSLS (2007)
0.43
$1.11B
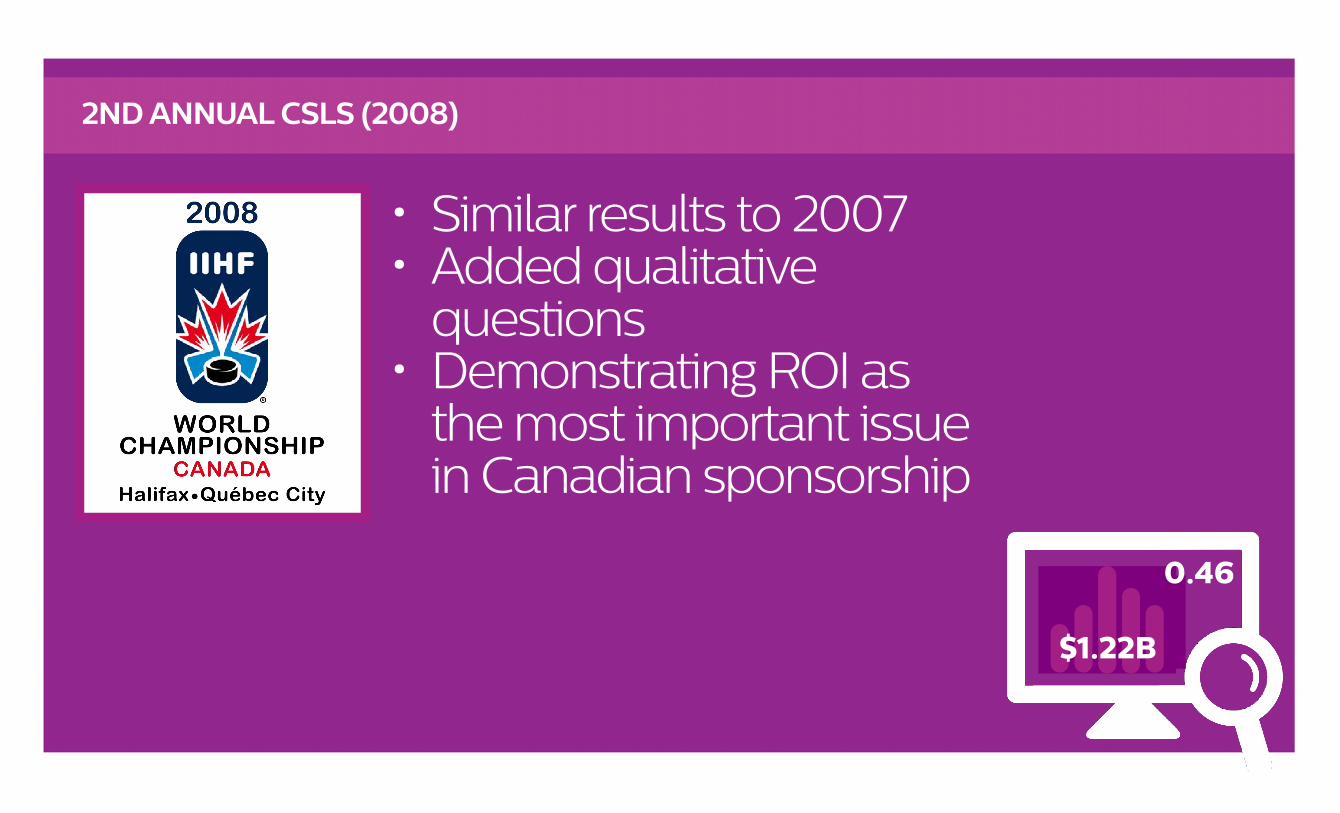
• Similar results to 2007• Added qualitative
questions• Demonstrating ROI as
the most important issue in Canadian sponsorship
2ND ANNUAL CSLS (2008)
0.46
$1.22B
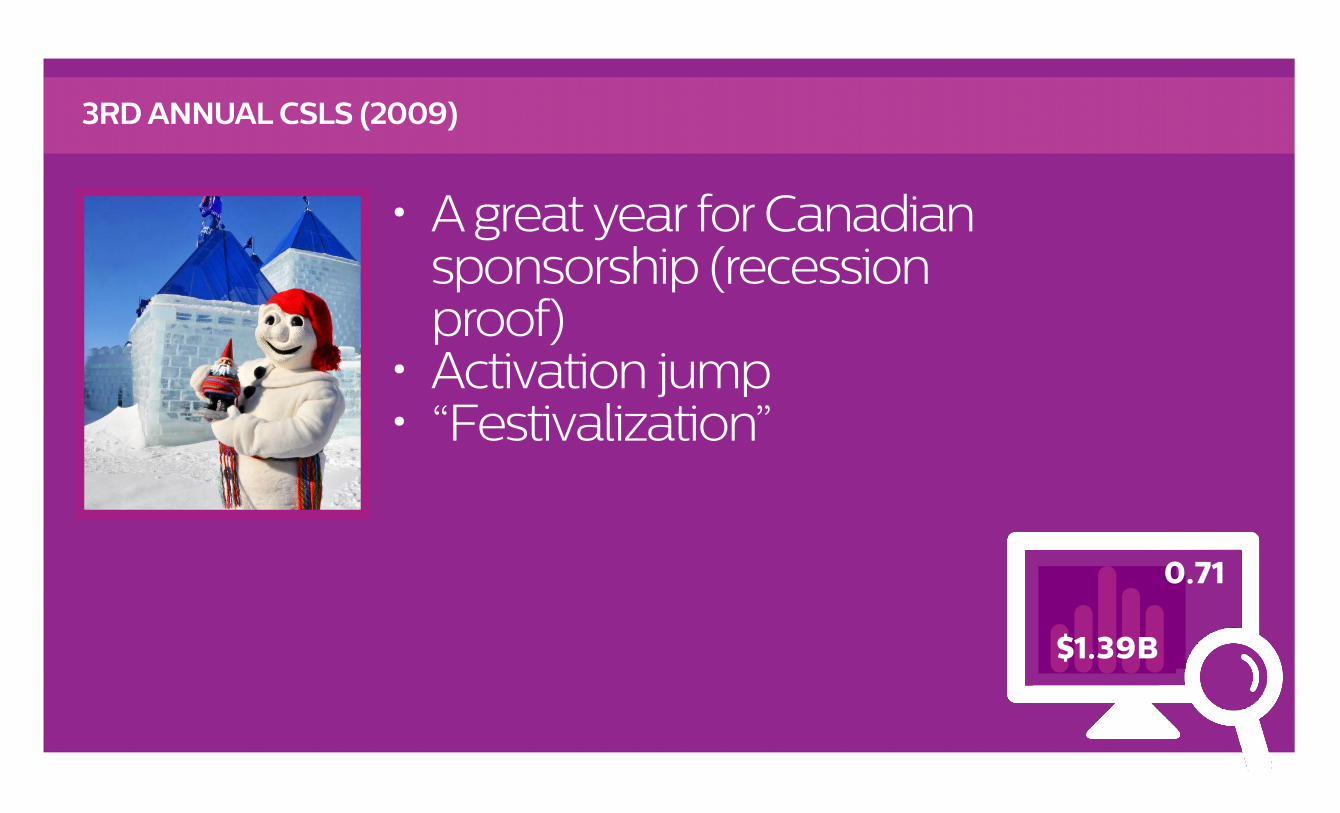
• A great year for Canadian sponsorship (recession proof)
• Activation jump• “Festivalization”
3RD ANNUAL CSLS (2009)
0.71
$1.39B
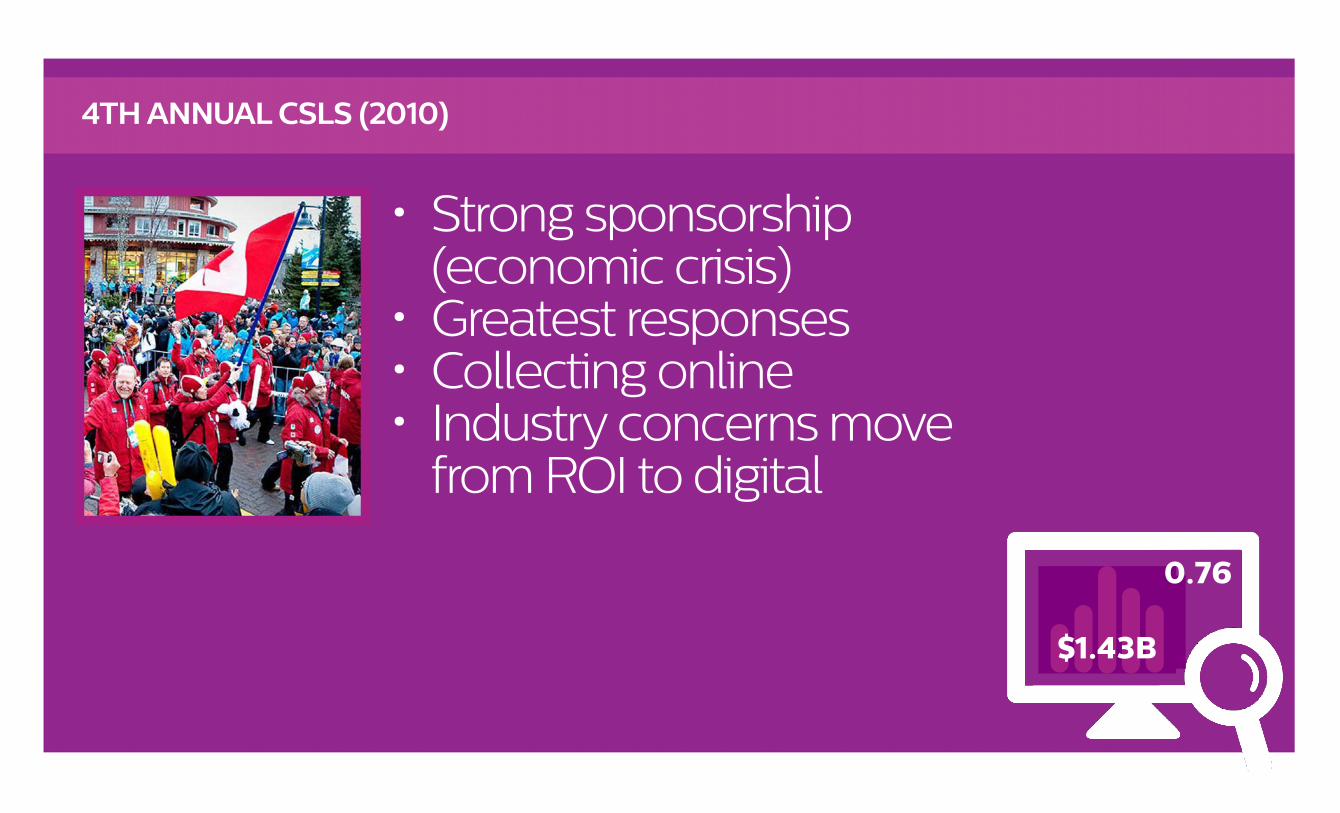
• Strong sponsorship (economic crisis)
• Greatest responses• Collecting online• Industry concerns move
from ROI to digital
4TH ANNUAL CSLS (2010)
0.76
$1.43B
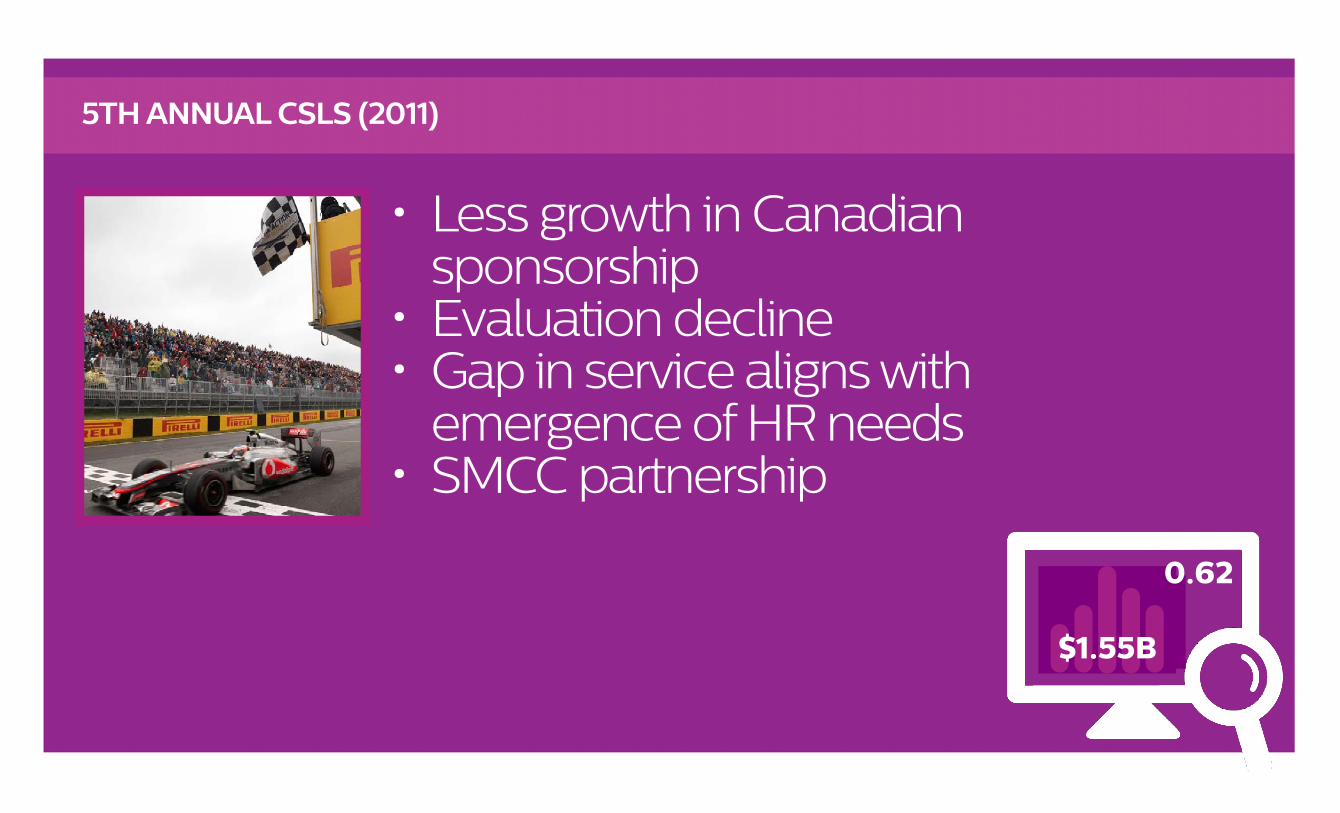
• Less growth in Canadian sponsorship
• Evaluation decline• Gap in service aligns with
emergence of HR needs• SMCC partnership
5TH ANNUAL CSLS (2011)
0.62
$1.55B
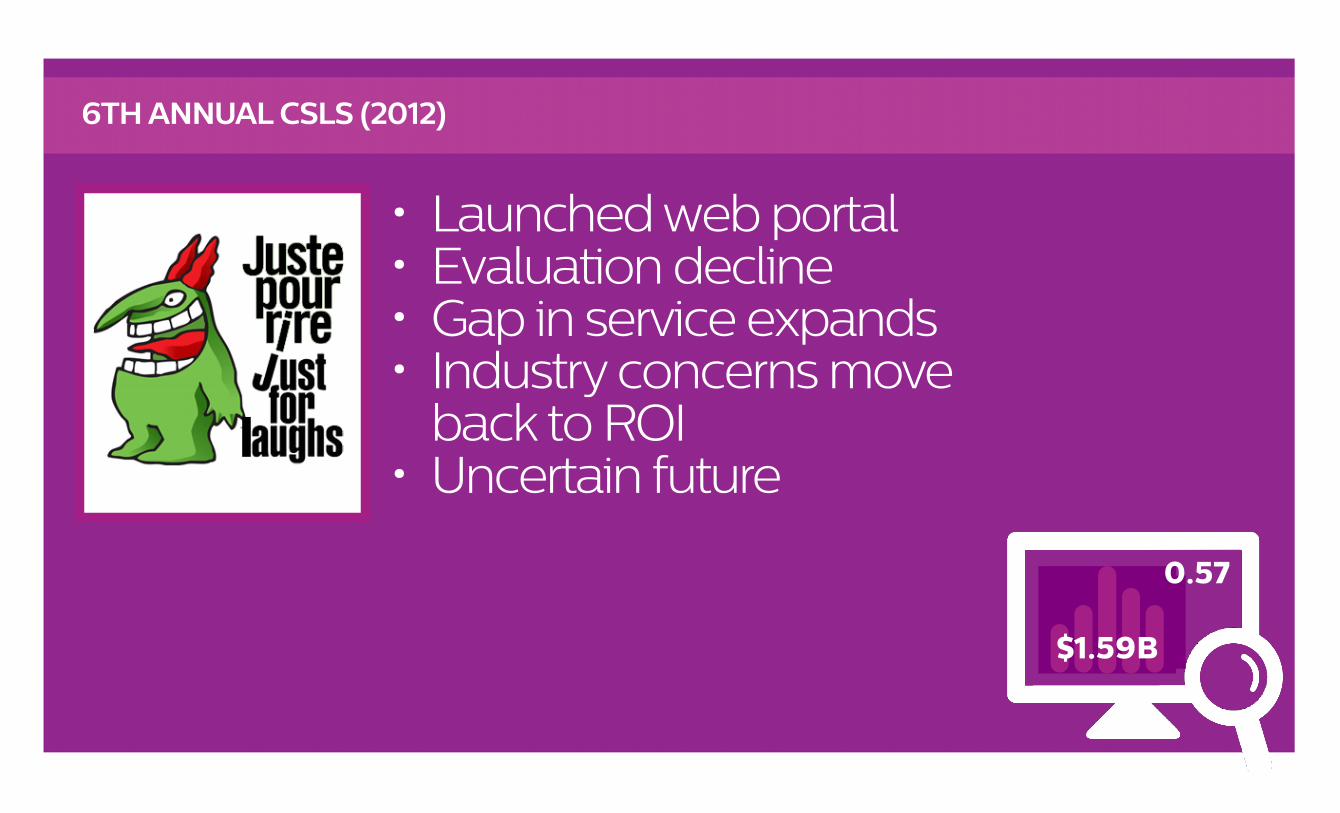
• Launched web portal• Evaluation decline• Gap in service expands• Industry concerns move
back to ROI• Uncertain future
6TH ANNUAL CSLS (2012)
0.57
$1.59B
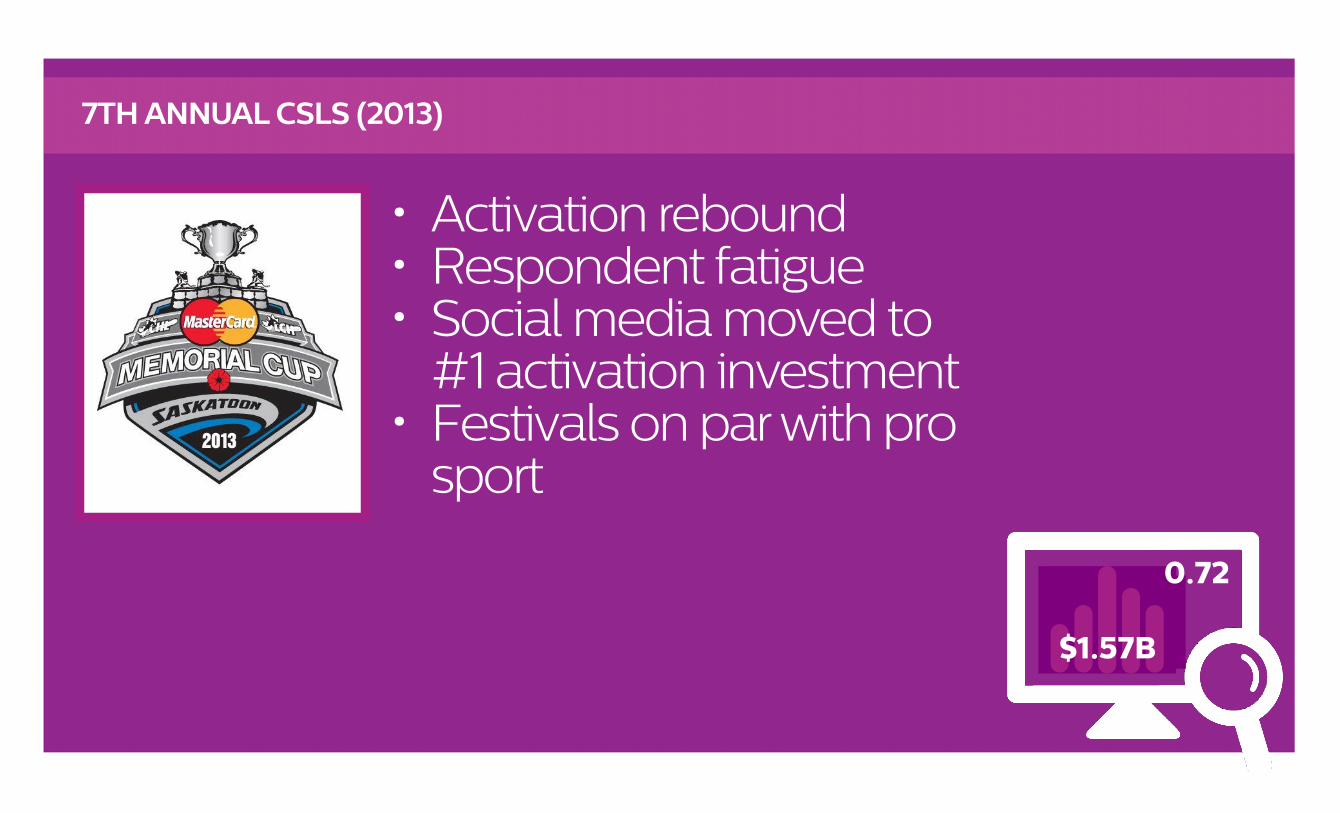
• Activation rebound• Respondent fatigue• Social media moved to
#1 activation investment• Festivals on par with pro
sport
7TH ANNUAL CSLS (2013)
0.72
$1.57B
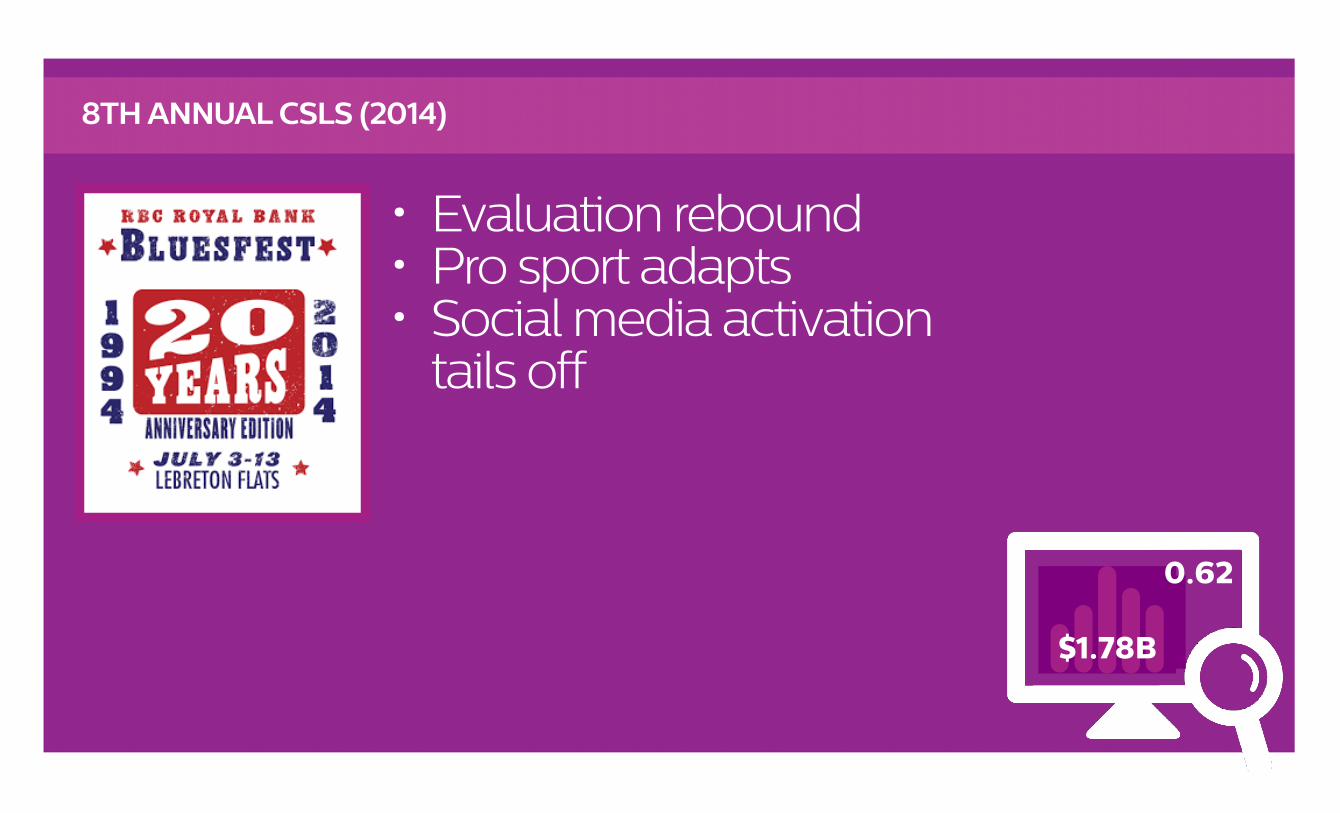
• Evaluation rebound• Pro sport adapts• Social media activation
tails off
8TH ANNUAL CSLS (2014)
0.62
$1.78B
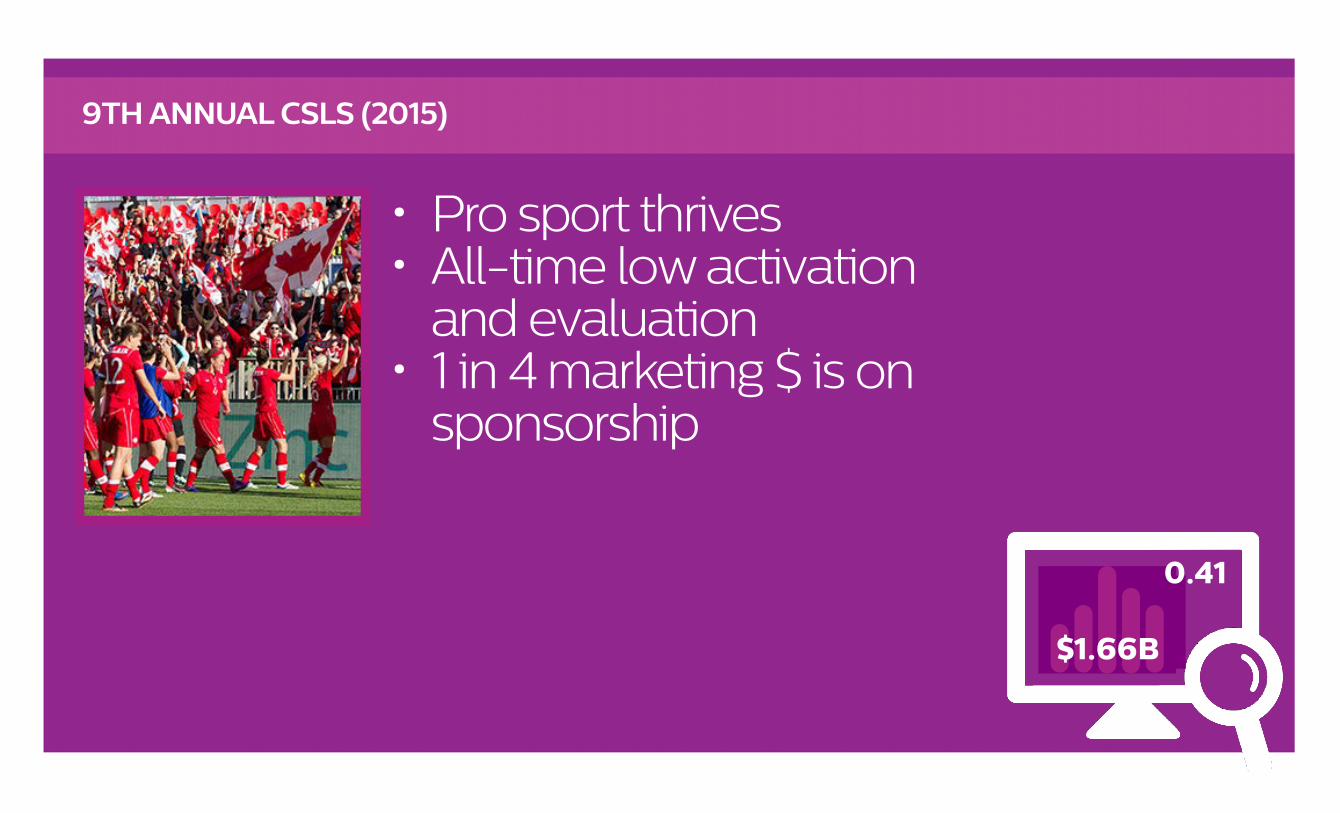
• Pro sport thrives • All-time low activation
and evaluation • 1 in 4 marketing $ is on
sponsorship
9TH ANNUAL CSLS (2015)
0.41
$1.66B
• What to expect this year?
10TH ANNUAL CSLS (2016)
?
?
Sponsorship in 2015CURRENT REALITIES
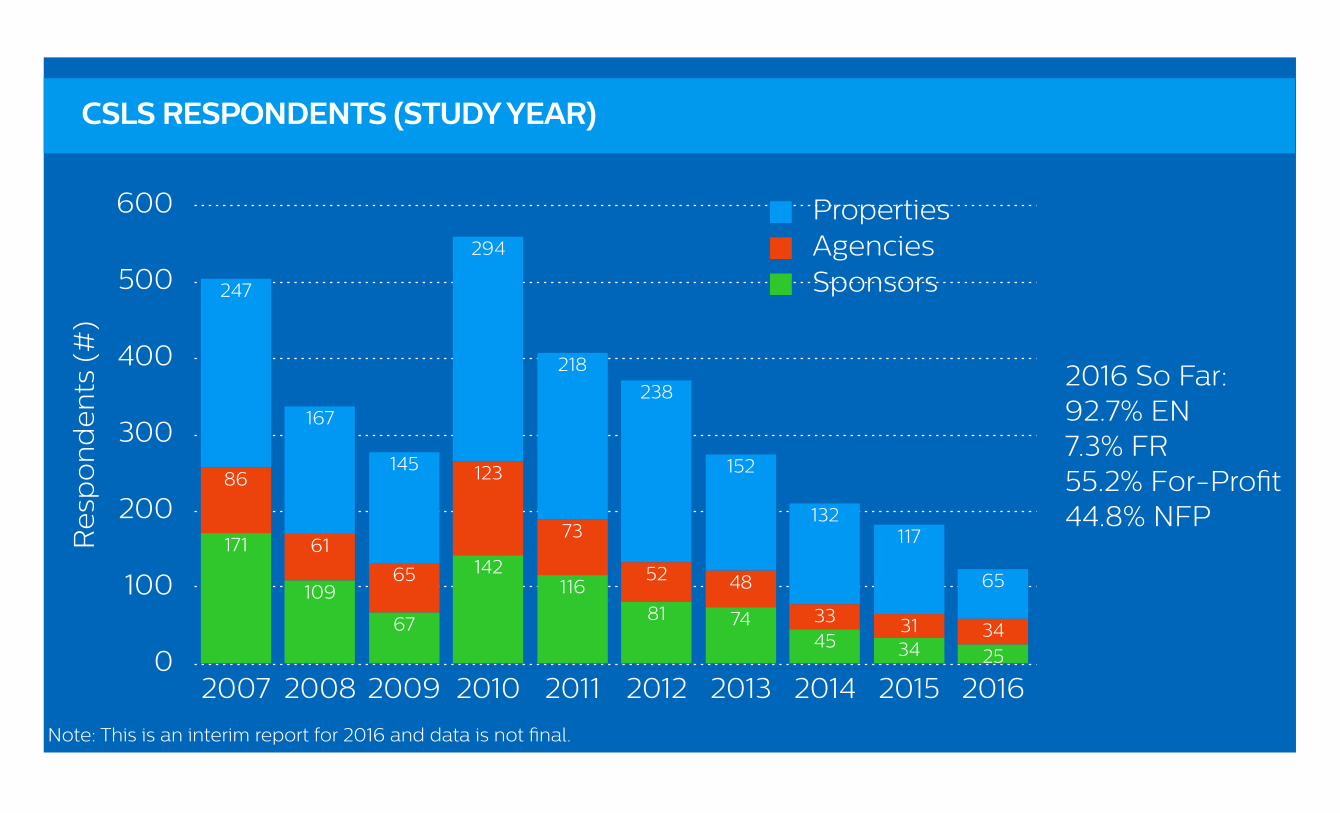
CSLS RESPONDENTS (STUDY YEAR)
0
100
200
300
400
500
600
2007 2008 2009 2010 2011 2012 2013 2014 2015 2016
65
117132
152
238218
294
145
167
247
343133
4852
73
123
65
61
86
2534457481
116142
67
109
171Re
spo
nd
en
ts (
#)
SponsorsAgenciesProperties
2016 So Far: 92.7% EN7.3% FR55.2% For-Profit44.8% NFP
Note: This is an interim report for 2016 and data is not final.
Survey is open until April 15, 2016. Visit www.sponsorshiplandscape.ca to enter responses!
SUPPORT THE CSLS
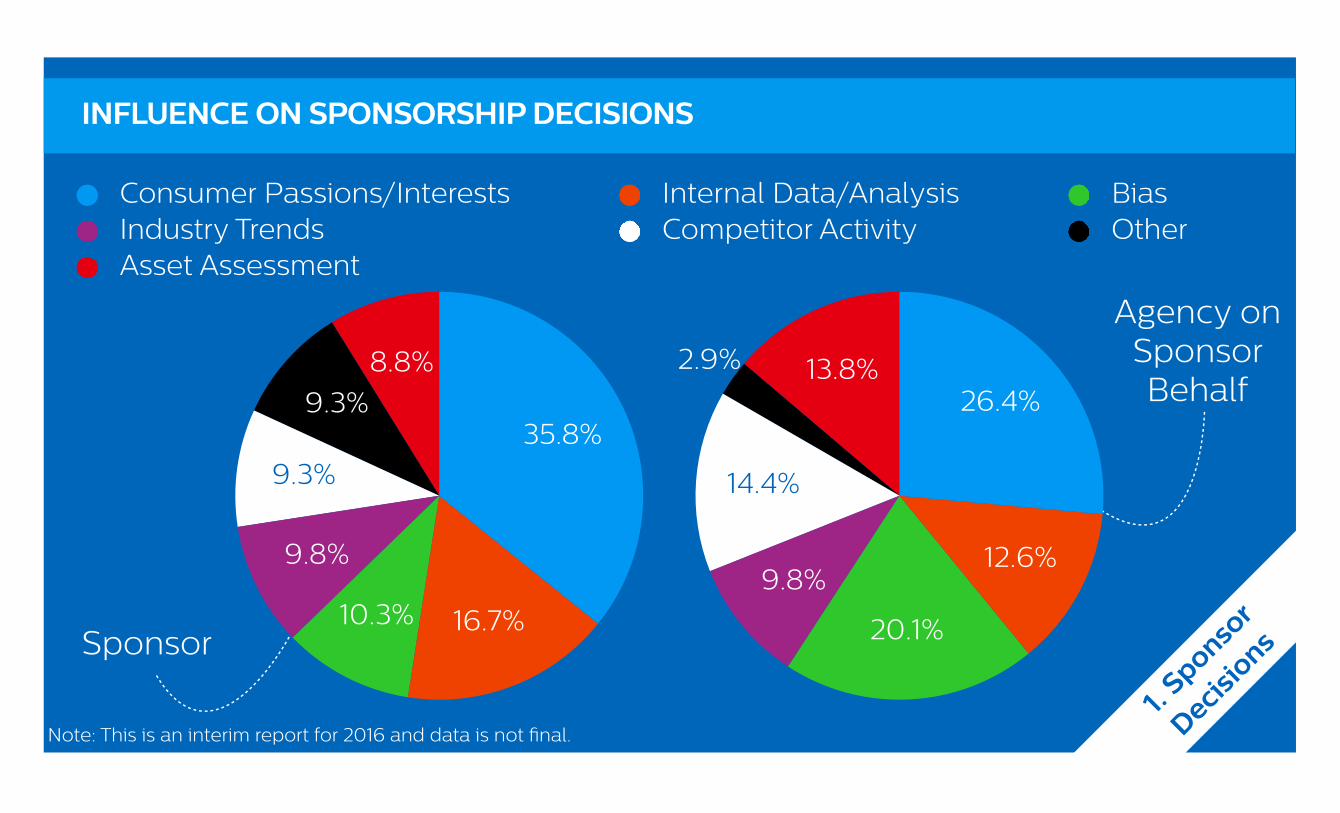
INFLUENCE ON SPONSORSHIP DECISIONS
1. Sponso
r
Decisio
ns
8.8%9.3%
9.3%
9.8%
10.3% 16.7%
35.8%
Consumer Passions/Interests Internal Data/Analysis BiasIndustry Trends Competitor Activity OtherAsset Assessment
Sponsor
Agency on Sponsor Behalf
13.8%2.9%
14.4%
9.8%
20.1%
12.6%
26.4%
Note: This is an interim report for 2016 and data is not final.

VALUABLE BENEFITS TO SPONSORSHIPS
0%
20%
40%
60%
80%
100%
27.0%22.2%
27.0%27.0%18.0%18.0%
18.0%9.0%
46.0%33.3%
36.0%36.0%
46.0%46.0%
27.0%
9.0%
9.0%
22.2%27.0%27.0%27.0%27.0%
55.0%
82.0%
Re
spo
nd
en
ts (
%)
2. Sponso
r
Benefits
Very ValuableValuableSomewhat valuableNot valuable
9.0% 9.0% 9.0% 9.0% 18.0%
Exclusivity Broadcast Ads Rights Spokesperson*Digital AdsProprietary Area Hospitality Database
22.2%
Note: This is an interim report for 2016 and data is not final.
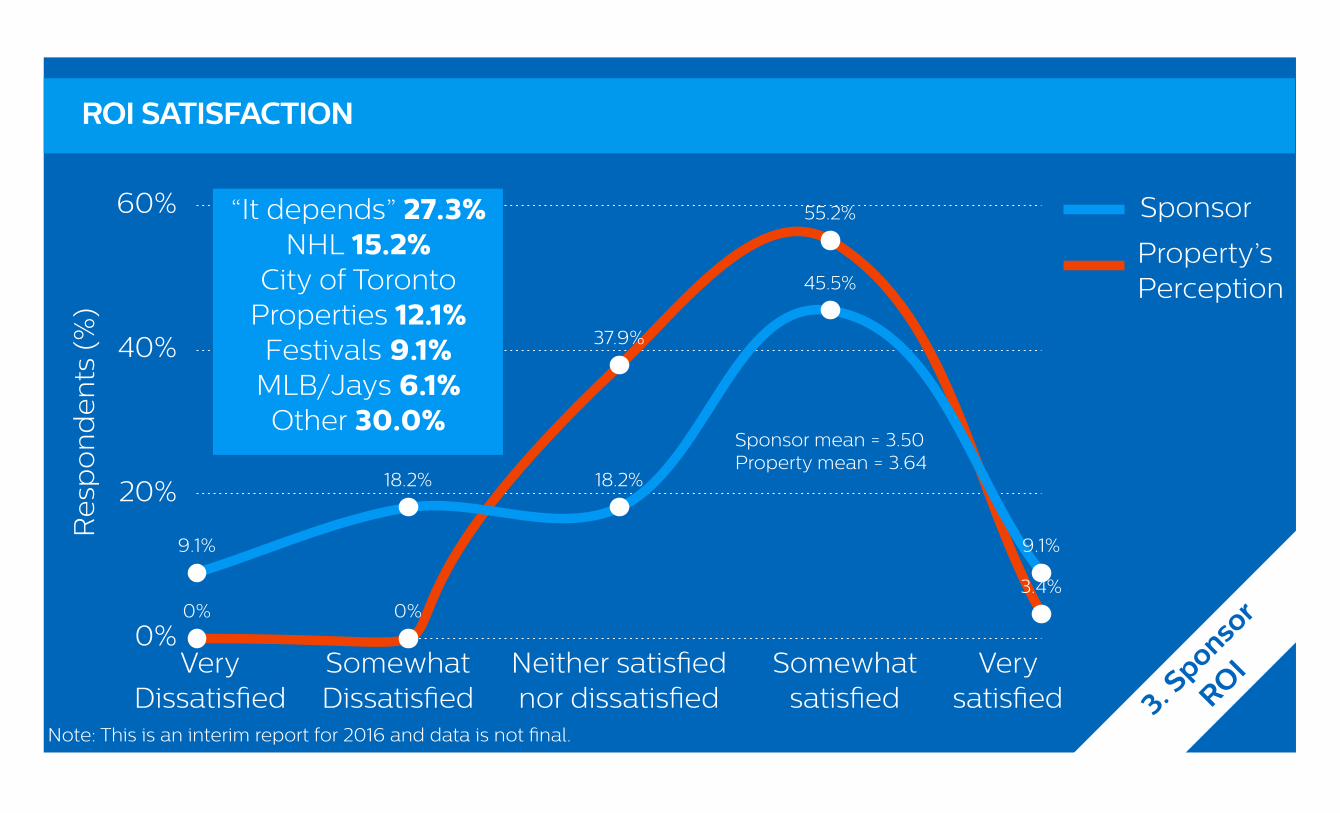
ROI SATISFACTION
0%
20%
40%
60%
0% 0%
37.9%
55.2%
3.4%
9.1%
18.2% 18.2%
45.5%
9.1%
Re
spo
nd
en
ts (
%)
Sponsor mean = 3.50Property mean = 3.64
3. Sponso
r
ROISomewhatDissatisfied
Neither satisfied nor dissatisfied
Somewhat satisfied
Very satisfied
VeryDissatisfied
Sponsor
Property’s Perception
“It depends” 27.3%NHL 15.2%
City of Toronto Properties 12.1%Festivals 9.1%
MLB/Jays 6.1%Other 30.0%
Note: This is an interim report for 2016 and data is not final.
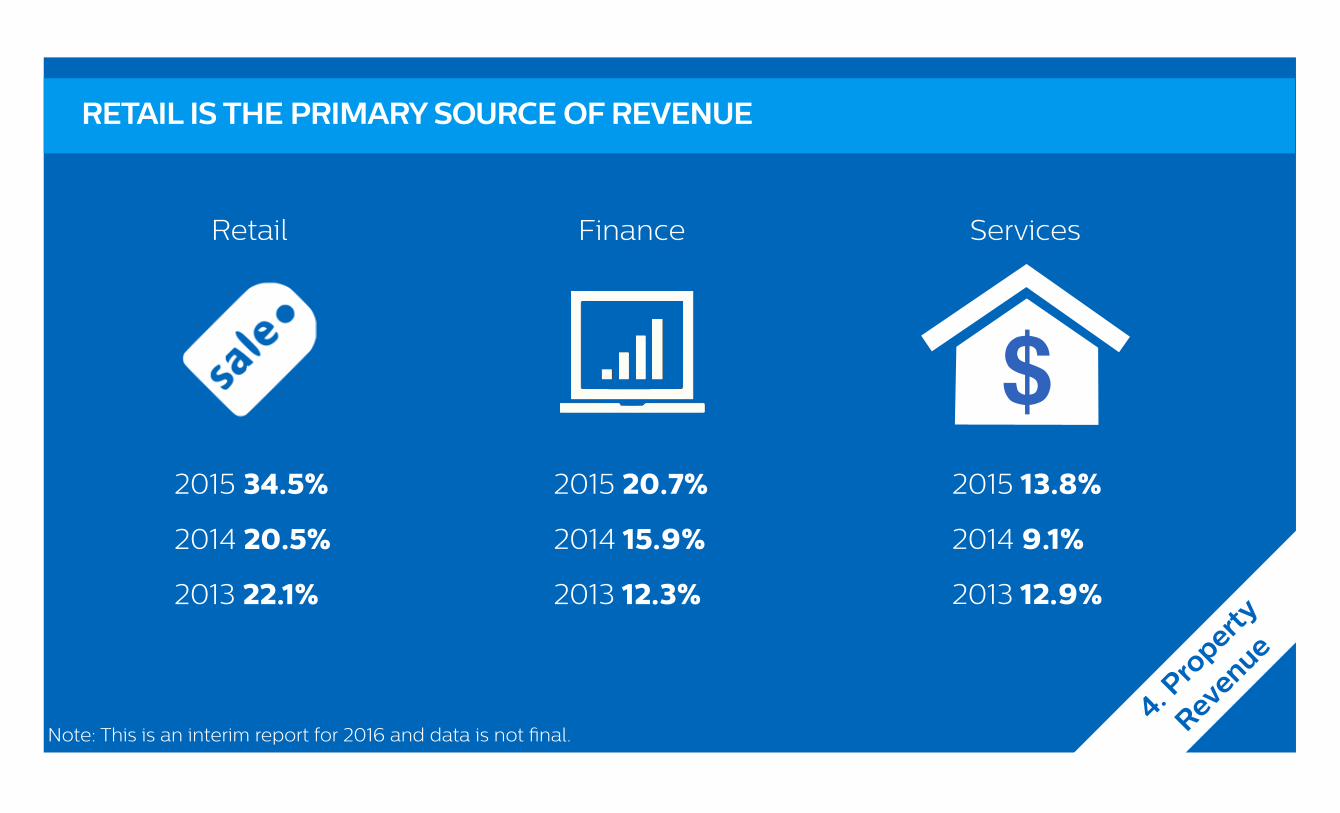
RETAIL IS THE PRIMARY SOURCE OF REVENUE
4. Pro
perty
Revenue
$2015 34.5%
Retail Finance Services
2014 20.5%
2013 22.1%
2015 20.7%
2014 15.9%
2013 12.3%
2015 13.8%
2014 9.1%
2013 12.9%
Note: This is an interim report for 2016 and data is not final.
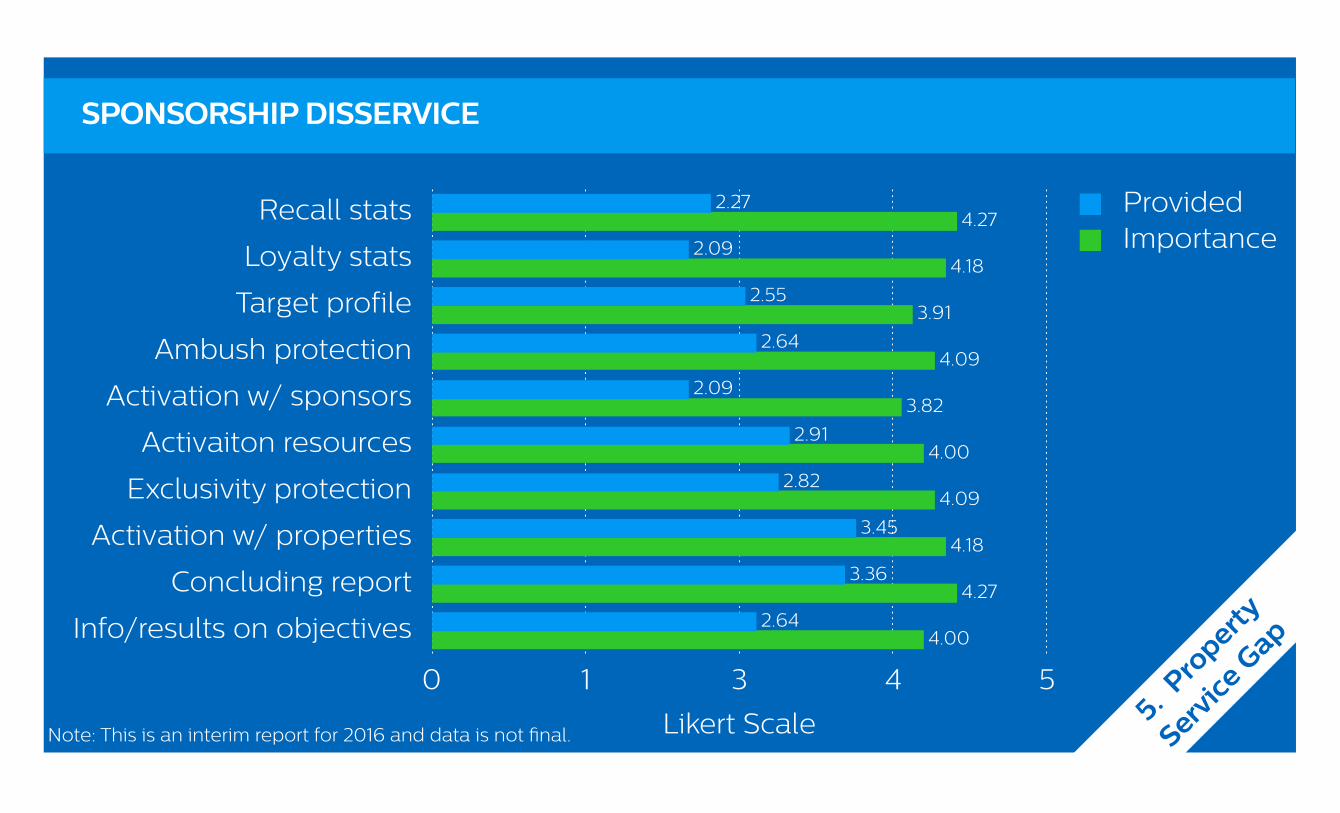
SPONSORSHIP DISSERVICE
Recall stats
Loyalty stats
Target profile
Ambush protection
Activation w/ sponsors
Activaiton resources
Exclusivity protection
Activation w/ properties
Concluding report
Info/results on objectives
0 1 3 4 5
4.00
4.27
4.18
4.09
4.00
3.82
4.09
3.91
4.18
4.27
2.64
3.36
3.45
2.82
2.91
2.09
2.64
2.55
2.09
2.27
Likert Scale 5. Pro
perty
Service
Gap
ProvidedImportance
Note: This is an interim report for 2016 and data is not final.
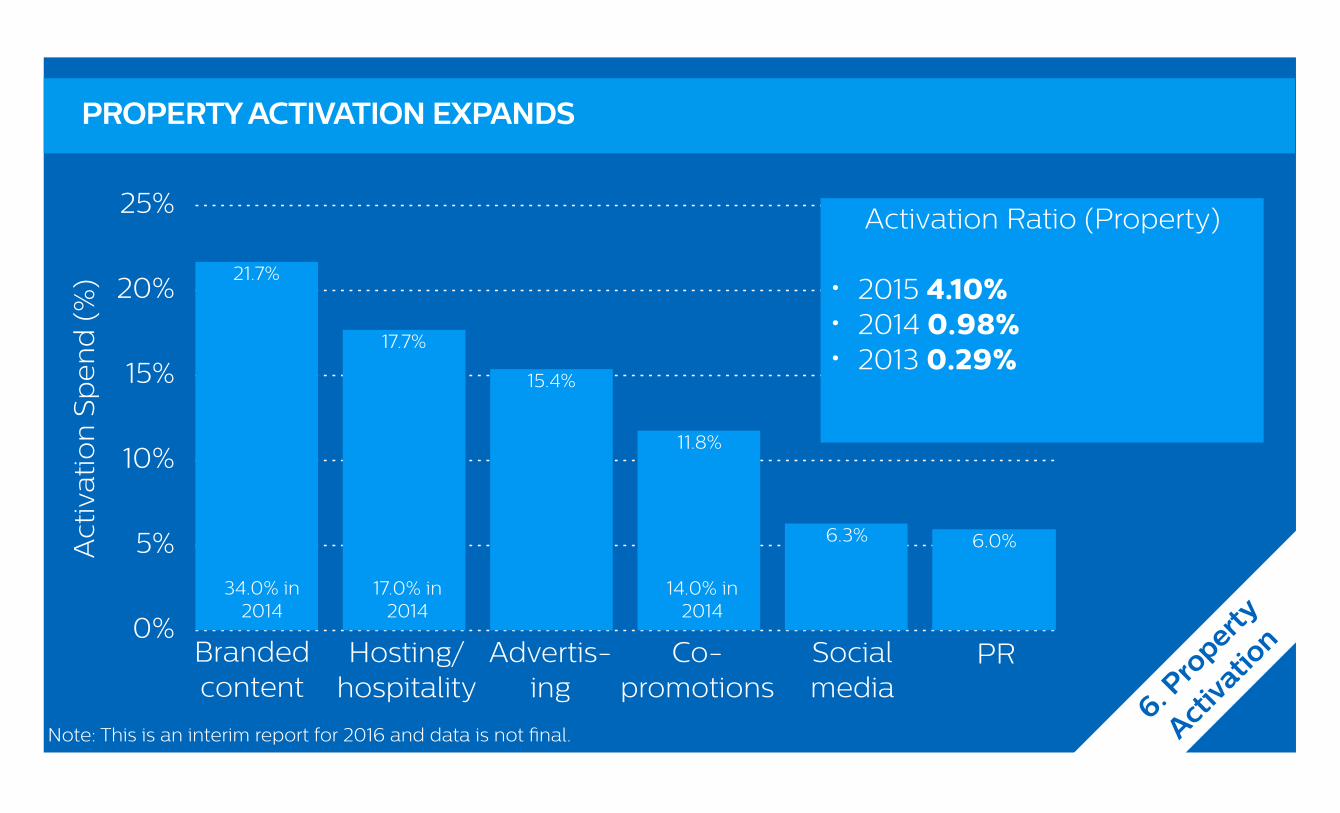
PROPERTY ACTIVATION EXPANDS
0%
5%
10%
15%
20%
25%
6.0%6.3%
11.8%
15.4%
17.7%
21.7%
Act
ivat
ion
Sp
en
d (
%)
6. Pro
perty
Activa
tion
34.0% in 2014
17.0% in 2014
14.0% in 2014
Activation Ratio (Property)
• 2015 4.10%• 2014 0.98%• 2013 0.29%
Branded content
Hosting/hospitality
Advertis-ing
Co-promotions
Socialmedia
PR
Note: This is an interim report for 2016 and data is not final.
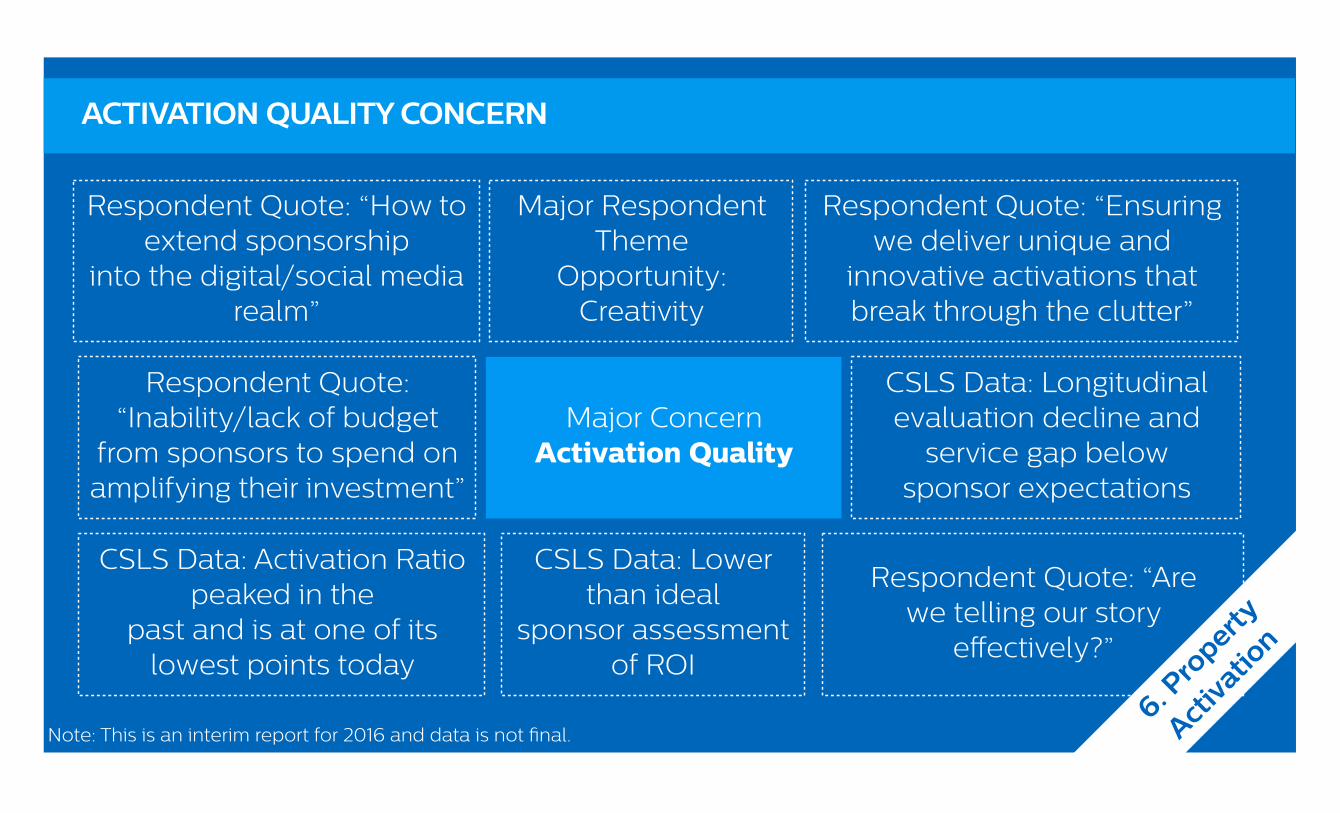
Respondent Quote: “Inability/lack of budget
from sponsors to spend on amplifying their investment”
ACTIVATION QUALITY CONCERN
Respondent Quote: “How to extend sponsorship
into the digital/social media realm”
Major Concern Activation Quality
Major Respondent Theme
Opportunity: Creativity
Respondent Quote: “Ensuring we deliver unique and
innovative activations that break through the clutter”
CSLS Data: Longitudinal evaluation decline and
service gap belowsponsor expectations
CSLS Data: Lower than ideal
sponsor assessment of ROI
CSLS Data: Activation Ratio peaked in the
past and is at one of its lowest points today
Respondent Quote: “Are we telling our story
effectively?”
6. Pro
perty
Activa
tion
Note: This is an interim report for 2016 and data is not final.
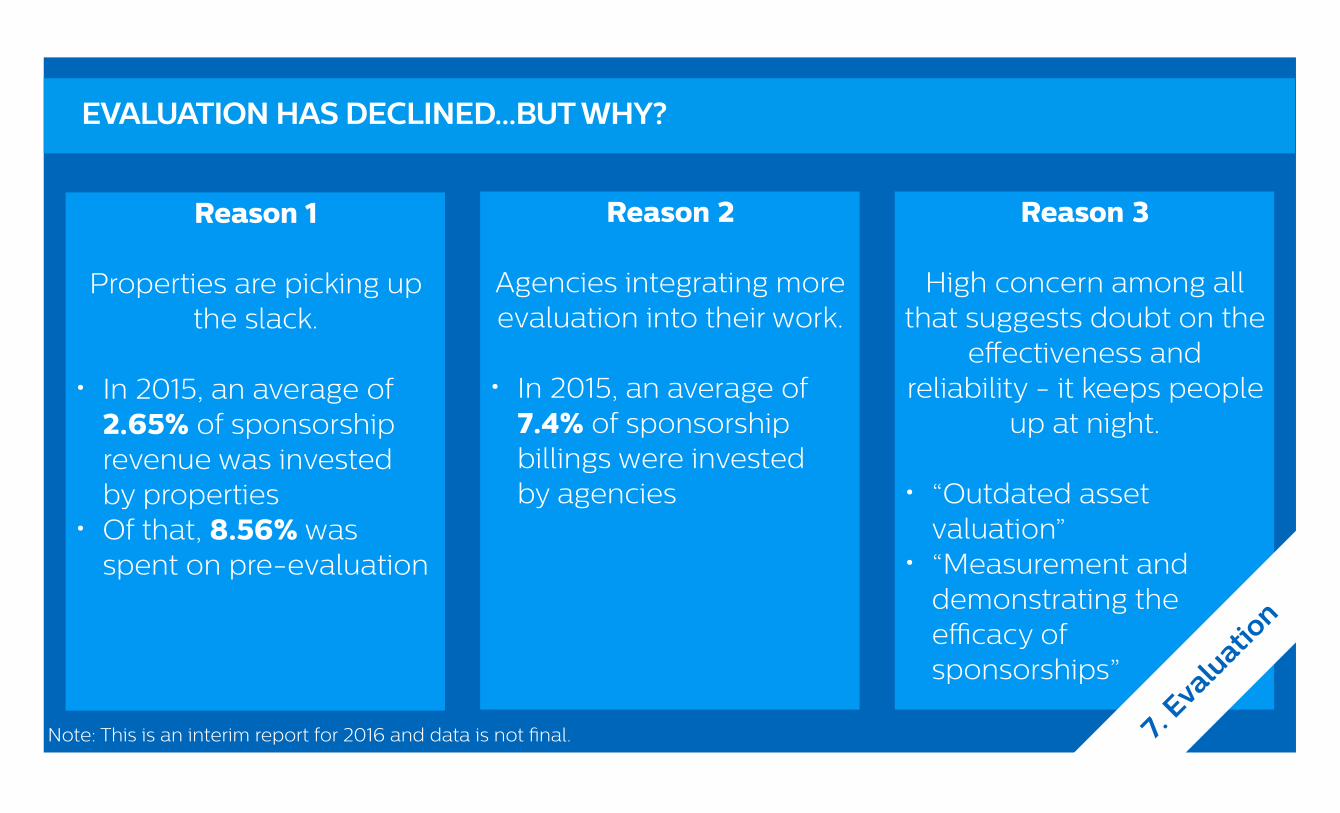
EVALUATION HAS DECLINED...BUT WHY?
Reason 1
Properties are picking up the slack.
• In 2015, an average of 2.65% of sponsorship revenue was invested by properties
• Of that, 8.56% was spent on pre-evaluation
Reason 2
Agencies integrating more evaluation into their work.
• In 2015, an average of 7.4% of sponsorship billings were invested by agencies
Reason 3
High concern among all that suggests doubt on the
effectiveness and reliability - it keeps people
up at night.
• “Outdated asset valuation”
• “Measurement and demonstrating the efficacy of sponsorships”
7. Eva
luatio
n
Note: This is an interim report for 2016 and data is not final.
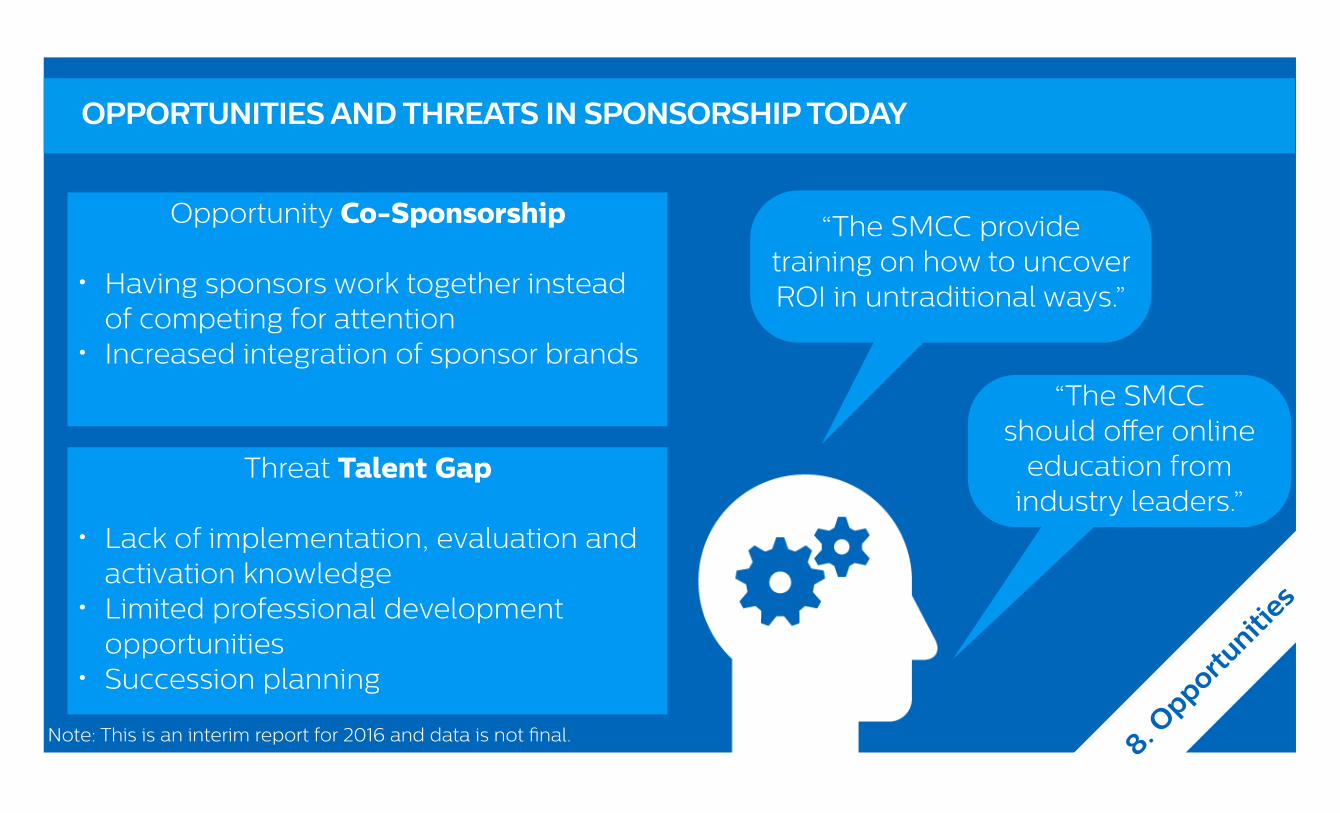
OPPORTUNITIES AND THREATS IN SPONSORSHIP TODAY
Opportunity Co-Sponsorship
• Having sponsors work together instead of competing for attention
• Increased integration of sponsor brands
Threat Talent Gap
• Lack of implementation, evaluation and activation knowledge
• Limited professional development opportunities
• Succession planning
8. Opportu
nities
“The SMCC provide training on how to uncover ROI in untraditional ways.”
“The SMCC should offer online
education from industry leaders.”
Note: This is an interim report for 2016 and data is not final.
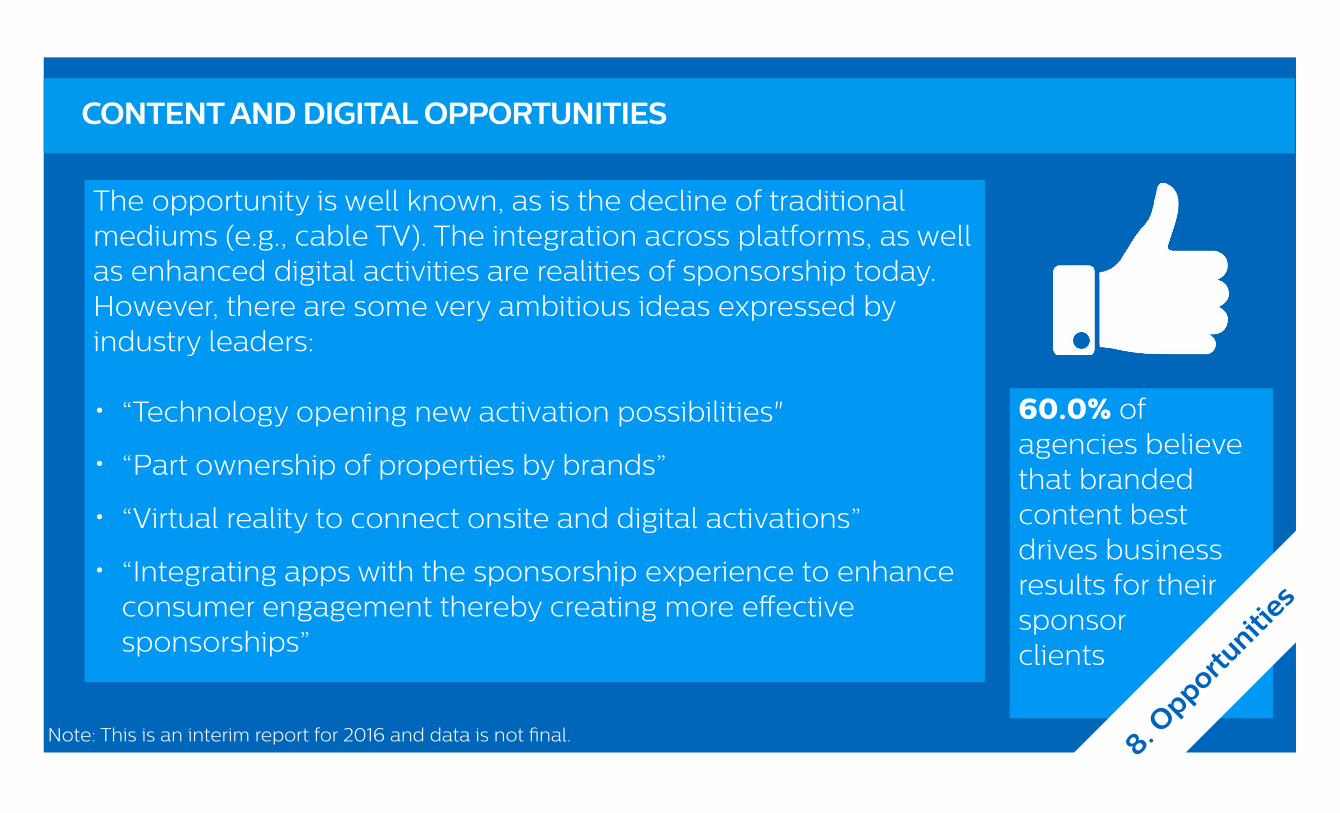
CONTENT AND DIGITAL OPPORTUNITIES
60.0% of agencies believe that branded content best drives business results for their sponsor clients
8. Opportu
nities
The opportunity is well known, as is the decline of traditional mediums (e.g., cable TV). The integration across platforms, as well as enhanced digital activities are realities of sponsorship today. However, there are some very ambitious ideas expressed by industry leaders:
• “Technology opening new activation possibilities"
• “Part ownership of properties by brands”
• “Virtual reality to connect onsite and digital activations”
• “Integrating apps with the sponsorship experience to enhance consumer engagement thereby creating more effective sponsorships”
Note: This is an interim report for 2016 and data is not final.
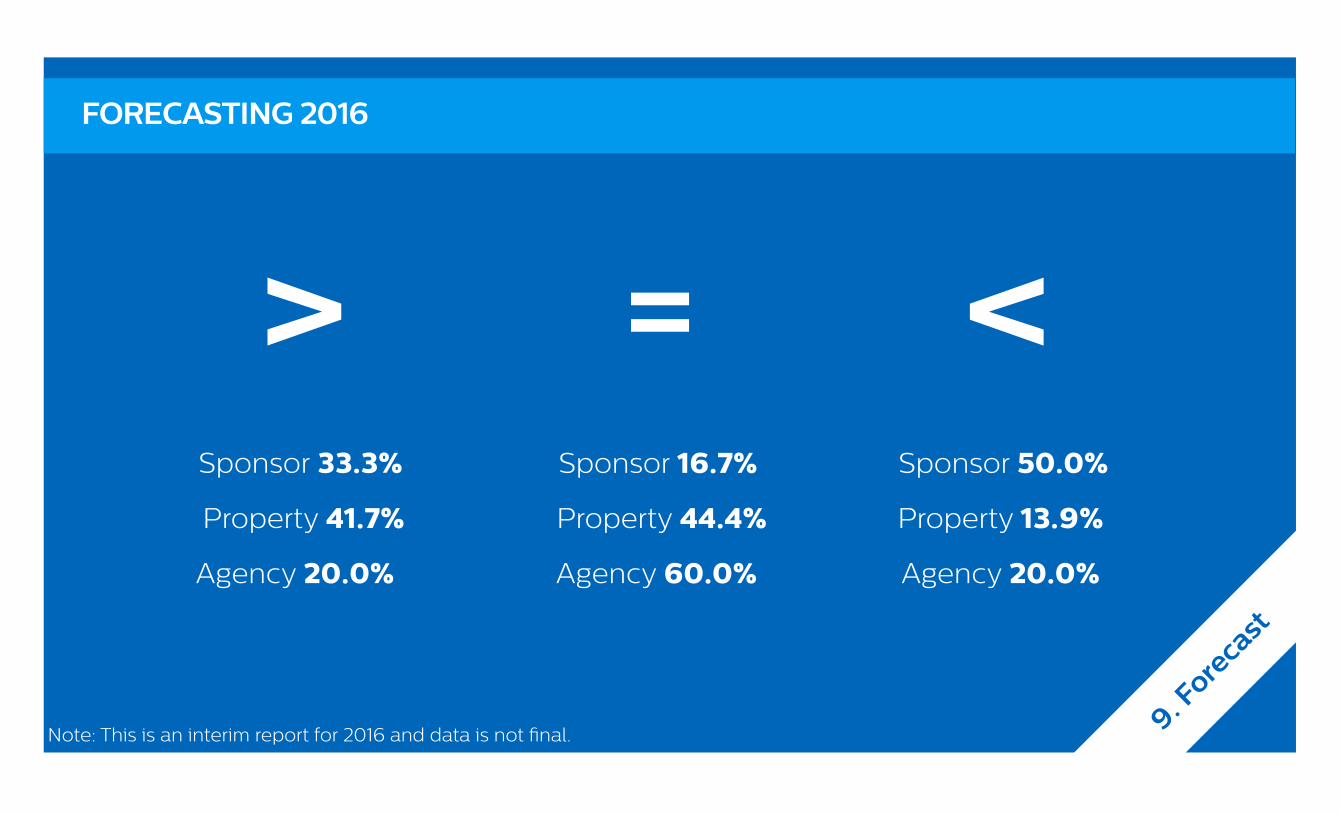
FORECASTING 2016
Sponsor 33.3%
Property 41.7%
Agency 20.0%
>Sponsor 16.7%
Property 44.4%
Agency 60.0%
=Sponsor 50.0%
Property 13.9%
Agency 20.0%
<
9. Fore
cast
Note: This is an interim report for 2016 and data is not final.
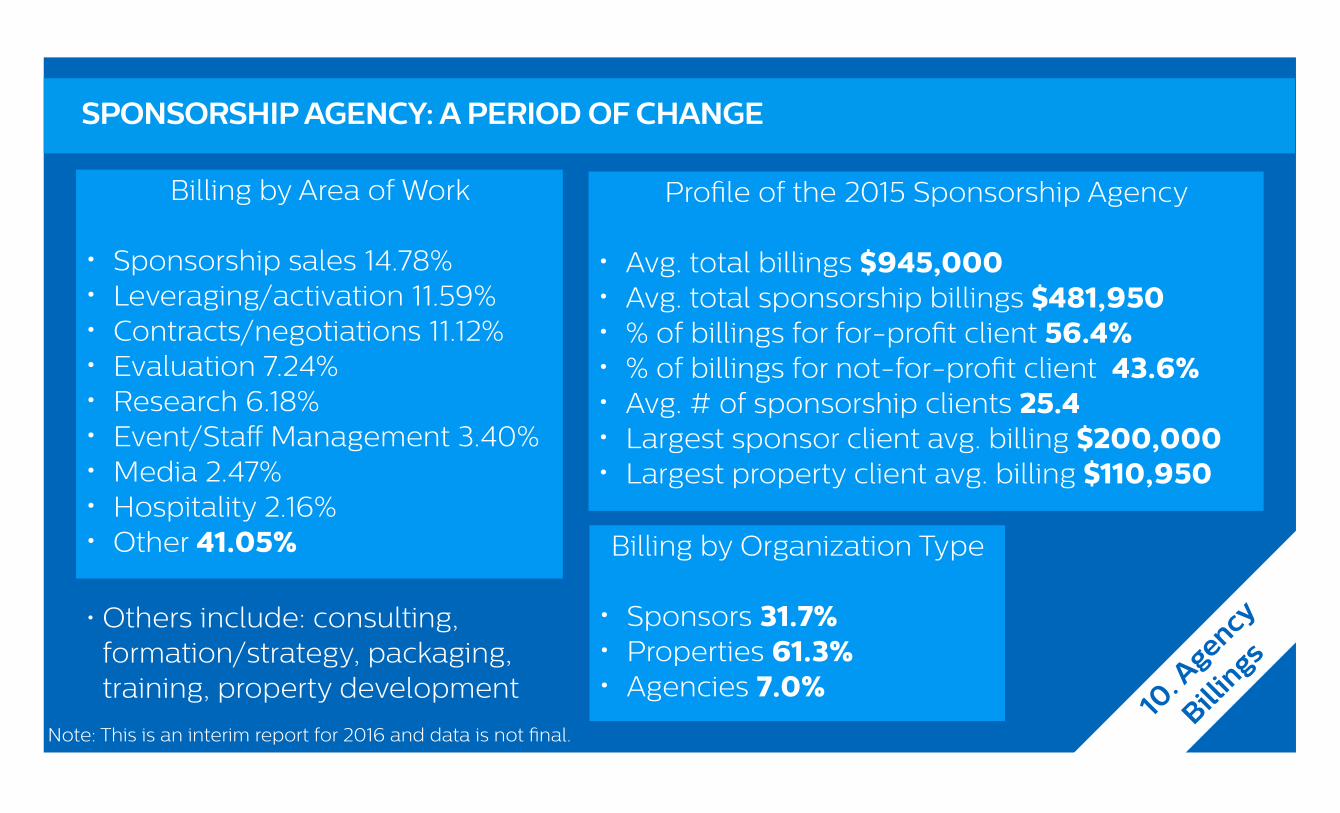
SPONSORSHIP AGENCY: A PERIOD OF CHANGE
10. A
gency
Billin
gs
Profile of the 2015 Sponsorship Agency
• Avg. total billings $945,000• Avg. total sponsorship billings $481,950• % of billings for for-profit client 56.4%• % of billings for not-for-profit client 43.6%• Avg. # of sponsorship clients 25.4• Largest sponsor client avg. billing $200,000• Largest property client avg. billing $110,950
Billing by Area of Work
• Sponsorship sales 14.78%• Leveraging/activation 11.59%• Contracts/negotiations 11.12%• Evaluation 7.24%• Research 6.18%• Event/Staff Management 3.40%• Media 2.47%• Hospitality 2.16%• Other 41.05% Billing by Organization Type
• Sponsors 31.7%• Properties 61.3%• Agencies 7.0%
• Others include: consulting, formation/strategy, packaging, training, property development
Note: This is an interim report for 2016 and data is not final.
A Decade of Data: 2006-2015FINDINGS & TRENDS
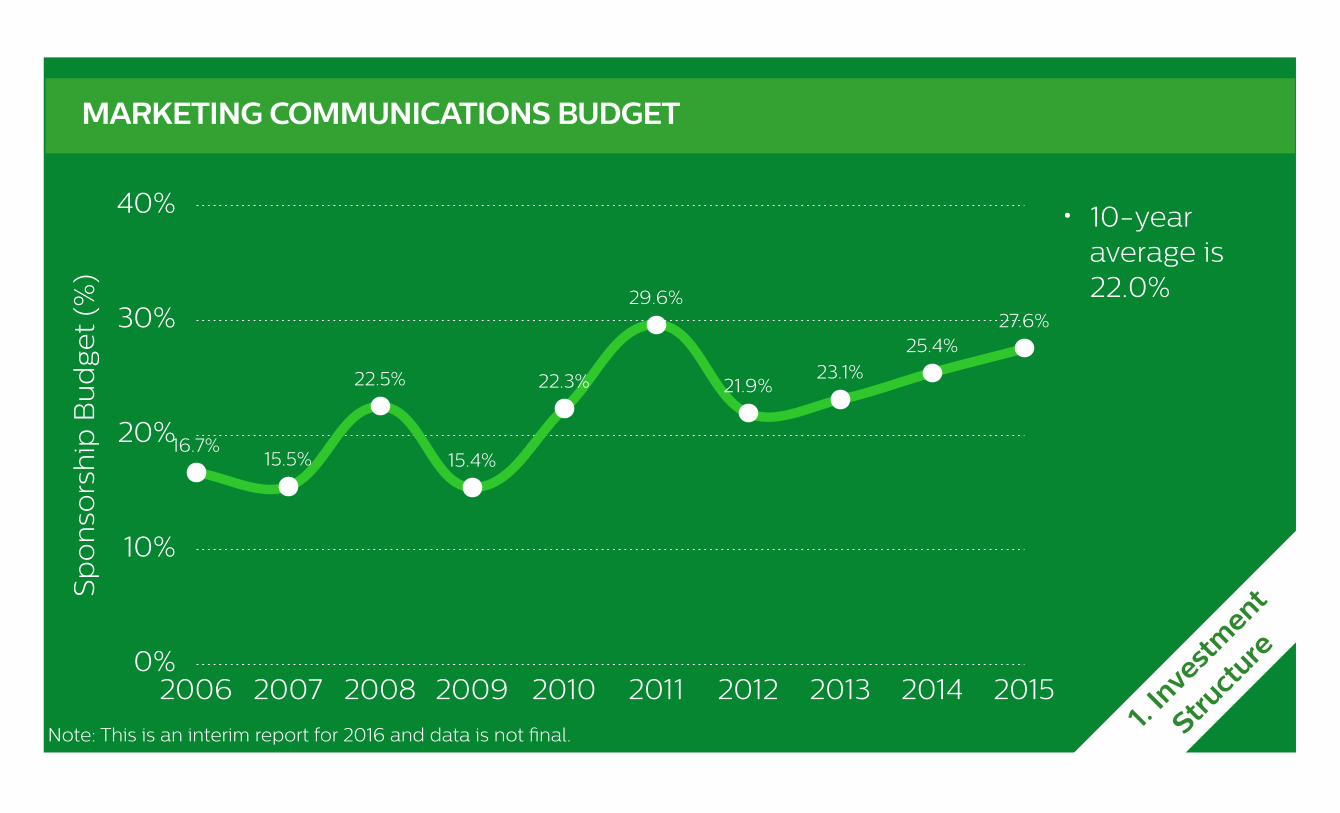
MARKETING COMMUNICATIONS BUDGET
0%
10%
20%
30%
40%
2006 2007 2008 2009 2010 2011 2012 2013 2014 2015
16.7%15.5%
22.5%
15.4%
22.3%
29.6%
21.9%23.1%
25.4%27.6%
Sp
on
sors
hip
Bu
dge
t (%
)
• 10-year average is 22.0%
1. In
vest
ment
Struct
ure
Note: This is an interim report for 2016 and data is not final.
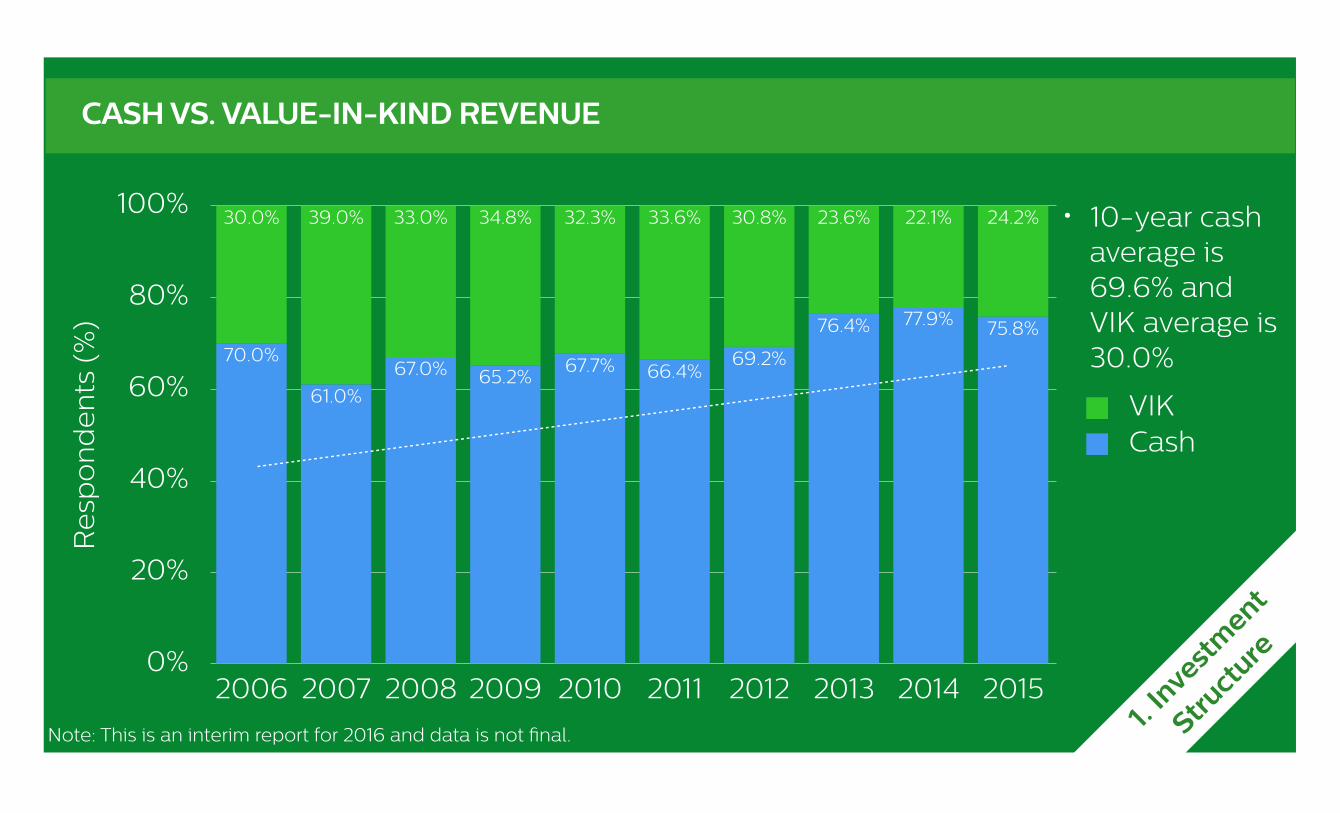
• 10-year cash average is 69.6% and VIK average is 30.0%
CASH VS. VALUE-IN-KIND REVENUE
0%
20%
40%
60%
80%
100%
2006 2007 2008 2009 2010 2011 2012 2013 2014 2015
24.2%22.1%23.6%30.8%33.6%32.3%34.8%33.0%39.0%30.0%
75.8%77.9%76.4%
69.2%66.4%67.7%
65.2%67.0%61.0%
70.0%
Re
spo
nd
en
ts (
%)
CashVIK
1. In
vest
ment
Struct
ure
Note: This is an interim report for 2016 and data is not final.
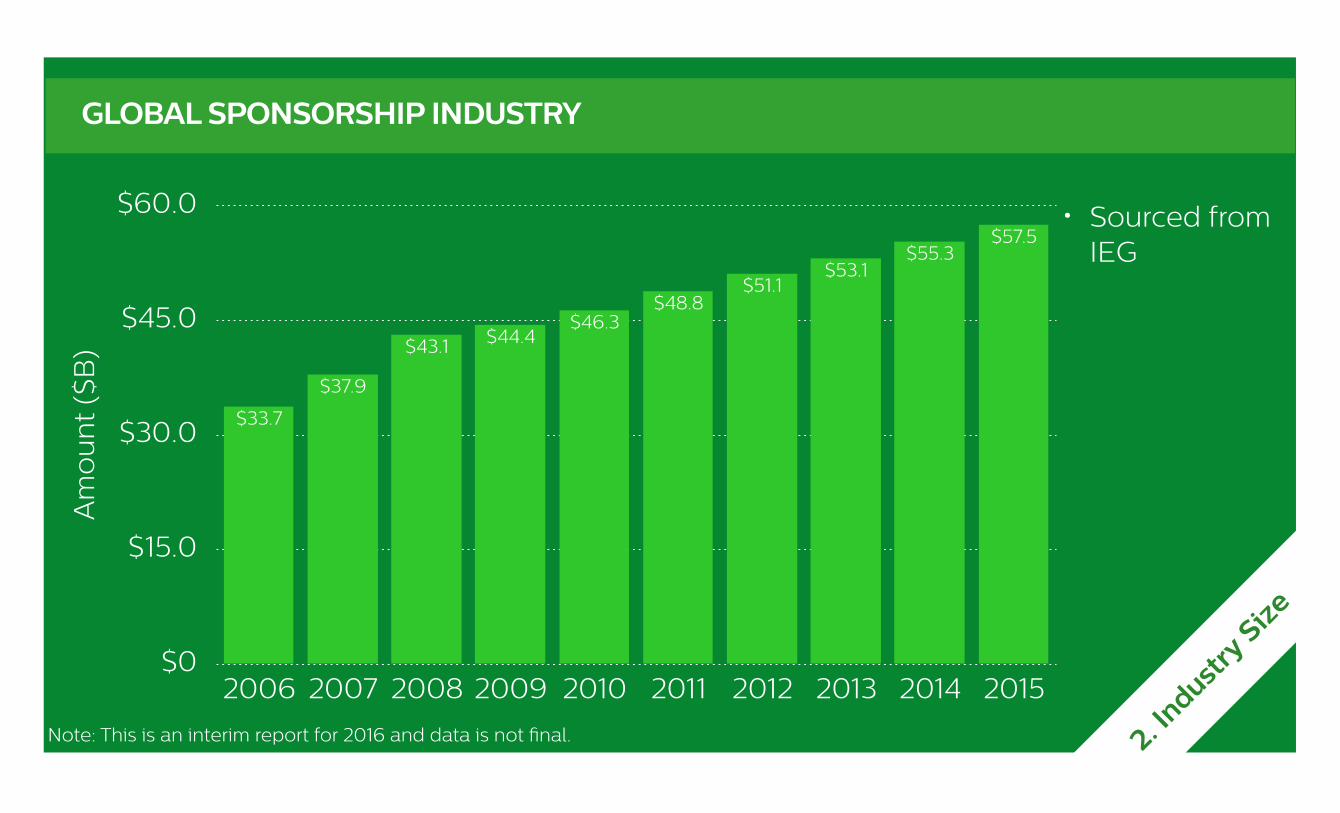
GLOBAL SPONSORSHIP INDUSTRY
$0
$15.0
$30.0
$45.0
$60.0
2006 2007 2008 2009 2010 2011 2012 2013 2014 2015
$57.5$55.3
$53.1$51.1
$48.8$46.3
$44.4$43.1
$37.9
$33.7
Am
ou
nt
($B
)
2. Indust
ry S
ize
• Sourced from IEG
Note: This is an interim report for 2016 and data is not final.
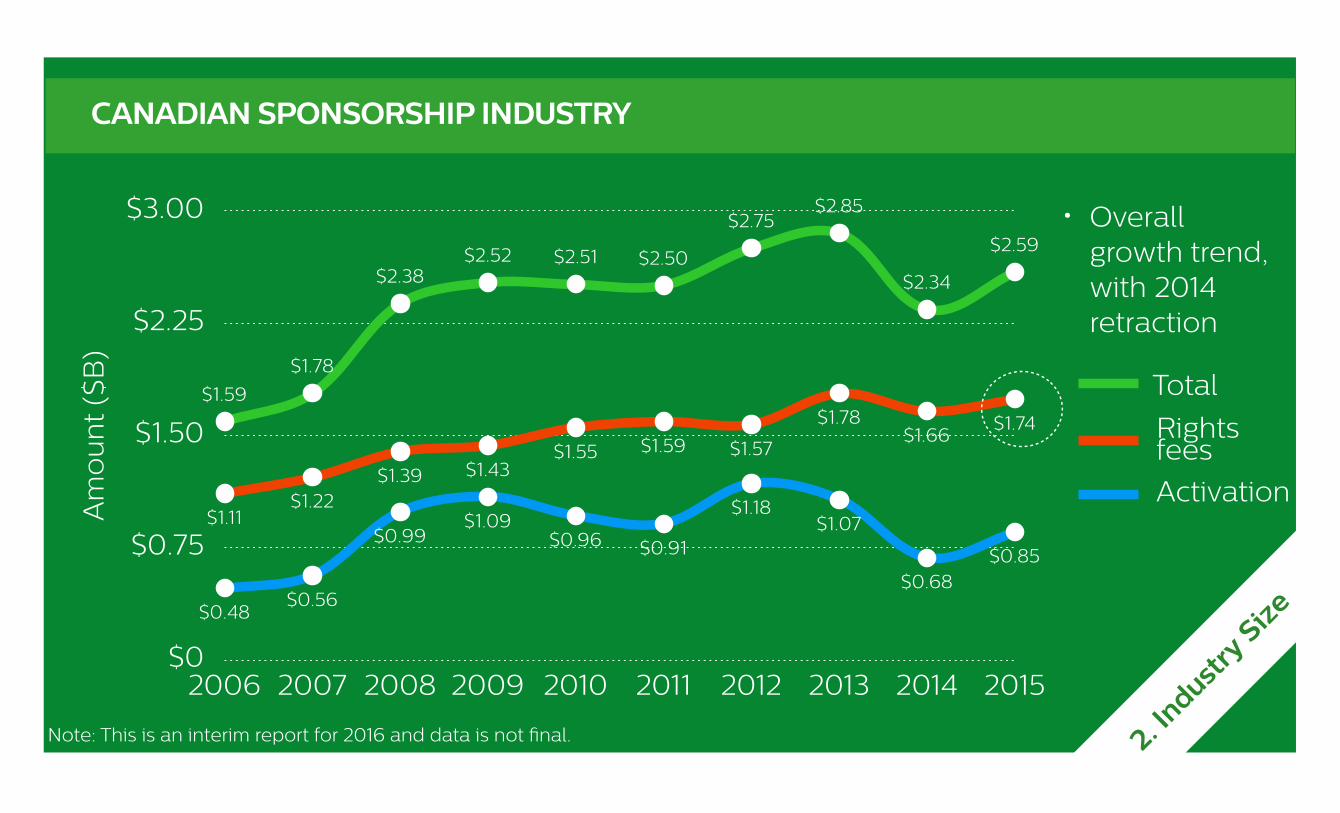
CANADIAN SPONSORSHIP INDUSTRY
$0
$0.75
$1.50
$2.25
$3.00
2006 2007 2008 2009 2010 2011 2012 2013 2014 2015
$1.59
$1.78
$2.38$2.52 $2.51 $2.50
$2.75$2.85
$2.34
$2.59
$0.48$0.56
$0.99$1.09
$0.96 $0.91
$1.18$1.07
$0.68$0.85
$1.11$1.22
$1.39 $1.43$1.55 $1.59 $1.57
$1.78$1.66
$1.74
Am
ou
nt
($B
)
2. Indust
ry S
ize
• Overall growth trend, with 2014 retraction
Activation
Rights fees
Total
Note: This is an interim report for 2016 and data is not final.
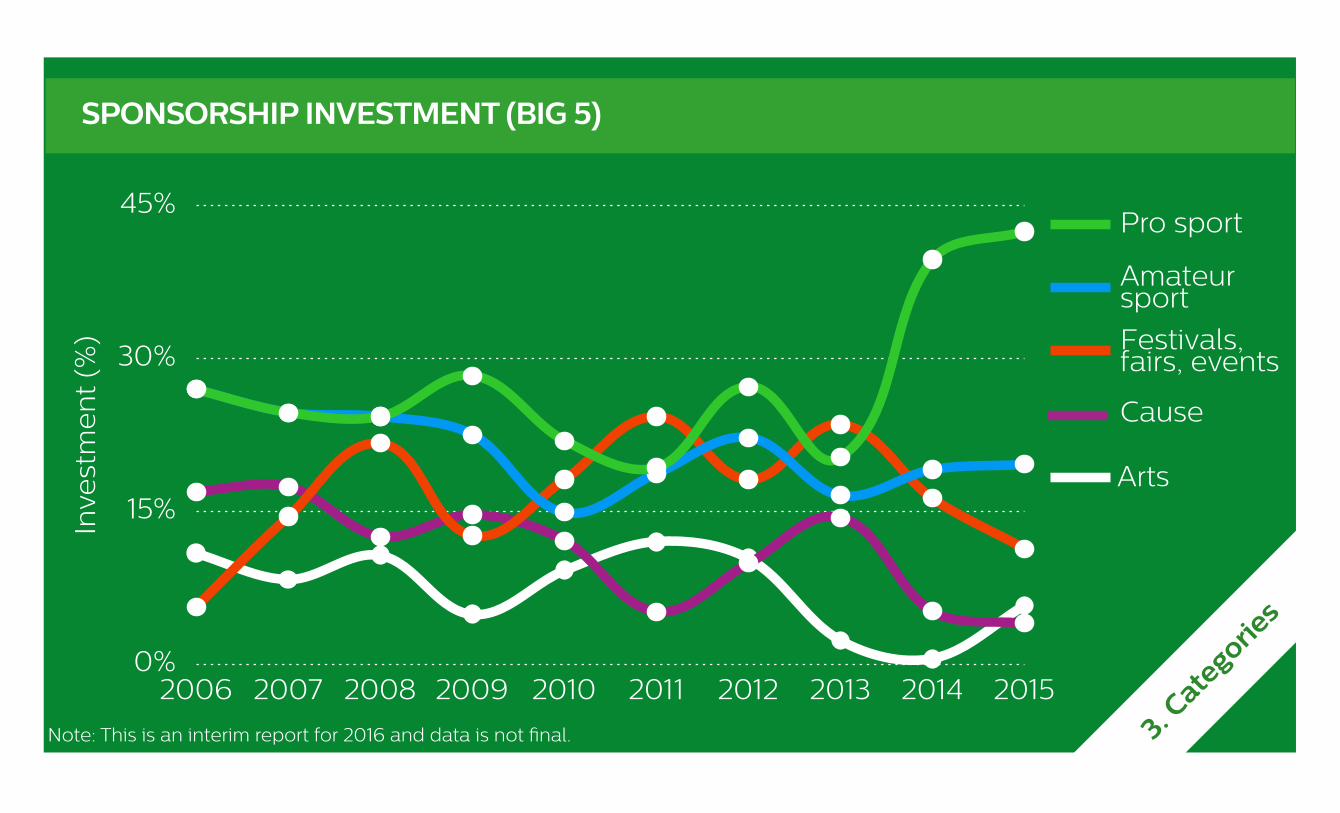
SPONSORSHIP INVESTMENT (BIG 5)
0%
15%
30%
45%
2006 2007 2008 2009 2010 2011 2012 2013 2014 2015
Inve
stm
en
t (%
) Festivals, fairs, events
Cause
Amateur sport
Pro sport
Arts
3. Cate
gories
Note: This is an interim report for 2016 and data is not final.
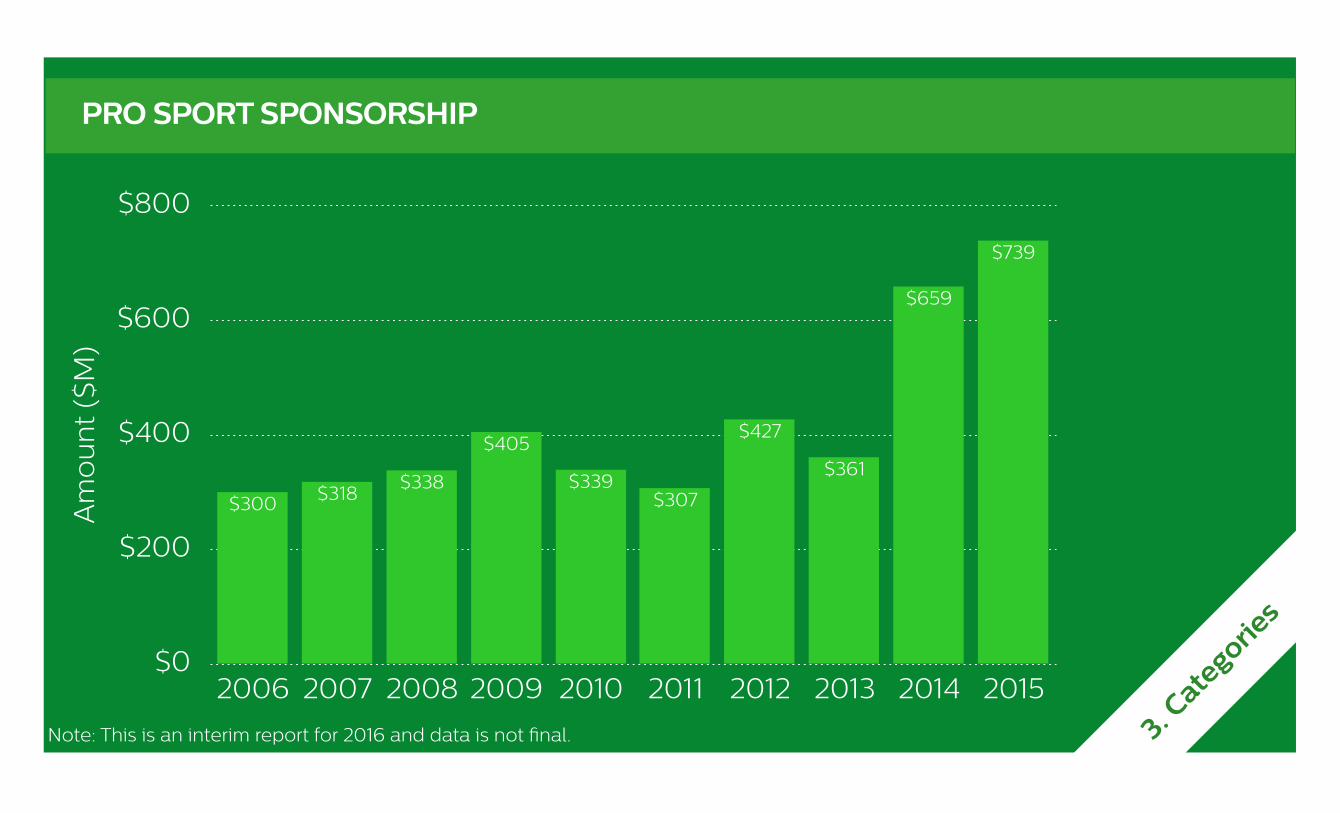
PRO SPORT SPONSORSHIP
$0
$200
$400
$600
$800
2006 2007 2008 2009 2010 2011 2012 2013 2014 2015
$739
$659
$361
$427
$307$339
$405
$338$318$300A
mo
un
t ($
M)
3. Cate
gories
Note: This is an interim report for 2016 and data is not final.
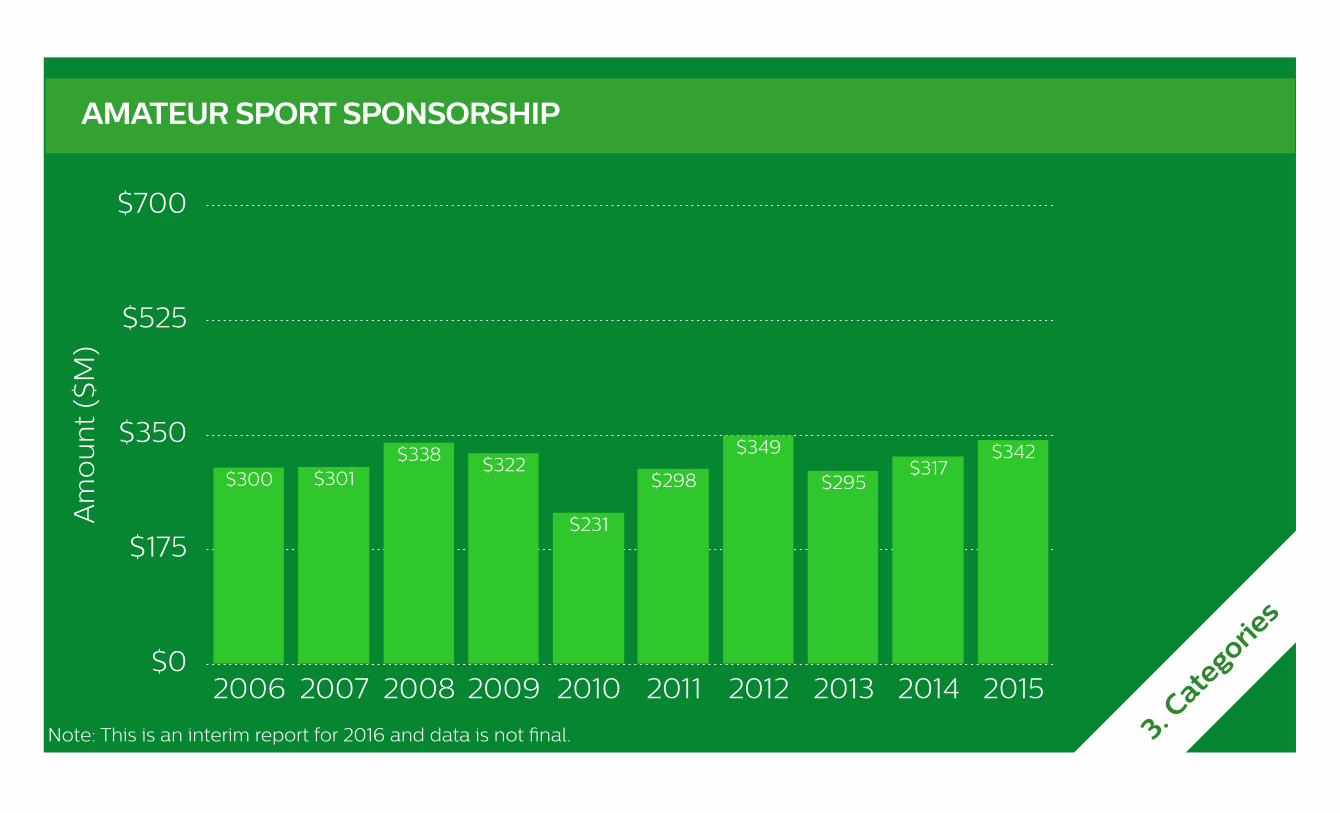
AMATEUR SPORT SPONSORSHIP
$0
$175
$350
$525
$700
2006 2007 2008 2009 2010 2011 2012 2013 2014 2015
$342$317
$295
$349
$298
$231
$322$338$301$300
Am
ou
nt
($M
)
3. Cate
gories
Note: This is an interim report for 2016 and data is not final.
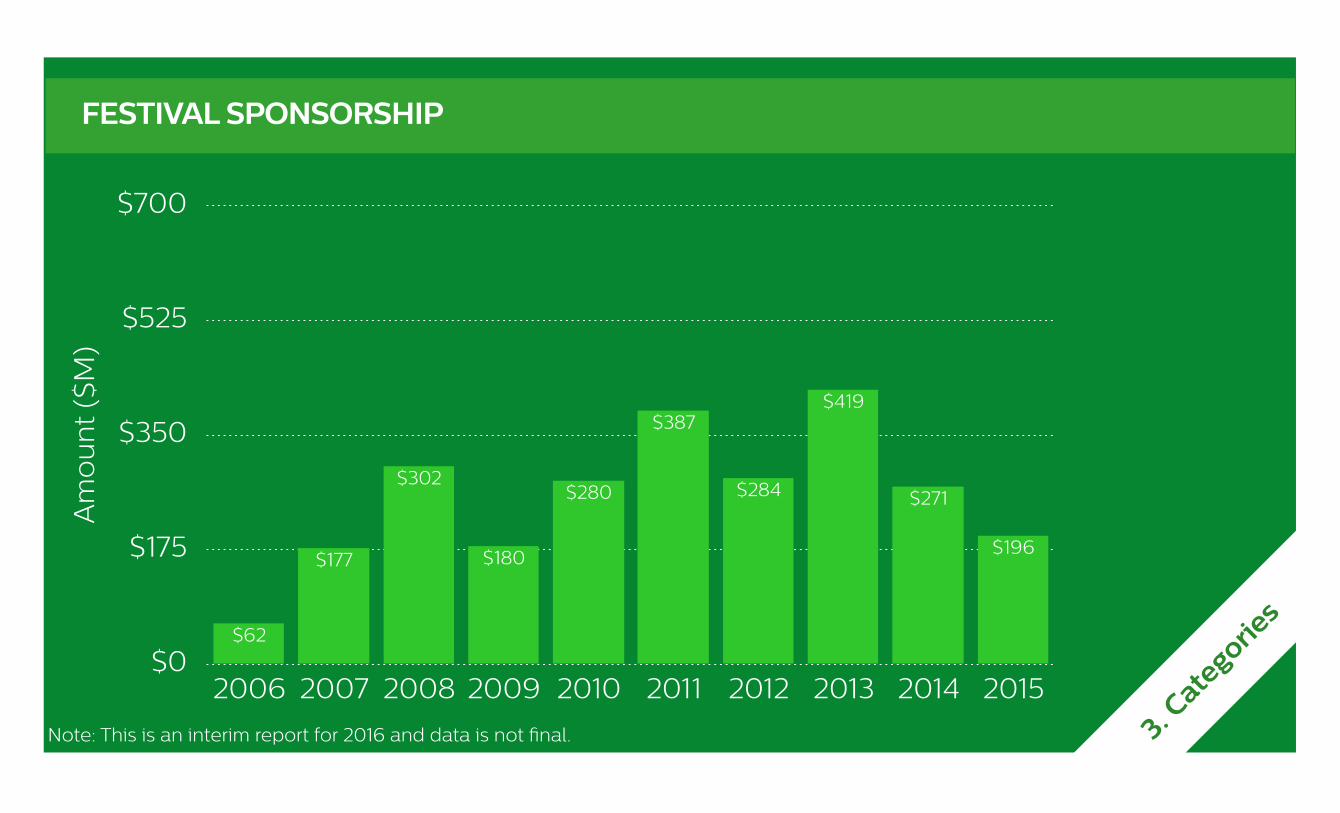
FESTIVAL SPONSORSHIP
$0
$175
$350
$525
$700
2006 2007 2008 2009 2010 2011 2012 2013 2014 2015
$196
$271
$419
$284
$387
$280
$180
$302
$177
$62
Am
ou
nt
($M
)
3. Cate
gories
Note: This is an interim report for 2016 and data is not final.
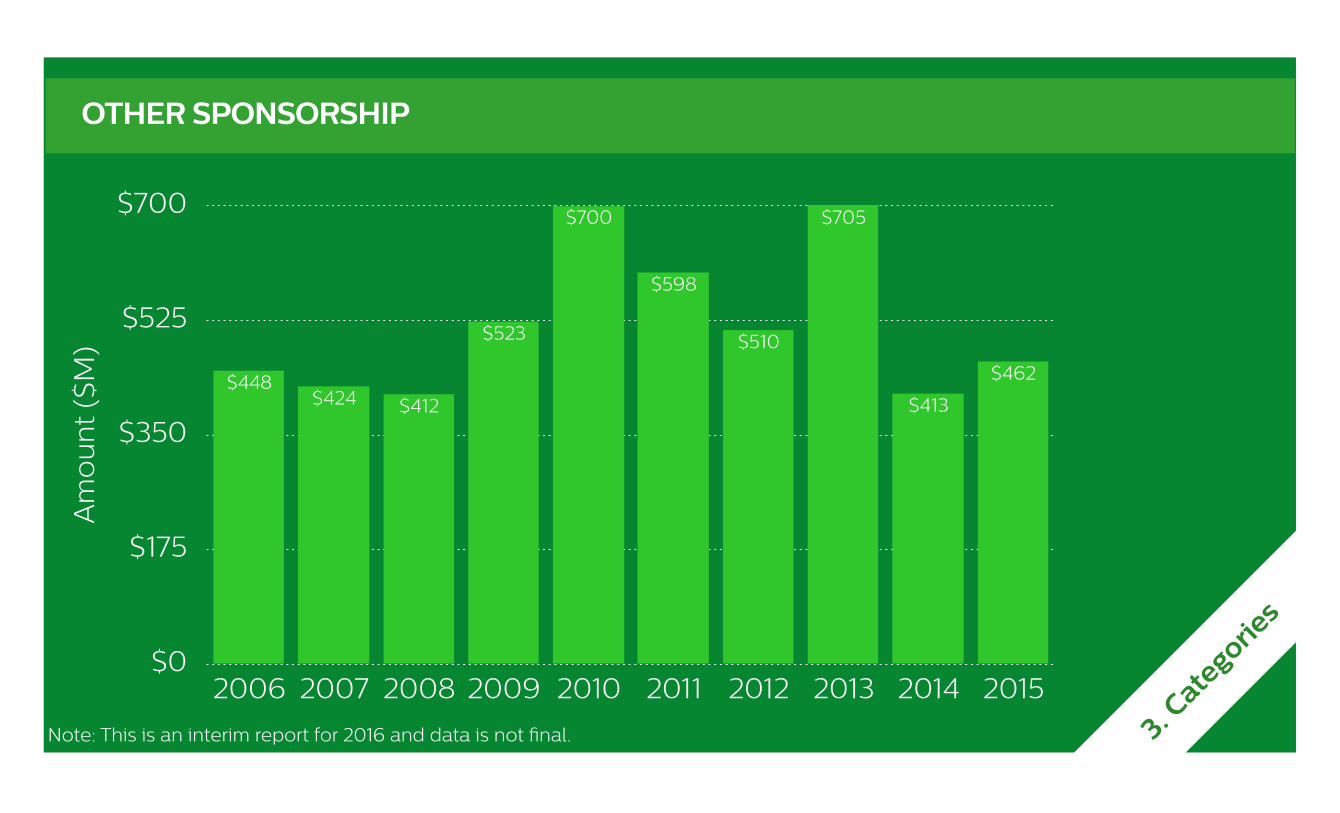
OTHER SPONSORSHIP
$0
$175
$350
$525
$700
2006 2007 2008 2009 2010 2011 2012 2013 2014 2015
$462
$413
$705
$510
$598
$700
$523
$412$424$448
Am
ou
nt
($M
)
3. Cate
gories
Note: This is an interim report for 2016 and data is not final.
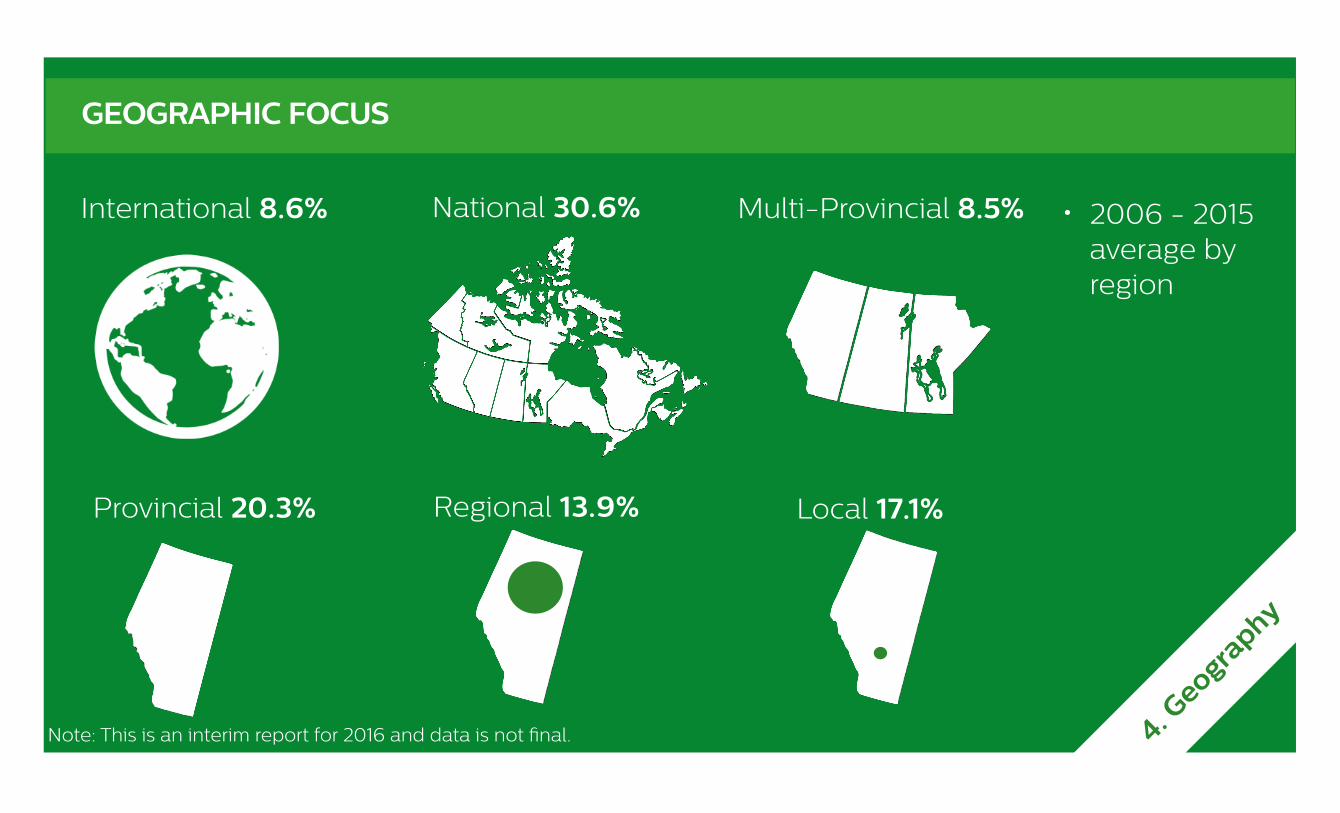
GEOGRAPHIC FOCUS
International 8.6% National 30.6% Multi-Provincial 8.5%
Provincial 20.3% Regional 13.9% Local 17.1%
4. Geogra
phy
• 2006 - 2015 average by region
Note: This is an interim report for 2016 and data is not final.
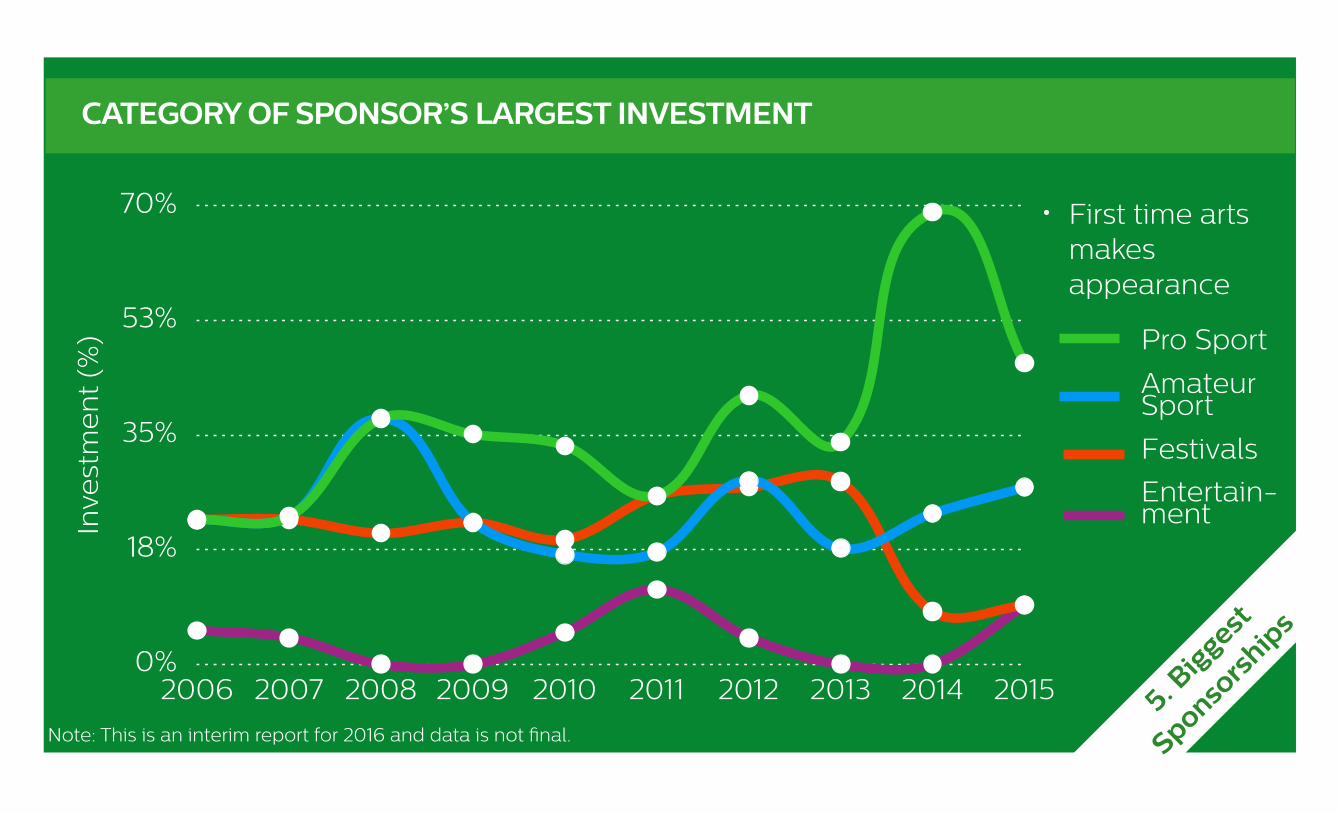
CATEGORY OF SPONSOR’S LARGEST INVESTMENT
0%
18%
35%
53%
70%
2006 2007 2008 2009 2010 2011 2012 2013 2014 2015
Inve
stm
en
t (%
) Pro Sport
Amateur Sport
Festivals
Entertain-ment
5. Big
gest
Sponsors
hips
• First time arts makes appearance
Note: This is an interim report for 2016 and data is not final.
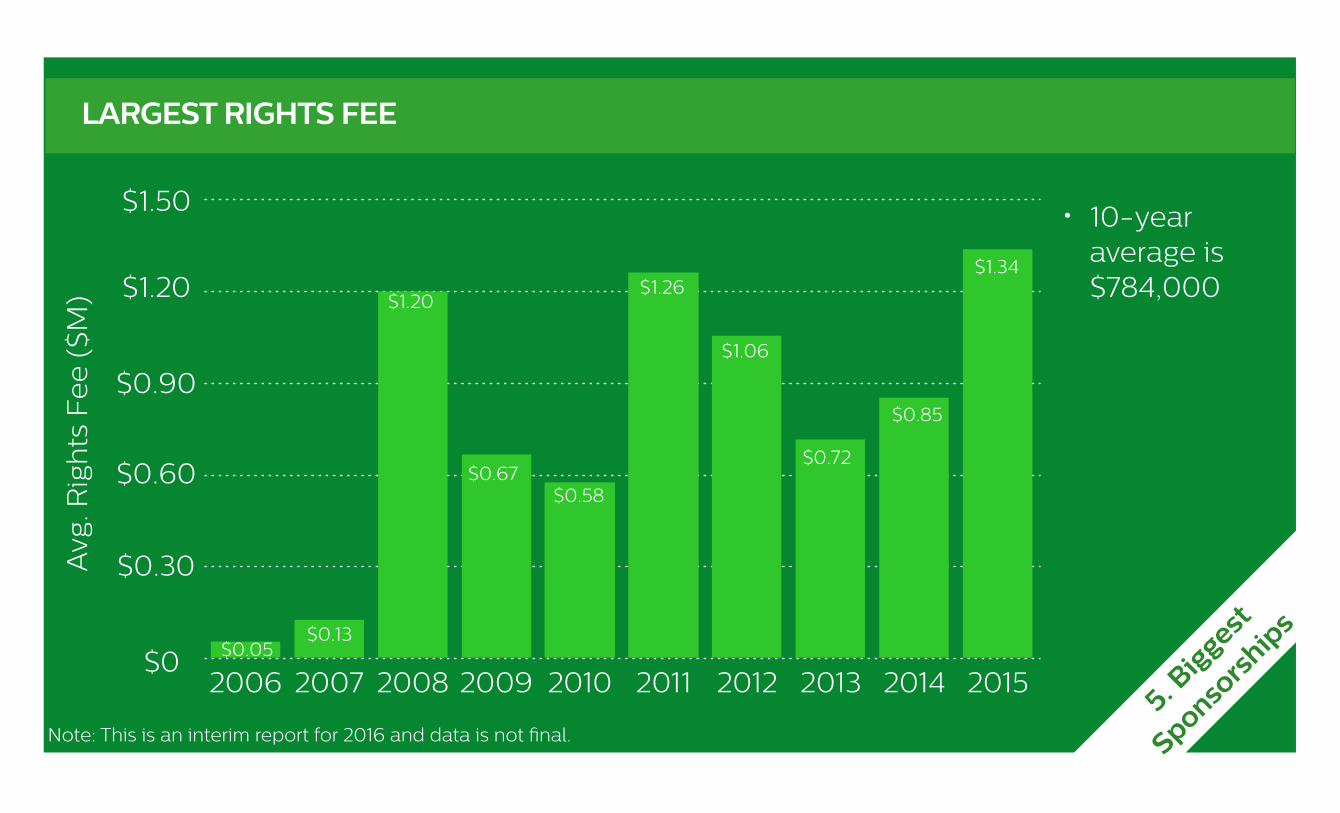
LARGEST RIGHTS FEE
2006 2007 2008 2009 2010 2011 2012 2013 2014 2015
Avg
. Rig
hts
Fe
e (
$M)
$1.50
$1.20
$0.90
$0.60
$0.30
$0 $0.05$0.13
$1.20
$0.67$0.58
$1.26
$1.06
$0.72
$0.85
5. Big
gest
Sponsors
hips
$1.34
• 10-year average is $784,000
Note: This is an interim report for 2016 and data is not final.
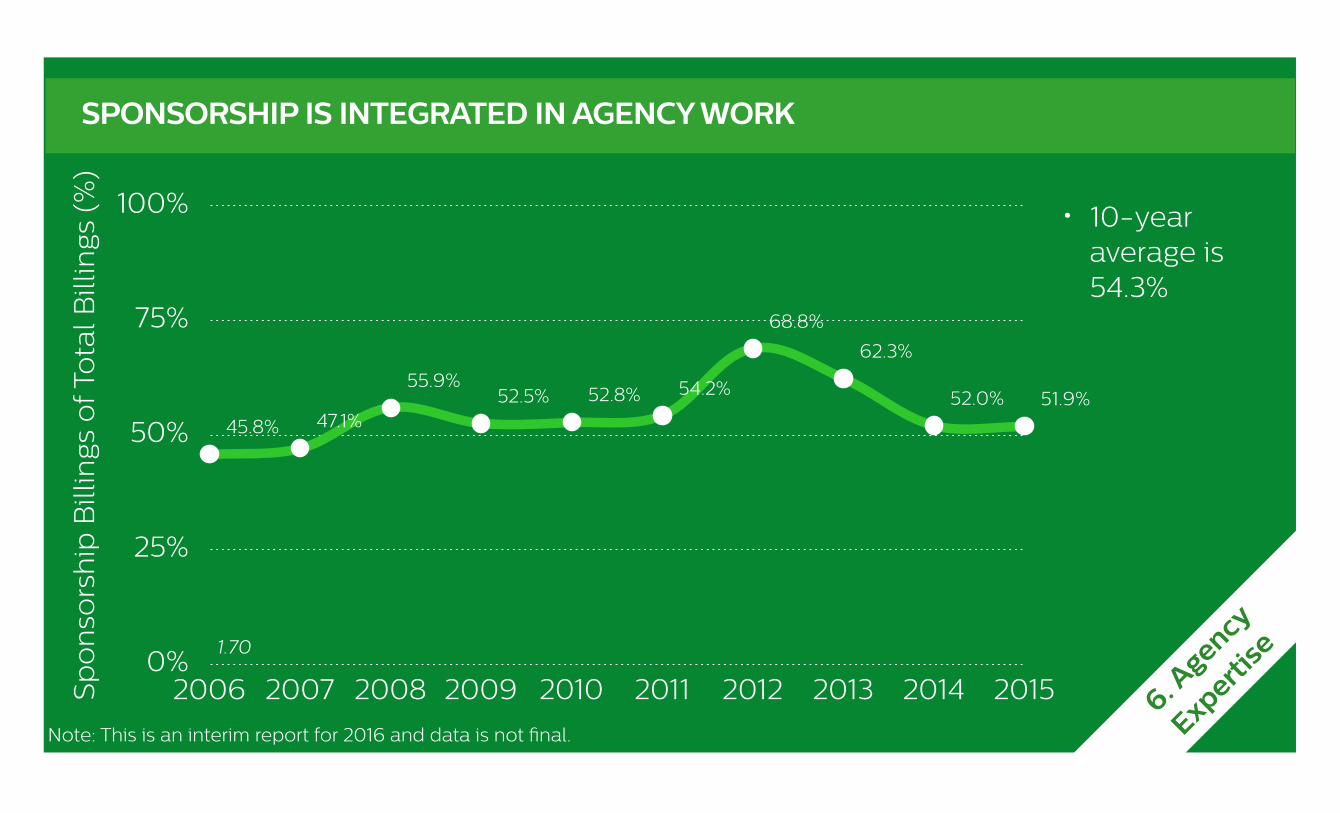
SPONSORSHIP IS INTEGRATED IN AGENCY WORK
0%
25%
50%
75%
100%
2006 2007 2008 2009 2010 2011 2012 2013 2014 2015
45.8% 47.1%
55.9%52.5% 52.8% 54.2%
68.8%
62.3%
52.0% 51.9%
Sp
on
sors
hip
Bill
ings
of T
ota
l Bill
ings
(%
)
1.70
6. Agency
Expertise
• 10-year average is 54.3%
Note: This is an interim report for 2016 and data is not final.
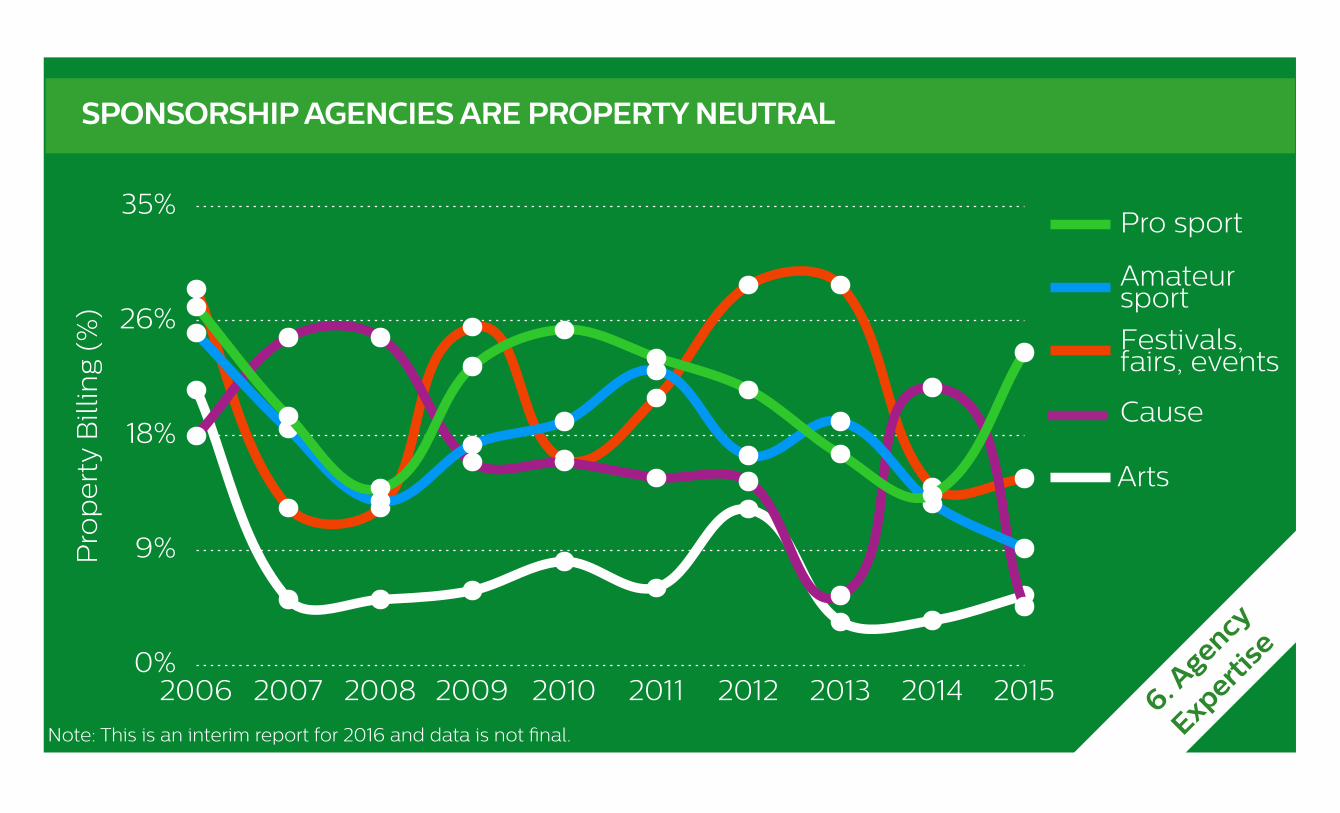
SPONSORSHIP AGENCIES ARE PROPERTY NEUTRAL
0%
9%
18%
26%
35%
2006 2007 2008 2009 2010 2011 2012 2013 2014 2015
Pro
pe
rty
Bill
ing
(%)
Festivals, fairs, events
Cause
Amateur sport
Pro sport
Arts
6. Agency
Expertise
Note: This is an interim report for 2016 and data is not final.
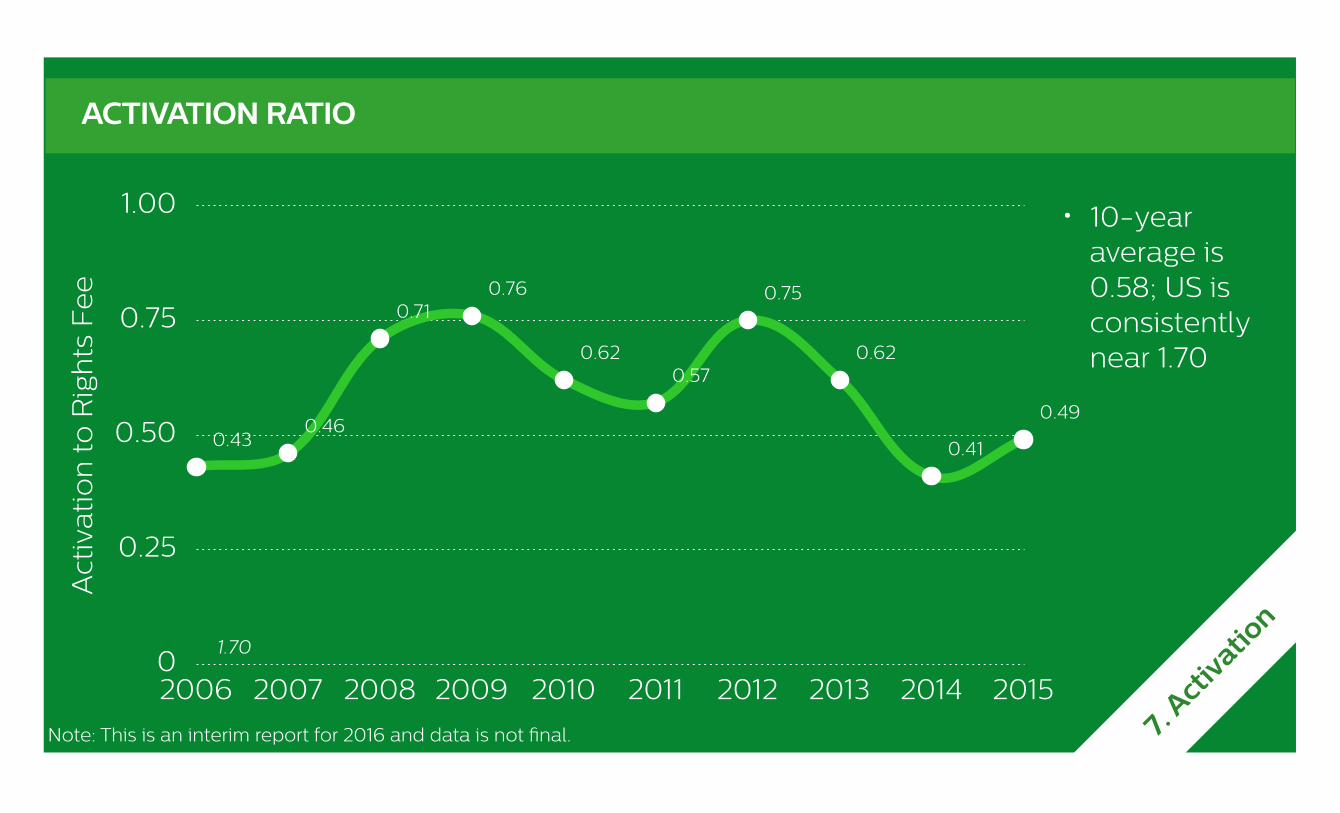
ACTIVATION RATIO
0
0.25
0.50
0.75
1.00
2006 2007 2008 2009 2010 2011 2012 2013 2014 2015
0.430.46
0.710.76
0.620.57
0.75
0.62
0.41
0.49
Act
ivat
ion
to
Rig
hts
Fe
e
1.70
7. Act
ivatio
n
• 10-year average is 0.58; US is consistently near 1.70
Note: This is an interim report for 2016 and data is not final.
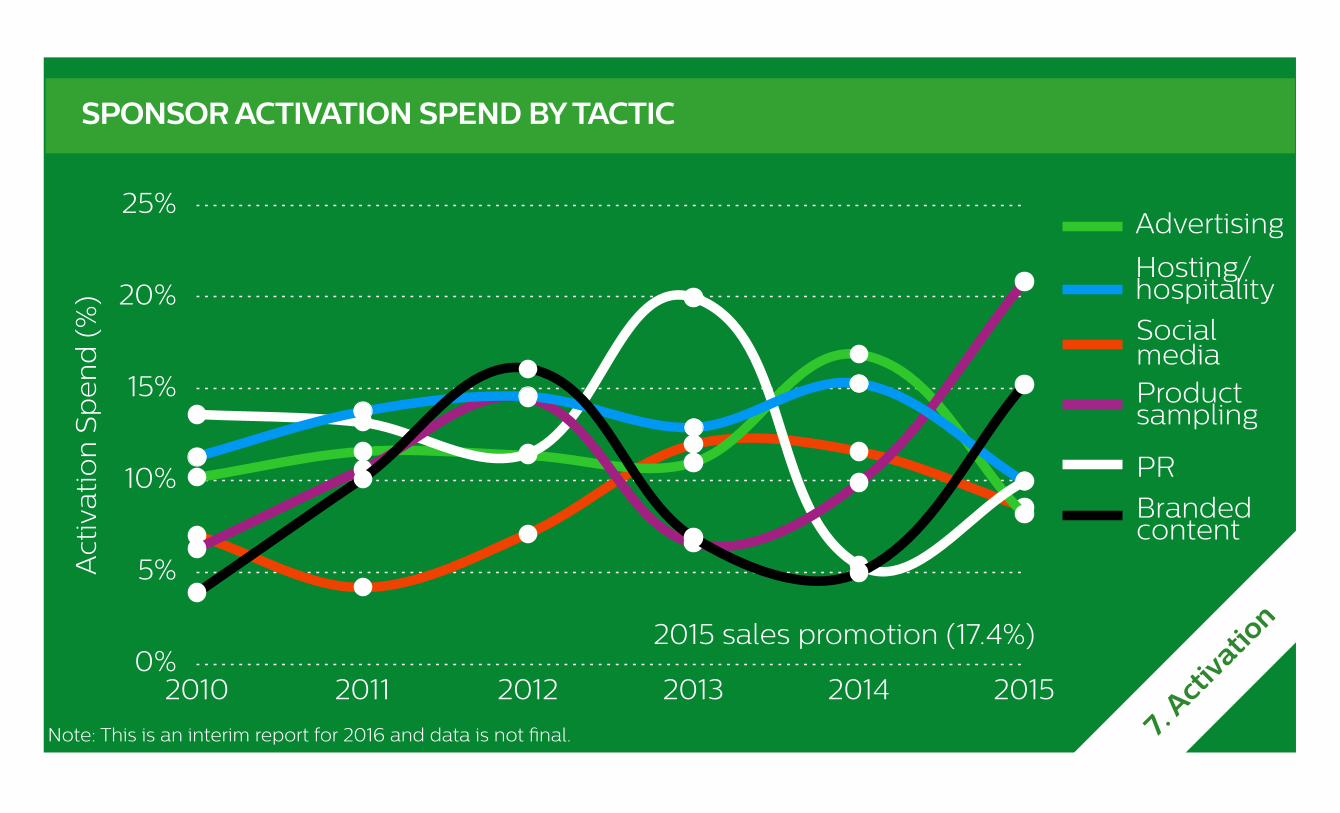
SPONSOR ACTIVATION SPEND BY TACTIC
0%
5%
10%
15%
20%
25%
2010 2011 2012 2013 2014 2015
Act
ivat
ion
Sp
en
d (
%)
Advertising
Social mediaProduct sampling
PR
Hosting/hospitality
Branded content
7. Act
ivatio
n2015 sales promotion (17.4%)
Note: This is an interim report for 2016 and data is not final.
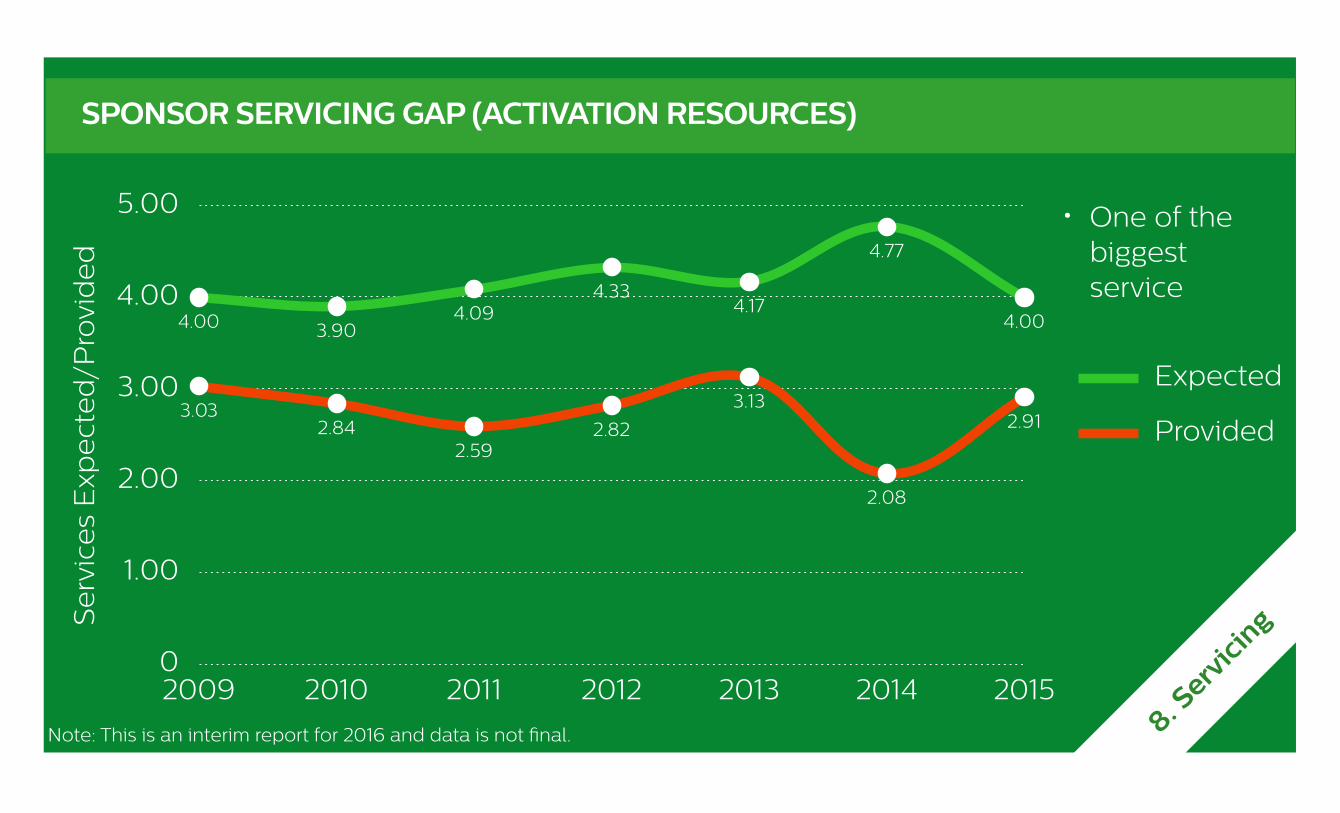
SPONSOR SERVICING GAP (ACTIVATION RESOURCES)
0
1.00
2.00
3.00
4.00
5.00
2009 2010 2011 2012 2013 2014 2015
3.032.84
2.592.82
3.13
2.08
2.91
4.00 3.904.09
4.334.17
4.77
4.00
Se
rvic
es
Exp
ect
ed
/Pro
vid
ed
Expected
Provided
8. Serv
icing
• One of the biggest service
Note: This is an interim report for 2016 and data is not final.
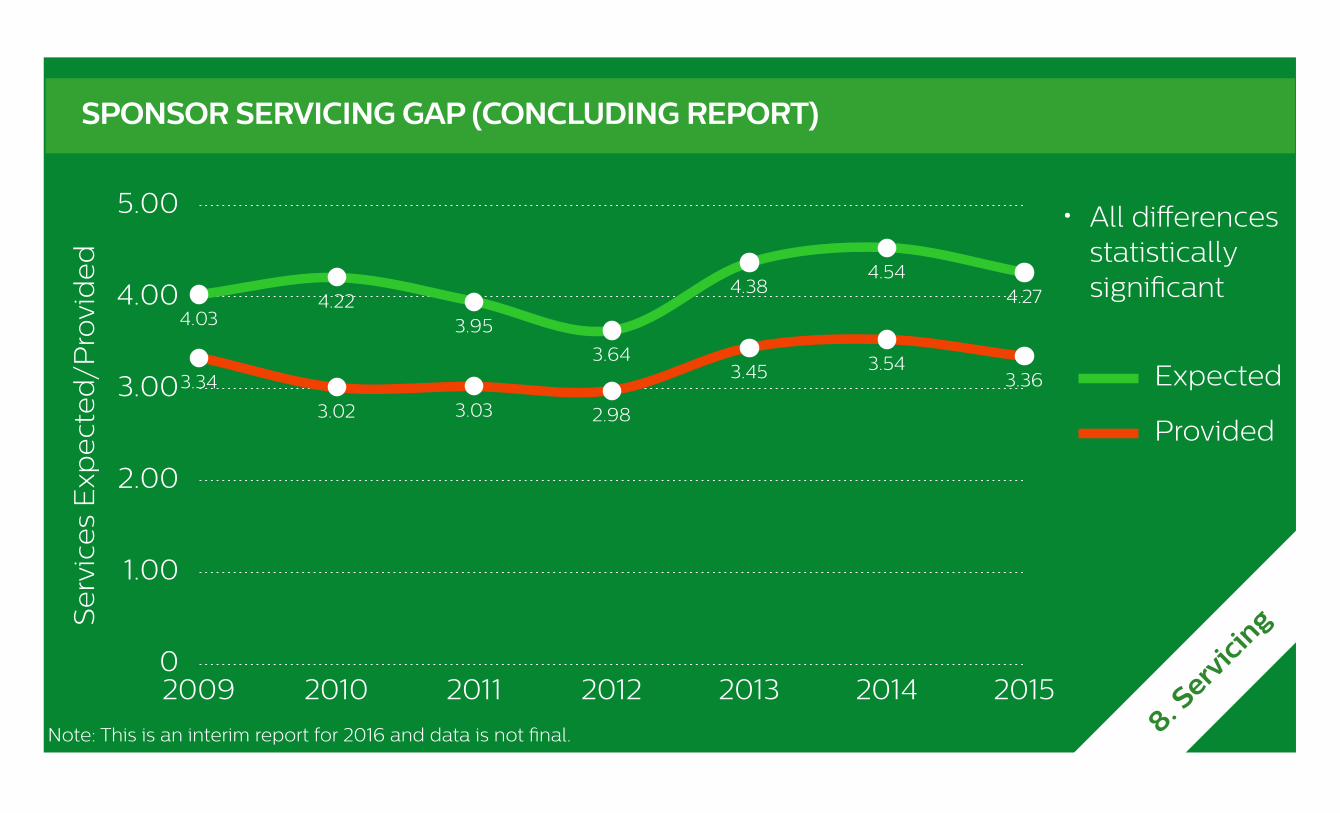
SPONSOR SERVICING GAP (CONCLUDING REPORT)
0
1.00
2.00
3.00
4.00
5.00
2009 2010 2011 2012 2013 2014 2015
3.34
3.02 3.03 2.98
3.45 3.543.36
4.034.22
3.95
3.64
4.384.54
4.27
Se
rvic
es
Exp
ect
ed
/Pro
vid
ed
8. Serv
icing
Expected
Provided
• All differences statistically significant
Note: This is an interim report for 2016 and data is not final.
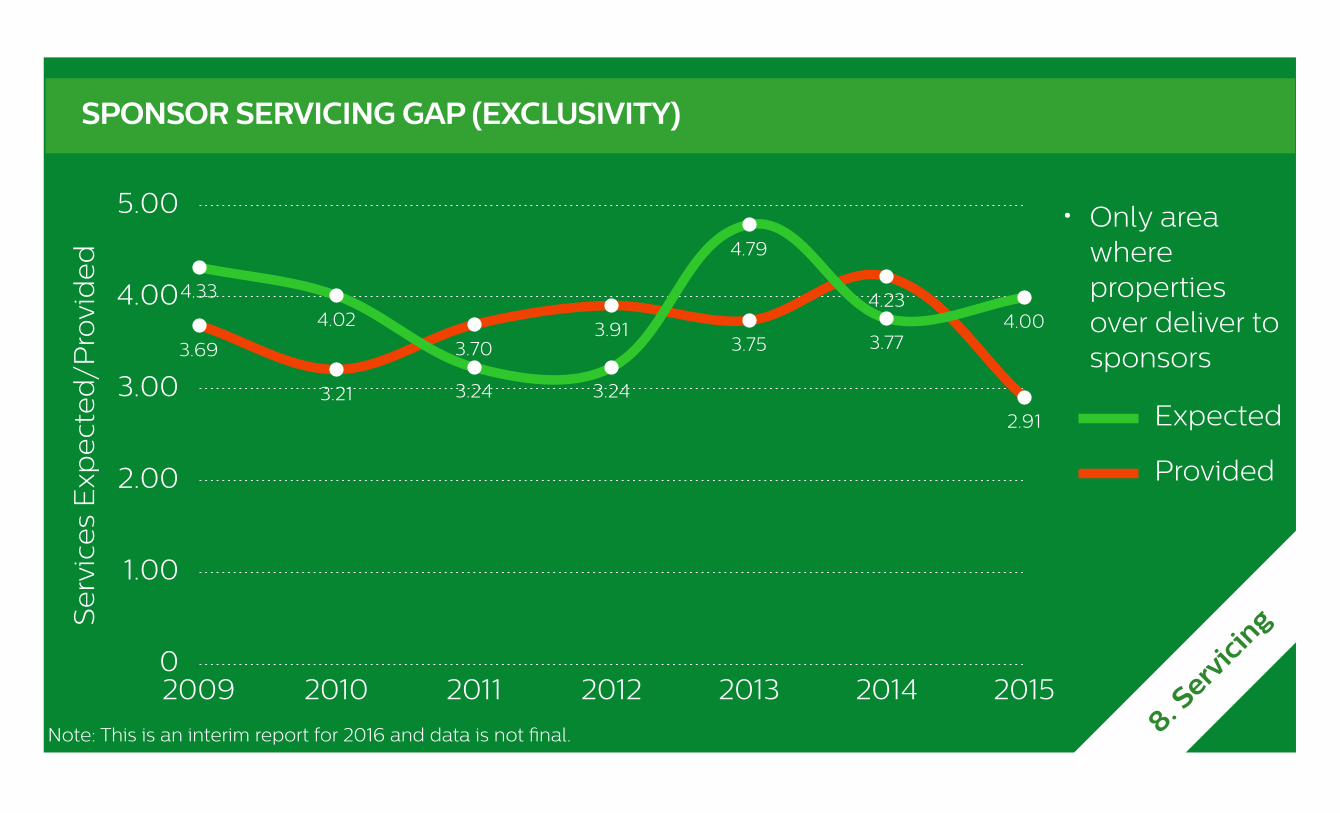
SPONSOR SERVICING GAP (EXCLUSIVITY)
0
1.00
2.00
3.00
4.00
5.00
2009 2010 2011 2012 2013 2014 2015
3.69
3.21
3.703.91
3.75
4.23
2.91
4.33
4.02
3.24 3.24
4.79
3.774.00
Se
rvic
es
Exp
ect
ed
/Pro
vid
ed
8. Serv
icing
Expected
Provided
• Only area where properties over deliver to sponsors
Note: This is an interim report for 2016 and data is not final.
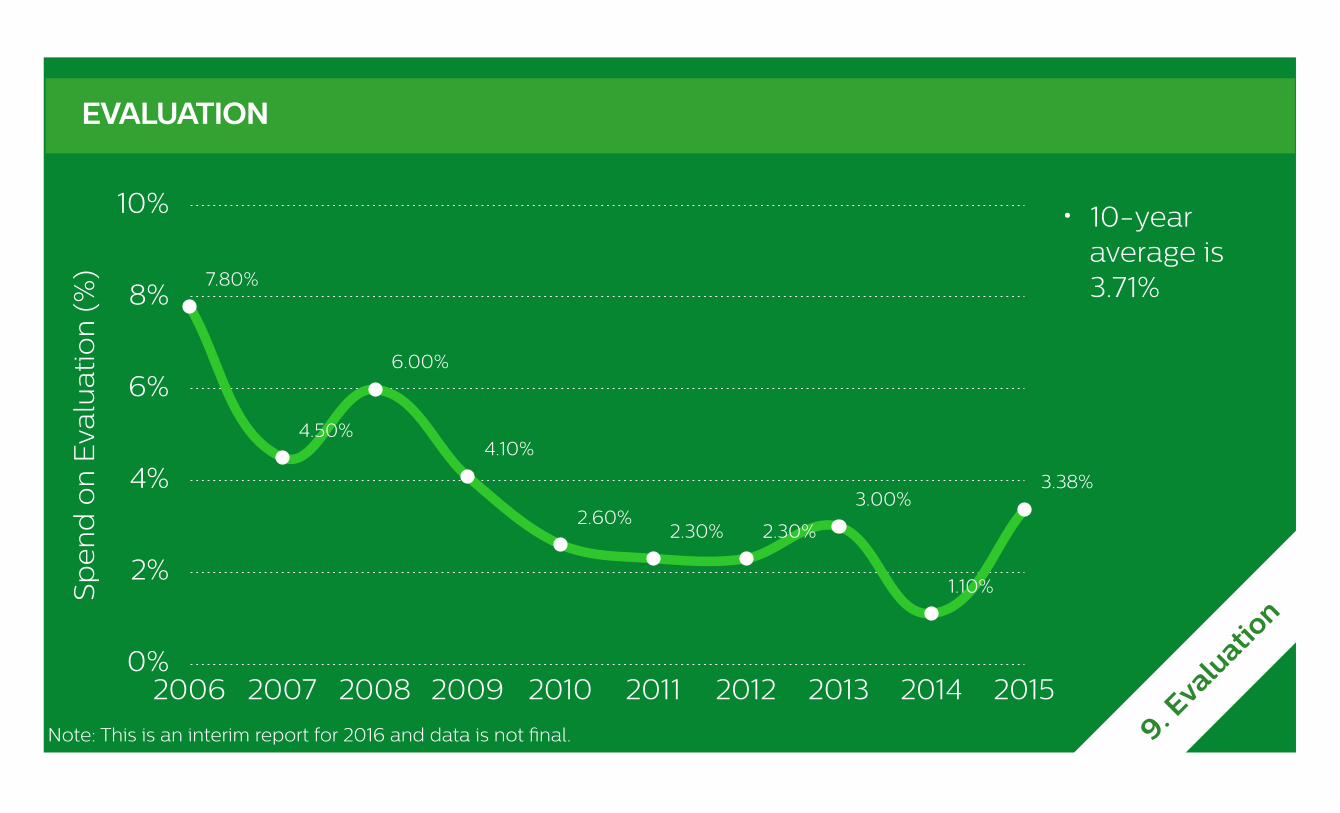
EVALUATION
0%
2%
4%
6%
8%
10%
2006 2007 2008 2009 2010 2011 2012 2013 2014 2015
7.80%
4.50%
6.00%
4.10%
2.60%2.30% 2.30%
3.00%
1.10%
3.38%
Sp
en
d o
n E
valu
atio
n (
%)
9. Eva
luatio
n
• 10-year average is 3.71%
Note: This is an interim report for 2016 and data is not final.
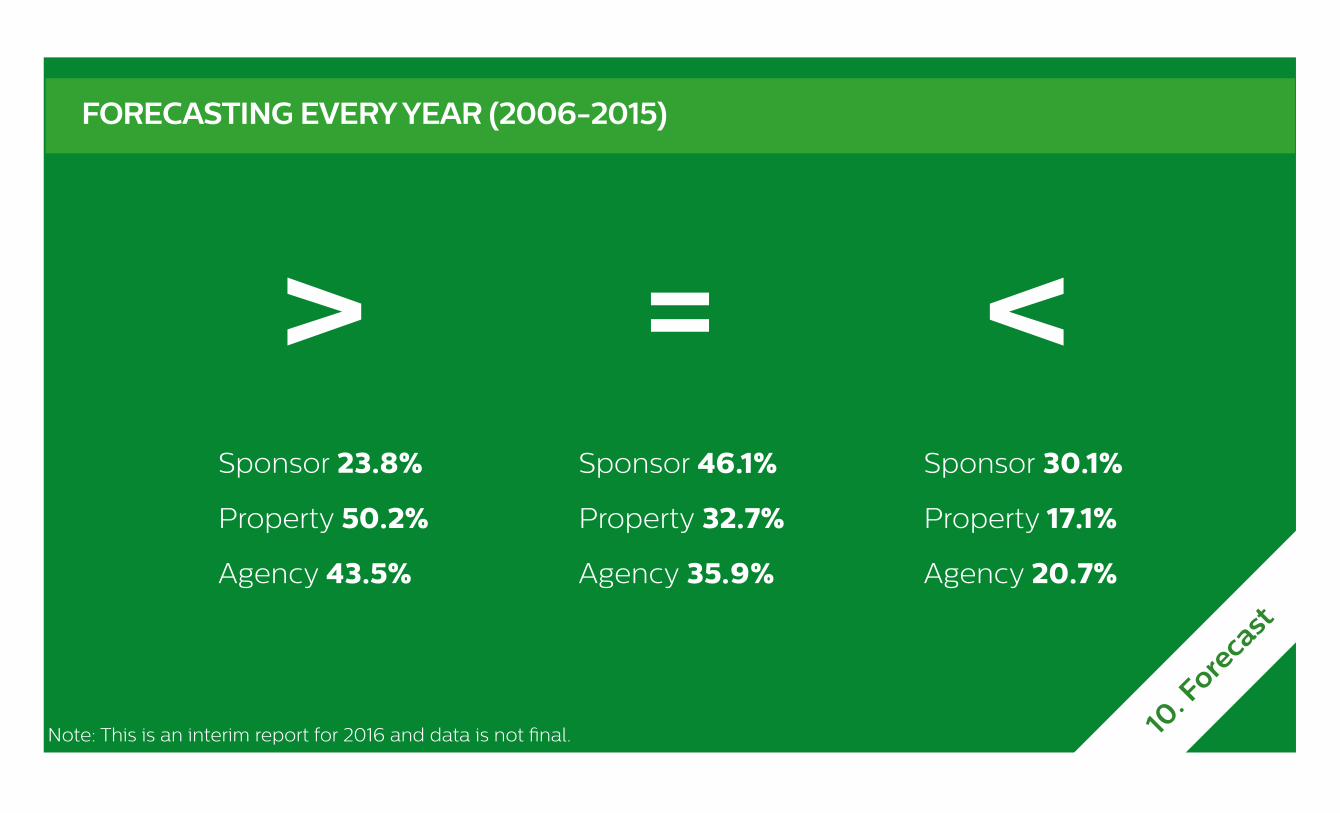
FORECASTING EVERY YEAR (2006-2015)
Sponsor 23.8%
Property 50.2%
Agency 43.5%
>Sponsor 46.1%
Property 32.7%
Agency 35.9%
=Sponsor 30.1%
Property 17.1%
Agency 20.7%
<
10. F
oreca
st
Note: This is an interim report for 2016 and data is not final.
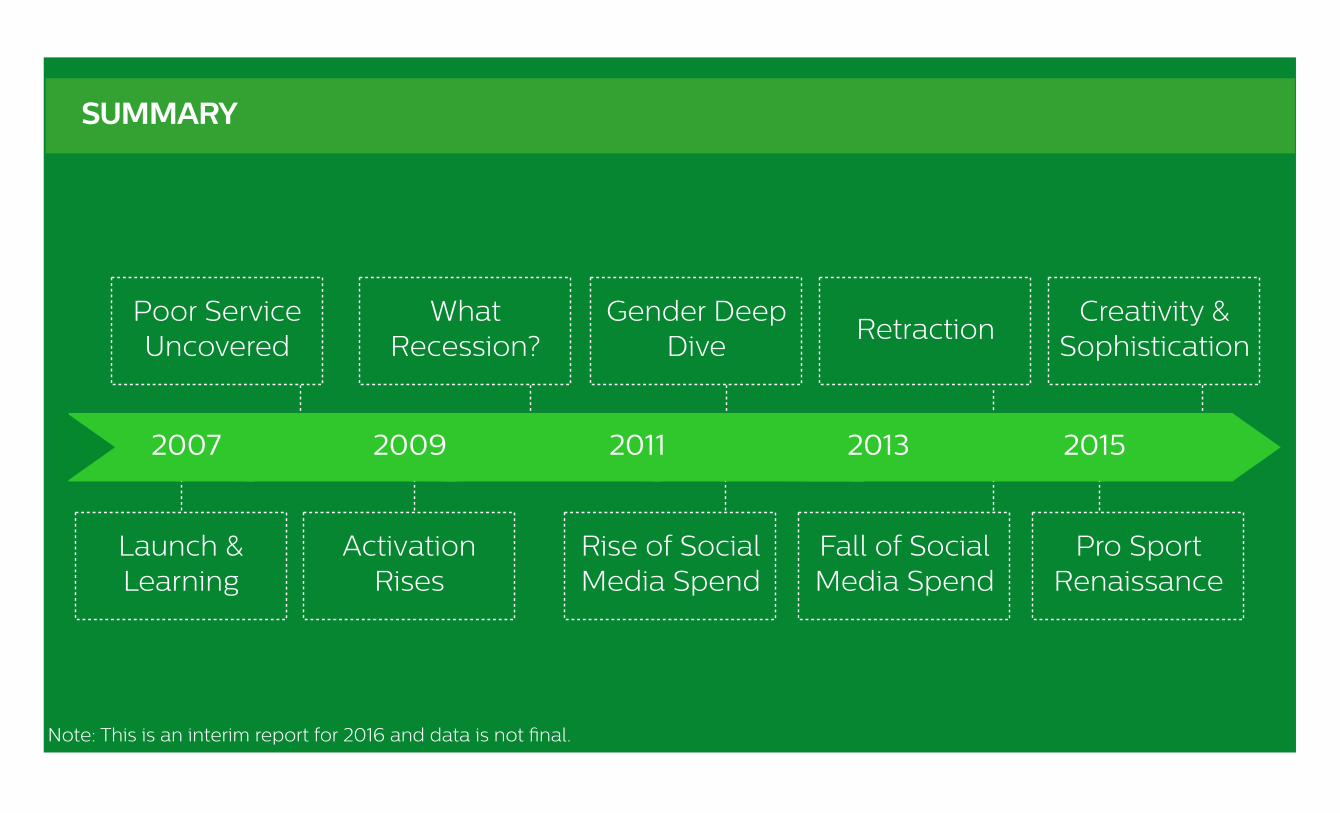
SUMMARY
Launch & Learning
Activation Rises
What Recession?
RetractionCreativity &
Sophistication
Rise of Social Media Spend
Fall of Social Media Spend
Poor Service Uncovered
20152013201120092007
Gender Deep Dive
Pro Sport Renaissance
Note: This is an interim report for 2016 and data is not final.
What’s Next?OUR EXPECTATIONS
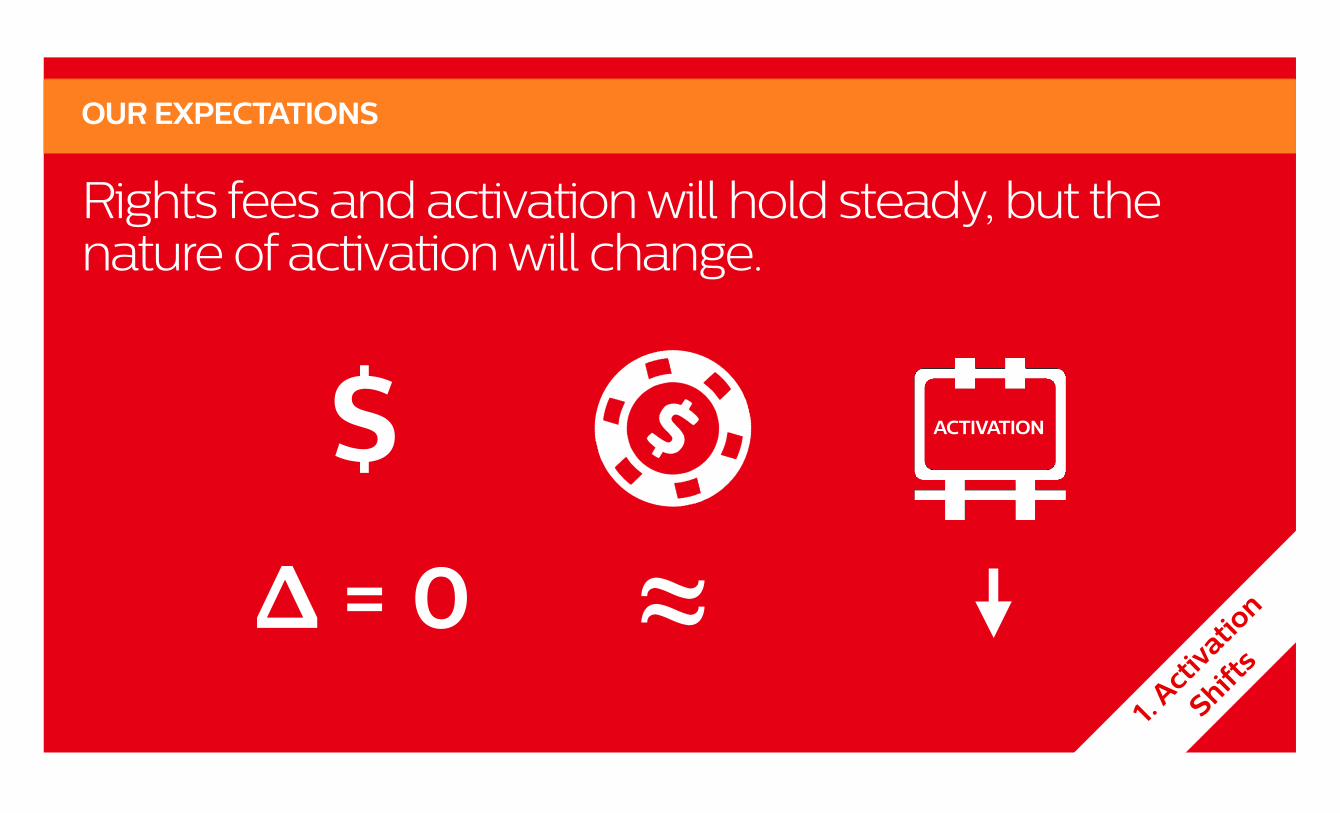
Rights fees and activation will hold steady, but the nature of activation will change.
$ ACTIVATION
OUR EXPECTATIONS
1. Act
ivatio
n
Shifts
≈Δ = 0
More integration internally and externally of organizations.
OUR EXPECTATIONS
2. Incr
eased
Collabora
tion

Social media will fall as a target of activation investment.
OUR EXPECTATIONS
3. Socia
l Media
Integrating across traditional and new platforms.
OUR EXPECTATIONS
4. Dig
itiza
tion
Live content will continue its reign as a driver of sponsorship investment.
OUR EXPECTATIONS
5. Conte
nt
Partners
hips
Festivalization is a fundamental activation platform.
OUR EXPECTATIONS
6. Fest
ivals
Cause will need to be an integral component of all great sponsorships.
=+
OUR EXPECTATIONS
7. Gre
ater C
ause
Sponsorship marketers will be come more strategic about who they want to interact with.
OUR EXPECTATIONS
8. Targ
et
Mark
ets
The industry starts to change how sponsorship activations and interactions are measured.
OUR EXPECTATIONS
9. Measu
rem
ent
More formalized training, education, resources and experiences.
OUR EXPECTATIONS
10. T
alent
Survey is open until April 15, 2016.
Visit www.sponsorshiplandscape.ca to enter responses!
THANK YOU!