10th annual utah's health services research conference - gaps in insurance coverage for...
TRANSCRIPT

Gaps in Insurance Coverage for Pediatric Cancer Patients with Acute Lymphoblastic Leukemia
Rochelle Smits-Seemann, MS
Aimee O. Hersh, MDMark N. Fluchel, MS
Kenneth M. Boucher, PhDKent Korgenski, MS
Anne C. Kirchhoff, MPH, PhD

Background
• About 2,900 children are diagnosed with Acute Lymphoblastic Leukemia (ALL) each year in the US
• Treatment lasts 2-3 years• Financial burden of pediatric cancer• A gap in health insurance coverage of any length of time
is associated with compromises in healthcare for children. • Gaps among children with cancer are unknown

Purpose and Objectives
1) Examine insurance coverage over the first two years of therapy for patients with ALL.
2) Investigate patient predictors of experiencing a gap in insurance.

Methods: Cohort

Methods: Data Access and Selection
• Location of service: Primary Children’s Hospital• Service type: Oncology Clinic• Date of service: Within 2 years post diagnosis
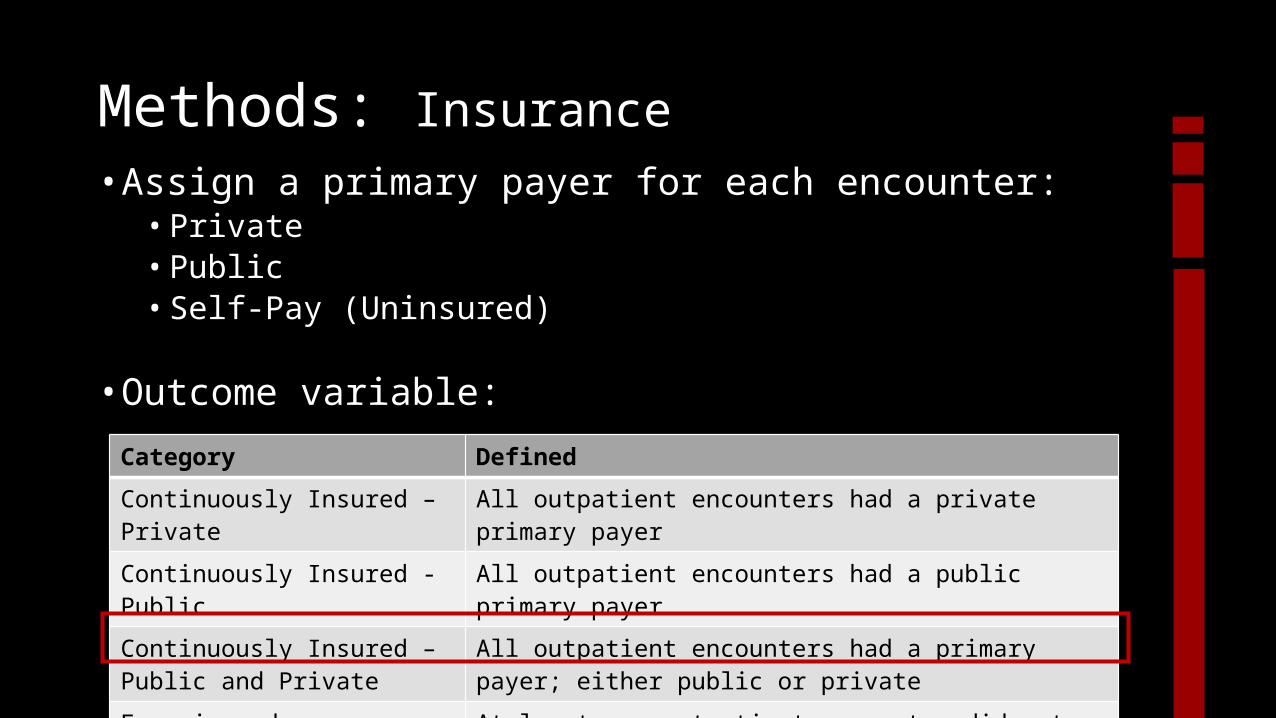
• Assign a primary payer for each encounter:• Private• Public• Self-Pay (Uninsured)
• Outcome variable:
Methods: Insurance
Category Defined
Continuously Insured – Private All outpatient encounters had a private primary payer
Continuously Insured - Public All outpatient encounters had a public primary payer
Continuously Insured – Public and Private
All outpatient encounters had a primary payer; either public or private
Experienced a gap At least one outpatient encounter did not have a primary payer

• Chi-square, Fischer’s Exact or ANOVA to test differences across insurance groups for demographic variables.
• Multivariate logistic regression to test for predictors of gaps in insurance (0/1).
Methods: Statistical Analyses

Results
• The majority of patients had insurance coverage at all outpatient encounters (n = 347; 88%).
• 47 (12%) patients experienced a gap in insurance.
• No differences in demographic variables across insurance categories
N = 394 %Sex Male 54 Female 46Age at Diagnosis 1-5 56 6-10 21 10-17 19 18-26 4County at Diagnosis Urban 88 Rural 12ALL Risk Standard 65 High 34Insurance at Diagnosis Private 73 Public 25 Uninsured 2Dead 12

Results 95% Confidence Odds Ratio Interval p-valueSex Male Ref Female 1.53 0.76 – 3.12 .23Age at Diagnosis* 0.96 0.87 – 1.06 0.40County at Diagnosis Urban Ref Rural 1.03 0.34 – 3.12 .95ALL Risk Standard Ref High 1.54 0.62 – 3.81 0.35Insurance at Diagnosis Private Ref Public 4.05 1.99 – 8.22 <.001
Diagnosis Year* 0.86 0.78 – 0.95 0.004*Fit as a continuous variable.

Results• Decreased proportion of patients experienced a gap• Increased proportion of patients continuously enrolled in public insurance.
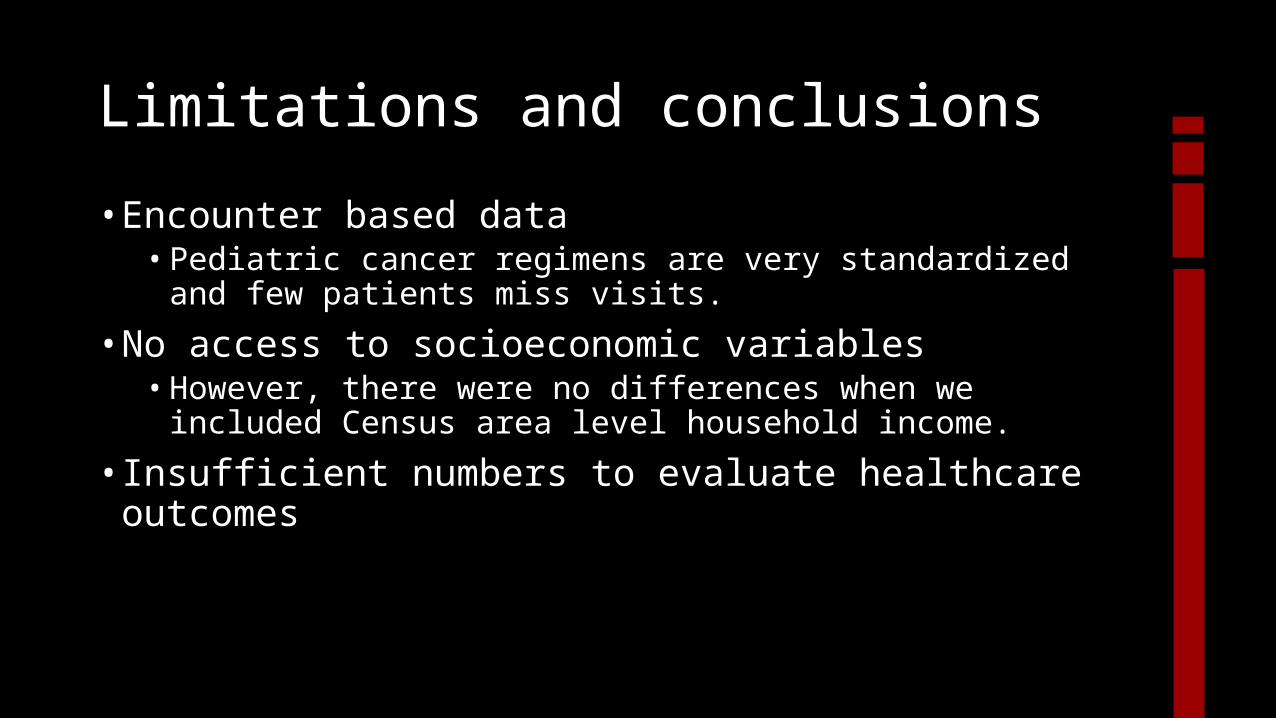
Limitations and conclusions
• Encounter based data• Pediatric cancer regimens are very standardized and few patients miss
visits.
• No access to socioeconomic variables• However, there were no differences when we included Census area
level household income.
• Insufficient numbers to evaluate healthcare outcomes

Conclusions and Implications
• 12% of patients experienced a gap in health insurance.• Next steps: Understand the impact of this on adherence to visits and
patient outcomes.
• Patients who had public insurance at diagnosis were 4X more likely to experience a gap in health insurance.
• More recently diagnosed patients were less likely to experience a gap in insurance.
• There was an increasing proportion of patients continuously enrolled on public insurance.

Acknowledgements
Collaborators• Anne Kirchhoff, PhD, MPH• Sapna Kaul, PhD, MA• Richard Lemons, MD, PhD• Kent Korgenski, MS• Mark Fluchel, MD, MS• Aimee Hersh, MD, MS
Funding• Intermountain Healthcare
Foundation and the Primary Children’s Hospital Foundation