11-03-2008(c) 2007 woods bowman, all rights reserved1 beyond the bottom line woods bowman, ph.d....
TRANSCRIPT

11-03-2008 (c) 2007 Woods Bowman, all rights reserved 1
Beyond the Bottom Line
Woods Bowman, Ph.D.
December 4, 2008

11-03-2008 (c) 2007 Woods Bowman, all rights reserved 2
Financial health
= Capacity + Sustainability

11-03-2008 (c) 2007 Woods Bowman, all rights reserved 3
Financial Capacity
A cushion of current & potential resources
that allow organizations to adapt & initiate
change.

11-03-2008 (c) 2007 Woods Bowman, all rights reserved 4
Get the balance right
Too little capacity = paralysis
Too much capacity = complacency

11-03-2008 (c) 2007 Woods Bowman, all rights reserved 5
Sustainability
An organization must be able to sustain its capacity over any time period Long run (5 to 10 years) Short run (1 to 5 years) Here-and-now (1 year)
11-03-2008 (c) 2007 Woods Bowman, all rights reserved 6
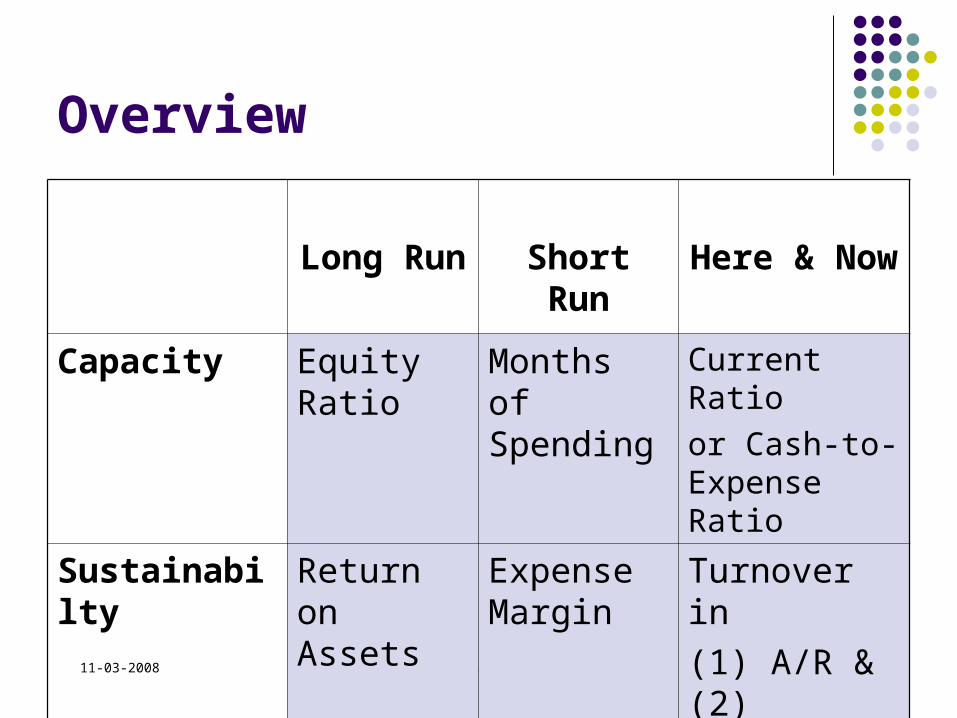
Overview
Long Run Short Run Here & Now
Capacity Equity Ratio
Months of Spending
Current Ratio
or Cash-to-Expense Ratio
Sustainabilty Return on Assets
Expense Margin
Turnover in
(1) A/R & (2) Payables

11-03-2008 (c) 2007 Woods Bowman, all rights reserved 7
Long-run Capacity
Equity Ratio =Total Net Assets / Total Assets
Should be > 0.5 Medians by asset size (~28,000 in each group):
Small (no more than $201K) = .63 Medium ($201K to $815K) = .76 Large ($815K to $3.26M) = .73 X-Large (over $3.26M) = .68

11-03-2008 (c) 2007 Woods Bowman, all rights reserved 8
Sustaining long-run capacity
Return on Assets (ROA) =Change in Total Net Assets / Average Total Assets
Should by > 3.5 % (inflation) Median ROA by asset size:
Small = 0.6 % Medium = 1.9 % Large = 1.4 % X-Large = 2.3 %

11-03-2008 (c) 2007 Woods Bowman, all rights reserved 9
Short-run capacity (1 to 5 years)
Most planning is done for the short-run More complicated than other cases:
Physical assets & securities are constraining Donor restrictions are constraining
In long-run: There’s time to change things Here-and-now: Few choices; go with what
you’ve got

11-03-2008 (c) 2007 Woods Bowman, all rights reserved 10
Short-run capacity Assume physical & financial investments are
negligible Land Building & Equipment (LBE) + investments
< 10% of total assets, & Investment revenue < 10% of total revenue, & Permanently restricted net assets = 0
I will show how to adjust for these things later
11-03-2008 (c) 2007 Woods Bowman, all rights reserved 11
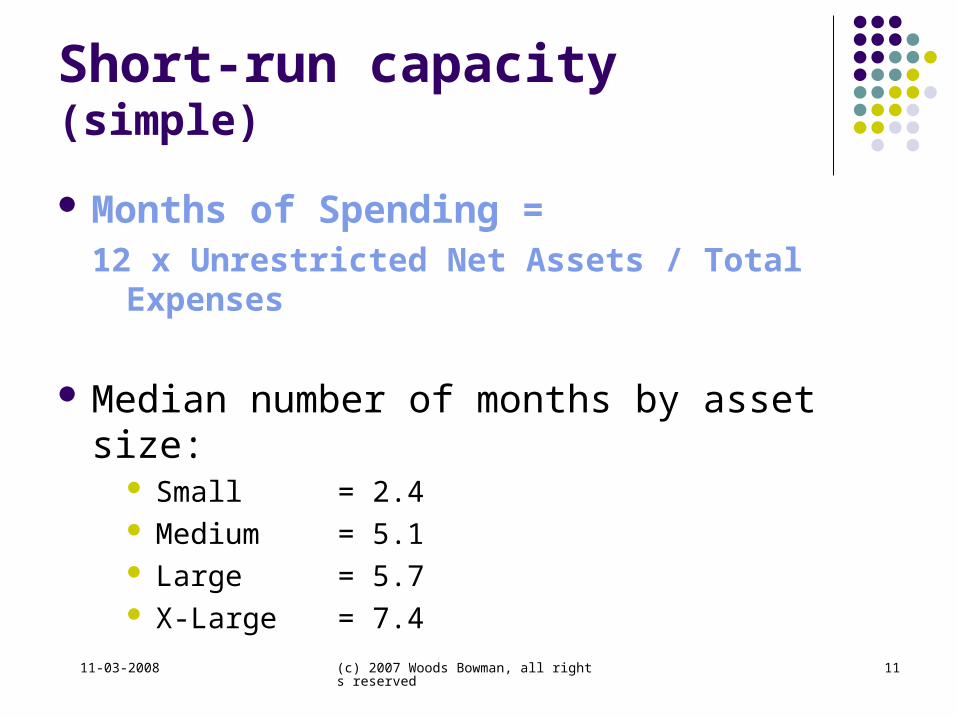
Short-run capacity (simple)
Months of Spending =12 x Unrestricted Net Assets / Total Expenses
Median number of months by asset size: Small = 2.4 Medium = 5.1 Large = 5.7 X-Large = 7.4

11-03-2008 (c) 2007 Woods Bowman, all rights reserved 12
SustainingShort-run capacity (simple)
Expense Margin =Change in Unrestricted Net Assets / Total Expenses
Median Expense Margin by asset size: Small = 0.6 % Medium = 1.9 % Large = 1.4 % X-Large = 2.3 %
11-03-2008 (c) 2007 Woods Bowman, all rights reserved 13
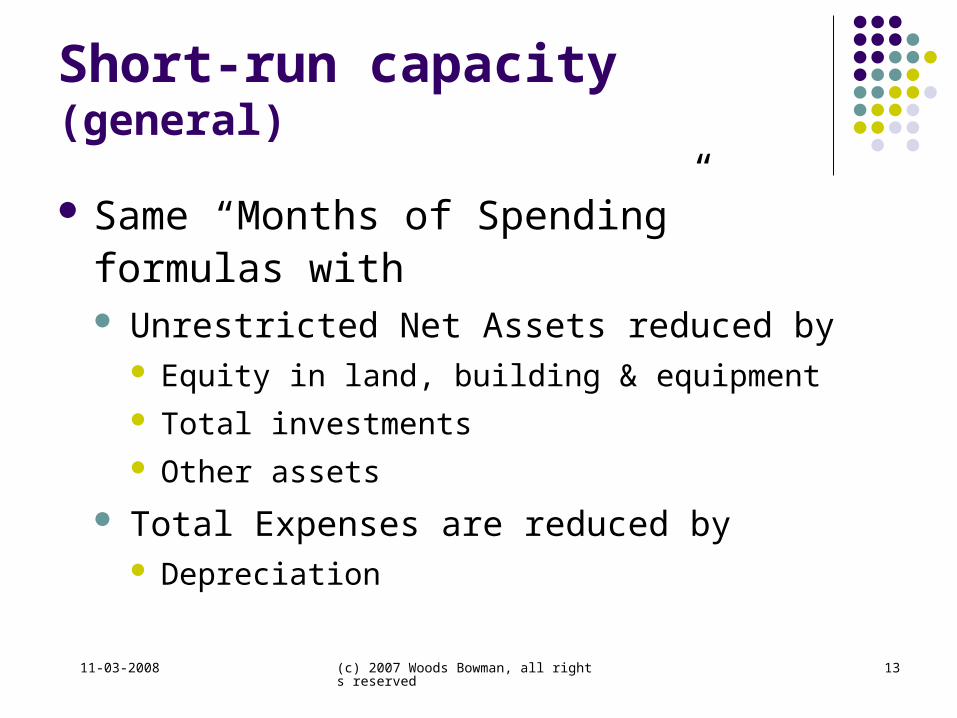
Short-run capacity (general)
Same “Months of Spending” formulas with Unrestricted Net Assets reduced by
Equity in land, building & equipment Total investments Other assets
Total Expenses are reduced by Depreciation

11-03-2008 (c) 2007 Woods Bowman, all rights reserved 14
Short-run capacity (adjusted)
Median number of months of spending by asset size:
Small = 0.7 (compare to 2.4) Medium = 1.8 (compare to 5.1) Large = 1.7 (compare to 5.7) X-Large = 1.0 (compare to 7.4)
11-03-2008 (c) 2007 Woods Bowman, all rights reserved 15
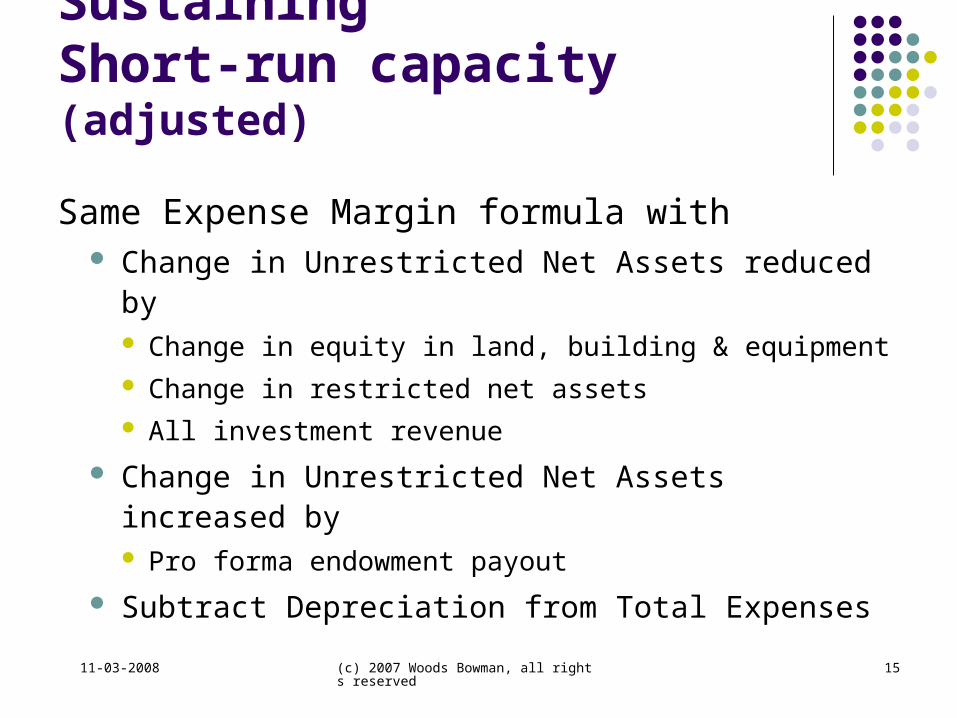
SustainingShort-run capacity (adjusted)
Same Expense Margin formula with Change in Unrestricted Net Assets reduced by
Change in equity in land, building & equipment Change in restricted net assets All investment revenue
Change in Unrestricted Net Assets increased by Pro forma endowment payout
Subtract Depreciation from Total Expenses

11-03-2008 (c) 2007 Woods Bowman, all rights reserved 16
Sustaining Short-run capacity (adjusted)
Median expense margin by asset size: Small = 0.5 % (compare to 0.6 %) Medium = 3.2 % (compare to 2.2 %) Large = 5.1 % (compare to 2.3 %) X-Large = 12.7 % (compare to 3.1 %)
11-03-2008 (c) 2007 Woods Bowman, all rights reserved 17
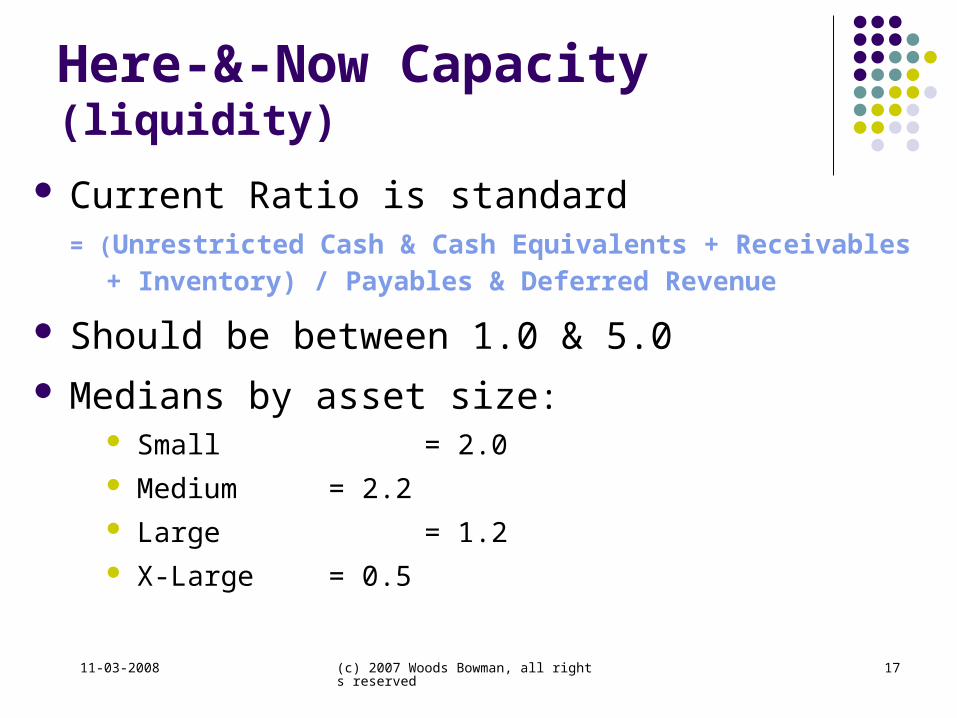
Here-&-Now Capacity (liquidity)
Current Ratio is standard= (Unrestricted Cash & Cash Equivalents + Receivables +
Inventory) / Payables & Deferred Revenue
Should be between 1.0 & 5.0 Medians by asset size:
Small = 2.0 Medium = 2.2 Large = 1.2 X-Large = 0.5

11-03-2008 (c) 2007 Woods Bowman, all rights reserved 18
If current liabilities are zero
Cash Expense Ratio= 12 x Unrestricted Cash & Cash Equivalents / (Total Expenses
– Depreciation)
Should be > 1 (one month’s expenses) Medians by asset size:
Small = 1.5 Medium = 2.1 Large = 1.4 X-Large = 0.8

11-03-2008 (c) 2007 Woods Bowman, all rights reserved 19
SustainingAvailable Capacity (numerator)
A/R Turnover =
Accounts receivable / Government grants +
program service revenue Should be < 10 % (~ 1 month’s revenue) Medians by asset size:
Small = 0.0 % Medium = 1.5 % Large = 2.7 % X-Large = 5.8 %

11-03-2008 (c) 2007 Woods Bowman, all rights reserved 20
SustainingAvailable Capacity (denominator)
Payables Turnover =2 x Accounts payable / Total expenses
The denominator should be average non-personnel cash expenses; the 2x factor adjusts for using total expenses instead
Should be < 10 % (~ 1 month’s expense) Medians by asset size:
Small = 0.0 % Medium = 2.7 % Large = 5.0 % X-Large =10.9 %

11-03-2008 (c) 2007 Woods Bowman, all rights reserved 21
In sum
Without financial goals, drift is inevitable Set goals in terms of a range of acceptable
capacity (comfort zone) Have long-term, short-term, and liquidity
goals (maybe more than one each) Let sustainability metrics be whatever is
necessary to stay within comfort zone Start today

11-03-2008 (c) 2007 Woods Bowman, all rights reserved 22
THE END