1.1 position, velocity, acceleration 1 name: date: … · 1.1 position, velocity, acceleration 1...
TRANSCRIPT
1.1 Position, Velocity, Acceleration 1NAME: DATE:
PARTNERS:
Purpose:
To investigate and analyse basic properties of motion using a Vernier Go! Motion detector and logging software.
Materials:
1. PC with Logger Lite Software installed.2. Go! Motion detector3. USB cable4. Ramp, and materials to support ramp5. Playground ball
Setting up Go! Motion sensor1. Plug the USB Cable into the Go! Motion sensor, and plug the other end into the PC. You may have to
look at the back of the PC tower to find a USB port.2. Launch “ Program Files / Vernier Software / Logger Lite ”3. On the Logger Lite toolbar, click Experiment / Data Collection …4. Make sure the “ Mode” option is “ Time Based”5. Set “ Length” equal to 10 seconds.6. Click “ Done” to close the Data Collection dialog box
Gathering Data with the Motion Sensor
The motion sensor uses ultra-sonic waves to detect motion. Results might work best if the person standing in front of the motion sensor holds a flat object such as a textbook, binder, or piece of cardboard in front of him or her. Also, try to keep any wireless devices away from the motion sensor to avoid any possible interference.
1. With one person operating Logger Lite, and another person in front of the motion sensor, hit “ Collect” while a teammate walks backwards and forwards in front of the Go! Motion sensor.
2. Let your other group members have a turn in front of the motion sensor. If you press “ Collect” a second time, you will just record over the previous data set. You can clear the data at any time by simply clicking “ Data | Clear All Data” .
Take a few minutes here to get used to logging data, and clearing data sets. DO NOT PROCEED TO ACTIVITY 1 UNTIL YOUR INSTRUCTOR ADVISES YOU TO DO SO
1.1 Position, Velocity, Acceleration 2
Activity P1 – Position for Different Walking Speeds
With your group, make some predictions about what it looks like on a Position / Time graph if you walk steadily slowly towards the detector, vs walking steadily quickly towards the detector.
1. PREDICT!a. On the graph below, draw what you think the graph will look like for a person walking slowly,
but steadily, away from the detector. Label it “ Slowly Away”b. On the graph below, draw what you think the graph will look like for a person walking quickly,
but steadily, away from the detector. Label it “ Quickly Away”c. On the graph below, draw what you think the graph will look like for a person walking slowly,
but steadily, towards the detector. Label it “ Slowly Towards”d. On the graph below, draw what you think the graph will look like for a person walking quickly,
but steadily, towards the detector. Label it “ Quickly Towards”
2. DISCUSS!With your group, discuss the following questions. Jot down your thoughts, as well as any differing opinions in your group.
a. Why do you think the Position-Time graphs will look like this?
Pos
ition
(m
)
Time (s) Time (s)Time (s)
1.1 Position, Velocity, Acceleration 3
b. What is the main difference between the lines for faster and slower motion on your predicted Position-Time graph?
c. What is the main difference between the “ towards” and “ away” lines in your prediction?
3. OBSERVE!a. Have someone in your group walk steadily away from the detector while facing the detector and
computer screen. Do this a few times until your group gets a consistent result. Sketch the typical graph that represents this motion below. Label it as “ slowly away observed.”
b. Repeat this process for the remaining three types of graph: “ quickly away observed” , “ slowly toward observed” , “ quickly toward observed.” You should have 4 sketches in total on the above graph.
c. What was the difference between the observed faster and slower motions on the Position-Time graph?
1.1 Position, Velocity, Acceleration 4
d. What was the difference between “ away” and “ toward” on the observed graph?
e. Did your group’ s predictions match the observations? If there were any differences, discuss with your group and list any possible reasons why there were differences.
Pos
ition
(m
)
Time (s)

1.1 Position, Velocity, Acceleration 5Activity V1 – What does Velocity look like?
In the Logger Lite application, click Open, and open “ C:/Program Files/ Vernier Software/ Logger Lite / Experiments/ Middle School With Computers/ 33c Graphing Motion”
1. Note down label and units of the vertical axis. How are the units here different from the position-time graphs?
2. Take turns with your group to log velocity-time data using the motion sensor, to get used to how these graphs look. Move backwards and forwards at different speeds, try swinging your arms vs. keeping your arms still, etc. DO NOT PROCEED TO THE NEXT SECTION UNTIL INSTRUCTED TO DO SO!
Activity V2 – What does “F ast” and “S low” look like?
1. PREDICT!a. On the graph below, draw what you think the velocity-time graph will look like for a person
walking slowly, but steadily, away from the detector. Label it “ Slowly Away”b. On the graph below, draw what you think the velocity-time graph will look like for a person
walking quickly, but steadily, away from the detector. Label it “ Quickly Away”c. On the graph below, draw what you think the velocity-time graph will look like for a person
walking slowly, but steadily, towards the detector. Label it “ Slowly Towards”d. On the graph below, draw what you think the velocity-time graph will look like for a person
walking quickly, but steadily, towards the detector. Label it “ Quickly Towards”

1.1 Position, Velocity, Acceleration 6
3. DISCUSS!With your group, discuss the following questions. Jot down your thoughts, as well as any differing opinions in your group.
a. Why do you think the Velocity-Time graphs will look like this?
b. What is the main difference between the lines for faster and slower motion on your predicted Velocity-Time graph?
Vel
ocity
(m
/s)
( (m
/s)
Time (s)
1.1 Position, Velocity, Acceleration 7c. What is the main difference between the “ towards” and “ away” lines in your prediction?
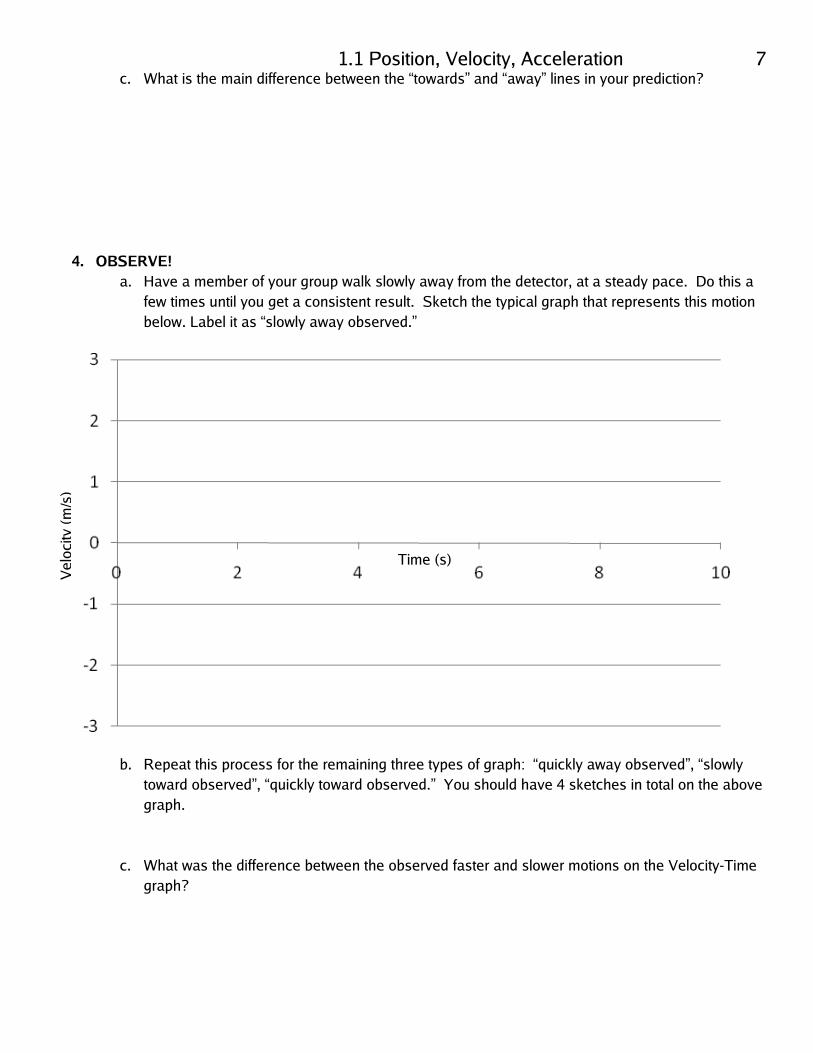
4. OBSERVE!a. Have a member of your group walk slowly away from the detector, at a steady pace. Do this a
few times until you get a consistent result. Sketch the typical graph that represents this motion below. Label it as “ slowly away observed.”
b. Repeat this process for the remaining three types of graph: “ quickly away observed” , “ slowly toward observed” , “ quickly toward observed.” You should have 4 sketches in total on the above graph.
c. What was the difference between the observed faster and slower motions on the Velocity-Time graph?
Vel
ocity
(m
/s)
Time (s)

1.1 Position, Velocity, Acceleration 8
d. What was the difference between “ away” and “ toward” on the observed graph?
e. Did your group’ s predictions match the observations? If there were any differences, discuss with your group and list any possible reasons why there were differences.
f. How did the appearance of the graphs differ from the similar exercises you did for the Position activity?
1.1 Position, Velocity, Acceleration 9Activity V3 – Match the Graph!
1. PREDICT!
a. In the Logger Lite application, click Open, and open “ C:/Program Files/Vernier Software/Logger Lite/Experiments/Other/Graph Matching/Match01”
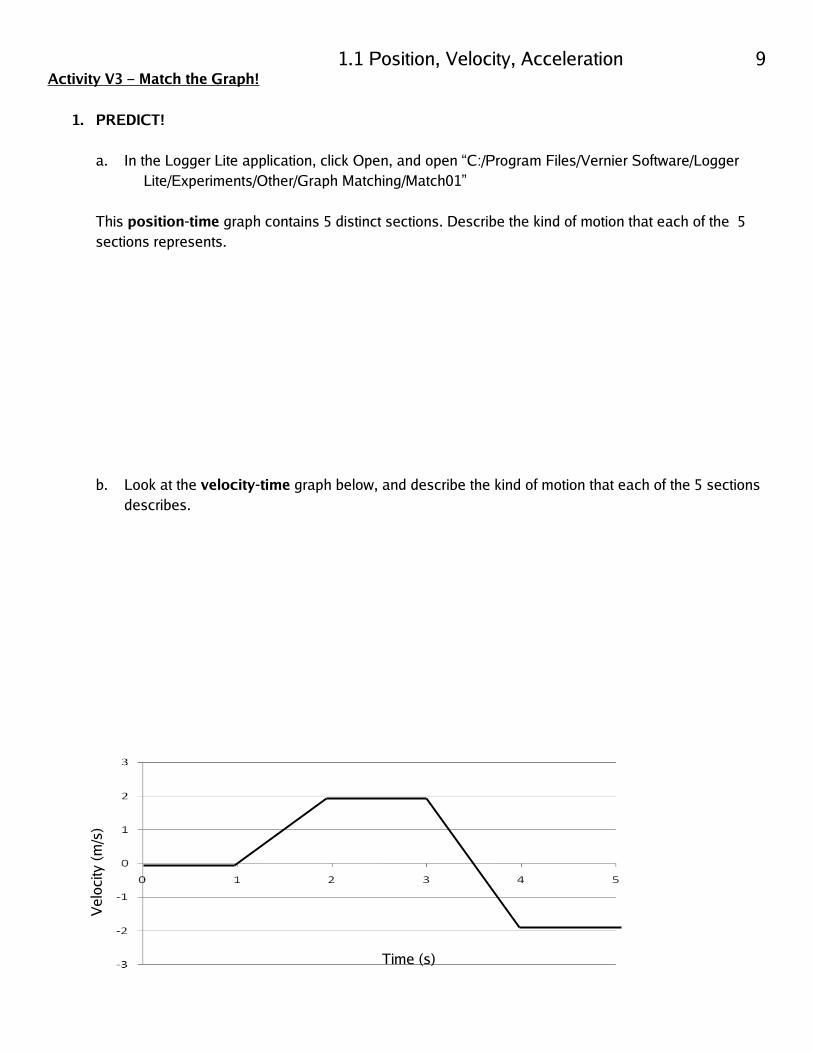
This position-time graph contains 5 distinct sections. Describe the kind of motion that each of the 5 sections represents.
b. Look at the velocity-time graph below, and describe the kind of motion that each of the 5 sections describes.
Time (s)
Vel
ocity
(m
/s)

1.1 Position, Velocity, Acceleration 10
2. OBSERVE!
a. Try to replicate the scenario in the “ Match01” position-time graph above. You may each need to try this a few times. Below, sketch the original line (the one you're trying to match), and your best
observed result. Make sure to label them so you can tell the difference.
b. Now try to replicate the velocity graph on the previous page, each trying a few times with the detector. On the next page, sketch the original line and your best observed result, labeling each one differently.
c. Did your observations match your predictions? If not, list some reasons why.
Time (s)
Pos
ition
(m
)
1.1 Position, Velocity, Acceleration 11
d. What do you think the word “ Velocity” means, regarding the graphs in this activity?
e. Work with your group to develop a common definition for the term “ Velocity” , with regards to this activity.
Vel
ocity
(m
/s)
Time (s)

1.1 Position, Velocity, Acceleration 12Activity A1 – Rolling Down a Ramp!
1. Minding the USB connector cable, carefully place the Go! Motion sensor on the floor. 2. Lay the ramp on the floor in front of the motion sensor. Be careful that any books you use to prop up
the motion sensor do not block the sensor.3. You may need to prop up the motion sensor depending on the height of the ramp. Putting sides on the
ramp will keep the ball going straighter. See photograph below:
1. PREDICT!
a. Consider the following: a ball is rolling down a ramp, and then at the bottom of the ramp the ball continues to roll along a flat, horizontal floor. Can you predict the shape of the position-time graph, and velocity-time graph for the ball rolling down the hill? On each graph (on following page), label the part of the line that represents the ball rolling downhill, and the ball rolling horizontally.
Go! Motion
Improvised ramp
Go! Motion Sensor

1.1 Position, Velocity, Acceleration 13
b. Describe in words how the position of the ball changes over time as it goes down the ramp and then onto the floor, and do the same for the velocity as well.
Pos
ition
(m
)
Time (s)
Vel
ocity
(m
/s)
Time (s)

1.1 Position, Velocity, Acceleration 14
c. Describe what you know about the term “ acceleration” . Think, for example, what it means when a car is accelerating – what do you notice on the speedometer? Where does the ball accelerate – on the ramp, or as it rolls flat on the floor, or both?
2. DISCUSS
a. In your group, discuss the graphs you sketched for the predicted position-time, and velocity-time graphs. Did any members in your group have significantly different ideas of how the graphs might look? Jot down any differing opinions.
3. OBSERVE!
In the Logger Lite application, click Open, and open “ C:/Program Files/ Vernier Software/ Logger Lite / Experiments/ Middle School With Computers/ 33e Graphing Motion” . Note that 3 different types of graphs are shown: Position, Velocity, and Acceleration.
Do a few practice runs with the motion sensor. Hold the ball at the top of the ramp, hit “ Collect” , and then let the ball roll down the ramp. When you’ ve got a satisfactory data run, sketch the results on the next page:

1.1 Position, Velocity, Acceleration 15
Pos
ition
(m
)
Time (s)
Time (s)
Time (s)
Vel
ocity
(m
/s)
Acc
eler
atio
n (m
/s2 )

1.1 Position, Velocity, Acceleration 16a. Is the Position-Time graph consistent with what you predicted? If not, why? Label on the
observed graph where the ball was going down the ramp, and where it was rolling flat on the floor.
b. Look now at the Velocity-Time graph. When is the velocity increasing? What is the ball doing in this time period? When is the velocity constant (in a horizontal line)? Is this what you expected?
c. Now look at the acceleration graph. Can you explain why this graph has lots of bumps or waves?

1.1 Position, Velocity, Acceleration 17d. Bumps and wiggles aside, when is the acceleration approximately constant? Look at the
Position and Velocity graphs, and describe what is happening to the ball at this point. Why is acceleration constant during this time?
e. Why does the acceleration go to approximately zero? What is happening to the velocity when the acceleration is zero?
f. Revisit your initial definition of acceleration. Now that you’ ve seen graphs of acceleration, velocity, and position for the same object in the same period of time, can you revise your definition at all? Share your ideas with your group and see if you can come up with a consensus.

1.1 Position, Velocity, Acceleration 18
Summary and Suggestions for the Future:
1. What were the main things that you learned from this activity?
2. Can you think of alternative hands-on ways in which these concepts could be demonstrated?
3. What changes (if any) would you make to teach these activities in a Grade 7-8 classroom?