11. processing and displaying data
TRANSCRIPT

KNOWLEDGE FOR THE BENEFIT OF HUMANITYKNOWLEDGE FOR THE BENEFIT OF HUMANITY
RESEARCH METHODOLOGY (HFS4343)
PROCESSING & DISPLAYING DATA
Dr. Dr. MohdMohd RazifRazif ShahrilShahril
School of Nutrition & Dietetics School of Nutrition & Dietetics
Faculty of Health SciencesFaculty of Health Sciences
UniversitiUniversiti Sultan Sultan ZainalZainal AbidinAbidin
1
S C H O O L O F N U T R I T I O N A N D D I E T E T I C S • U N I V E R S I T I S U L T A N Z A I N A L A B I D I N
Topic Learning Outcomes At the end of this lecture, students should be able to;
• describe methods for processing data in quantitative
studies
• describe methods for processing data in qualitative
studies
• explain methods of communicating and displaying
analysed data
• demonstrate how to present data in tables
• illustrate different types of graphs to represent data
2
S C H O O L O F N U T R I T I O N A N D D I E T E T I C S • U N I V E R S I T I S U L T A N Z A I N A L A B I D I N
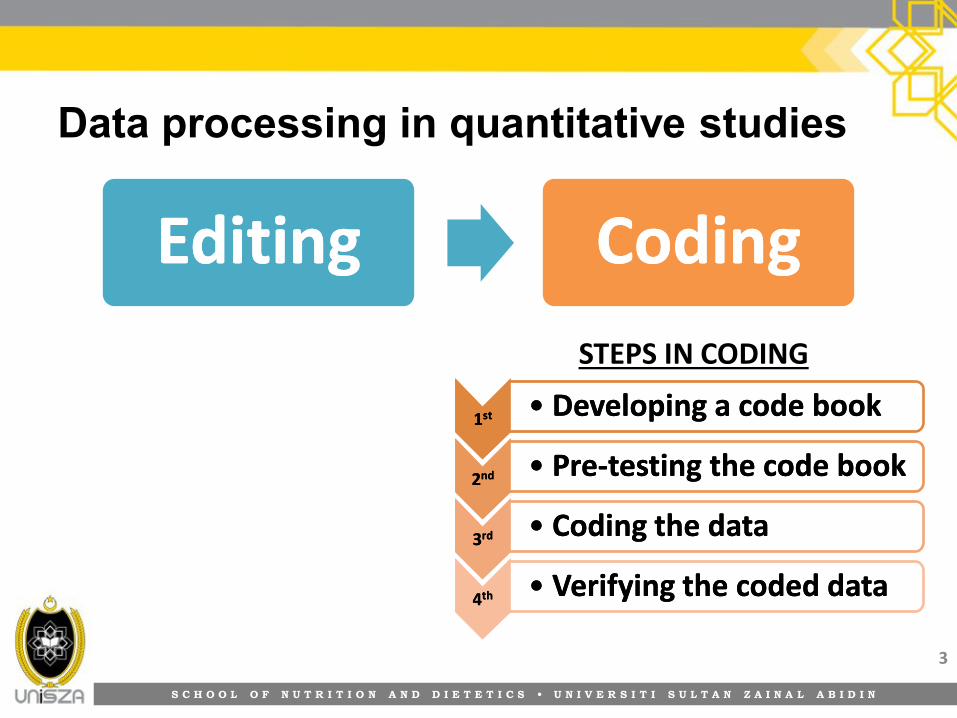
Data processing in quantitative studies
3
EditingEditing CodingCoding
11stst 11stst •• Developing a code bookDeveloping a code book
22ndnd 22ndnd •• PrePre--testing the code booktesting the code book
33rdrd 33rdrd •• Coding the dataCoding the data
44thth 44thth •• Verifying the coded dataVerifying the coded data
STEPS IN CODING
S C H O O L O F N U T R I T I O N A N D D I E T E T I C S • U N I V E R S I T I S U L T A N Z A I N A L A B I D I N
Editing
• Information from data collection is called ‘raw data’ or
‘data’
• Processing data is to ensure that the data is ‘clean’.
– Editing = process of ‘cleaning’ data
• Identify and minimise errors, incompleteness,
misclassification and gaps in the information from
respondents
4

S C H O O L O F N U T R I T I O N A N D D I E T E T I C S • U N I V E R S I T I S U L T A N Z A I N A L A B I D I N
Editing (cont)
• Ways of minimising incompleteness
– By inference
– By recall
– By giving back to the respondent
• Two ways of editing data;
– Examine all the answers to one question or variable at a time
– Examine all the responses given to all questions by one
respondent at a time
5
S C H O O L O F N U T R I T I O N A N D D I E T E T I C S • U N I V E R S I T I S U L T A N Z A I N A L A B I D I N
Coding
• Method of coding depends on;
– The way a variable has been measured (measurement scale) in
your research instrument (e.g. if a response to a question is
descriptive, categorical or quantitative)
– The way you want to communicate the findings about a variable
to your readers.
• Responses by respondents can be classified into;
– Quantitative response
– Categorical responses (which may be quantitative or qualitative)
– Descriptive responses (which are invariably qualitative)
6
S C H O O L O F N U T R I T I O N A N D D I E T E T I C S • U N I V E R S I T I S U L T A N Z A I N A L A B I D I N
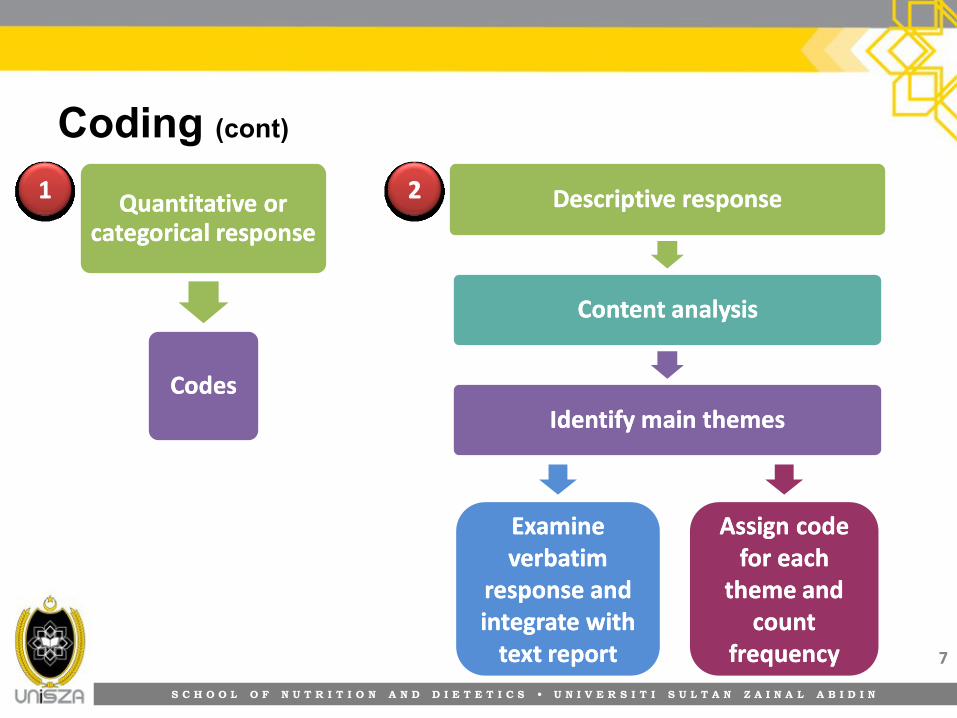
Coding (cont)
7
Quantitative or Quantitative or categorical responsecategorical response
CodesCodes
Descriptive responseDescriptive response
Content analysisContent analysis
Identify main themesIdentify main themes
Examine Examine verbatim verbatim
response and response and integrate with integrate with
text text reportreport
Assign code Assign code for each for each
theme and theme and count count
frequencyfrequency
11 22
S C H O O L O F N U T R I T I O N A N D D I E T E T I C S • U N I V E R S I T I S U L T A N Z A I N A L A B I D I N
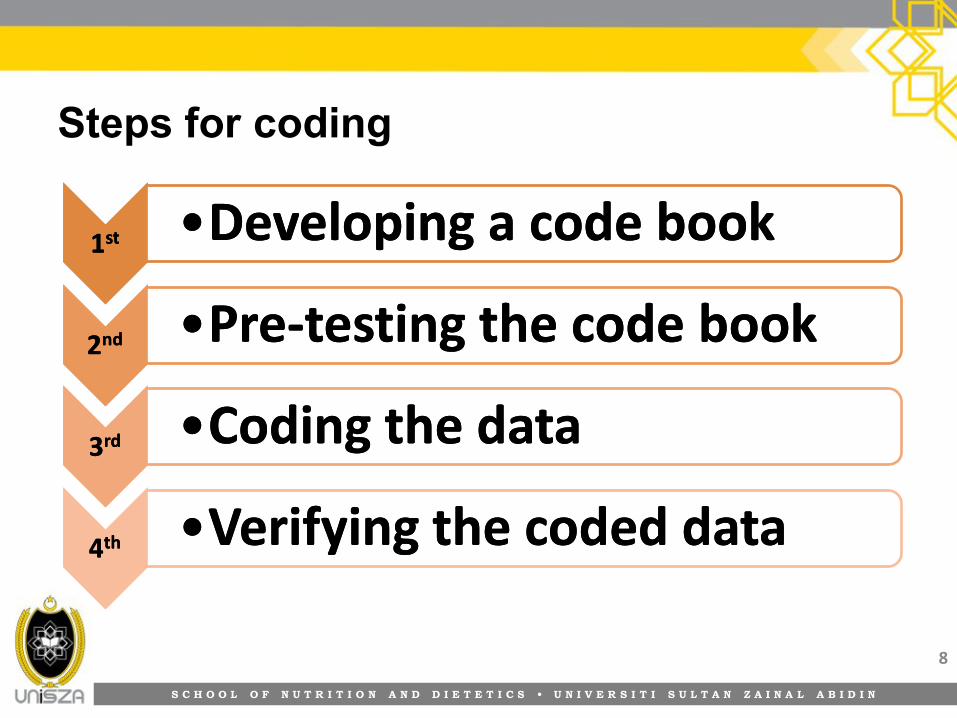
Steps for coding
8
11stst 11stst ••Developing a code bookDeveloping a code book
22ndnd 22ndnd ••PrePre--testing the code booktesting the code book
33rdrd 33rdrd ••Coding the dataCoding the data
44thth 44thth ••Verifying the coded dataVerifying the coded data
S C H O O L O F N U T R I T I O N A N D D I E T E T I C S • U N I V E R S I T I S U L T A N Z A I N A L A B I D I N
Step 1: Developing a code book
• Code book provides a set of rules for assigning
numerical values to answers obtained from
respondents.
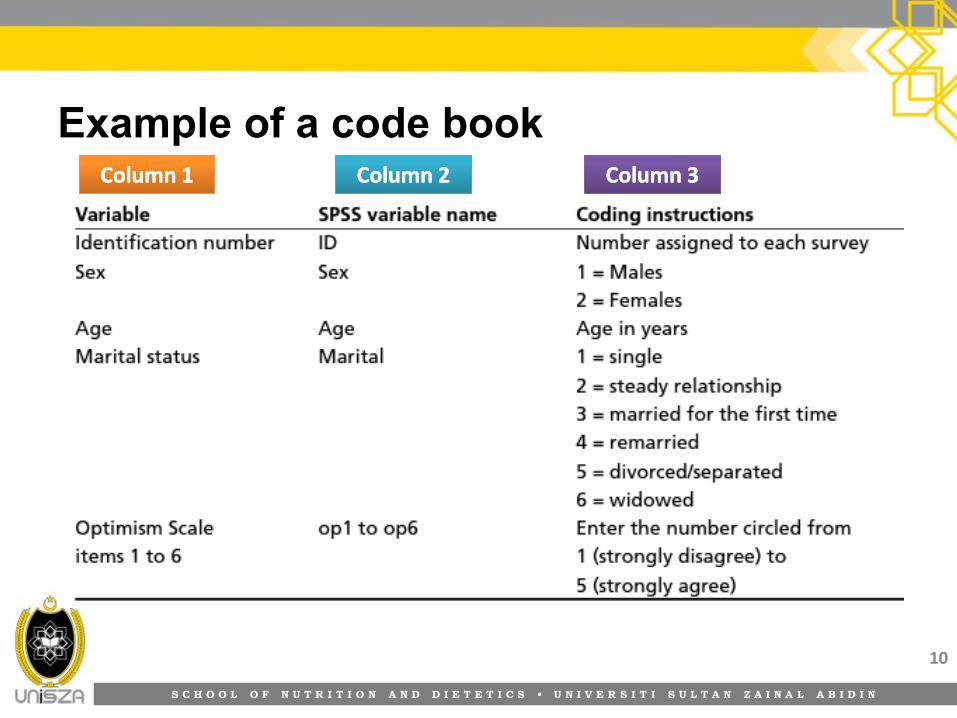
• Structure of code book;
– Column 1: identifies the question and its number in the research
instrument for which the information is being coded
– Column 2: refers to the name of variable in SPSS or MS Excel.
Each variable should have a unique name
– Column 3: lists the responses to the various questions and
actual codes of the code book
9
S C H O O L O F N U T R I T I O N A N D D I E T E T I C S • U N I V E R S I T I S U L T A N Z A I N A L A B I D I N
Example of a code book
10
Column 1Column 1 Column 1Column 1 Column 2Column 2 Column 2Column 2 Column 3Column 3 Column 3Column 3
S C H O O L O F N U T R I T I O N A N D D I E T E T I C S • U N I V E R S I T I S U L T A N Z A I N A L A B I D I N
Step 2: Pre-testing the code book
• Pre-test involves selecting a few questionnaires and
actually coding the responses
– to ascertain any problems in coding
• If any problem arises, change the code book, after the
pre-test.
11

S C H O O L O F N U T R I T I O N A N D D I E T E T I C S • U N I V E R S I T I S U L T A N Z A I N A L A B I D I N
Step 3: Coding the data
• Three ways of coding data
– Coding on the questionnaire itself, if space for coding is
provided at the time of constructing the instrument
– Coding on separate code sheets that are available for purchase
– Coding directly into the computer using a program such as
SPSS.
12
S C H O O L O F N U T R I T I O N A N D D I E T E T I C S • U N I V E R S I T I S U L T A N Z A I N A L A B I D I N
Step 4: Verifying the coded data
• Select a few research instruments at random and record
the responses to identify any discrepancies in coding.
• Frame of analysis can also be developed at this point to
identify;
– Which variable are we planning to analyze
– How they should be analysed
– What cross-tabulation you need to work out
– Which variables you need to combine to construct major
concepts or to develop indices
13
S C H O O L O F N U T R I T I O N A N D D I E T E T I C S • U N I V E R S I T I S U L T A N Z A I N A L A B I D I N
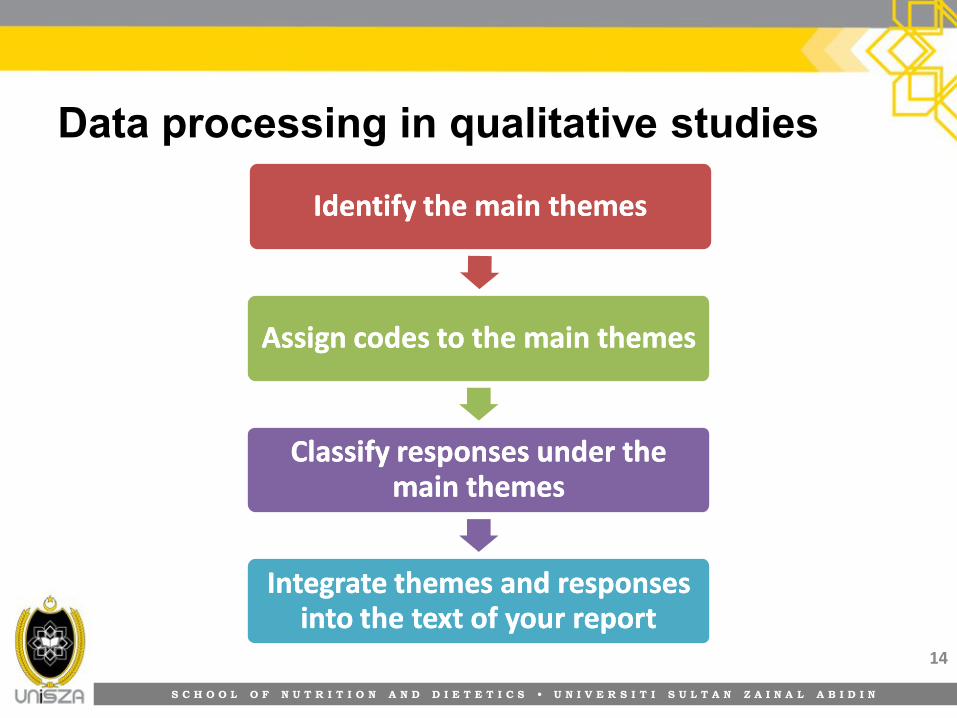
Data processing in qualitative studies
14
Identify the main themesIdentify the main themes
Assign codes to the main themesAssign codes to the main themes
Classify responses under the Classify responses under the main themesmain themes
Integrate themes and responses Integrate themes and responses into the text of your report into the text of your report
S C H O O L O F N U T R I T I O N A N D D I E T E T I C S • U N I V E R S I T I S U L T A N Z A I N A L A B I D I N
Possible results from statistical analysis
1. Significant and predicted results
– Easiest to explain
– Results support logical links developed by the
researcher among the framework, questions,
variables and measurement methods.
2. Significant and not predicted results
– If the results are valid – important addition to the
body of knowledge
– Sometimes the researcher believes so strongly in the
theory that he/she does not believe the results
• Convinced that there was a problem in the methodology 15
S C H O O L O F N U T R I T I O N A N D D I E T E T I C S • U N I V E R S I T I S U L T A N Z A I N A L A B I D I N
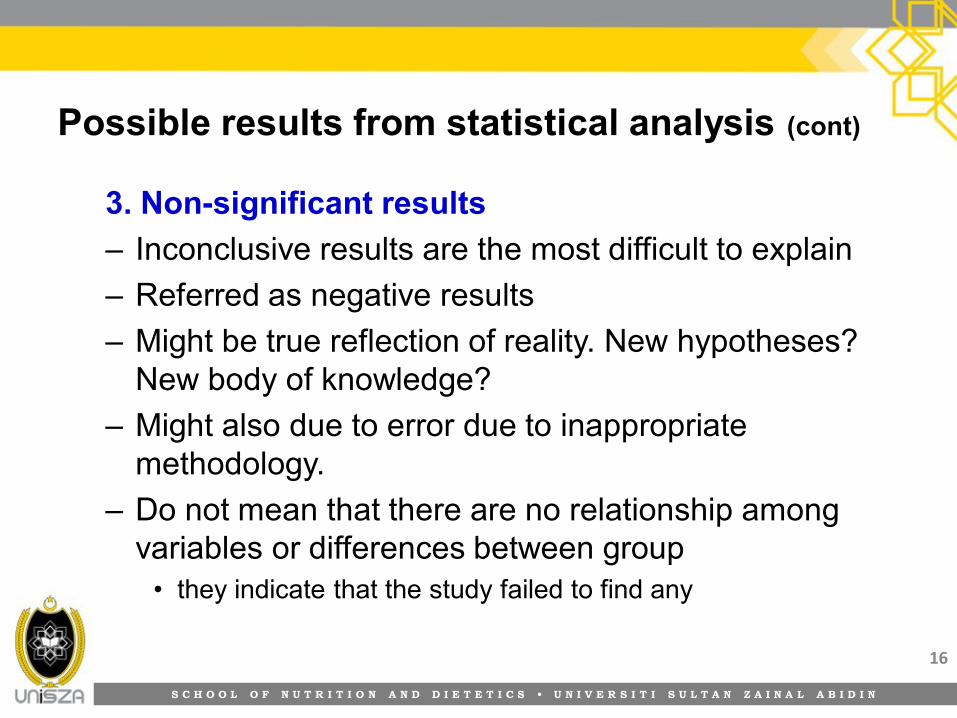
Possible results from statistical analysis (cont)
3. Non-significant results
– Inconclusive results are the most difficult to explain
– Referred as negative results
– Might be true reflection of reality. New hypotheses?
New body of knowledge?
– Might also due to error due to inappropriate
methodology.
– Do not mean that there are no relationship among
variables or differences between group
• they indicate that the study failed to find any
16
S C H O O L O F N U T R I T I O N A N D D I E T E T I C S • U N I V E R S I T I S U L T A N Z A I N A L A B I D I N
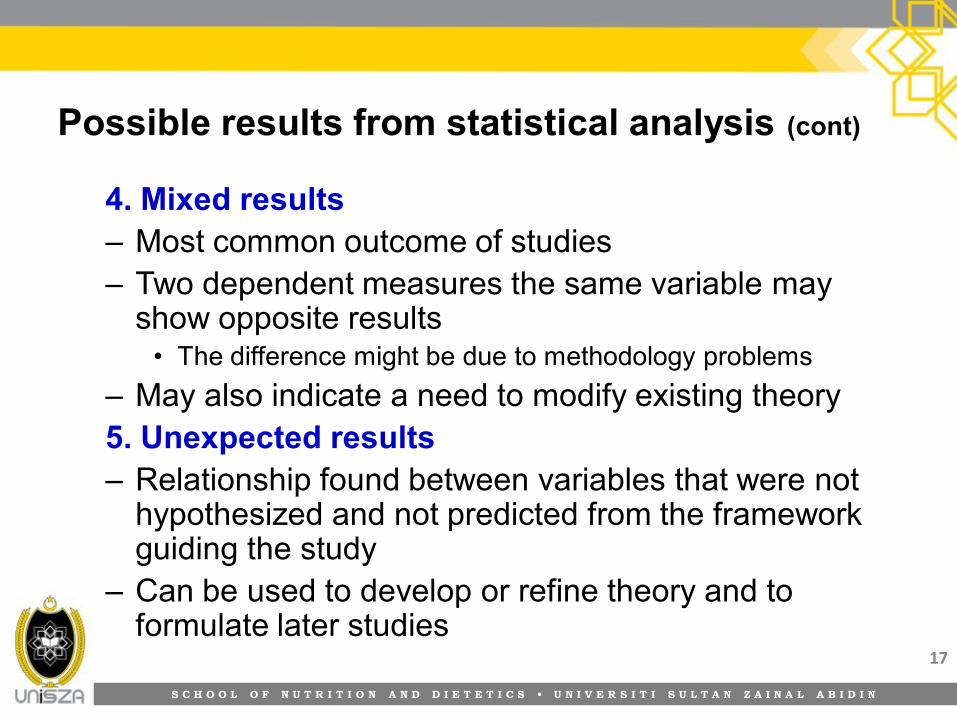
Possible results from statistical analysis (cont)
4. Mixed results
– Most common outcome of studies
– Two dependent measures the same variable may show opposite results
• The difference might be due to methodology problems
– May also indicate a need to modify existing theory
5. Unexpected results
– Relationship found between variables that were not hypothesized and not predicted from the framework guiding the study
– Can be used to develop or refine theory and to formulate later studies
17
S C H O O L O F N U T R I T I O N A N D D I E T E T I C S • U N I V E R S I T I S U L T A N Z A I N A L A B I D I N
Methods of displaying data
18
TextText TablesTables
GraphsGraphs Statistical Statistical measuremeasure
S C H O O L O F N U T R I T I O N A N D D I E T E T I C S • U N I V E R S I T I S U L T A N Z A I N A L A B I D I N
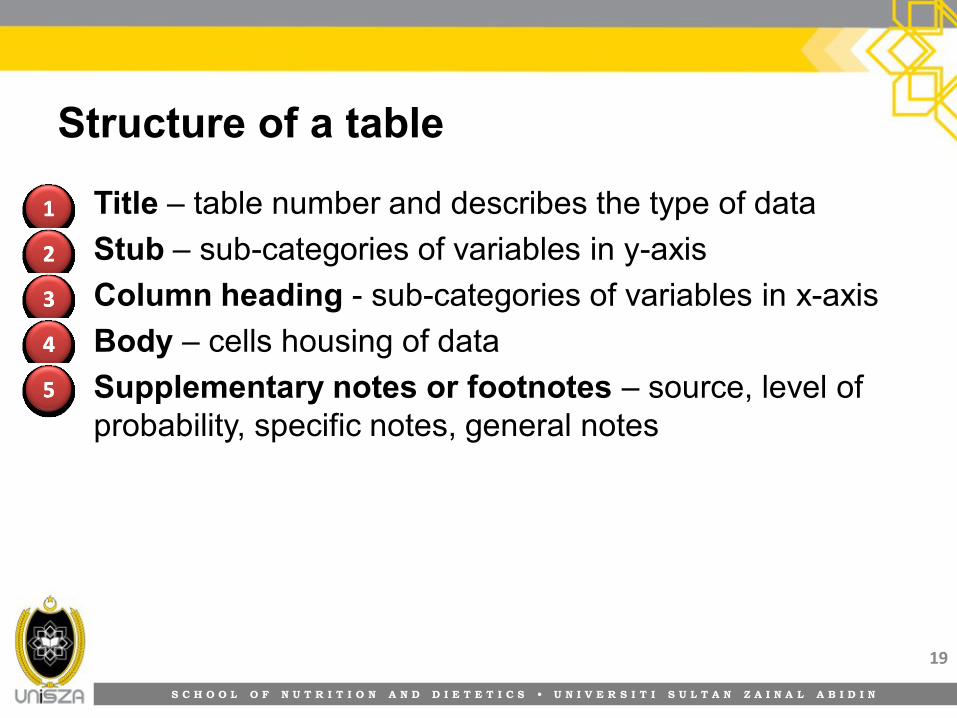
Structure of a table
• Title – table number and describes the type of data
• Stub – sub-categories of variables in y-axis
• Column heading - sub-categories of variables in x-axis
• Body – cells housing of data
• Supplementary notes or footnotes – source, level of
probability, specific notes, general notes
19
11
22
33
44
55

S C H O O L O F N U T R I T I O N A N D D I E T E T I C S • U N I V E R S I T I S U L T A N Z A I N A L A B I D I N
Structure of a table (cont.)
20
Characteristics Male Female p-value a
Age (years)
Body weight (kg)
Height (m)
BMI (kg/m2)
Body fat (%)
Bone mass (kg)
Table 4.1: Mean difference on anthropometric characteristics between male (n=60) and female (n=60) college students
Data were presented as mean ± SD a p-value less than 0.05 is significant
11
55
33
22 44
S C H O O L O F N U T R I T I O N A N D D I E T E T I C S • U N I V E R S I T I S U L T A N Z A I N A L A B I D I N
Percentage (%) in table/ graphs
• We need to calculate measures such as percentages,
cumulative percentages or ratios for accurate and
effective interpretation of data.
• Types of percentage
1. Row percentage
2. Column percentage
3. Total percentage
21

S C H O O L O F N U T R I T I O N A N D D I E T E T I C S • U N I V E R S I T I S U L T A N Z A I N A L A B I D I N
Percentage (%) in table/ graphs (cont.)
22
RowRow
• Calculated from the total of all the subcategories of one variable that are displayed along a row in different columns, in relation to only one subcategory of the other variable.
ColumnColumn
• Calculated from the total of all the subcategories of one variable that are displayed along a column in different rows, in relation to only one subcategory of the other variable.
TotalTotal
• This standardises the magnitude of each cell; that is, it gives the percentage of respondents who are classified in the subcategories of one variable in relation to the subcategories of the other variable.
S C H O O L O F N U T R I T I O N A N D D I E T E T I C S • U N I V E R S I T I S U L T A N Z A I N A L A B I D I N
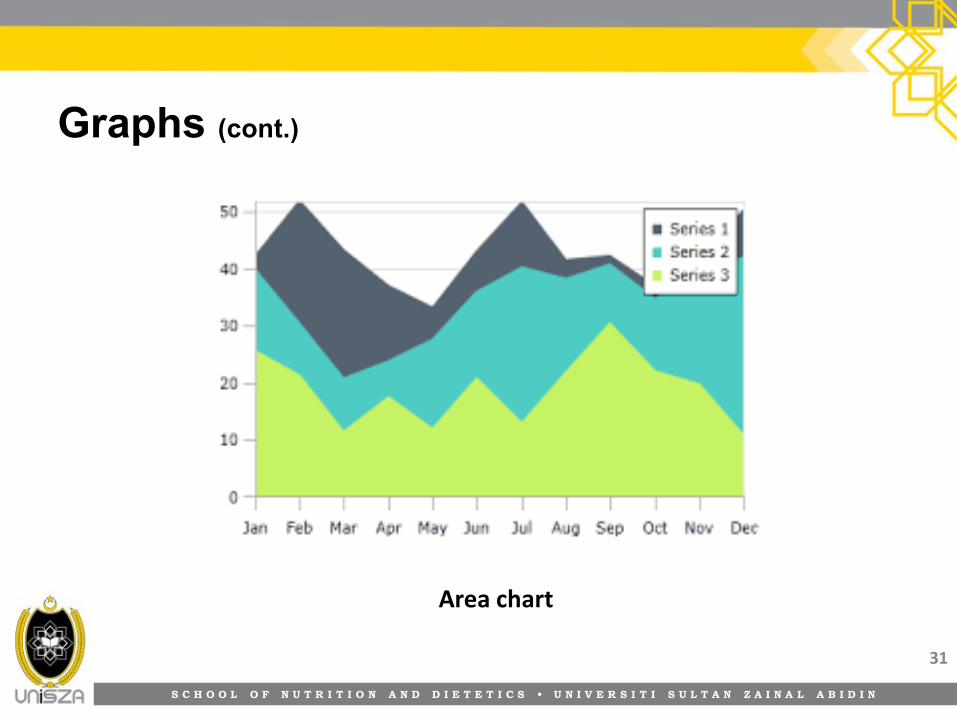
Graphs
• A graphic presentation is constructed in relation to two
axes: horizontal (x-axis) and vertical (y-axis).
• If a graph is designed to display only one variable,
represent the subcategories of the variable along the x-
axis and the frequency or count of that subcategory
along the y-axis. The point where the axes intersect is
considered as the zero point for the y-axis.
– When a graph presents two variables, one is displayed on each
axis and the point where they intersect is considered as the
starting or zero point.
23
S C H O O L O F N U T R I T I O N A N D D I E T E T I C S • U N I V E R S I T I S U L T A N Z A I N A L A B I D I N
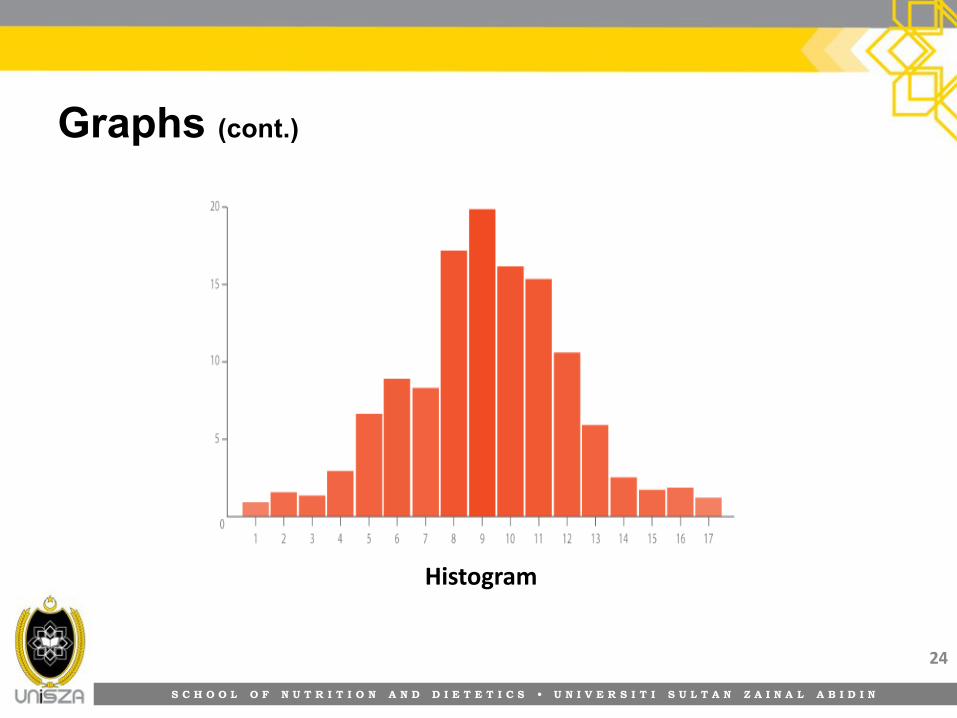
Graphs (cont.)
24
Histogram

S C H O O L O F N U T R I T I O N A N D D I E T E T I C S • U N I V E R S I T I S U L T A N Z A I N A L A B I D I N
Graphs (cont.)
25
Bar chart
S C H O O L O F N U T R I T I O N A N D D I E T E T I C S • U N I V E R S I T I S U L T A N Z A I N A L A B I D I N
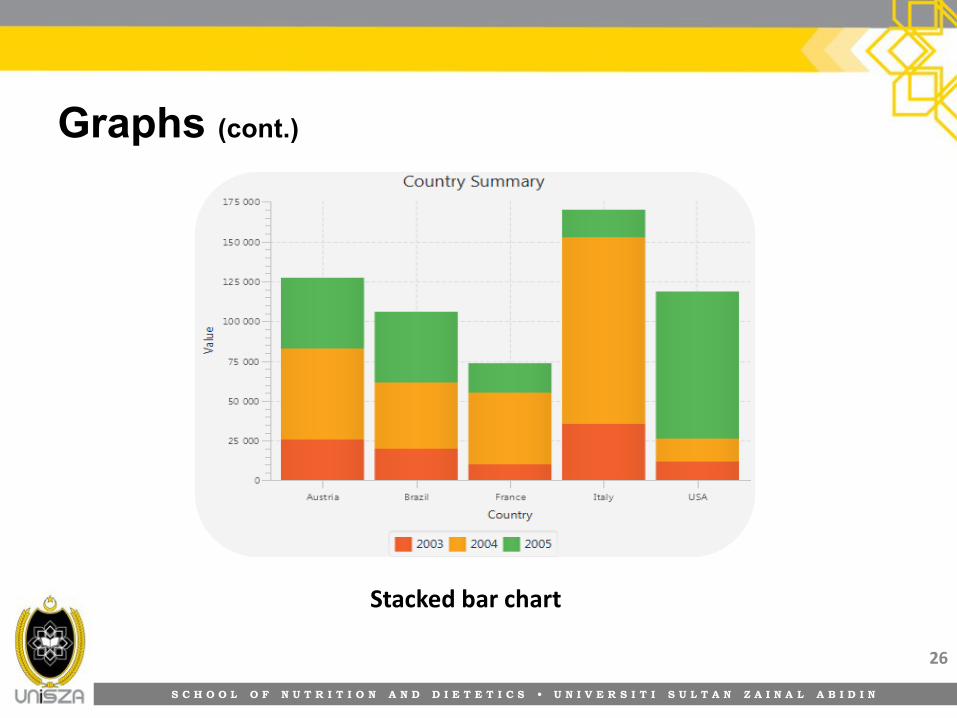
Graphs (cont.)
26
Stacked bar chart
S C H O O L O F N U T R I T I O N A N D D I E T E T I C S • U N I V E R S I T I S U L T A N Z A I N A L A B I D I N
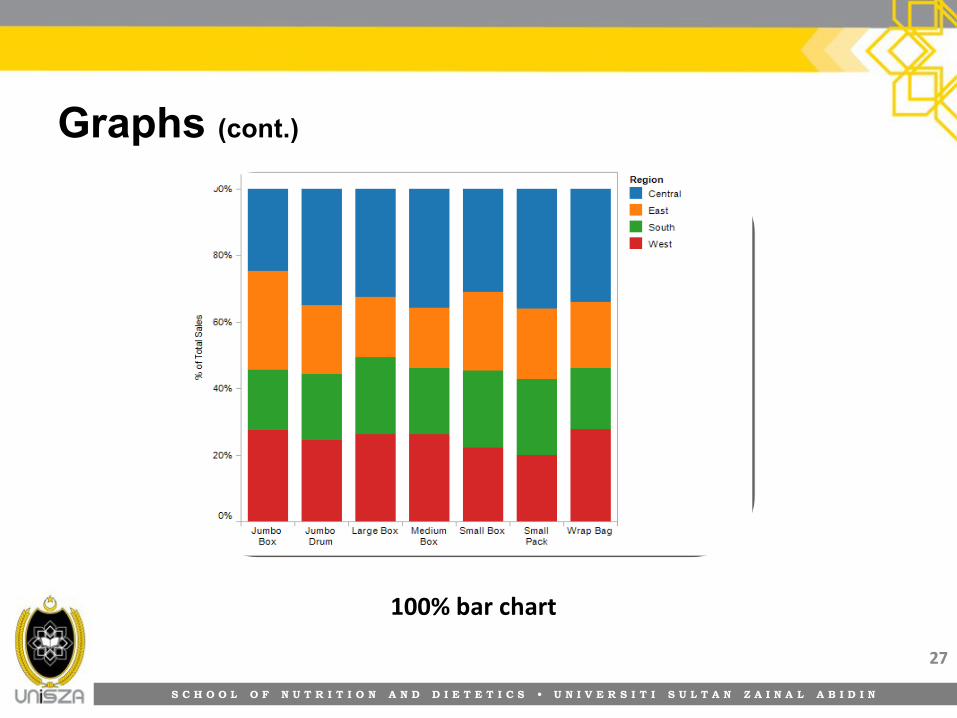
Graphs (cont.)
27
100% bar chart
S C H O O L O F N U T R I T I O N A N D D I E T E T I C S • U N I V E R S I T I S U L T A N Z A I N A L A B I D I N
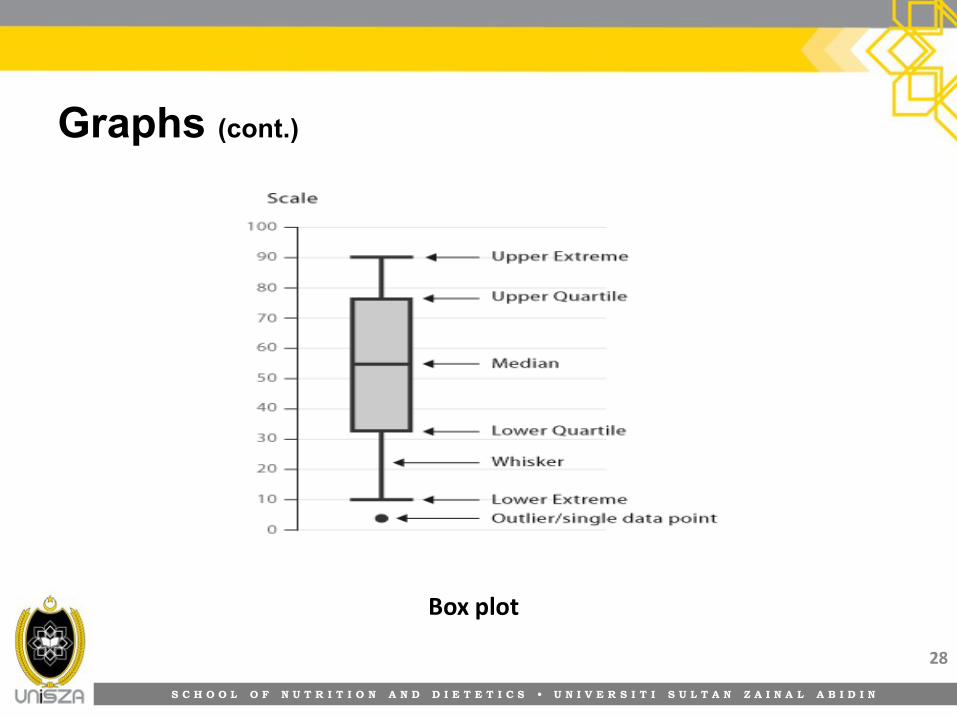
Graphs (cont.)
28
Box plot
S C H O O L O F N U T R I T I O N A N D D I E T E T I C S • U N I V E R S I T I S U L T A N Z A I N A L A B I D I N
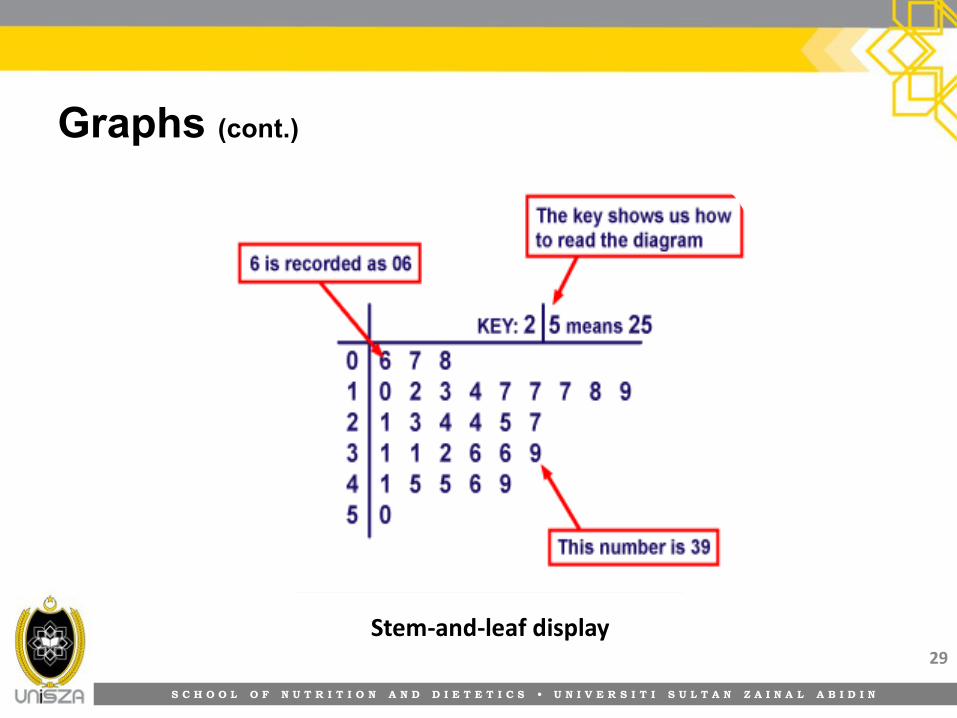
Graphs (cont.)
29
Stem-and-leaf display
S C H O O L O F N U T R I T I O N A N D D I E T E T I C S • U N I V E R S I T I S U L T A N Z A I N A L A B I D I N
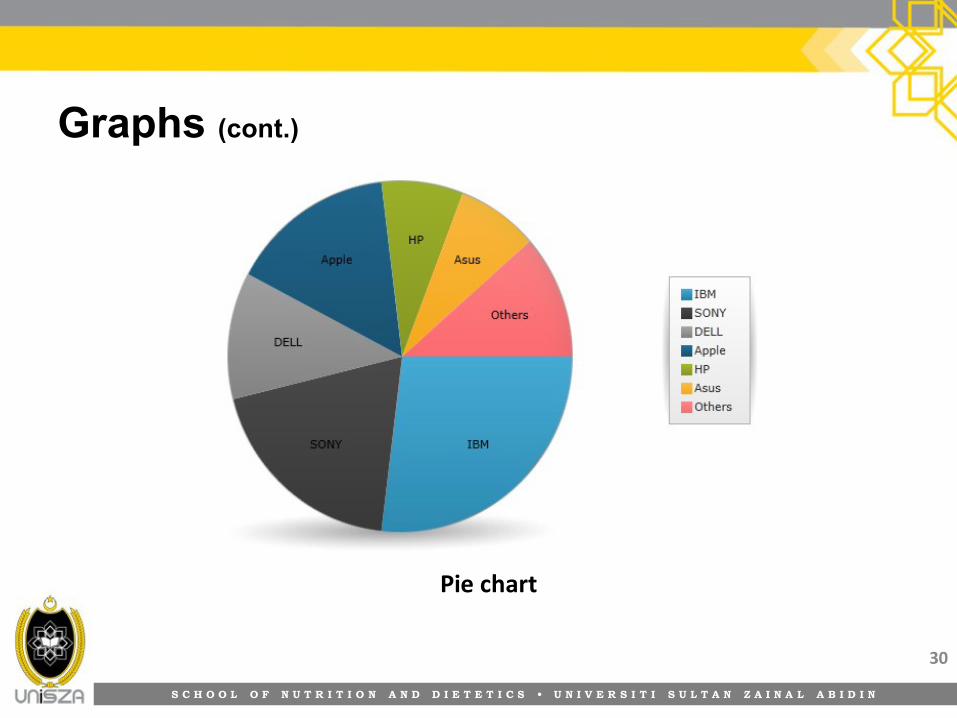
Graphs (cont.)
30
Pie chart
S C H O O L O F N U T R I T I O N A N D D I E T E T I C S • U N I V E R S I T I S U L T A N Z A I N A L A B I D I N
Graphs (cont.)
31
Area chart
S C H O O L O F N U T R I T I O N A N D D I E T E T I C S • U N I V E R S I T I S U L T A N Z A I N A L A B I D I N
Graphs (cont.)
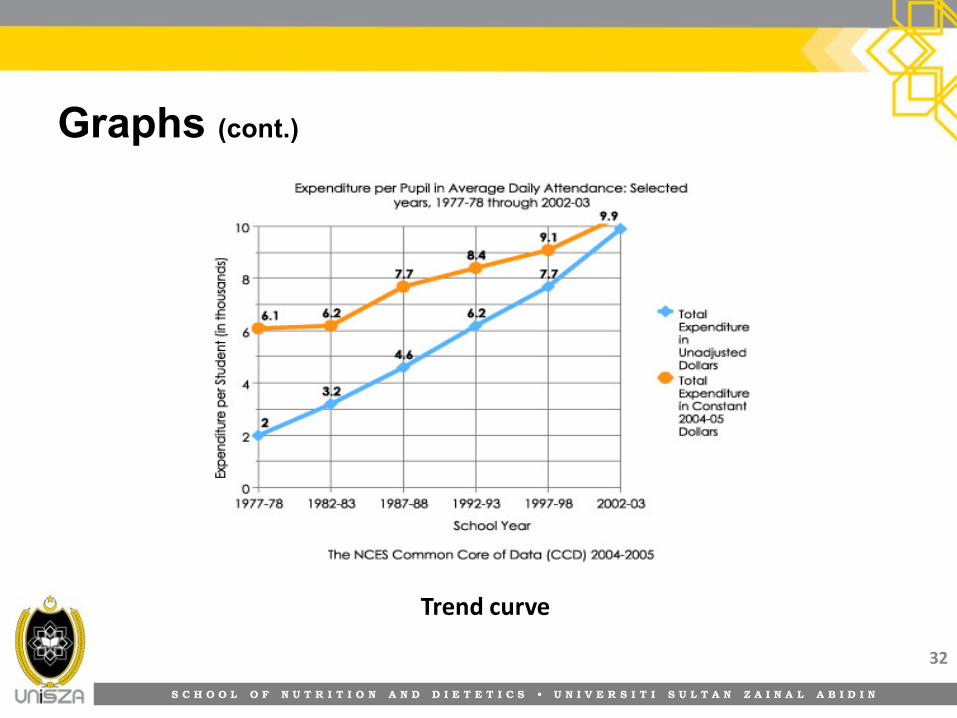
32
Trend curve
S C H O O L O F N U T R I T I O N A N D D I E T E T I C S • U N I V E R S I T I S U L T A N Z A I N A L A B I D I N
Graphs (cont.)
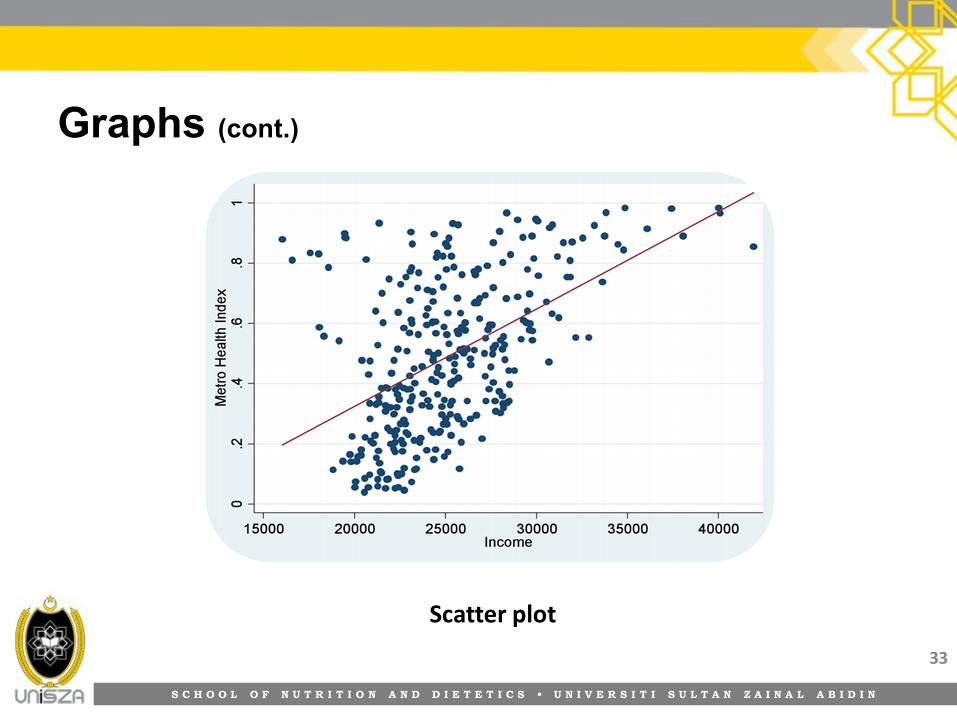
33
Scatter plot

S C H O O L O F N U T R I T I O N A N D D I E T E T I C S • U N I V E R S I T I S U L T A N Z A I N A L A B I D I N
Strategies for communicating research
34
Nutritionist/ Nutritionist/ DietitianDietitian
Health care Health care professionalsprofessionals
Policy makersPolicy makers
Health Health consumersconsumers
S C H O O L O F N U T R I T I O N A N D D I E T E T I C S • U N I V E R S I T I S U L T A N Z A I N A L A B I D I N
Audience – Nutritionist & Dietitian
• Oral and visual presentations
– Nutrition/ Dietetics research conferences and meetings
– Collaborative nutritionist/ dietitian groups
– Theses and dissertation defenses
– DVD, videotapes and audio taped presentation
– Websites
• Written reports
– Nutrition/ Dietetics-referred journals, books,
monographs, research newsletters, electronic
databases, foundation reports, theses and dissertation 35
S C H O O L O F N U T R I T I O N A N D D I E T E T I C S • U N I V E R S I T I S U L T A N Z A I N A L A B I D I N
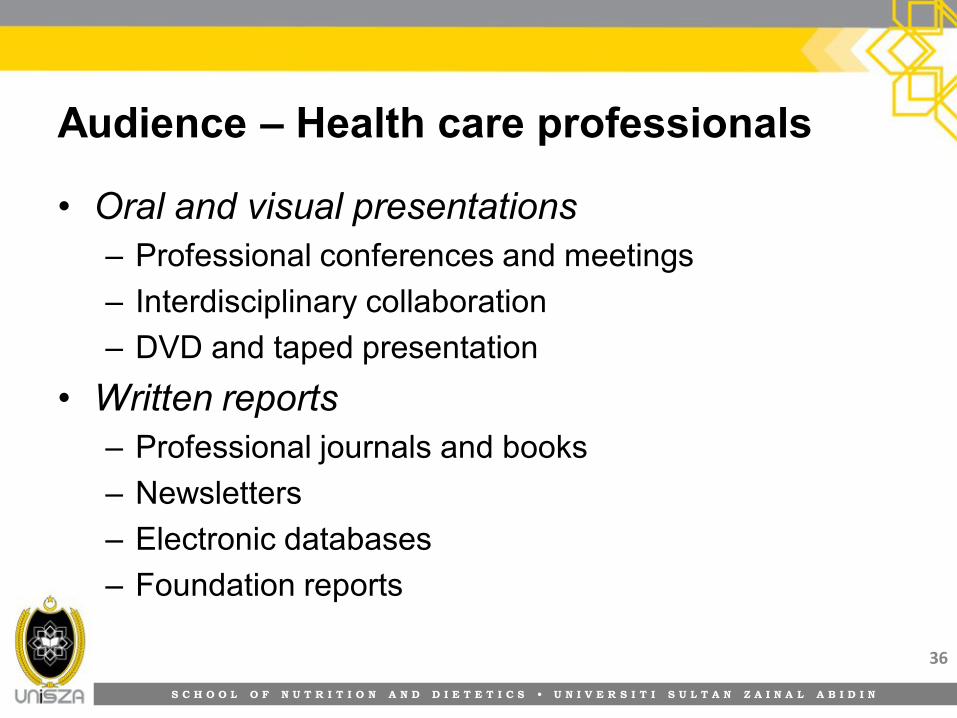
Audience – Health care professionals
• Oral and visual presentations
– Professional conferences and meetings
– Interdisciplinary collaboration
– DVD and taped presentation
• Written reports
– Professional journals and books
– Newsletters
– Electronic databases
– Foundation reports
36
S C H O O L O F N U T R I T I O N A N D D I E T E T I C S • U N I V E R S I T I S U L T A N Z A I N A L A B I D I N
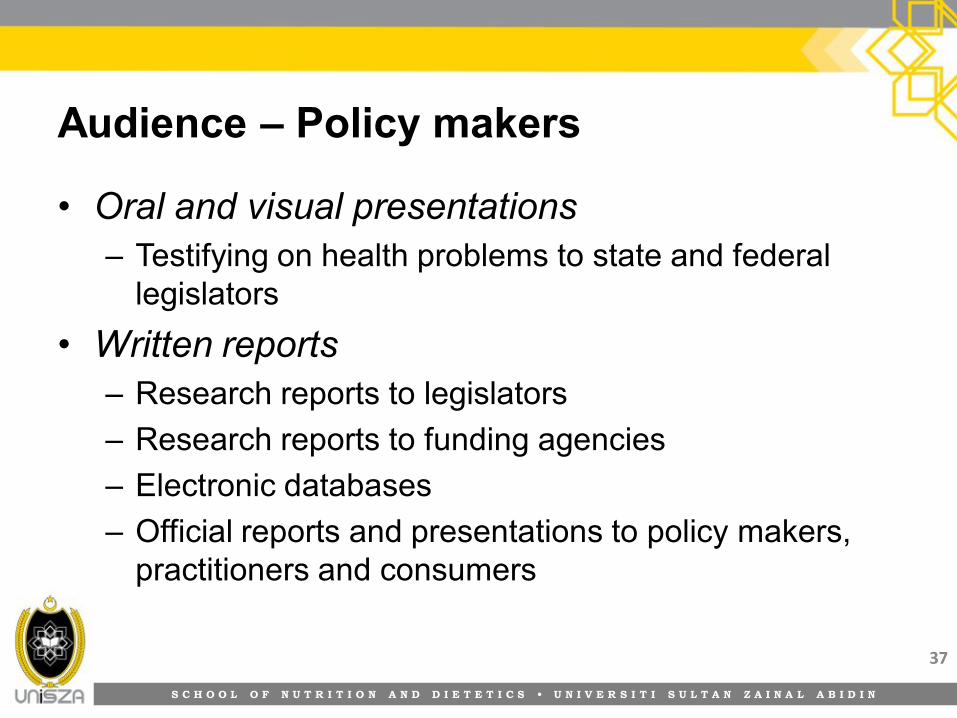
Audience – Policy makers
• Oral and visual presentations
– Testifying on health problems to state and federal
legislators
• Written reports
– Research reports to legislators
– Research reports to funding agencies
– Electronic databases
– Official reports and presentations to policy makers,
practitioners and consumers
37
S C H O O L O F N U T R I T I O N A N D D I E T E T I C S • U N I V E R S I T I S U L T A N Z A I N A L A B I D I N
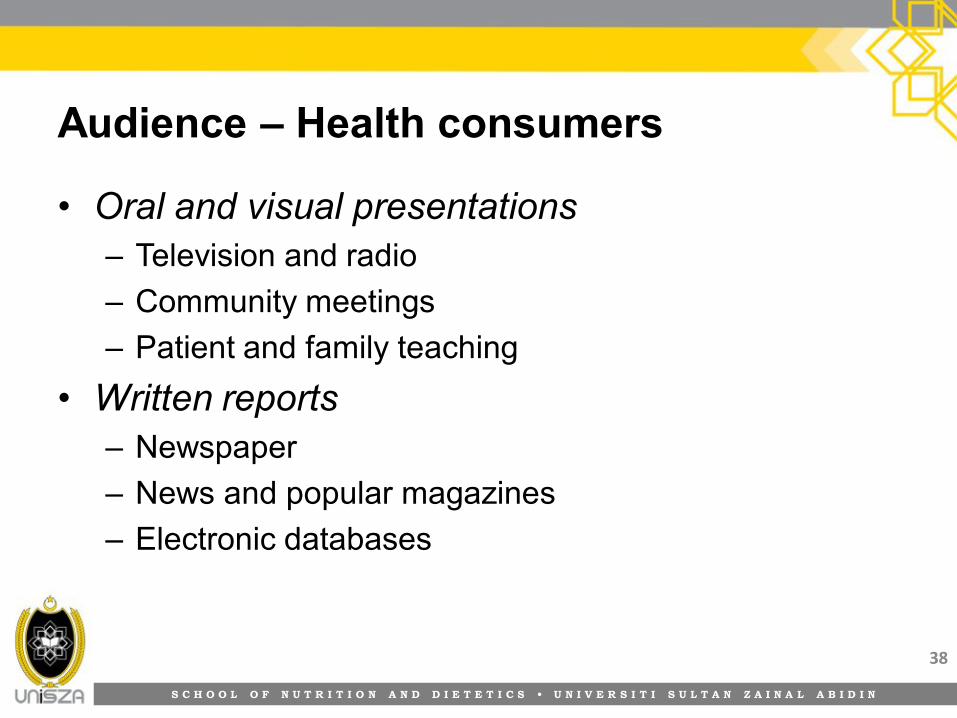
Audience – Health consumers
• Oral and visual presentations
– Television and radio
– Community meetings
– Patient and family teaching
• Written reports
– Newspaper
– News and popular magazines
– Electronic databases
38
S C H O O L O F N U T R I T I O N A N D D I E T E T I C S • U N I V E R S I T I S U L T A N Z A I N A L A B I D I N
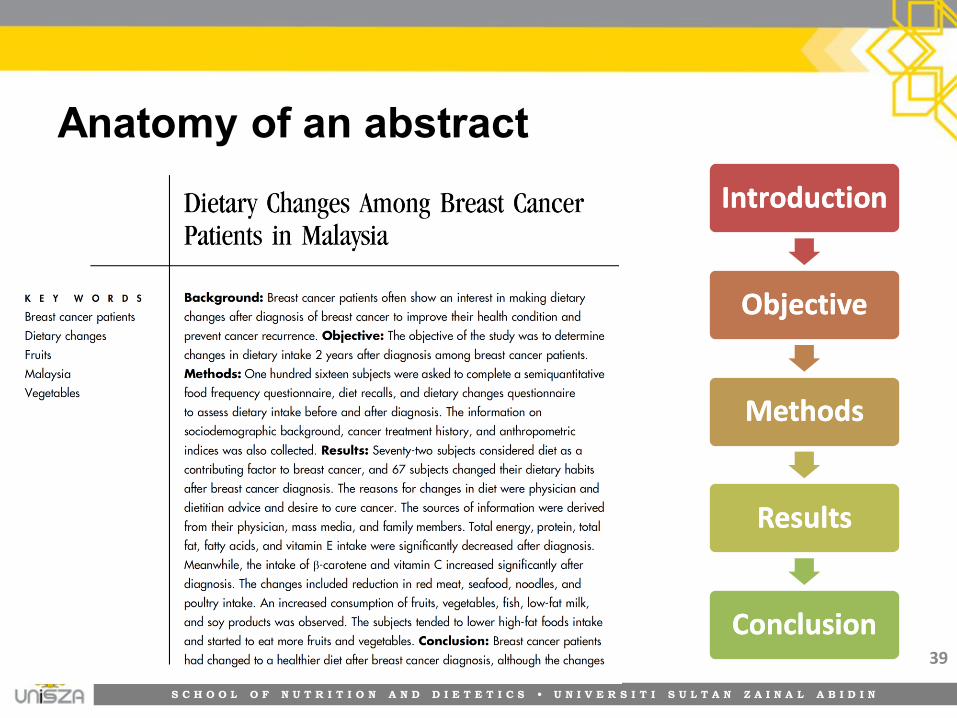
Anatomy of an abstract
39
IntroductionIntroduction
ObjectiveObjective
MethodsMethods
ResultsResults
ConclusionConclusion
S C H O O L O F N U T R I T I O N A N D D I E T E T I C S • U N I V E R S I T I S U L T A N Z A I N A L A B I D I N
Abstract – Introduction
• Begin simply, usually with no more than a sentence or
two
• Explain why this research is important
• Call this section ‘introduction’, ‘summary’ or
‘background’
40
S C H O O L O F N U T R I T I O N A N D D I E T E T I C S • U N I V E R S I T I S U L T A N Z A I N A L A B I D I N
Abstract – Objective
• Report the primary purpose of the study (can be one or
two sentences)
• Call this section ‘objective’, ‘purpose’ or ‘aims’
41

S C H O O L O F N U T R I T I O N A N D D I E T E T I C S • U N I V E R S I T I S U L T A N Z A I N A L A B I D I N
Abstract – Methods
• Describe the design of the study, the methods used to
achieve the purpose, and the procedures applied to
control interval validity
• Include the sampling strategy and the analytic plan
• Identify independent and dependent variable
• Do not overload with details
42
S C H O O L O F N U T R I T I O N A N D D I E T E T I C S • U N I V E R S I T I S U L T A N Z A I N A L A B I D I N
Abstract – Results
• Summarize the most important results (whether they
were statistically significant or not)
• Keep in mind that a lack of effect may be as the
presence of one
• Report some statistical results here, but limit these to
test statistics and associated p values
• Do not use this section to comment on the meaning of
the results, but simply report them.
43
S C H O O L O F N U T R I T I O N A N D D I E T E T I C S • U N I V E R S I T I S U L T A N Z A I N A L A B I D I N
Abstract – Conclusion
• Focus on the most important implication of the findings
and the usefulness for practice
• Address application issues here
44
S C H O O L O F N U T R I T I O N A N D D I E T E T I C S • U N I V E R S I T I S U L T A N Z A I N A L A B I D I N
Poster Presentation
• A research report presented as a visual display
• It can be read and viewed by large groups of people
• Informal setting
45

S C H O O L O F N U T R I T I O N A N D D I E T E T I C S • U N I V E R S I T I S U L T A N Z A I N A L A B I D I N
46

S C H O O L O F N U T R I T I O N A N D D I E T E T I C S • U N I V E R S I T I S U L T A N Z A I N A L A B I D I N
47
S C H O O L O F N U T R I T I O N A N D D I E T E T I C S • U N I V E R S I T I S U L T A N Z A I N A L A B I D I N
Tips for poster presentation
• Use arrows, flowcharts, diagrams, photos to demonstrate the research
• Use bullets in the text
• Use a neutral-color background for the poster
• Self-explanatory graphics should dominate the poster
• Text and graphics should be readable from a distance of 4 to 6 feet.
• Vary the font size according to the importance of the information
• Flow of the poster should be from left to right and top to bottom
48
S C H O O L O F N U T R I T I O N A N D D I E T E T I C S • U N I V E R S I T I S U L T A N Z A I N A L A B I D I N
Oral presentation
• An oral presentation is also called as podium
presentation
• Presentation of key elements of a research study at a
professional conference
• Type of presentation expected;
– Informal roundtable discussion ‘OR’
– Highly formalized keynote speeches
49

S C H O O L O F N U T R I T I O N A N D D I E T E T I C S • U N I V E R S I T I S U L T A N Z A I N A L A B I D I N
50
S C H O O L O F N U T R I T I O N A N D D I E T E T I C S • U N I V E R S I T I S U L T A N Z A I N A L A B I D I N
Suggested format for oral presentation
1. An introduction to the problem or clinical issue
2. The purpose or primary aim of the research and the research question
3. Design of the study, including a description of the methods and procedures
4. The findings from the study, including the type of analysis and the major results
5. A discussion of the results, including major limitations, as well as the most important findings for clinical practice
6. Implications for future research and for clinical practice
51

Thank YouThank You
52