11.1 © 2006 by prentice hall welcome. 11.2 © 2006 by prentice hall title of the thesis...
TRANSCRIPT

11.1 © 2006 by Prentice Hall
WelcomeWelcome
11.2 © 2006 by Prentice Hall
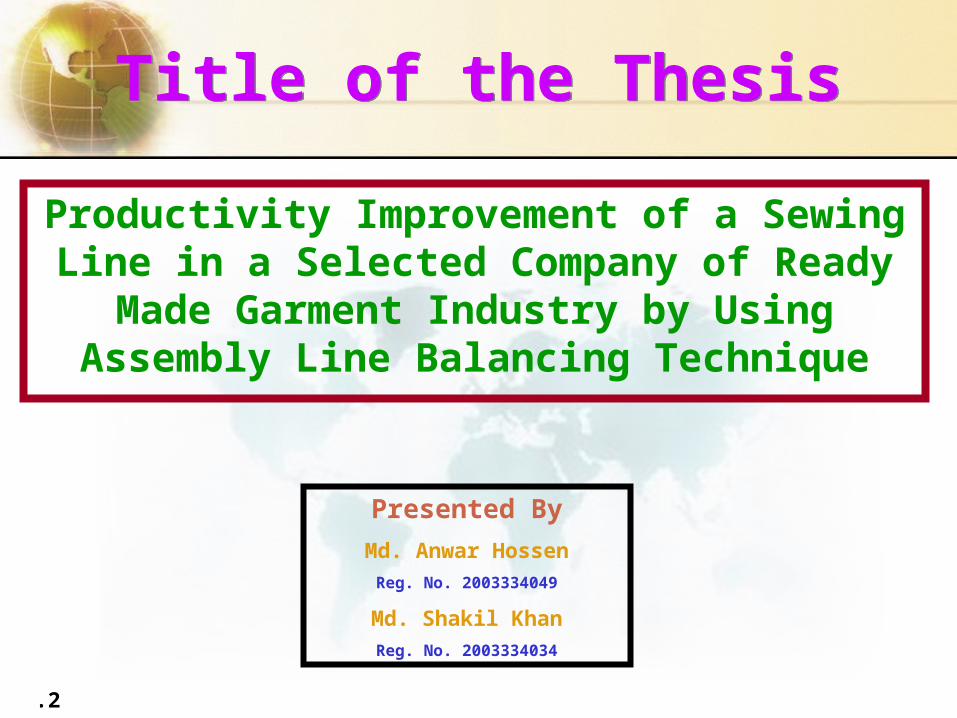
Title of the ThesisTitle of the Thesis
Productivity Improvement of a Sewing Line in a Selected Company of Ready
Made Garment Industry by Using Assembly Line Balancing Technique
Presented By
Md. Anwar HossenReg. No. 2003334049
Md. Shakil KhanReg. No. 2003334034
11.3 © 2006 by Prentice Hall
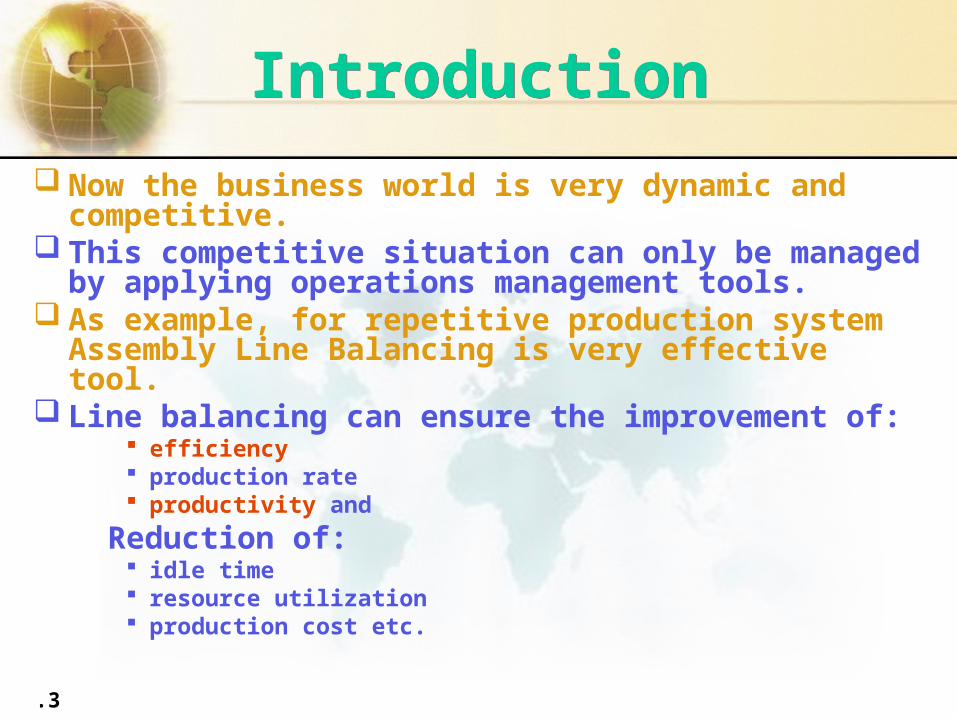
Now the business world is very dynamic and competitive.
This competitive situation can only be managed by applying operations management tools.
As example, for repetitive production system Assembly Line Balancing is very effective tool.
Line balancing can ensure the improvement of: efficiency production rate productivity and
Reduction of: idle time resource utilization production cost etc.
IntroductionIntroduction
11.4 © 2006 by Prentice Hall
ObjectivesObjectives
To evaluate the existing assembly line for finding the current status
To reduce idle time, if any
To improve productivity, if possible
11.5 © 2006 by Prentice Hall
Research MethodologyResearch Methodology
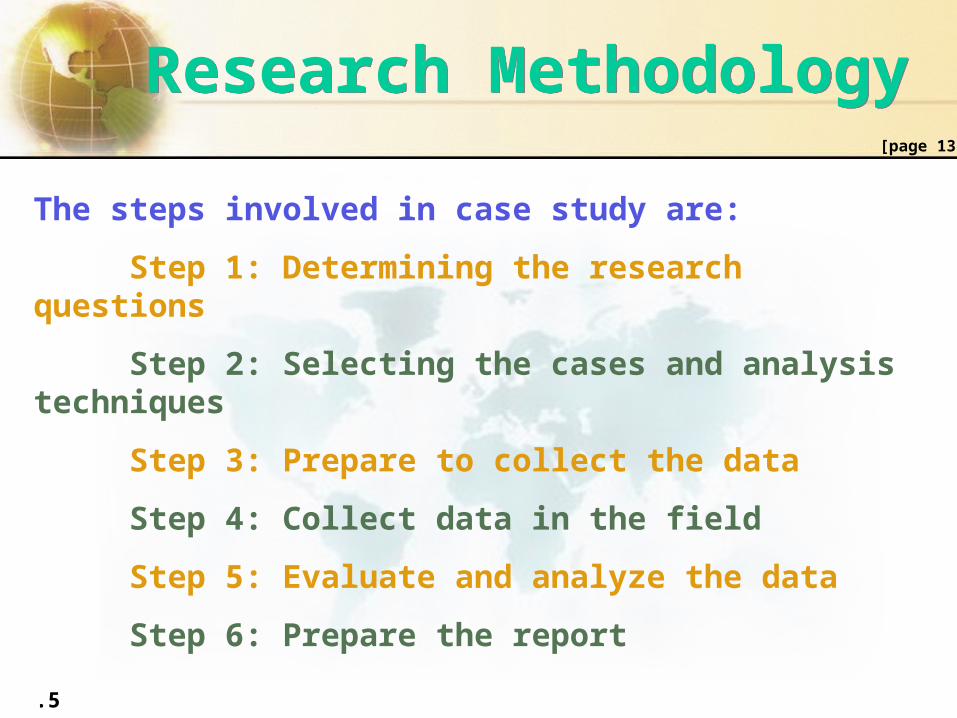
The steps involved in case study are:
Step 1: Determining the research questions
Step 2: Selecting the cases and analysis techniques
Step 3: Prepare to collect the data
Step 4: Collect data in the field
Step 5: Evaluate and analyze the data
Step 6: Prepare the report
[page 13]
11.6 © 2006 by Prentice Hall
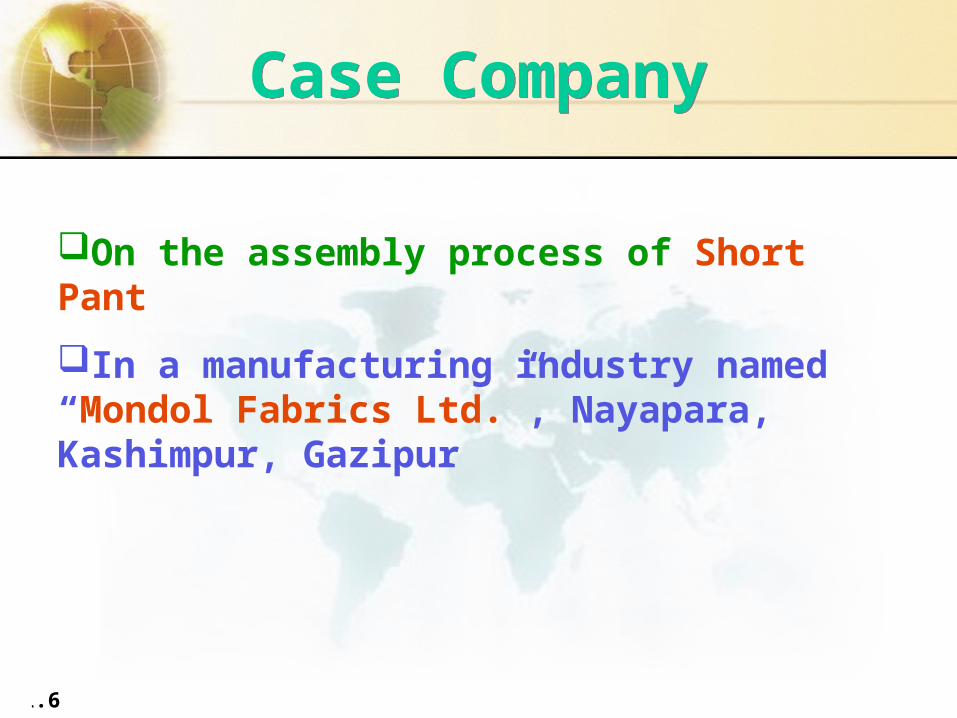
Case CompanyCase Company
On the assembly process of Short Pant
In a manufacturing industry named “Mondol Fabrics Ltd.”, Nayapara, Kashimpur, Gazipur

11.7 © 2006 by Prentice Hall
Tools & TechniquesTools & TechniquesEvaluation parameters of existing assembly process:
efficiency
idle time
production time
production rate
production cost &
productivity
Scientific technique “Six-Step Assembly Line Balancing”
Improvement analysis “Sequential Improvement Technique”

11.8 © 2006 by Prentice Hall
Evaluation Evaluation
11.9 © 2006 by Prentice Hall
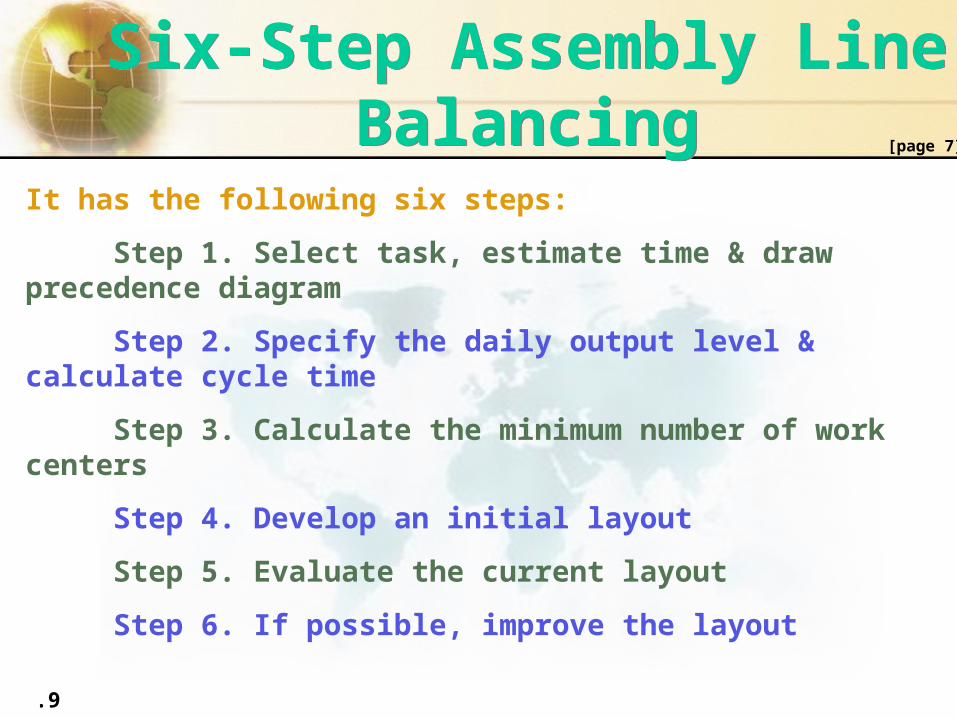
Six-Step Assembly Line Balancing
Six-Step Assembly Line Balancing
It has the following six steps:
Step 1. Select task, estimate time & draw precedence diagram
Step 2. Specify the daily output level & calculate cycle time
Step 3. Calculate the minimum number of work centers
Step 4. Develop an initial layout
Step 5. Evaluate the current layout
Step 6. If possible, improve the layout
[page 7]

11.10 © 2006 by Prentice Hall
Time StudyTime Study
Time study is the combination of a series of activities as follows:
Step 1: Define the Task
Step 2: Breaking the Job into Elements
Step 3: Estimate the Required Number of Observation
Step 4: Record the Times and Ratings of Performance
Step 5: Average Observed Time
Step 6: Normal Time
Step 7: Allowance
Step 8: Standard Time
[page 3]
11.11 © 2006 by Prentice Hall
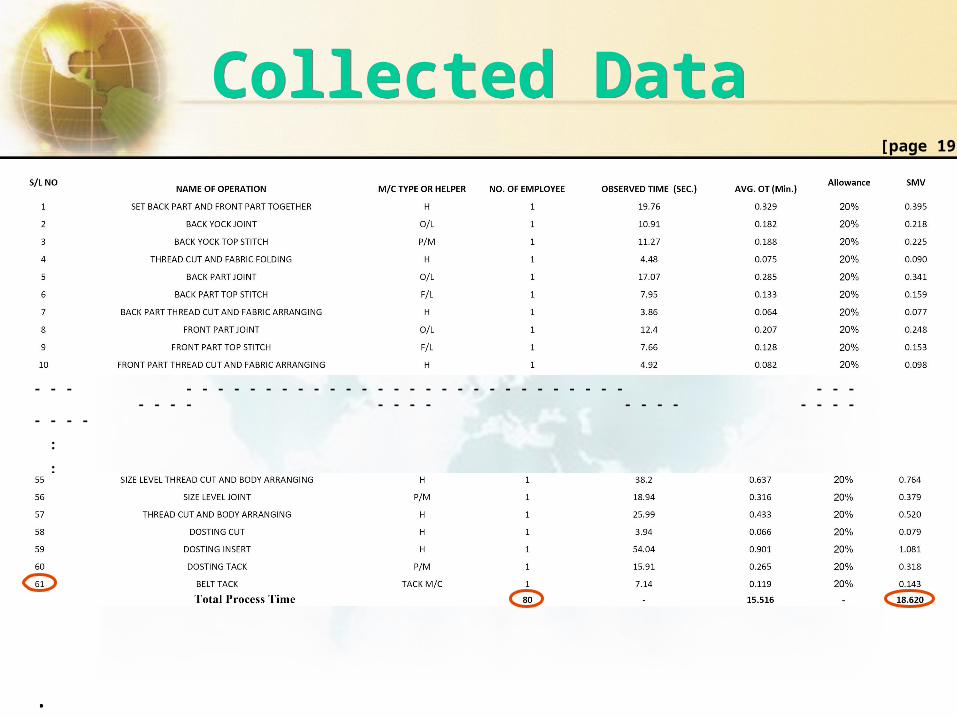
Collected DataCollected Data
- - - - - - - - - - - - - - - - - - - - - - - - - - - - - - - - - - - - - - - - - - - - - - - - - - - - - -
:
:
:
[page 19]
11.12 © 2006 by Prentice Hall
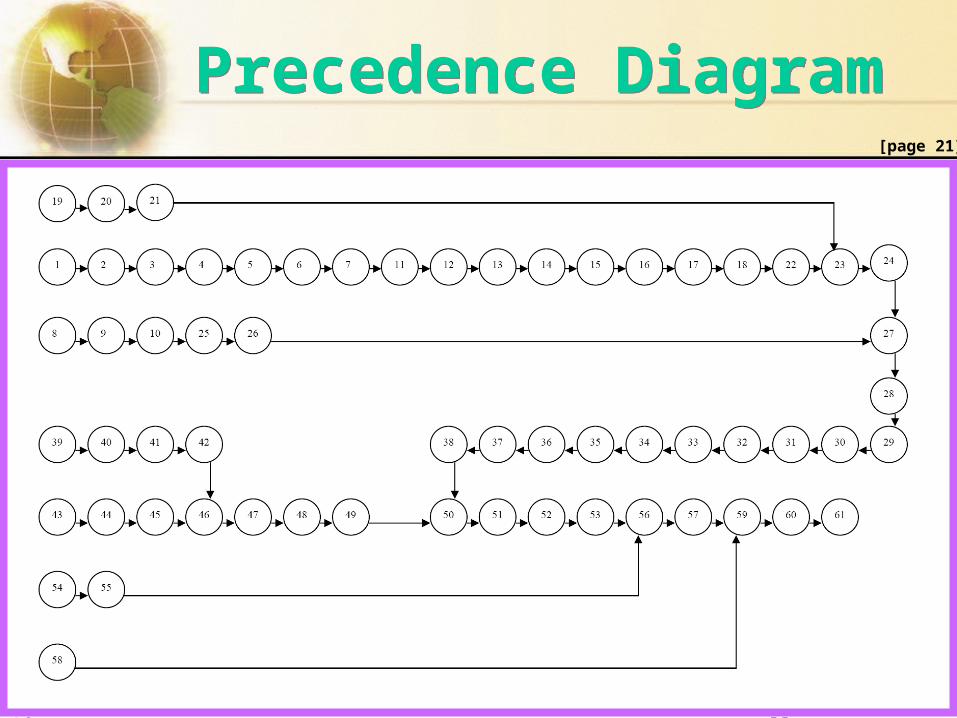
Precedence DiagramPrecedence Diagram[page 21]
11.13 © 2006 by Prentice Hall
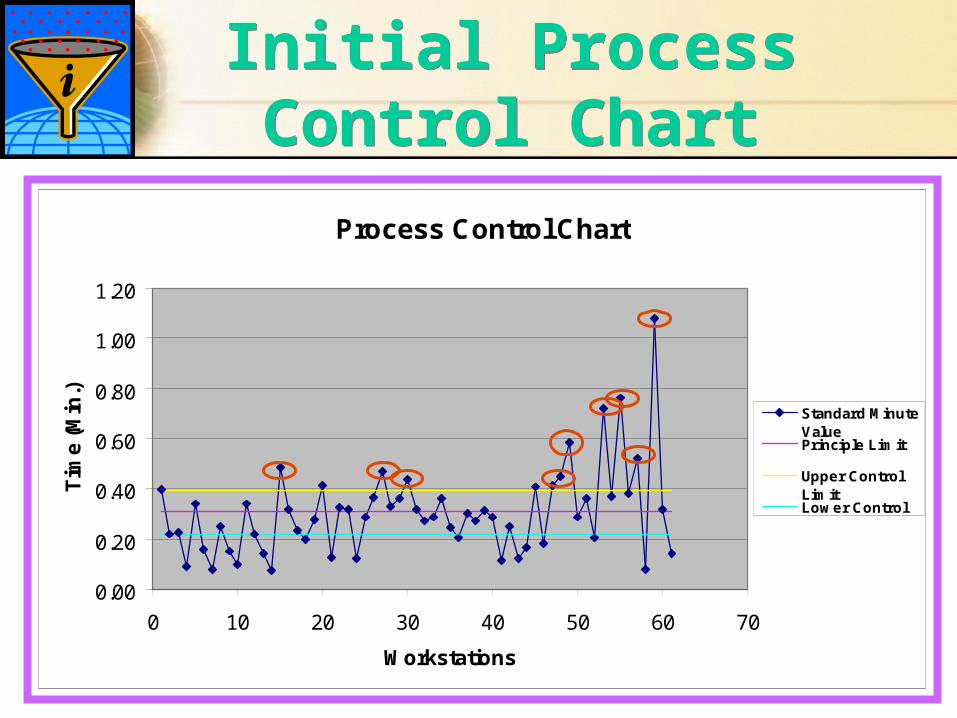
Initial Process Control Chart
Initial Process Control Chart
Process Control Chart
0.00
0.20
0.40
0.60
0.80
1.00
1.20
0 10 20 30 40 50 60 70
Workstations
Tim
e (
Min
.)
Standard MinuteValuePrinciple Limit
Upper ControlLimitLower ControlLimit
11.14 © 2006 by Prentice Hall
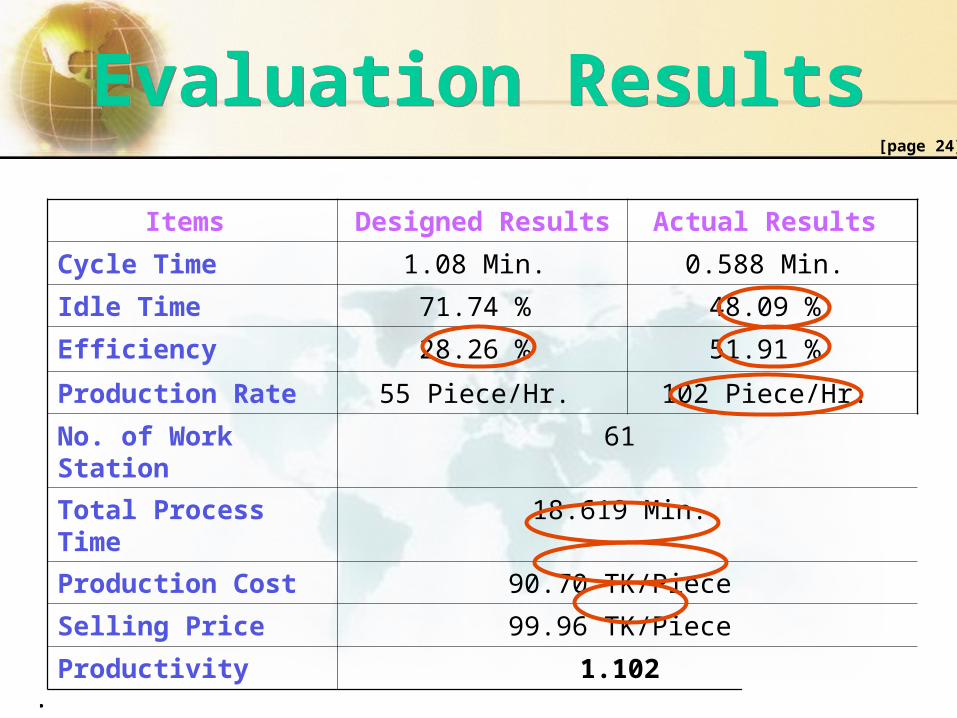
Evaluation ResultsEvaluation Results
Items Designed Results Actual Results
Cycle Time 1.08 Min. 0.588 Min.
Idle Time 71.74 % 48.09 %
Efficiency 28.26 % 51.91 %
Production Rate 55 Piece/Hr. 102 Piece/Hr.
No. of Work Station 61
Total Process Time 18.619 Min.
Production Cost 90.70 TK/Piece
Selling Price 99.96 TK/Piece
Productivity 1.102
[page 24]
11.15 © 2006 by Prentice Hall
Improvement Improvement
11.16 © 2006 by Prentice Hall
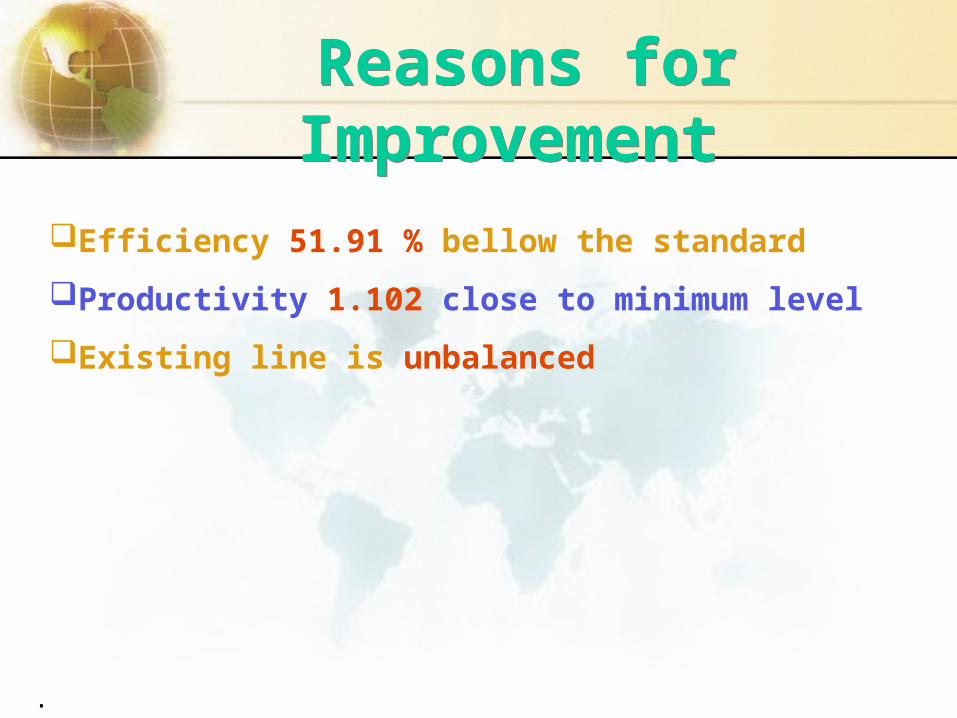
Reasons for Improvement Reasons for
Improvement Efficiency 51.91 % bellow the standard
Productivity 1.102 close to minimum level
Existing line is unbalanced

11.17 © 2006 by Prentice Hall
Sequential Improvement
Technique
Sequential Improvement
TechniqueIt has three sequential steps:
Step 1: Withdrawal of Idle Resources
Step 2: Redistribution of Tasks
Step 3: Bottleneck Reduction
a. By Existing Resources &
b. By Additional Resources
[page 9]

11.18 © 2006 by Prentice Hall
Summary after Withdrawal of Idle
Resources
Summary after Withdrawal of Idle
Resources Items Before Improvement After Improvement
Cycle Time 1.08 Min. 1.08 Min.
Idle Time 71.74 % 70.86 %
Efficiency 28.26 % 29.14 %
Production Rate 55 Piece/Hr. 55 Piece/Hr.
No. of Work Station 61
Total Process Time 18.619 Min. 19.217 Min.
No. of M/C & Operator 46 41
No. of Helper 34 33
[page 28]
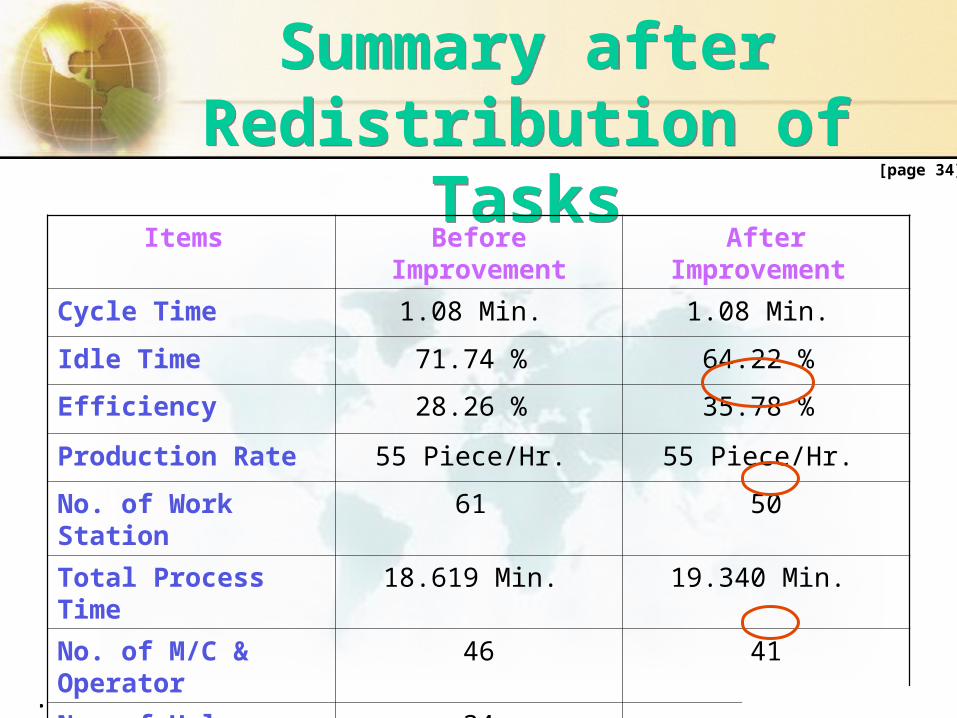
11.19 © 2006 by Prentice Hall
Summary afterRedistribution of Tasks
Summary afterRedistribution of Tasks
Items Before Improvement After Improvement
Cycle Time 1.08 Min. 1.08 Min.
Idle Time 71.74 % 64.22 %
Efficiency 28.26 % 35.78 %
Production Rate 55 Piece/Hr. 55 Piece/Hr.
No. of Work Station 61 50
Total Process Time 18.619 Min. 19.340 Min.
No. of M/C & Operator 46 41
No. of Helper 34 22
[page 34]
11.20 © 2006 by Prentice Hall
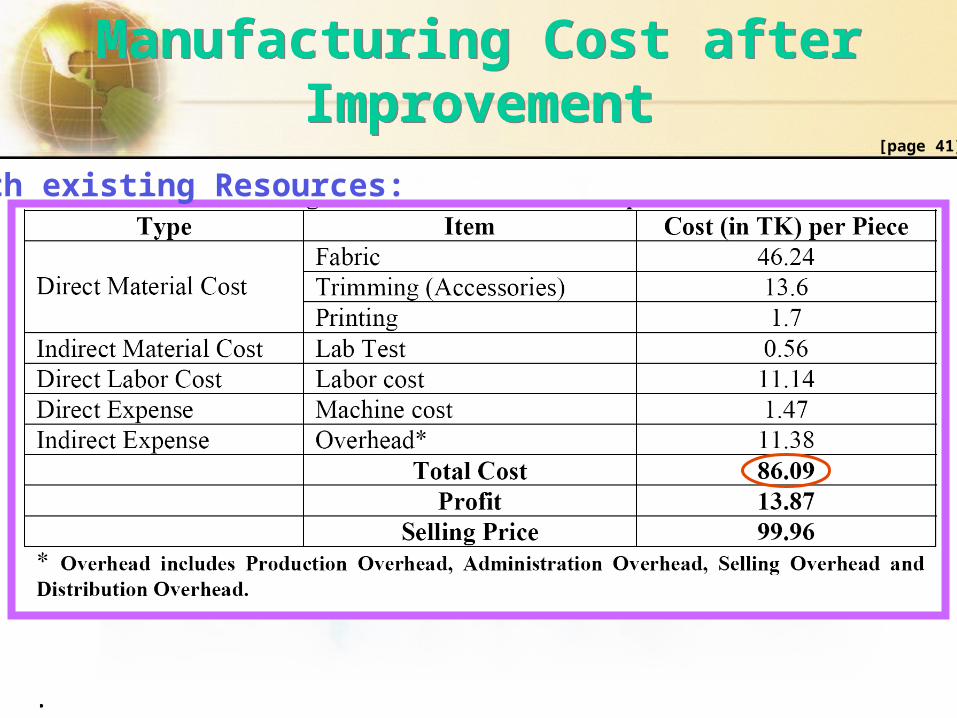
Manufacturing Cost after Improvement
Manufacturing Cost after Improvement
With existing Resources:[page 41]
11.21 © 2006 by Prentice Hall
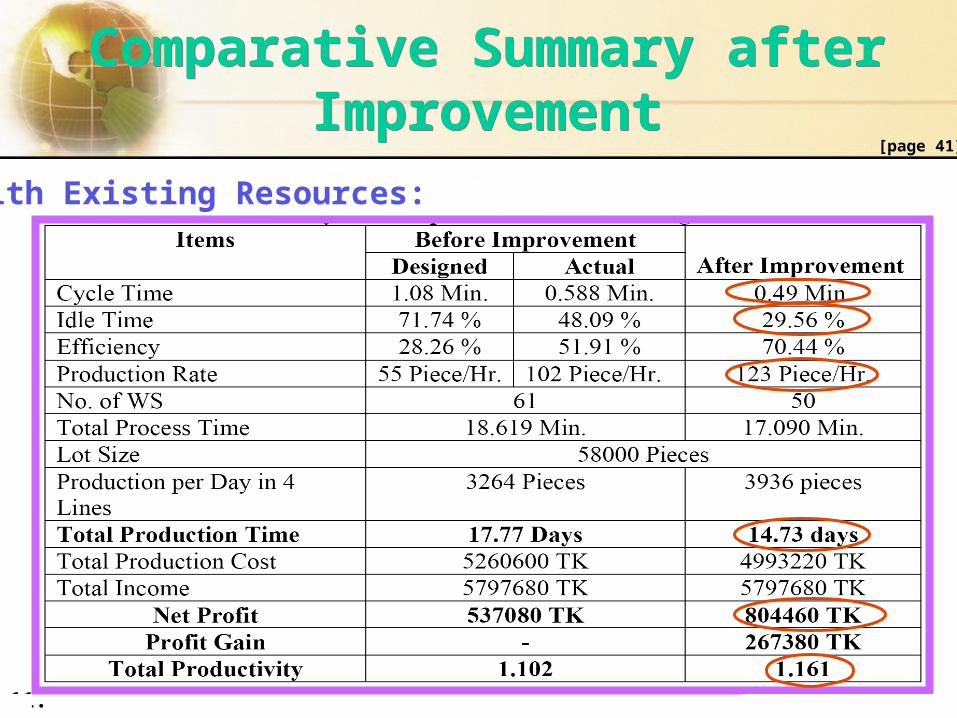
Comparative Summary after Improvement
Comparative Summary after Improvement
With Existing Resources:
[page 41]

11.22 © 2006 by Prentice Hall
Manufacturing Cost after Improvement
Manufacturing Cost after Improvement
With Additional Resources:[page 42]
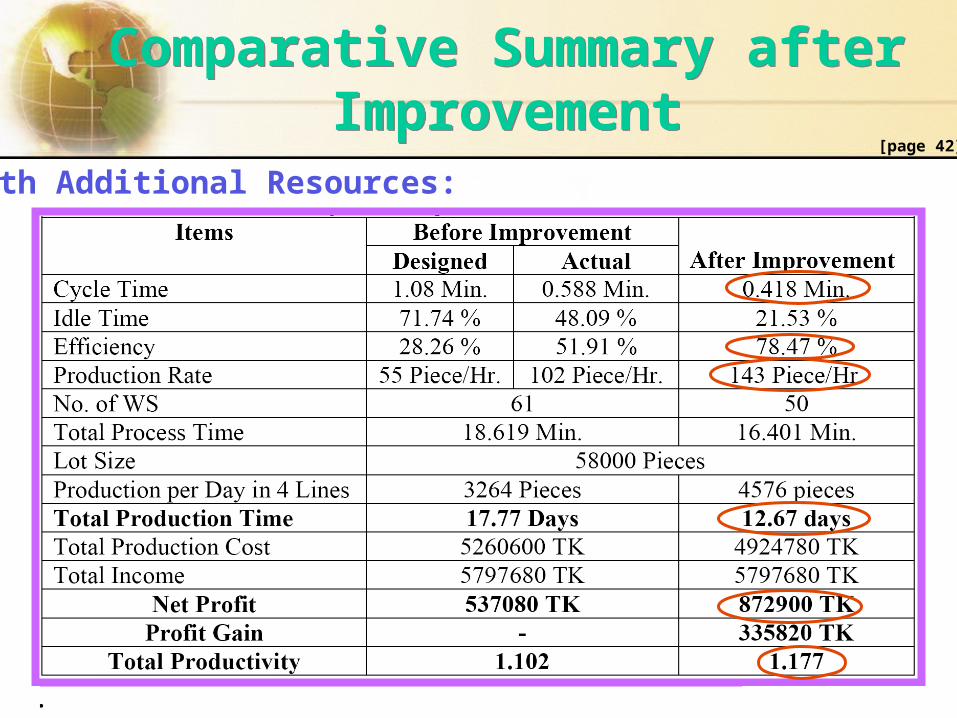
11.23 © 2006 by Prentice Hall
Comparative Summary after Improvement
Comparative Summary after Improvement
With Additional Resources:[page 42]
11.24 © 2006 by Prentice Hall
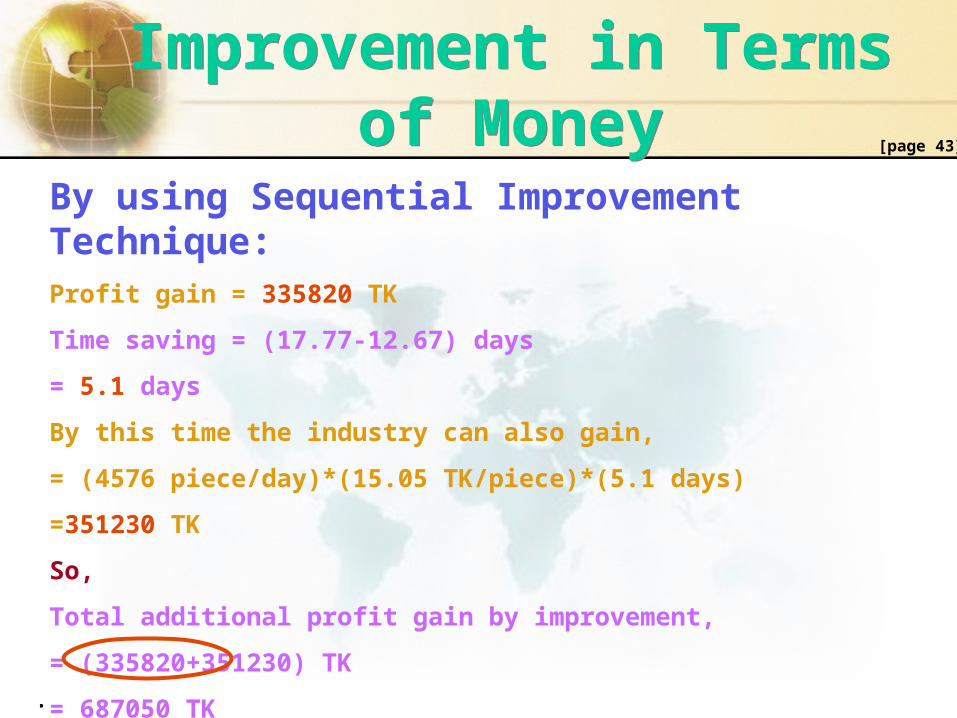
Improvement in Terms of Money
Improvement in Terms of Money
By using Sequential Improvement Technique:Profit gain = 335820 TK
Time saving = (17.77-12.67) days
= 5.1 days
By this time the industry can also gain,
= (4576 piece/day)*(15.05 TK/piece)*(5.1 days)
=351230 TK
So,
Total additional profit gain by improvement,
= (335820+351230) TK
= 687050 TK
[page 43]
11.25 © 2006 by Prentice Hall
Achievement of Objectives
Achievement of Objectives
11.26 © 2006 by Prentice Hall
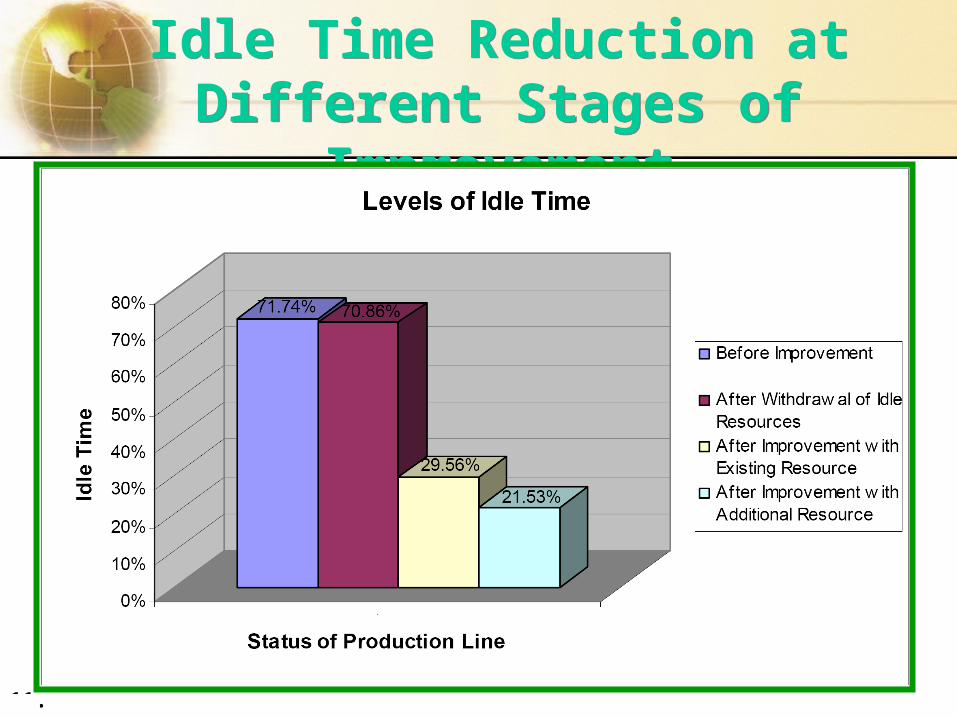
Idle Time Reduction at Different Stages of
Improvement
Idle Time Reduction at Different Stages of
Improvement
11.27 © 2006 by Prentice Hall
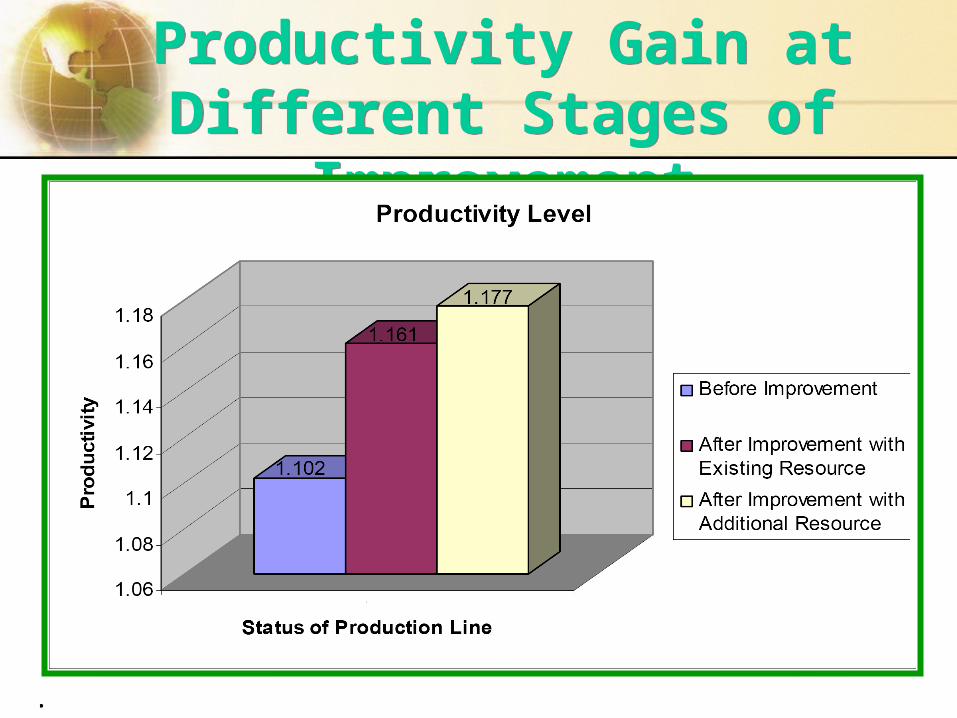
Productivity Gain at Different Stages of
Improvement
Productivity Gain at Different Stages of
Improvement
11.28 © 2006 by Prentice Hall
Analytical Results Considering Different
Allowance
Analytical Results Considering Different
Allowance

11.29 © 2006 by Prentice Hall
Productivity Gain for Different Allowance Productivity Gain for Different Allowance

11.30 © 2006 by Prentice Hall
Efficiency Gain for Different Allowance
Efficiency Gain for Different Allowance

11.31 © 2006 by Prentice Hall
Errors/Mistakes in Our Report
Errors/Mistakes in Our Report

11.32 © 2006 by Prentice Hall
Major MistakesMajor MistakesIn page 1: A world dominating business sector can fall down suddenly. (organization)
In page 4: Average observed valve. (value)
In page 15: After Introduction we have used STEP: ONE. (before STEP: ONE will be 4.2 Six-Step Assembly Line Balancing & after STEP: ONE will be 4.2.1 Time Study)
In page 25 & 28: The given control charts are wrong.
In page 34: We have used 39.3 % allowance. (20 %).
In page 37: Typing mistake for value of SSV & SMV.

11.33 © 2006 by Prentice Hall
Limitations of this Thesis
Limitations of this Thesis

11.34 © 2006 by Prentice Hall
Limitations Limitations
Assumption about the current method.
Omission of performance rating.
Omission of cross study for different product.
Lack of our experience.

11.35 © 2006 by Prentice Hall
Thank YouThank You

11.36 © 2006 by Prentice Hall
Questions ???Questions ???