111 ready to succeed update an exploration of secondary and post-secondary educational outcomes for...
TRANSCRIPT

111
Ready to Succeed Update
An exploration of secondary and post-secondary educational
outcomes for foster children in California
K. Frerer, L. Sosenko, & N. PellegrinDec.10, 2009
The Ready to Succeed Project is supported by the Stuart Foundation
222
Ready to Succeed: Overview of Presentation
•Secure database linking process
•Initial match statistics • Segment: K-12, Community College, & University• County• Age at entry
•Comparison group• Propensity score matching
•Analysis plan
•Revised time line
333
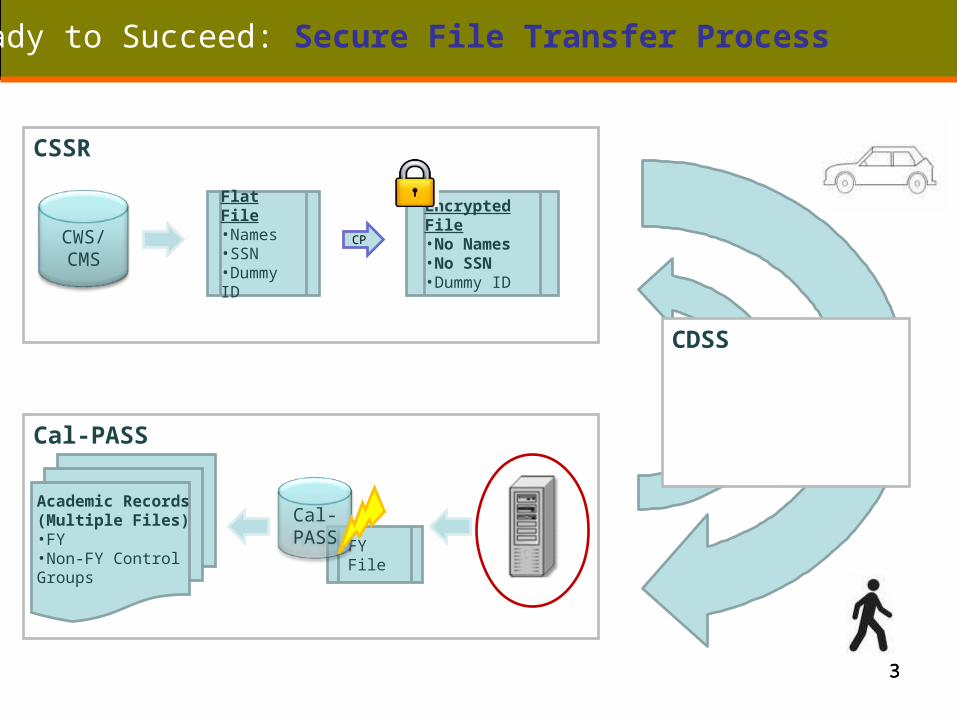
Ready to Succeed: Secure File Transfer Process
CSSR
CWS/CMS
Flat File•Names•SSN•Dummy ID
CP
Encrypted File•No Names•No SSN•Dummy ID
Cal-PASS
FY File
Cal-PASS
Academic Records (Multiple Files)
•FY•Non-FY Control Groups
CDSS
4
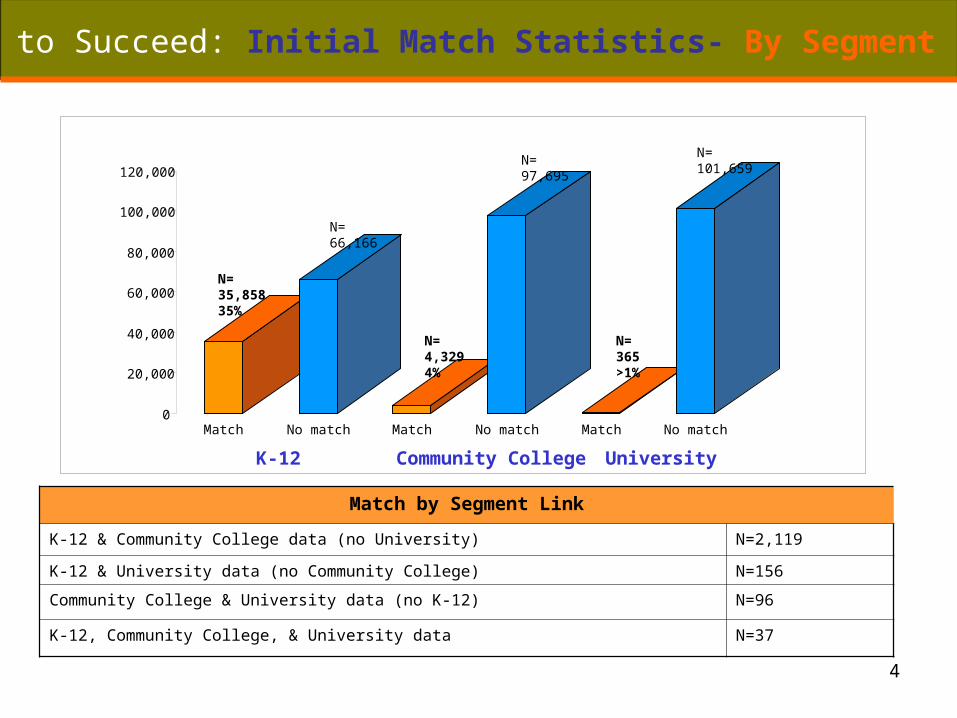
Ready to Succeed: Initial Match Statistics- By Segment
0
20,000
40,000
60,000
80,000
100,000
120,000
Match No match Match No match Match No match
K-12 Community College University
N= 101,659
N= 365>1%
N= 97,695
N= 4,3294%
N= 66,166
N= 35,85835%
Match by Segment Link
K-12 & Community College data (no University) N=2,119
K-12 & University data (no Community College) N=156
Community College & University data (no K-12) N=96
K-12, Community College, & University data N=37
5
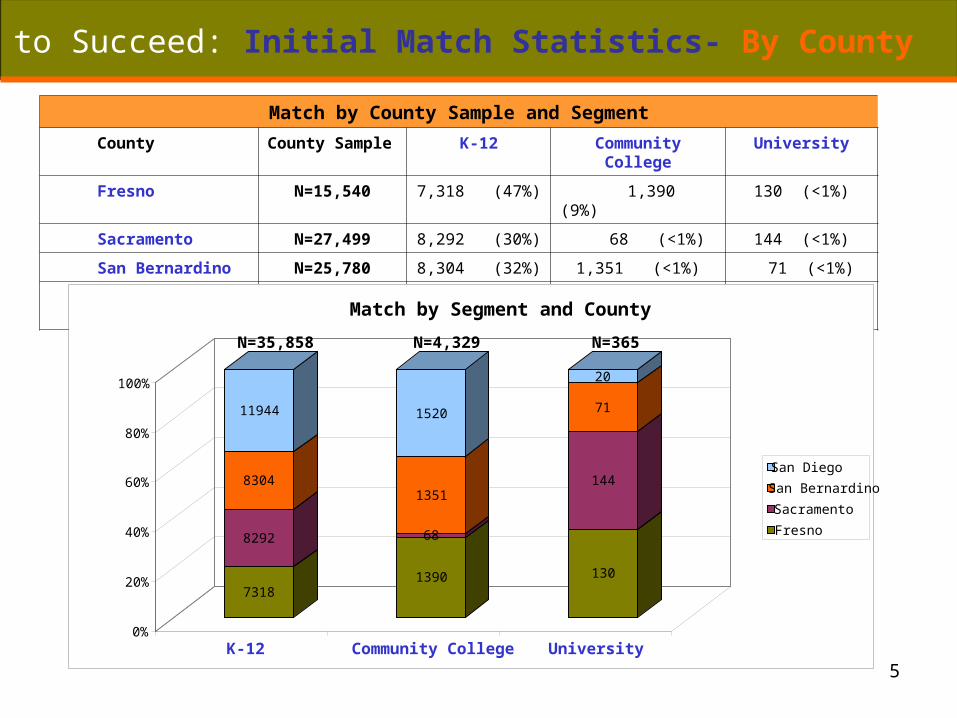
Ready to Succeed: Initial Match Statistics- By County
Match by County Sample and Segment
County County Sample K-12 Community College University
Fresno N=15,540 7,318 (47%) 1,390 (9%) 130 (<1%)
Sacramento N=27,499 8,292 (30%) 68 (<1%) 144 (<1%)
San Bernardino N=25,780 8,304 (32%) 1,351 (<1%) 71 (<1%)
San Diego N=33,205 11,944 (36%) 1,520 (<1%) 20 (<1%)
7318
8292
8304
11944
1390
68
1351
1520
130
144
71
20
0%
20%
40%
60%
80%
100%
K-12 Community College University
Match by Segment and County
San Diego
San Bernardino
Sacramento
Fresno
N=35,858 N=4,329 N=365
6
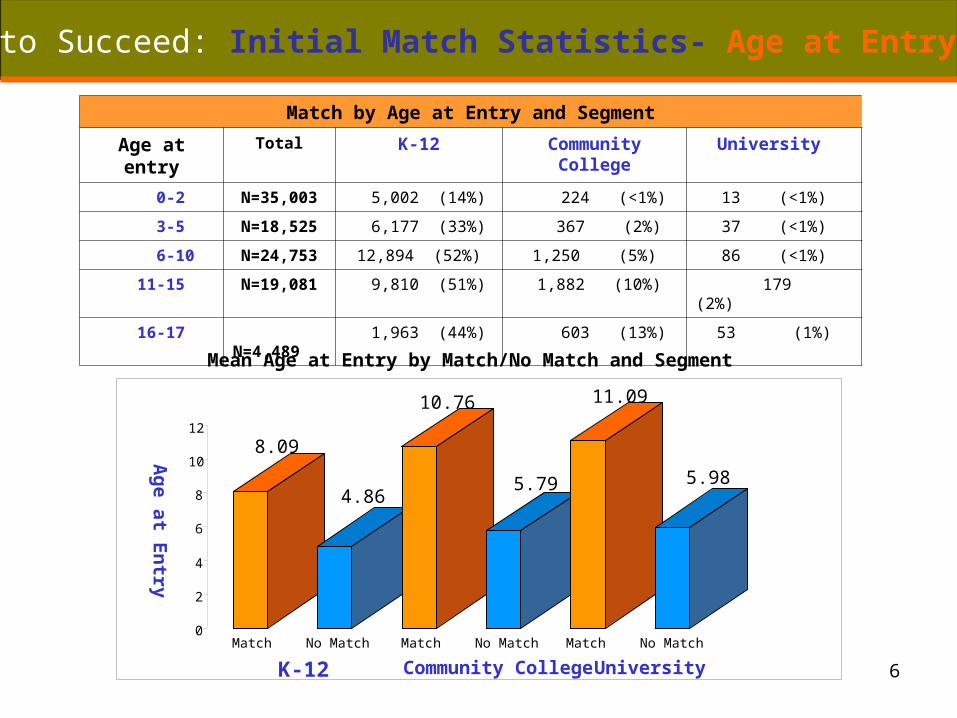
Ready to Succeed: Initial Match Statistics- Age at Entry
Match by Age at Entry and Segment
Age at entry Total K-12 Community College University
0-2 N=35,003 5,002 (14%) 224 (<1%) 13 (<1%)
3-5 N=18,525 6,177 (33%) 367 (2%) 37 (<1%)
6-10 N=24,753 12,894 (52%) 1,250 (5%) 86 (<1%)
11-15 N=19,081 9,810 (51%) 1,882 (10%) 179 (2%)
16-17 N=4,489 1,963 (44%) 603 (13%) 53 (1%)
0
2
4
6
8
10
12
Match No Match Match No Match Match No Match
K-12 Community College University
8.09
4.86
10.76
5.79
11.09
5.98
Ag
e at En
try
Mean Age at Entry by Match/No Match and Segment

777
Ready to Succeed: Propensity Score Matching
FY Students
Non-FYStudents
Matching methods, such as propensity score matching (PSM) and full exact matching, reduces bias in the comparison group by achieving balance on observed covariates.
For each foster youth a set of non-foster youth is selected with the same relevant characteristics.
888
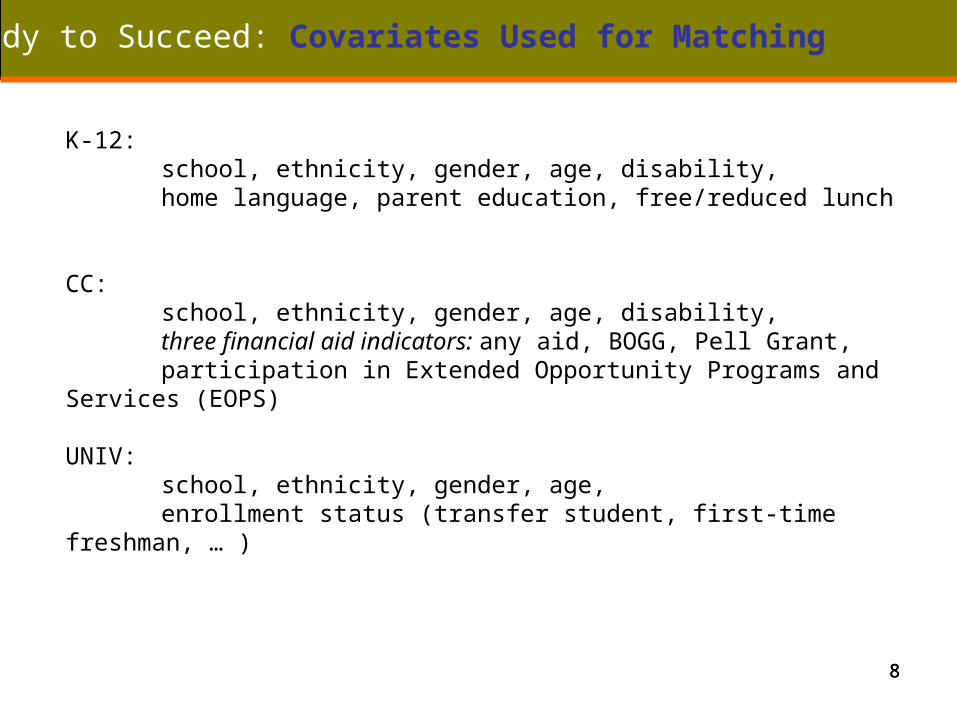
Ready to Succeed: Covariates Used for Matching
K-12:school, ethnicity, gender, age, disability, home language, parent education, free/reduced lunch
CC: school, ethnicity, gender, age, disability, three financial aid indicators: any aid, BOGG, Pell Grant,participation in Extended Opportunity Programs and Services (EOPS)
UNIV:school, ethnicity, gender, age, enrollment status (transfer student, first-time freshman, … )
999
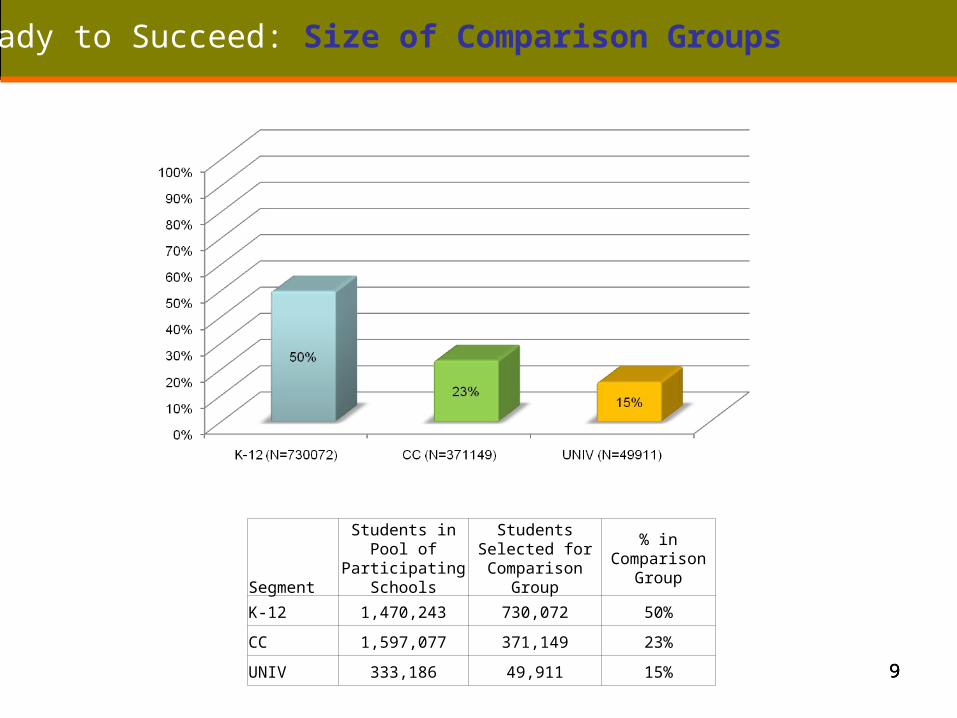
Ready to Succeed: Size of Comparison Groups
Segment
Students in Pool of Participating
Schools
Students Selected for Comparison
Group
% in Comparison Group
K-12 1,470,243 730,072 50%
CC 1,597,077 371,149 23%
UNIV 333,186 49,911 15%
10
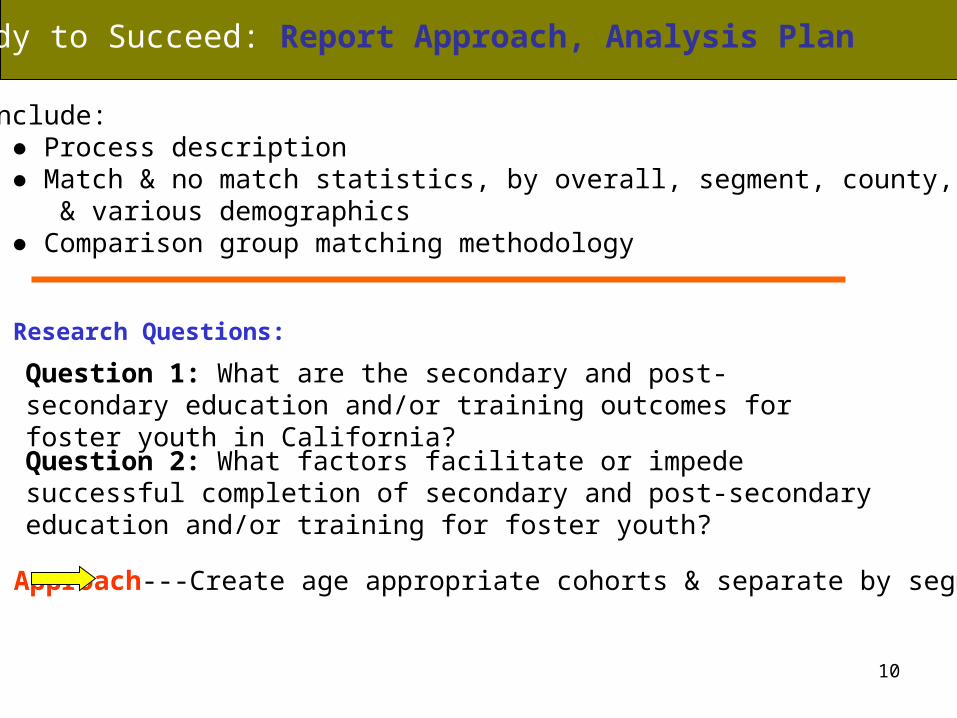
Ready to Succeed: Report Approach, Analysis Plan
Will include: ● Process description ● Match & no match statistics, by overall, segment, county, & various demographics ● Comparison group matching methodology
Question 1: What are the secondary and post-secondary education and/or training outcomes for foster youth in California?
Research Questions:
Question 2: What factors facilitate or impede successful completion of secondary and post-secondary education and/or training for foster youth?
Approach---Create age appropriate cohorts & separate by segment
11
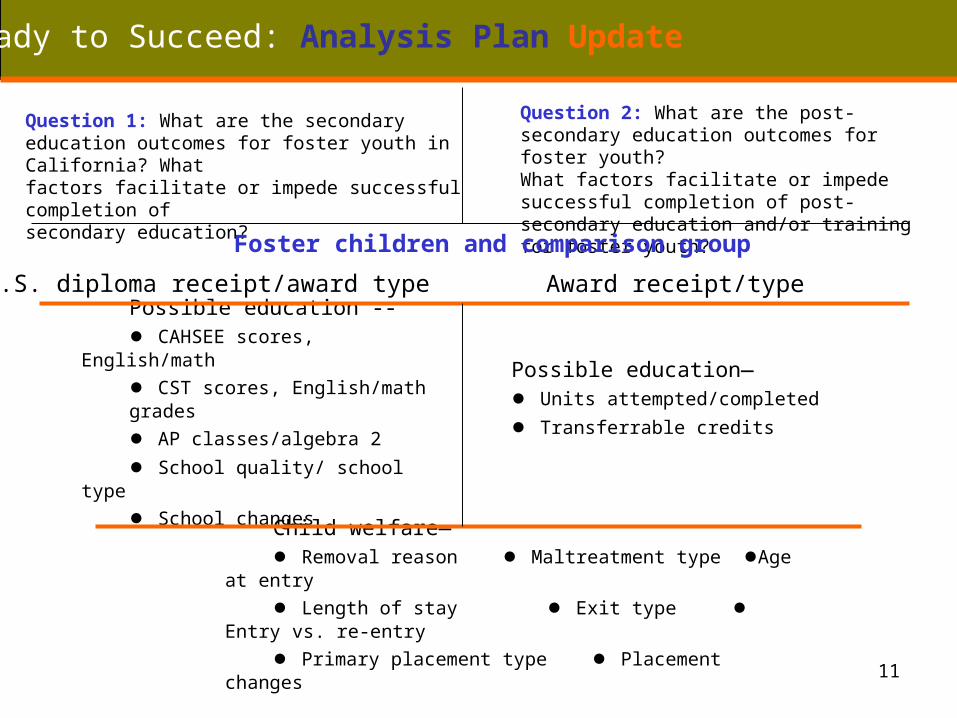
Ready to Succeed: Analysis Plan Update
Question 1: What are the secondary education outcomes for foster youth in California? What factors facilitate or impede successful completion of secondary education?
Question 2: What are the post-secondary education outcomes for foster youth? What factors facilitate or impede successful completion of post-secondary education and/or training for foster youth?
Foster children and comparison group
H.S. diploma receipt/award type
Possible education --● CAHSEE scores, English/math
● CST scores, English/math grades
● AP classes/algebra 2
● School quality/ school type
● School changes
Child welfare—● Removal reason ● Maltreatment type ●Age at entry
● Length of stay ● Exit type ● Entry vs. re-entry
● Primary placement type ● Placement changes
Award receipt/type
Possible education—● Units attempted/completed
● Transferrable credits

1212
Ready to Succeed: Timeline Update
12
12/17 Final education data received by CSSR.
1/6 Final combined education and social service dataset complete.
2/11 Meeting to review initial analyses to refine follow-up analyses and draft report outline.
3/5 Follow-up analyses and write-ups due.
3/19 Report 1st draft to internal reviewers.
4/16 Reviewers comments due on report 1st draft.
5/11 Send 2nd draft of final report to CDSS and Stuart.
5/25 Reviewers comments due on 2nd draft of report.
6/15 Final report complete.