111109 interim management statement
TRANSCRIPT

8/3/2019 111109 Interim Management Statement
http://slidepdf.com/reader/full/111109-interim-management-statement 1/30
1
9 November 2011
HSBC Holdings plc – Interim Management Statement
HSBC Holdings plc (‘HSBC’) will be conducting a trading update conference call with
analysts and investors today to coincide with the release of its Interim Management
Statement. The trading update call will take place at 11.00am GMT, and details of how to
participate in the call and the live audio webcast can be found below and at Investor
Relations on www.hsbc.com.
8/3/2019 111109 Interim Management Statement
http://slidepdf.com/reader/full/111109-interim-management-statement 2/30
2
Conference call details
The conference call will be hosted by Stuart Gulliver, Group Chief Executive and Iain Mackay, Group Finance
Director, and will be accessible by dialling the following local telephone numbers:
UK: +44 (0) 20 7136 2056
UK toll free: 0800 279 4841
USA: +1 646 254 3362
USA toll free: 1 877 249 9037
Hong Kong: +852 3002 1616
Hong Kong toll free: 800 964 186
Restrictions may exist when accessing freephone/toll free numbers using a mobile telephone.
Pass code: HSBC
A recording of the conference call will be available from the close of business on 9 November 2011 until the close of
business on 9 December 2011.
Local replay access telephone numbers are:
UK (local): +44 (0) 20 7111 1244
UK toll free: 0800 358 7735
USA (local): +1 347 366 9565
USA toll free: 1 866 932 5017
Hong Kong (local): +852 3011 4669
Replay access pass code: 2405355#
Webcast details
The live audio webcast will be accessible on HSBC’s website by following this link:
http://www.hsbc.com/1/2/investor-relations/financial-info
The replay will be available via the same link from the close of business on 9 November 2011.
For further information, please contact:
Investor Relations Media Relations
Alastair Brown Robert Bailhache
+44 (0) 20 7992 1938 +44 (0) 20 7992 5712
Robert Quinlan Patrick Humphris
+44 (0) 20 7991 3643 +44 (0) 20 7992 1631
Hugh Pye Gareth Hewett
+852 2822 4908 +852 9101 2147
Note to editors: HSBC Holdings plc
HSBC Holdings plc, the parent company of the HSBC Group, is headquartered in London. The Group servescustomers worldwide from around 7,500 offices in over 80 countries and territories in Europe, the Asia-Pacific
region, North and Latin America, and the Middle East and North Africa. With assets of US$2,716bn at 30 September
2011, HSBC is one of the world’s largest banking and financial services organisations.
8/3/2019 111109 Interim Management Statement
http://slidepdf.com/reader/full/111109-interim-management-statement 3/30
3
HSBC INTERIM MANAGEMENT STATEMENT
Highlights for the nine months ended 30 September 2011
Reported profit before tax (‘PBT’) for the third quarter of 2011 (‘3Q11’) was US$7.2bn,
up US$3.6bn on 3Q10, and for the nine months ended 30 September 2011 (‘the nine
months’) was US$18.6bn, up US$4.0bn on the same period in 2010. These results
included US$4.1bn of favourable movements in credit spread on the fair value of our
own debt recognised in the quarter and US$4.0bn for the nine months.
Underlying PBT for 3Q11 was US$3.0bn, down US$1.6bn on 3Q10 due to decreased
revenues in Global Banking and Markets, an adverse movement in non-qualifying hedges
of US$0.7bn (US$1.3bn recorded in the quarter and US$0.6bn in 3Q10), and an increase
in loan impairment charges, primarily in North America, partially offset by increased
revenues in Commercial Banking globally.
Underlying PBT for the nine months was US$14.4bn, down US$0.3bn on 2010,
reflecting the decreased revenues in Global Banking and Markets and higher costs offset
by significantly lower loan impairment charges, principally in North America, and
growth in Commercial Banking revenues.
Annualised return on average ordinary shareholders’ equity for the nine months was
12.6%, benefiting from the gains on movements in credit spread on the fair value of our
own debt.
Material progress has been made in implementing the strategy announced in May.
Fourteen transactions have been announced so far this year, with 11 since 30 June 2011.
Year to date, we have made good progress in expanding our Commercial Banking
business across both developed and faster-growing markets and repositioning Retail
Banking and Wealth Management.
The reported cost efficiency ratio for the nine months worsened to 54.6% from 54.0% in
2010, and to 59.1% from 54.4% on an underlying basis. Operating expenses and full-time
equivalent staff numbers (‘FTEs’) for 3Q11 were down on the preceding quarter, with
FTEs down 5,000 since 1Q11.
The core tier 1 capital ratio was 10.6% at 30 September 2011.
8/3/2019 111109 Interim Management Statement
http://slidepdf.com/reader/full/111109-interim-management-statement 4/30
4
Group Chief Executive, Stuart Gulliver, commented:
“The sector faces significant headwinds. The continuing macroeconomic, regulatory and
political uncertainty, particularly in Europe, adversely affected our industry’s performance in
the quarter. As a result, our underlying PBT declined by US$1.6bn compared with 3Q10 due
to lower revenues in Global Banking and Markets, an adverse movement in non-qualifying
hedges and an increase in loan impairment charges, primarily in North America, partially
offset by increased revenues in Commercial Banking. Reported PBT was up US$3.6bn
compared with 3Q10. Against this backdrop, HSBC remains resilient, with a strong balance
sheet and robust liquidity.
“We have remained focused on implementing the strategy outlined in May, and have
increased the pace and intensity of delivery. We have announced 14 transactions this year,
including 11 since 30 June 2011, we have begun to turn the corner on costs, with operating
expenses and FTEs falling compared with the previous quarter, and we continue to invest for
growth in faster-growing markets.
“We have made progress in executing our strategy and, despite challenging market
conditions, our businesses in Rest of Asia-Pacific and Latin America, notably Brazil,
Commercial Banking in most markets and our retail banking operations in the UK have
performed well. Notwithstanding the very difficult market conditions, a number of Global
Banking and Markets businesses, notably Foreign Exchange, Equities and Payments and
Cash Management, have made good progress in line with our investment focus.”
8/3/2019 111109 Interim Management Statement
http://slidepdf.com/reader/full/111109-interim-management-statement 5/30
5
Execution of strategy
Our strategy is designed to deliver our ambition to become the world’s leading international
bank. We are implementing it by building on our distinctive presence in the network of
markets which generate the major trade and capital flows, capturing wealth creation where
relevant and focusing on retail banking only where we can achieve profitable scale.
We have made progress in executing our strategy.
Firstly, we continue to reshape our business portfolios to improve capital deployment
based on our five filters, and maintain our expansion in faster-growing markets. Since
30 June 2011, we have announced transactions for the disposal of our US Cards business,
195 non-strategic branches principally in upstate New York, the Canadian investment
advisory business, the Chilean retail banking business, the UK motor insurance business,
private equity businesses in the US and Canada and our Hungarian consumer finance
portfolio. We have also announced the reshaping of a number of our retail businesses in
the Middle East and the exit from operations in Georgia and from retail banking
operations in Poland.
Secondly, we have taken steps towards our target of delivering US$2.5-3.5bn of
sustainable cost savings by the end of 2013. Our programmes to review head offices and
global functions are progressing well. Since 1Q11, FTEs have decreased by 5,000. We
have identified a significant pipeline of sustainable savings and remain confident that we
can hit our target range.
Thirdly, we continue to position the business for growth, building on our connectivity
and our capabilities in faster-growing markets, wealth management and global trade.
During the quarter we increased revenues in Asia and Latin America on 3Q10 as a result
of strong asset growth in late 2010 and the first half of 2011, notably in Commercial
Banking and Global Banking and Markets, reflecting our focus on investing in regions
with higher returns.
8/3/2019 111109 Interim Management Statement
http://slidepdf.com/reader/full/111109-interim-management-statement 6/30
6
Key performance indicatorsNine months ended
30 September
Quarter ended
30 September
2011 2010 2011 2010
Target/
benchmark
% % % %
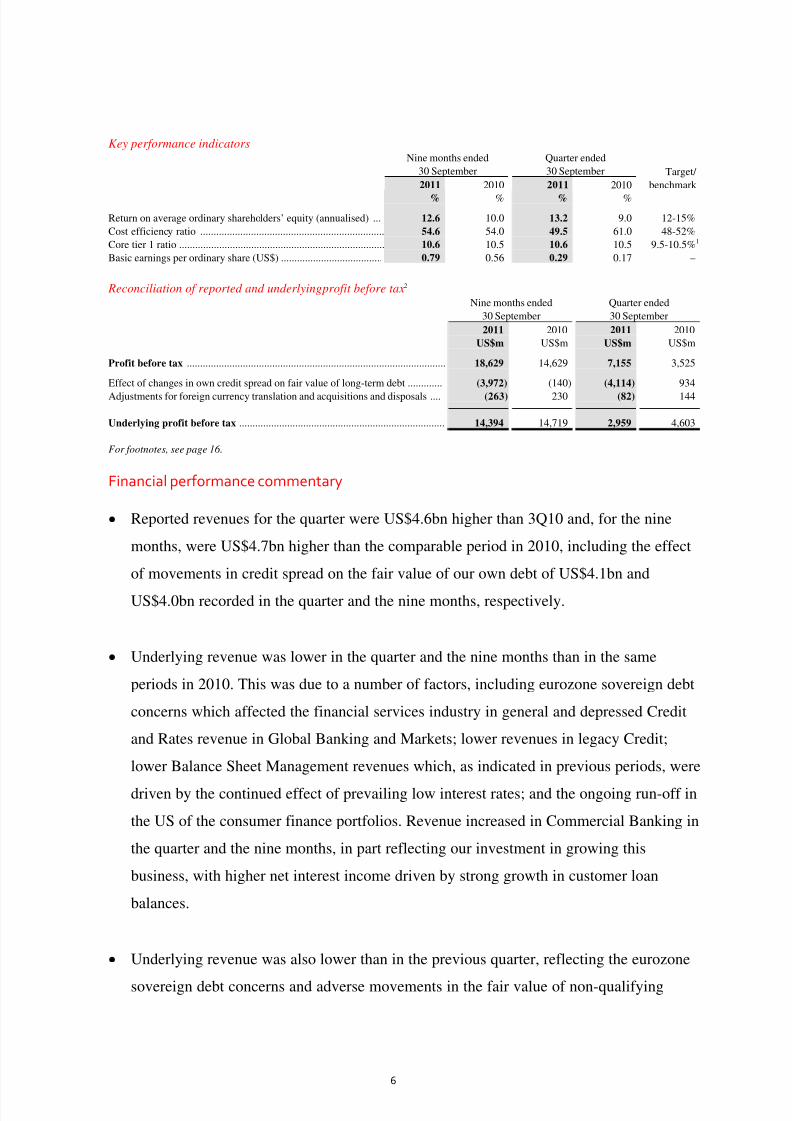
Return on average ordinary shareholders’ equity (annualised) ... 12.6 10.0 13.2 9.0 12-15%
Cost efficiency ratio ..................................................................... 54.6 54.0 49.5 61.0 48-52%
Core tier 1 ratio ............................................................................. 10.6 10.5 10.6 10.5 9.5-10.5%1
Basic earnings per ordinary share (US$) ...................................... 0.79 0.56 0.29 0.17 –
Reconciliation of reported and underlying profit before tax2 Nine months ended
30 September
Quarter ended
30 September
2011 2010 2011 2010
US$m US$m US$m US$m
Profit before tax ................................................................................................. 18,629 14,629 7,155 3,525
Effect of changes in own credit spread on fair value of long-term debt ............. (3,972) (140) (4,114) 934
Adjustments for foreign currency translation and acquisitions and disposals .... (263) 230 (82) 144
Underlying profit before tax ............................................................................. 14,394 14,719 2,959 4,603
For footnotes, see page 16.
Financial performance commentary
Reported revenues for the quarter were US$4.6bn higher than 3Q10 and, for the nine
months, were US$4.7bn higher than the comparable period in 2010, including the effect
of movements in credit spread on the fair value of our own debt of US$4.1bn and
US$4.0bn recorded in the quarter and the nine months, respectively.
Underlying revenue was lower in the quarter and the nine months than in the same
periods in 2010. This was due to a number of factors, including eurozone sovereign debt
concerns which affected the financial services industry in general and depressed Credit
and Rates revenue in Global Banking and Markets; lower revenues in legacy Credit;
lower Balance Sheet Management revenues which, as indicated in previous periods, were
driven by the continued effect of prevailing low interest rates; and the ongoing run-off in
the US of the consumer finance portfolios. Revenue increased in Commercial Banking in
the quarter and the nine months, in part reflecting our investment in growing this
business, with higher net interest income driven by strong growth in customer loan
balances.
Underlying revenue was also lower than in the previous quarter, reflecting the eurozone
sovereign debt concerns and adverse movements in the fair value of non-qualifying
8/3/2019 111109 Interim Management Statement
http://slidepdf.com/reader/full/111109-interim-management-statement 7/30
7
hedges, with an unfavourable movement of US$1.3bn in 3Q11 compared with US$0.3bn
in 2Q11 reflecting the decrease in long-term US interest rates.
Following the announcement of agreements for the sale of the 195 non-strategic US
branches and our Cards and Retail Services business, we reclassified the related loans
and advances and customer account balances to held for sale. As a result of the
reclassification, exchange differences of US$36bn and a reduction in reverse repo
balances, loans and advances to customers fell in the quarter. Excluding these items,
loans and advances to customers increased, reflecting growth in term lending and
residential mortgage balances in Europe, Asia and Latin America, although at a slower
pace in Asia in the quarter.
Customer account balances fell by US$47.9bn during 3Q11, including US$44bn of
exchange differences, the reclassification of deposits associated with the US branches’
sale to liabilities held for sale and a reduction in repo balances. Excluding these items,
deposits from customers rose, notably in our Commercial Banking and Global Banking
and Markets businesses. On the same basis, the growth in deposits continued to exceedthe growth in lending in the quarter and, as a result of the reclassification of assets and
liabilities as held for sale, the Group’s advances-to-deposits ratio fell to 75.9% from
78.7%.
Other significant balance sheet movements included a rise in the fair value of derivative
assets, notably interest rate contracts, as a result of downward shifts in major yield
curves, though this was partly offset by higher netting from transactions undertakenthrough clearing houses. There was a corresponding increase in the value of derivative
liabilities and our net exposure to credit risk on derivative contracts remained broadly
unchanged from 2Q11.
Loan impairment charges and other credit risk provisions were US$0.7bn higher at
30 September 2011 than a year ago. The increase came mainly in our run-off portfolio in
North America, reflecting an increase in delinquency rates, deteriorating roll-rates and
increased severity, and higher costs to obtain and realise collateral as a result of the
delays in foreclosure activity. Compared with 2Q11, loan impairment charges and other
8/3/2019 111109 Interim Management Statement
http://slidepdf.com/reader/full/111109-interim-management-statement 8/30
8
credit risk provisions rose by US$1.0bn, mainly in North America, with an increase in
loan impairment charges elsewhere reflecting slightly weaker economic conditions.
Despite the marked rise in loan impairment charges in 3Q11, for the nine months they
declined reflecting lower lending balances in our consumer finance portfolio in North
America and improvements in delinquency trends and collections in the UK.
Our reported cost efficiency ratio for the quarter reduced from 61.0% in 3Q10 to 49.5%
in 3Q11, largely reflecting the changes in the fair value of our own debt. Our underlying
cost efficiency ratio for the quarter was 62.7%, worse than in the preceding quarter
because revenues declined. Our cost efficiency ratio for the nine months increased from
54.4% to 59.1% on an underlying basis.
Notwithstanding the deterioration in the cost efficiency ratio in 3Q11, we began to see
the benefits of our strategic programmes to deliver sustainable savings as, despite
restructuring costs of US$0.2bn in the quarter, reported costs and FTEs were lower than
in 2Q11, with FTEs down 5,000 since 1Q11. Operating expenses for the nine months
increased by US$2.9bn compared with the same period in 2010, but this included severalnotable items including customer redress programmes, restructuring costs and litigation
costs, which were partially offset by a credit in relation to defined benefit pension
obligations in the UK. Excluding these items, the primary driver of the increase in
expenses on 2010 was higher staff costs, which were driven by wage inflation in our
faster-growing markets and strategic investment.
Although the reported PBT was higher in 2011, the tax charge for the nine months wasUS$0.6bn lower than the comparable period in 2010. The tax charge in 2011 included the
benefit of deferred tax now eligible to be recognised in respect of foreign tax credits,
while the tax charge in 2010 included US$1.2bn attributable to a gain arising from an
internal reorganisation of our North American operations.
Profit attributable to ordinary shareholders for the nine months was US$14.0bn,
US$4.4bn higher than in the same period in 2010, reflecting the increase in reported PBT
and the lower tax charge noted above. As a result, the annualised return on average
ordinary shareholders equity was 12.6%.
8/3/2019 111109 Interim Management Statement
http://slidepdf.com/reader/full/111109-interim-management-statement 9/30
9
Risk-weighted assets (‘RWA’s) remained broadly unchanged with a decrease of US$9bn
in the quarter. Exchange differences reduced RWAs by around US$25bn, reflecting the
strengthening of the US dollar, primarily against the euro and a number of currencies in
faster-growing markets. This reduction was partly offset by an increase of about
US$16bn in RWAs from credit risk reflecting loan growth, mainly in our associates in
Asia.
We continued to generate capital from retained profits net of the effect of changes in
credit spread on the fair value of our long-term debt and net of dividends. However, as a
result of the strengthening of the US dollar, core tier 1 capital reduced by US$4.5bn.
Consequently, the core tier 1 ratio at 30 September 2011 was 10.6% compared with
10.8% at 30 June 2011.
On 7 November 2011, the Board announced a third interim dividend for 2011 of
US$0.09 per ordinary share.
Global Businesses
commentary
In Retail Banking and Wealth Management, PBT for the quarter was lower than in 3Q10,
mainly due to the increase in loan impairment charges associated with our run-off consumer
finance portfolio in North America and the impact of adverse fair value movements on non-
qualifying hedges recognised in the quarter of US$0.9bn (3Q10: US$0.4bn), which reflected
a decline in long-term US interest rates. These factors were partially offset by net interest
income growth in Latin America and Rest of Asia-Pacific. Underlying operating expenses
were broadly unchanged on 3Q10.
Our PBT for the nine months was ahead of the comparable period in 2010 due to decreases
in loan impairment charges in North America and Europe which reflected the reduction in
US consumer finance portfolios and an improvement in credit quality and collections in the
UK. During 2011, we continued to rebalance revenue contribution with growth in our
priority markets offsetting declines in run-off portfolios in the US, and revenue from wealth
management products grew in the nine months, driven mainly by increases in Asia. Highercosts were a result of wage inflation, primarily in emerging markets, and customer redress
8/3/2019 111109 Interim Management Statement
http://slidepdf.com/reader/full/111109-interim-management-statement 10/30
10
programmes in the UK following the adverse judgement relating to the sale of payment
protection insurance (‘PPI’), partially offset by cost containment programmes.
Commercial Banking continued to perform well, with PBT in both 3Q11 and the nine
months ahead of the comparable periods in 2010. Strong growth in revenue was driven by
higher net interest income from customer loan growth, mainly in faster-growing markets and
in Europe. Despite the increasing headwinds in several economies, revenue continued to
grow in 3Q11, albeit at a slower pace. Loan impairment charges for the nine months rose
compared with 2010, primarily driven by the growth in lending, and increased in 3Q11
compared with the preceding quarter as the economic environment weakened. Costs for the
nine months also rose in support of business growth, but to a lesser extent than revenue,
resulting in positive jaws.
In Global Banking and Markets, our PBT in 3Q11 was significantly below 3Q10,
reflecting the challenging trading environment, widening credit spreads, continued
uncertainty around eurozone sovereign debt and a rise in loan impairment charges and other
credit risk provisions, particularly in Europe, primarily related to available-for-salesecurities. With regard to the available-for-sale asset-backed securities portfolio, estimates of
future potential impairments and expected cash losses remain consistent with guidance given
in the Interim Report 2011.
PBT for the nine months was similarly affected by the impact of economic uncertainty, with
higher loan impairment charges and other credit risk provisions reflecting a general widening
of credit spreads which, coupled with reduced client activity, adversely affected our Credit
and Rates businesses, particularly in Europe. Revenues from the legacy Credit portfolio also
fell due to lower price appreciation, decreased fees for management services provided to the
securities investment conduits, a reduction in effective yields and lower asset holdings.
Balance Sheet Management revenues were lower, driven, as indicated in previous periods,
by the continued effect of prevailing low interest rates.
By contrast, our strong franchises in Foreign Exchange drove a significant rise in revenues in
the business during the quarter, particularly in Asia and the Americas, capturing higher client
activity and achieving wider spreads as volatility increased. Equities revenues also rose as a
8/3/2019 111109 Interim Management Statement
http://slidepdf.com/reader/full/111109-interim-management-statement 11/30
11
result of improved competitive positioning which captured increased client flows, while
Securities Services income grew as a result of higher spreads and transaction volumes. In
Global Banking, continued new business origination in Project and Export Finance, and
growth in balances and spreads in Payments and Cash Management led to a strong
performance.
Our Global Private Banking profits before tax for 3Q11 and the nine months were lower
than in the comparable periods in 2010. In the nine months, revenue growth from higher
average client assets under management was driven by net new money inflows of
US$16.5bn, of which US$3.3bn was during the quarter, primarily from clients in faster-
growing markets, and a rise in transaction volumes. This was more than offset by an increase
in operating expenses denominated in Swiss francs, which strengthened during the period
against the US dollar, the hiring of additional front office staff to cover faster-growing
markets and costs relating to regulatory issues.
In ‘Other’, our reported PBT for both 3Q11 and the nine months increased significantly in
comparison with 2010 due to gains arising from the effect of changes in credit spread on thefair value of our long-term debt. These are not regarded internally as part of managed
performance and are therefore not allocated to global businesses. On an underlying basis, our
loss before tax increased in 3Q11 compared with 3Q10 due to adverse fair value movements
on non-qualifying hedges of US$0.4bn recognised within Europe in the quarter in HSBC
Holdings plc, reflecting a decrease in long-term US interest rates relative to sterling and euro
interest rates.
Regional commentary
In Europe, our reported PBT in 3Q11 was US$2.5bn greater than in 3Q10. On an underlying
basis, a small loss before tax in 3Q11 contrasted with a profit in 3Q10, reflecting the effect
of the challenging economic environment in the eurozone on Global Banking and Markets
and restructuring costs incurred in the quarter. The rise in loan impairment charges and other
credit risk provisions was largely due to higher available-for-sale impairment charges in the
quarter. We have continued to manage down our exposures to selected eurozone countries ina conservative manner with a particular concern for market stability, reducing our exposure
8/3/2019 111109 Interim Management Statement
http://slidepdf.com/reader/full/111109-interim-management-statement 12/30
12
to sovereign and agency debt by US$2.7bn in the quarter to US$5.5bn, as analysed on
page 21.
Our underlying PBT for the nine months was less than the comparable period in 2010,
mainly because of a lower contribution from Global Banking and Markets, driven by the
Credit and Rates businesses. Commercial Banking performed well, recording higher profits
due to increased net interest income as a result of higher lending in both the UK and
Continental Europe and lower loan impairment charges. We are on track to exceed our
targets for gross new lending under the Merlin Agreement in the UK, having extended
facilities of £36.6bn (US$57bn) at 30 September 2011. We are £38m (US$59m) or 0.4%
behind our SME lending target under Merlin. Net loans and advances to Commercial
Banking customers have increased by 6.5% in the UK since December 2010. Retail Banking
and Wealth Management also reported profit growth in Europe despite provisions relating to
customer redress programmes and restructuring costs, driven by lower loan impairment
charges as delinquency trends improved, particularly in the UK. We estimate that the cost of
the UK bank levy will be approximately US$0.6bn for the full year 2011. No charge for the
UK bank levy has been recognised in the nine months.
In Hong Kong, PBT for the quarter decreased by US$0.1bn compared with 3Q10 as
revenues generated from the higher customer lending balances were more than offset by the
effect of market valuation changes on insurance revenues. In addition, loan impairment
charges increased from a low base and costs rose, reflecting inflationary pressures and
investment in staff supporting business growth. Compared with 2Q11, costs fell as we
maintained our focus on improving operational efficiency.
Our PBT for the nine months increased by US$0.1bn, primarily due to strong balance sheet
growth, particularly in Commercial Banking and Global Banking and Markets, which
benefited from targeted asset and deposit growth and a rise in economic activity, and a
strong increase in fee income, notably from the sale of Wealth Management products. Loan
growth in 3Q11 moderated as continued growth in Retail Banking and Wealth Management
and Global Banking and Markets was offset by a reduction in Commercial Banking as
certain trade finance loans matured. Inflationary pressures and investment in staff caused
operating expenses to increase in the nine months.
8/3/2019 111109 Interim Management Statement
http://slidepdf.com/reader/full/111109-interim-management-statement 13/30
13
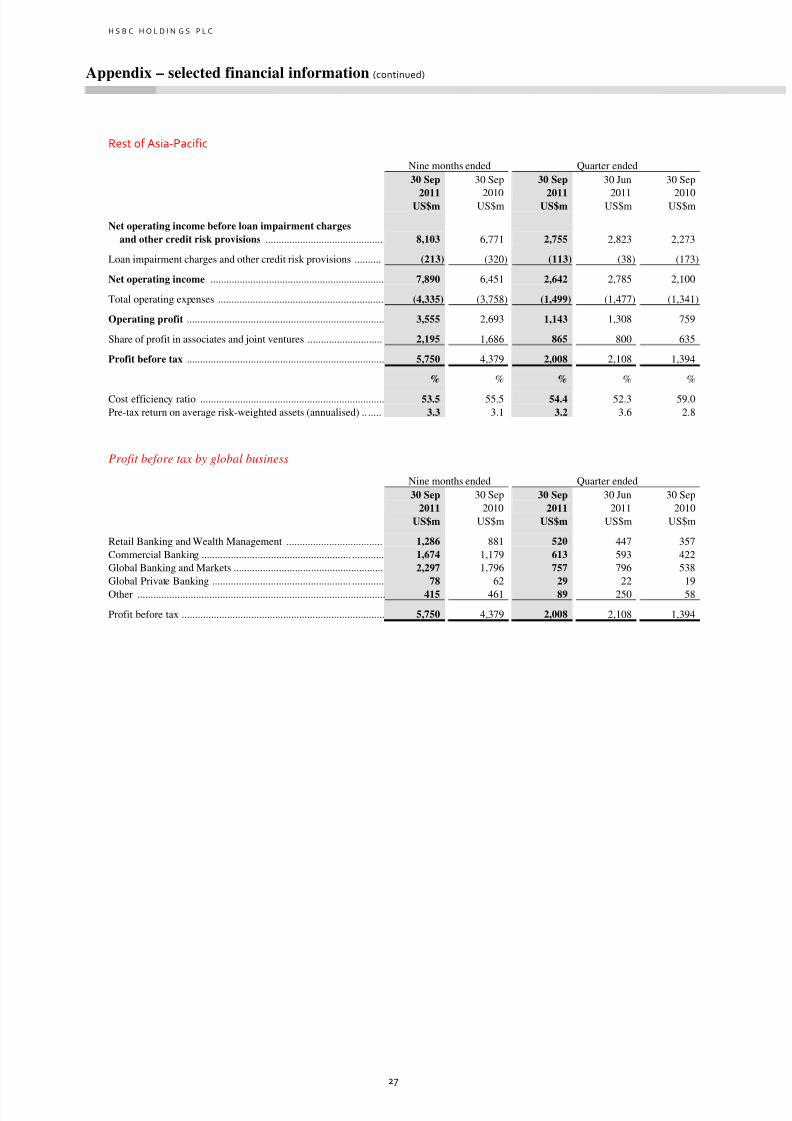
In Rest of Asia-Pacific, we delivered strong increases in PBT in both 3Q11 and the nine
months. A significant rise in net interest income in the nine months resulted from targeted
balance sheet growth and improved deposit spreads, especially in mainland China and India.
Loan growth was most significant in our Commercial Banking and Global Banking and
Markets businesses, largely in mainland China and Singapore. We experienced continued
underlying loan growth across the region in 3Q11, in particular in Singapore, mainland
China and India although, on a reported basis, this was masked by the depreciation of most
Asian currencies against the US dollar. For the nine months, fee income grew, reflecting
higher trade volumes, continued economic growth and strong demand for Wealth
Management products. Profitability also improved through lower loan impairment charges in
the region, mainly due to the reduction of unsecured lending portfolios in India and lower
loan impairment charges in Global Banking and Markets on a small number of individual
accounts. Economic growth and our ongoing business expansion in the region resulted in
increased headcount and related costs. Our associates continued to make a strong
contribution to our results.
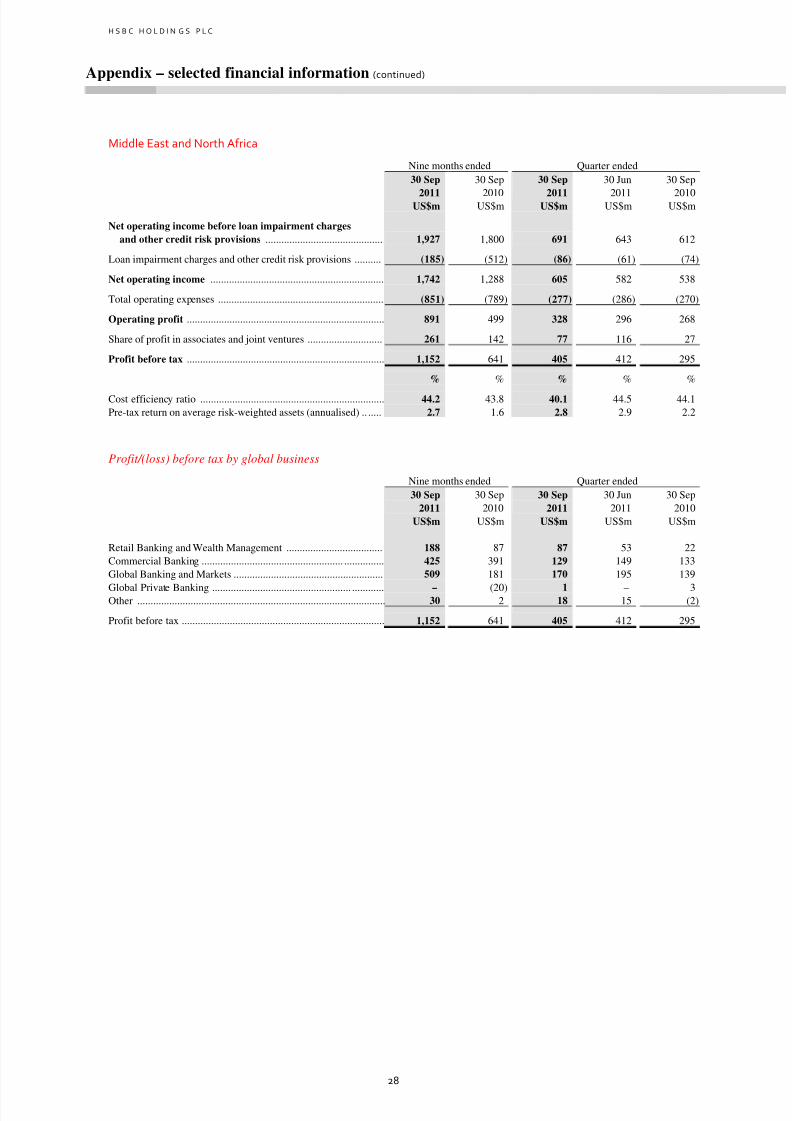
In Middle East and North Africa, PBT was ahead of 3Q10 due to revenue growth in allGlobal Businesses and strong profit growth from our associate, The Saudi British Bank. Our
PBT in the nine months was significantly ahead of the comparable period in 2010, as
specific loan impairment charges against a small number of Global Banking and Markets
customers in 2010 did not recur and the loan portfolio in Retail Banking and Wealth
Management was repositioned towards higher quality lending. Higher revenue in Rates in
Global Banking and Markets and a rise in trade volumes in Commercial Banking drove
strong income growth. Costs increased due to inflationary pressures on salaries, restructuring
provisions and increased marketing of the HSBC brand in the region.
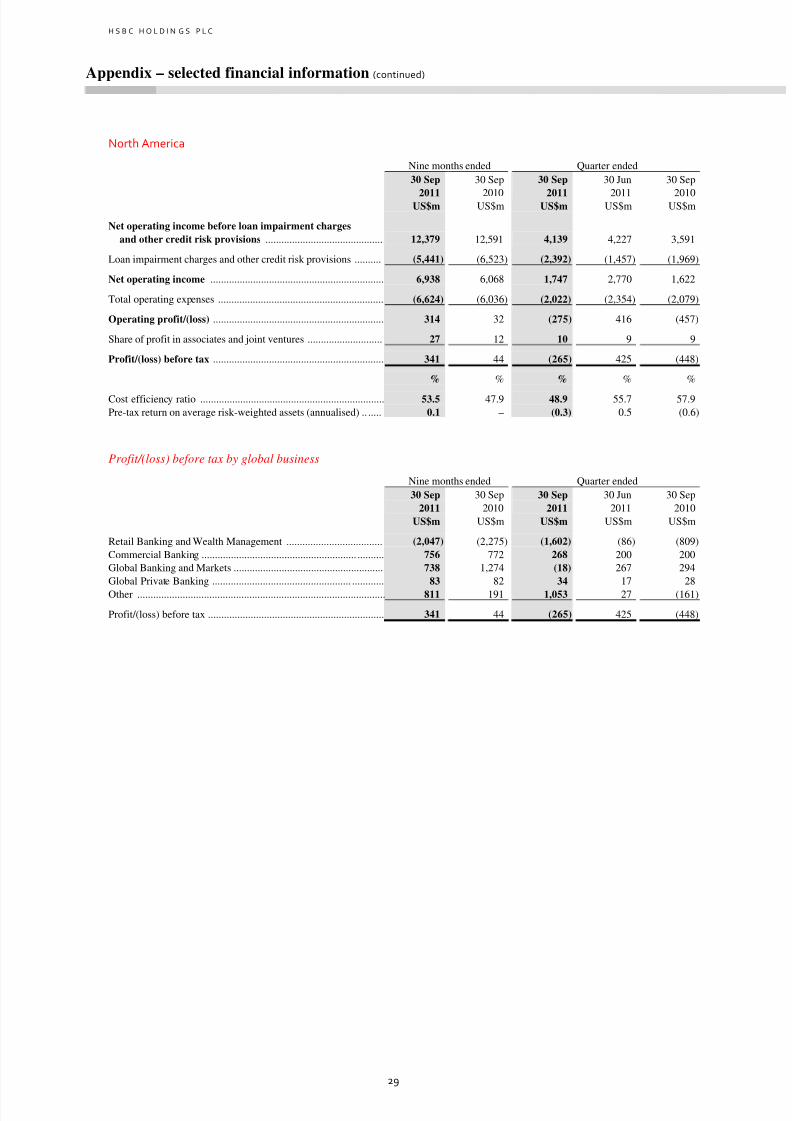
In North America, our reported pre-tax loss in 3Q11 decreased by US$0.2bn compared with
3Q10. On an underlying basis, it increased by US$1.0bn, mainly due to adverse movements
in the fair value of non-qualifying hedges in the consumer finance portfolio in Retail
Banking and Wealth Management of US$0.9bn recognised in the quarter and an increase in
loan impairment charges in our run-off portfolio. Total revenue was affected by lower
revenues from the legacy Credit portfolio in Global Banking and Markets.
8/3/2019 111109 Interim Management Statement
http://slidepdf.com/reader/full/111109-interim-management-statement 14/30
14
Our pre-tax loss for the nine months, on an underlying basis, was greater than in the
comparable period in 2010, primarily due to a decline in revenue as a result of the decreasing
balances within our consumer finance portfolio. Costs increased, largely due to higher
compliance costs, litigation costs, software impairment and the non-recurrence of a pension
curtailment gain in 2010, partly offset by a reduction in headcount. Despite the marked rise
in loan impairment charges in 3Q11, loan impairment charges in the nine months declined
by US$1.1bn compared with 2010, reflecting lower lending balances in our consumer
finance portfolio. There remains pressure on the future credit performance of the run-off
portfolio from continued weakness in the housing market and potential changes in customer
behaviour. The resumption of more normal levels of foreclosure activity following the recent
moratoria may lead to further house price weakness as increasing volumes of vacant
properties come onto the market.
We are making plans for completion of the disposal of our US Cards and Retail Services
business while remaining fully committed to providing all necessary support to HSBC
Finance Corporation to enable it to run-off its consumer lending and mortgage services
businesses in a controlled manner and meet all its commitments.
In Latin America, our profits before tax for 3Q11 and the nine months were well ahead of
comparable periods in 2010. Our strong performance on an underlying basis was driven by
higher lending volumes which supported revenue growth in Commercial Banking in Brazil
and Mexico, and in Retail Banking and Wealth Management in Brazil and, to a lesser extent,
Argentina. Growth in loan impairment charges was due to higher lending balances in the
region and increased delinquency in Brazil, partially offset by improved credit quality in
Mexico. Cost growth resulted from inflationary pressures, additional front office staff to
support business growth in Brazil and restructuring costs in the region, along with volume-
driven costs in Brazil as our business grew. However, compared with 2Q11 costs have
decreased reflecting, in part, strategic cost saving initiatives.
Trading conditions since 30 September 2011 and outlook
Trading conditions showed some improvement during October, but they remain verydifficult and continuing turbulence in global markets may result in further downside risk.

8/3/2019 111109 Interim Management Statement
http://slidepdf.com/reader/full/111109-interim-management-statement 15/30
15
The outlook for the global economy is very challenging as problems in developed markets
begin to affect growth rates around the world. Faster-growing markets clearly possess
significant potential for growth, however, and continue to offer attractive business
opportunities. With respect to mainland China, we believe that the economy will make a soft
landing and already we see inflationary pressures easing and growth buoyed by domestic
demand.
In these uncertain times we are reassured by the fact that our business, while remaining
diversified, is more cohesive and strategically focused for growth, with a strong balance
sheet and a high level of liquidity. We have made good progress against our strategic goals
on what will be a long journey. We remain committed to meeting our targets and are
responding to the more challenging environment with even more determination and a greater
focus on implementation. By the end of 2013, we will have reshaped HSBC.
8/3/2019 111109 Interim Management Statement
http://slidepdf.com/reader/full/111109-interim-management-statement 16/30
16
Notes
1. Assumed common equity tier 1 ratio under Basel III excluding G-SIBS.
2. We measure our performance internally on a like-for-like basis by eliminating the effects of exchange differences, acquisitions and
disposals of subsidiaries and businesses and the effect of changes in credit spread on the fair value of our long-term debt where thenet result of such movements will be zero upon maturity of the debt, all of which distort year-on-year comparisons. We refer to this as
our underlying performance.
Income statement comparisons, unless stated otherwise, relate to the nine months ended 30 September 2011 and
are compared with the corresponding nine months in 2010. Balance sheet comparisons, unless otherwise stated,
relate to balances at 30 September 2011 compared with the corresponding balances at 30 June 2011.
The financial information on which this Interim Management Statement is based, and the data set out in the
appendices to this Statement, are unaudited and have been prepared in accordance with HSBC’s accounting
policies as described in the Annual Report and Accounts 2010. A glossary of terms is also provided in the
Annual Report and Accounts 2010.
The Board has adopted a policy of paying quarterly interim dividends on the ordinary shares. Under this policy,
it is intended to have a pattern of three equal interim dividends with a variable fourth interim dividend.
Dividends are declared in US dollars and, at the election of the shareholder, paid in cash in one of, or in a
combination of, US dollars, sterling and Hong Kong dollars or, subject to the Board’s determination that a scrip
dividend is to be offered in respect of that dividend, may be satisfied in whole or in part by the issue of new
shares in lieu of a cash dividend.
Annual Report and Accounts 2011 announcement date ............................................................................................ 27 February 2012
Shares quoted ex-dividend in London, Hong Kong, Paris and Bermuda ................................................................. 14 March 2012
ADSs quoted ex-dividend in New York .............................................................. ...................................................... 14 March 2012
Dividend record date in Hong Kong .......................................................................................................................... 15 March 2012
Dividend record date in London, New York, Paris and Bermuda ............................................................................ 16 March 2012
Dividend payment date .............................................................................................................................................. 2 May 2012
8/3/2019 111109 Interim Management Statement
http://slidepdf.com/reader/full/111109-interim-management-statement 17/30
17
Cautionary statement regarding forward-looking statements
The Interim Management Statement contains certain forward-looking statements with respect to HSBC’s financial
condition, results of operations and business.
Statements that are not historical facts, including statements about HSBC’s beliefs and expectations, are forward-
looking statements. Words such as ‘expects’, ‘anticipates’, ‘intends’, ‘plans’, ‘believes’, ‘seeks’, ‘estimates’,
‘potential’ and ‘reasonably possible’, variations of these words and similar expressions are intended to identify
forward-looking statements. These statements are based on current plans, estimates and projections, and therefore
undue reliance should not be placed on them. Forward-looking statements speak only as of the date they are made,
and it should not be assumed that they have been revised or updated in the light of new information or future events.
Written and/or oral forward-looking statements may also be made in the periodic reports to the US Securities and
Exchange Commission, summary financial statements to shareholders, proxy statements, offering circulars and
prospectuses, press releases and other written materials, and in oral statements made by HSBC’s Directors, officers or
employees to third parties, including financial analysts.
Forward-looking statements involve inherent risks and uncertainties. Readers are cautioned that a number of factors
could cause actual results to differ, in some instances materially, from those anticipated or implied in any forward-
looking statement. These include, but are not limited to:
changes in general economic conditions in the markets in which we operate, such as continuing or deepening
recessions and fluctuations in employment beyond those factored into consensus forecasts; changes in foreign
exchange rates and interest rates; volatility in equity markets; lack of liquidity in wholesale funding markets;
illiquidity and downward price pressure in national real estate markets; adverse changes in central banks’
policies with respect to the provision of liquidity support to financial markets; heightened market concerns over
sovereign creditworthiness in over-indebted countries; adverse changes in the funding status of public or private
defined benefit pensions; and consumer perception as to the continuing availability of credit and price
competition in the market segments we serve;
changes in government policy and regulation, including the monetary, interest rate and other policies of central
banks and other regulatory authorities; initiatives to change the size, scope of activities and interconnectednessof financial institutions in connection with the implementation of stricter regulation of financial institutions in
key markets worldwide; revised capital and liquidity benchmarks which could serve to deleverage bank balance
sheets and lower returns available from the current business model and portfolio mix; imposition of levies or
taxes designed to change business mix and risk appetite; the practices, pricing or responsibilities of financial
institutions serving their consumer markets; expropriation, nationalisation, confiscation of assets and changes in
legislation relating to foreign ownership; changes in bankruptcy legislation in the principal markets in which we
operate and the consequences thereof; general changes in government policy that may significantly influence
investor decisions; extraordinary government actions as a result of recent market turmoil; other unfavourable
political or diplomatic developments producing social instability or legal uncertainty which in turn may affect
demand for our products and services; the costs, effects and outcomes of product regulatory reviews, actions or
litigation, including any additional compliance requirements; and the effects of competition in the markets where
we operate including increased competition from non-bank financial services companies, including securities
firms; and factors specific to HSBC, including our success in adequately identifying the risks we face, such as
the incidence of loan losses or delinquency, and managing those risks (through account management, hedging
and other techniques). Effective risk management depends on, among other things, our ability through stress
testing and other techniques to prepare for events that cannot be captured by the statistical models we use; and
our success in addressing operational, legal and regulatory, and litigation challenges.
8/3/2019 111109 Interim Management Statement
http://slidepdf.com/reader/full/111109-interim-management-statement 18/30
H S B C H O L D I N G S P L C
Appendix – selected financial information
18
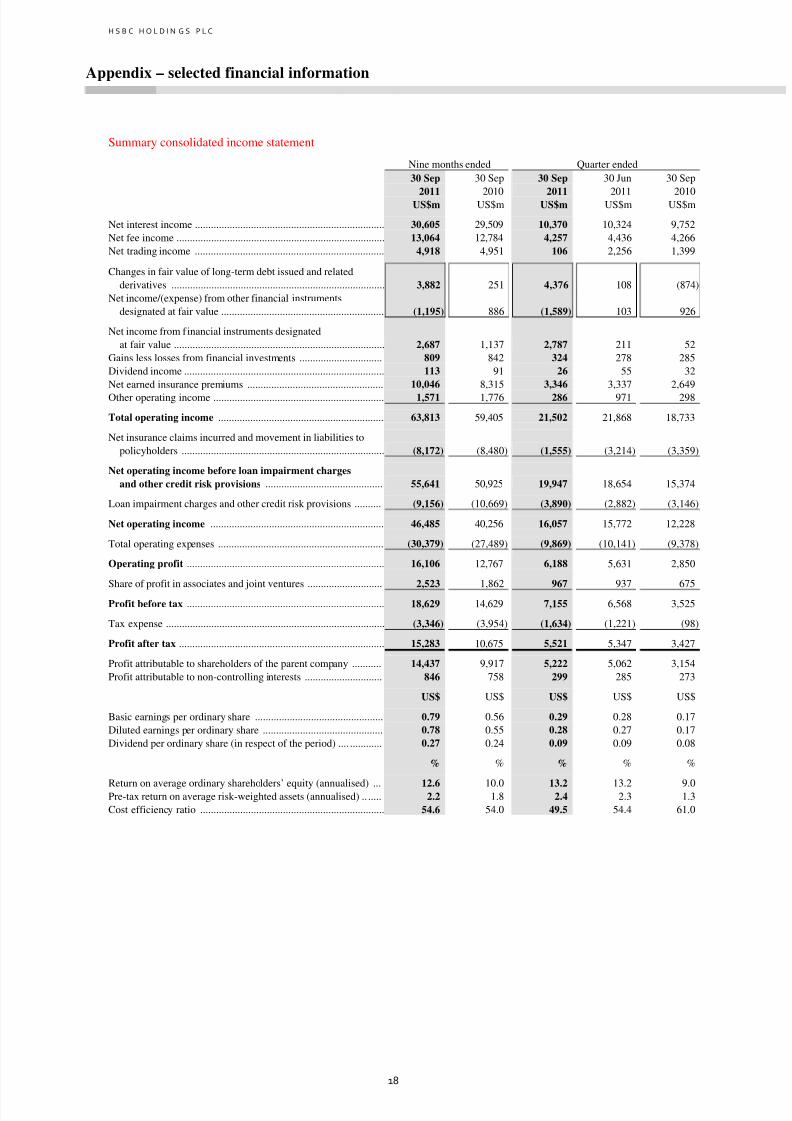
Summary consolidated income statement
Nine months ended Quarter ended
30 Sep
2011
30 Sep
2010
30 Sep
2011
30 Jun
2011
30 Sep
2010US$m US$m US$m US$m US$m
Net interest income ....................................................................... 30,605 29,509 10,370 10,324 9,752
Net fee income .............................................................................. 13,064 12,784 4,257 4,436 4,266
Net trading income ....................................................................... 4,918 4,951 106 2,256 1,399
Changes in fair value of long-term debt issued and related
derivatives ................................................................................ 3,882 251 4,376 108 (874)
Net income/(expense) from other financial instruments
designated at fair value ............................................................. (1,195) 886 (1,589) 103 926
Net income from financial instruments designated
at fair value ............................................................................... 2,687 1,137 2,787 211 52
Gains less losses from financial investments ............................... 809 842 324 278 285
Dividend income ........................................................................... 113 91 26 55 32
Net earned insurance premiums ................................................... 10,046 8,315 3,346 3,337 2,649
Other operating income ................................................................ 1,571 1,776 286 971 298
Total operating income .............................................................. 63,813 59,405 21,502 21,868 18,733
Net insurance claims incurred and movement in liabilities to
policyholders ............................................................................ (8,172) (8,480) (1,555) (3,214) (3,359)
Net operating income before loan impairment charges
and other credit risk provisions ............................................ 55,641 50,925 19,947 18,654 15,374
Loan impairment charges and other credit risk provisions .......... (9,156) (10,669) (3,890) (2,882) (3,146)
Net operating income ................................................................. 46,485 40,256 16,057 15,772 12,228
Total operating expenses .............................................................. (30,379) (27,489) (9,869) (10,141) (9,378)
Operating profit .......................................................................... 16,106 12,767 6,188 5,631 2,850
Share of profit in associates and joint ventures ............................2,523
1,862967
937 675Profit before tax .......................................................................... 18,629 14,629 7,155 6,568 3,525
Tax expense .................................................................................. (3,346) (3,954) (1,634) (1,221) (98)
Profit after tax ............................................................................. 15,283 10,675 5,521 5,347 3,427
Profit attributable to shareholders of the parent company ........... 14,437 9,917 5,222 5,062 3,154
Profit attributable to non-controlling interests ............................. 846 758 299 285 273
US$ US$ US$ US$ US$
Basic earnings per ordinary share ................................................ 0.79 0.56 0.29 0.28 0.17
Diluted earnings per ordinary share ............................................. 0.78 0.55 0.28 0.27 0.17
Dividend per ordinary share (in respect of the period) .... ............ 0.27 0.24 0.09 0.09 0.08
% % % % %
Return on average ordinary shareholders’ equity (annualised) ... 12.6 10.0 13.2 13.2 9.0Pre-tax return on average risk-weighted assets (annualised) .. ..... 2.2 1.8 2.4 2.3 1.3
Cost efficiency ratio ..................................................................... 54.6 54.0 49.5 54.4 61.0
8/3/2019 111109 Interim Management Statement
http://slidepdf.com/reader/full/111109-interim-management-statement 19/30
H S B C H O L D I N G S P L C
Appendix – selected financial information (continued)
19
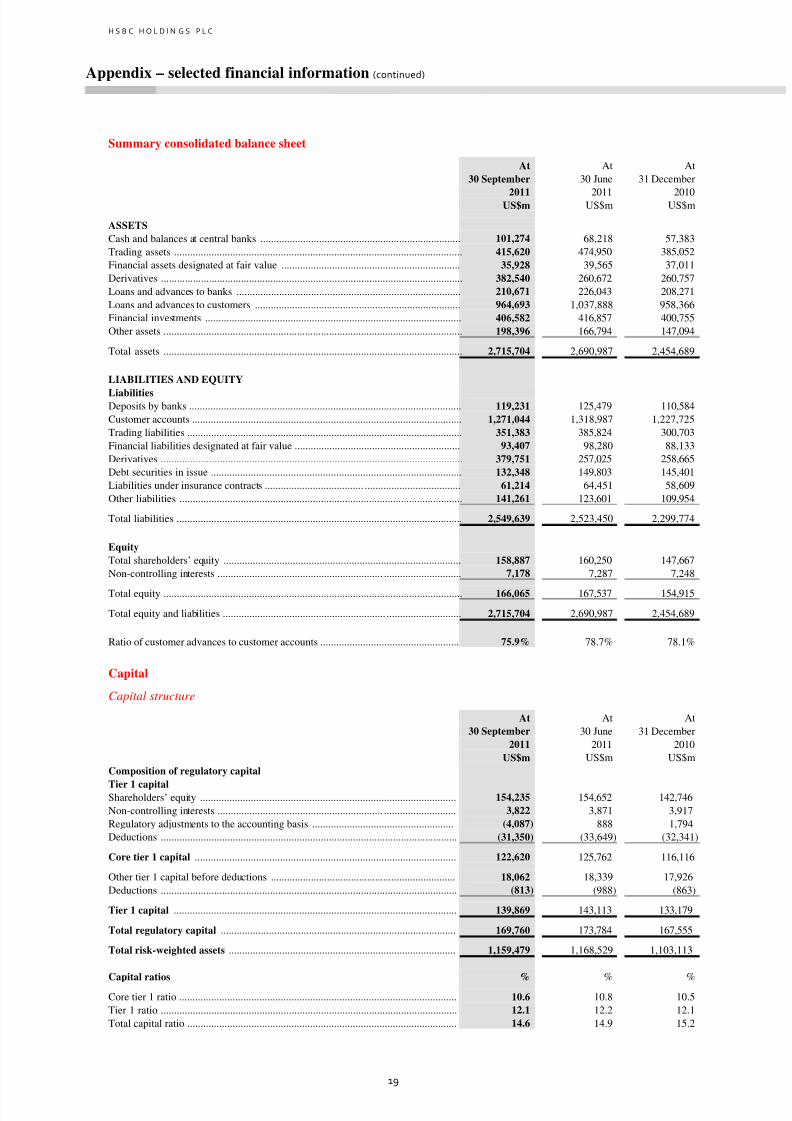
Summary consolidated balance sheet
At
30 September
2011
At
30 June
2011
At
31 December
2010US$m US$m US$m
ASSETS
Cash and balances at central banks ........................................................................... 101,274 68,218 57,383
Trading assets ............................................................................................................ 415,620 474,950 385,052
Financial assets designated at fair value ................................................................... 35,928 39,565 37,011
Derivatives ................................................................................................................. 382,540 260,672 260,757
Loans and advances to banks .................................................................................... 210,671 226,043 208,271
Loans and advances to customers ............................................................................. 964,693 1,037,888 958,366
Financial investments ................................................................................................ 406,582 416,857 400,755
Other assets ................................................................................................................ 198,396 166,794 147,094
Total assets ................................................................................................................ 2,715,704 2,690,987 2,454,689
LIABILITIES AND EQUITY
LiabilitiesDeposits by banks ...................................................................................................... 119,231 125,479 110,584
Customer accounts ..................................................................................................... 1,271,044 1,318,987 1,227,725
Trading liabilities ....................................................................................................... 351,383 385,824 300,703
Financial liabilities designated at fair value .............................................................. 93,407 98,280 88,133
Derivatives ................................................................................................................. 379,751 257,025 258,665
Debt securities in issue .............................................................................................. 132,348 149,803 145,401
Liabilities under insurance contracts ..................................... .................................... 61,214 64,451 58,609
Other liabilities .......................................................................................................... 141,261 123,601 109,954
Total liabilities ........................................................................................................... 2,549,639 2,523,450 2,299,774
Equity
Total shareholders’ equity ......................................................................................... 158,887 160,250 147,667
Non-controlling interests .............................................................. ............................. 7,178 7,287 7,248
Total equity ................................................................................................................ 166,065 167,537 154,915
Total equity and liabilities ............................................................. ............................ 2,715,704 2,690,987 2,454,689
Ratio of customer advances to customer accounts .................................................... 75.9% 78.7% 78.1%
Capital
Capital structure
At
30 September
At
30 June
At
31 December
2011 2011 2010
US$m US$m US$m
Composition of regulatory capital
Tier 1 capitalShareholders’ equity ................................................................................................ 154,235 154,652 142,746
Non-controlling interests .............................................................. ........................... 3,822 3,871 3,917
Regulatory adjustments to the accounting basis ..................................................... (4,087) 888 1,794
Deductions ............................................................................................................... (31,350) (33,649) (32,341)
Core tier 1 capital .................................................................................................. 122,620 125,762 116,116
Other tier 1 capital before deductions ..................................................................... 18,062 18,339 17,926
Deductions ............................................................................................................... (813) (988) (863)
Tier 1 capital .......................................................................................................... 139,869 143,113 133,179
Total regulatory capital ........................................................................................ 169,760 173,784 167,555
Total risk-weighted assets ..................................................................................... 1,159,479 1,168,529 1,103,113
Capital ratios % % %Core tier 1 ratio ........................................................................................................ 10.6 10.8 10.5
Tier 1 ratio ............................................................................................................... 12.1 12.2 12.1
Total capital ratio ..................................................................................................... 14.6 14.9 15.2
8/3/2019 111109 Interim Management Statement
http://slidepdf.com/reader/full/111109-interim-management-statement 20/30
H S B C H O L D I N G S P L C
Appendix – selected financial information (continued)
20
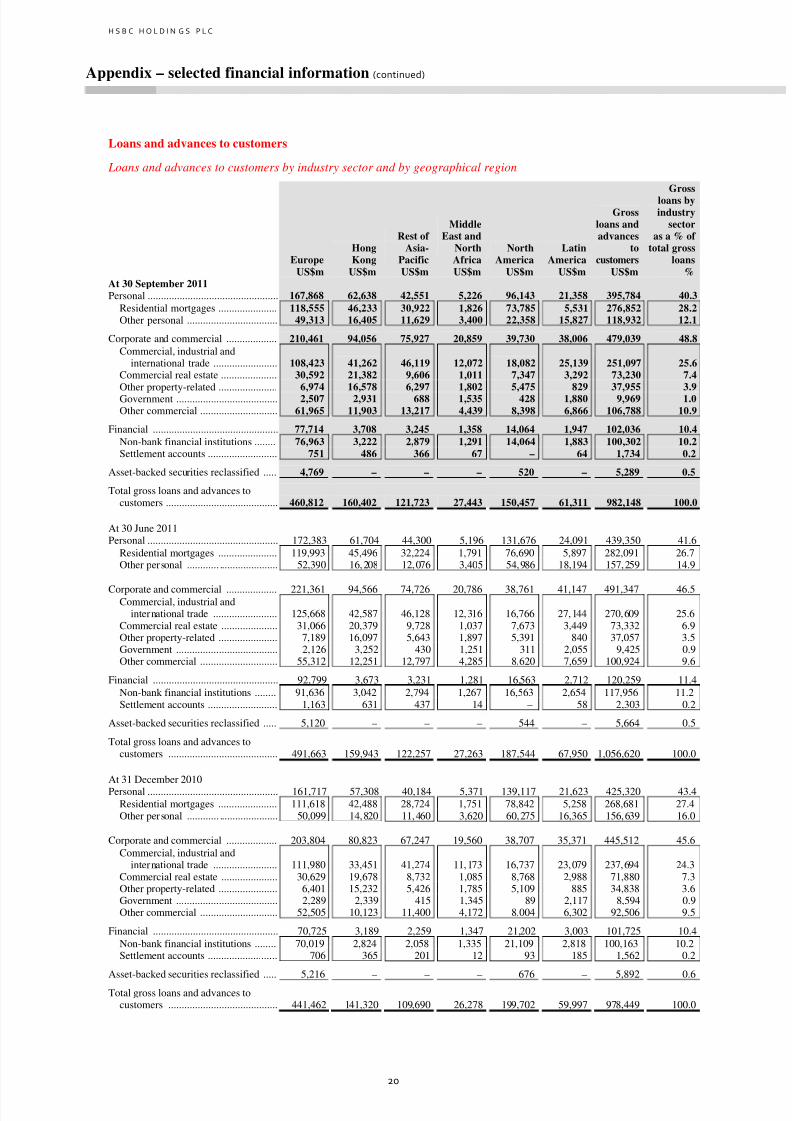
Loans and advances to customers
Loans and advances to customers by industry sector and by geographical region
EuropeHongKong
Rest of Asia-
Pacific
MiddleEast and
NorthAfrica
NorthAmerica
LatinAmerica
Grossloans andadvances
tocustomers
Grossloans byindustry
sectoras a % of
total grossloans
US$m US$m US$m US$m US$m US$m US$m %At 30 September 2011Personal ................................................. 167,868 62,638 42,551 5,226 96,143 21,358 395,784 40.3
Residential mortgages ...................... 118,555 46,233 30,922 1,826 73,785 5,531 276,852 28.2Other personal .................................. 49,313 16,405 11,629 3,400 22,358 15,827 118,932 12.1
Corporate and commercial ................... 210,461 94,056 75,927 20,859 39,730 38,006 479,039 48.8
Commercial, industrial andinternational trade ........................ 108,423 41,262 46,119 12,072 18,082 25,139 251,097 25.6
Commercial real estate ..................... 30,592 21,382 9,606 1,011 7,347 3,292 73,230 7.4Other property-related ...................... 6,974 16,578 6,297 1,802 5,475 829 37,955 3.9Government ...................................... 2,507 2,931 688 1,535 428 1,880 9,969 1.0Other commercial ............................. 61,965 11,903 13,217 4,439 8,398 6,866 106,788 10.9
Financial ............................................... 77,714 3,708 3,245 1,358 14,064 1,947 102,036 10.4
Non-bank financial institutions ........ 76,963 3,222 2,879 1,291 14,064 1,883 100,302 10.2Settlement accounts .......................... 751 486 366 67 – 64 1,734 0.2
Asset-backed securities reclassified ..... 4,769 – – – 520 – 5,289 0.5
Total gross loans and advances tocustomers .......................................... 460,812 160,402 121,723 27,443 150,457 61,311 982,148 100.0
At 30 June 2011Personal ................................................. 172,383 61,704 44,300 5,196 131,676 24,091 439,350 41.6
Residential mortgages ...................... 119,993 45,496 32,224 1,791 76,690 5,897 282,091 26.7Other personal ............ ...................... 52,390 16,208 12,076 3,405 54,986 18,194 157,259 14.9
Corporate and commercial ................... 221,361 94,566 74,726 20,786 38,761 41,147 491,347 46.5Commercial, industrial and
international trade ........................ 125,668 42,587 46,128 12,316 16,766 27,144 270,609 25.6Commercial real estate ..................... 31,066 20,379 9,728 1,037 7,673 3,449 73,332 6.9Other property-related ...................... 7,189 16,097 5,643 1,897 5,391 840 37,057 3.5Government ...................................... 2,126 3,252 430 1,251 311 2,055 9,425 0.9Other commercial ............................. 55,312 12,251 12,797 4,285 8,620 7,659 100,924 9.6
Financial ............................................... 92,799 3,673 3,231 1,281 16,563 2,712 120,259 11.4Non-bank financial institutions ........ 91,636 3,042 2,794 1,267 16,563 2,654 117,956 11.2Settlement accounts .......................... 1,163 631 437 14 – 58 2,303 0.2
Asset-backed securities reclassified ..... 5,120 – – – 544 – 5,664 0.5
Total gross loans and advances tocustomers ......................................... 491,663 159,943 122,257 27,263 187,544 67,950 1,056,620 100.0
At 31 December 2010Personal ................................................. 161,717 57,308 40,184 5,371 139,117 21,623 425,320 43.4
Residential mortgages ...................... 111,618 42,488 28,724 1,751 78,842 5,258 268,681 27.4Other personal ............ ...................... 50,099 14,820 11,460 3,620 60,275 16,365 156,639 16.0
Corporate and commercial ................... 203,804 80,823 67,247 19,560 38,707 35,371 445,512 45.6Commercial, industrial and
international trade ........................ 111,980 33,451 41,274 11,173 16,737 23,079 237,694 24.3Commercial real estate ..................... 30,629 19,678 8,732 1,085 8,768 2,988 71,880 7.3Other property-related ...................... 6,401 15,232 5,426 1,785 5,109 885 34,838 3.6Government ...................................... 2,289 2,339 415 1,345 89 2,117 8,594 0.9Other commercial ............................. 52,505 10,123 11,400 4,172 8,004 6,302 92,506 9.5
Financial ............................................... 70,725 3,189 2,259 1,347 21,202 3,003 101,725 10.4Non-bank financial institutions ........ 70,019 2,824 2,058 1,335 21,109 2,818 100,163 10.2Settlement accounts .......................... 706 365 201 12 93 185 1,562 0.2
Asset-backed securities reclassified ..... 5,216 – – – 676 – 5,892 0.6
Total gross loans and advances tocustomers ......................................... 441,462 141,320 109,690 26,278 199,702 59,997 978,449 100.0
8/3/2019 111109 Interim Management Statement
http://slidepdf.com/reader/full/111109-interim-management-statement 21/30
H S B C H O L D I N G S P L C
Appendix – selected financial information (continued)
21
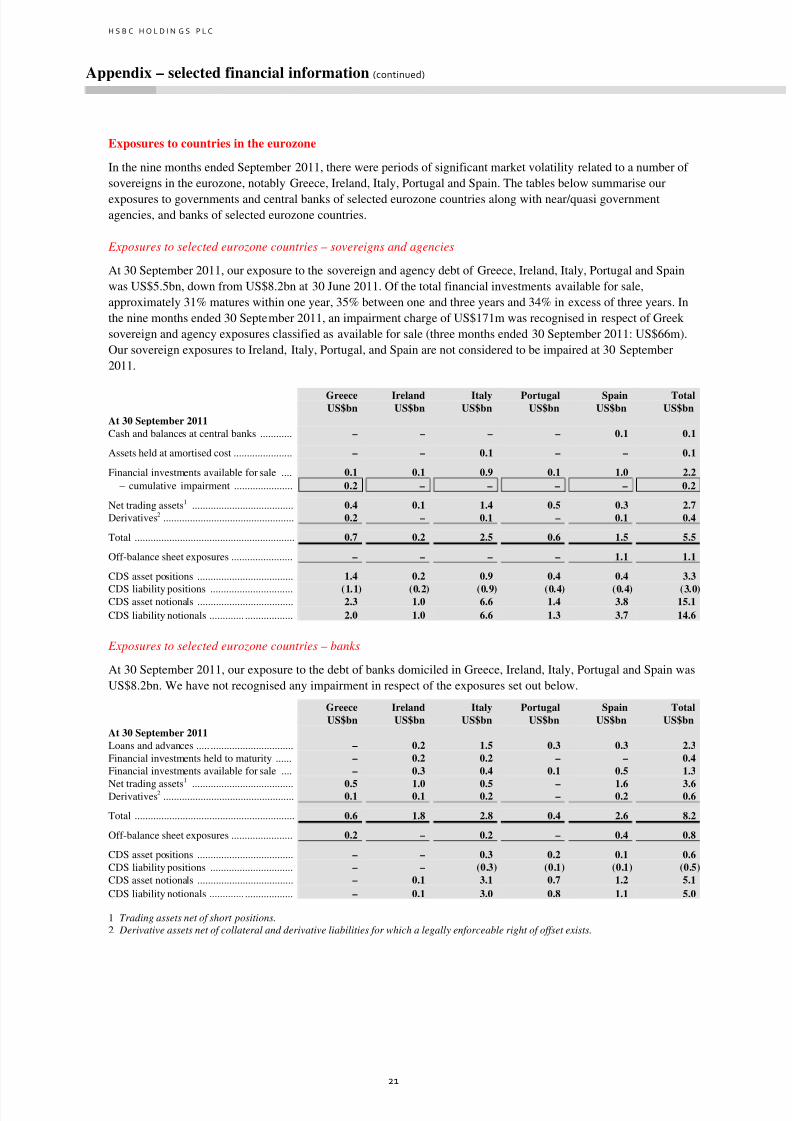
Exposures to countries in the eurozone
In the nine months ended September 2011, there were periods of significant market volatility related to a number of
sovereigns in the eurozone, notably Greece, Ireland, Italy, Portugal and Spain. The tables below summarise our
exposures to governments and central banks of selected eurozone countries along with near/quasi governmentagencies, and banks of selected eurozone countries.
Exposures to selected eurozone countries – sovereigns and agencies
At 30 September 2011, our exposure to the sovereign and agency debt of Greece, Ireland, Italy, Portugal and Spain
was US$5.5bn, down from US$8.2bn at 30 June 2011. Of the total financial investments available for sale,
approximately 31% matures within one year, 35% between one and three years and 34% in excess of three years. In
the nine months ended 30 September 2011, an impairment charge of US$171m was recognised in respect of Greek
sovereign and agency exposures classified as available for sale (three months ended 30 September 2011: US$66m).
Our sovereign exposures to Ireland, Italy, Portugal, and Spain are not considered to be impaired at 30 September
2011.
Greece Ireland Italy Portugal Spain TotalUS$bn US$bn US$bn US$bn US$bn US$bn
At 30 September 2011
Cash and balances at central banks ............ – – – – 0.1 0.1
Assets held at amortised cost ...................... – – 0.1 – – 0.1
Financial investments available for sale .... 0.1 0.1 0.9 0.1 1.0 2.2
– cumulative impairment ...................... 0.2 – – – – 0.2
Net trading assets1 ...................................... 0.4 0.1 1.4 0.5 0.3 2.7
Derivatives2 ................................................. 0.2 – 0.1 – 0.1 0.4
Total ............................................................ 0.7 0.2 2.5 0.6 1.5 5.5
Off-balance sheet exposures ....................... – – – – 1.1 1.1
CDS asset positions .................................... 1.4 0.2 0.9 0.4 0.4 3.3
CDS liability positions ............................... (1.1) (0.2) (0.9) (0.4) (0.4) (3.0)CDS asset notionals .................................... 2.3 1.0 6.6 1.4 3.8 15.1
CDS liability notionals ............. .................. 2.0 1.0 6.6 1.3 3.7 14.6
Exposures to selected eurozone countries – banks
At 30 September 2011, our exposure to the debt of banks domiciled in Greece, Ireland, Italy, Portugal and Spain was
US$8.2bn. We have not recognised any impairment in respect of the exposures set out below.
Greece Ireland Italy Portugal Spain Total
US$bn US$bn US$bn US$bn US$bn US$bn
At 30 September 2011
Loans and advances ..... ............................... – 0.2 1.5 0.3 0.3 2.3
Financial investments held to maturity ...... – 0.2 0.2 – – 0.4
Financial investments available for sale .... – 0.3 0.4 0.1 0.5 1.3
Net trading assets1
...................................... 0.5 1.0 0.5 – 1.6 3.6Derivatives2 ................................................. 0.1 0.1 0.2 – 0.2 0.6
Total ............................................................ 0.6 1.8 2.8 0.4 2.6 8.2
Off-balance sheet exposures ....................... 0.2 – 0.2 – 0.4 0.8
CDS asset positions .................................... – – 0.3 0.2 0.1 0.6
CDS liability positions ............................... – – (0.3) (0.1) (0.1) (0.5)
CDS asset notionals .................................... – 0.1 3.1 0.7 1.2 5.1
CDS liability notionals ............. .................. – 0.1 3.0 0.8 1.1 5.0
1 Trading assets net of short positions.
2 Derivative assets net of collateral and derivative liabilities for which a legally enforceable right of offset exists.
8/3/2019 111109 Interim Management Statement
http://slidepdf.com/reader/full/111109-interim-management-statement 22/30
H S B C H O L D I N G S P L C
Appendix – selected financial information (continued)
22
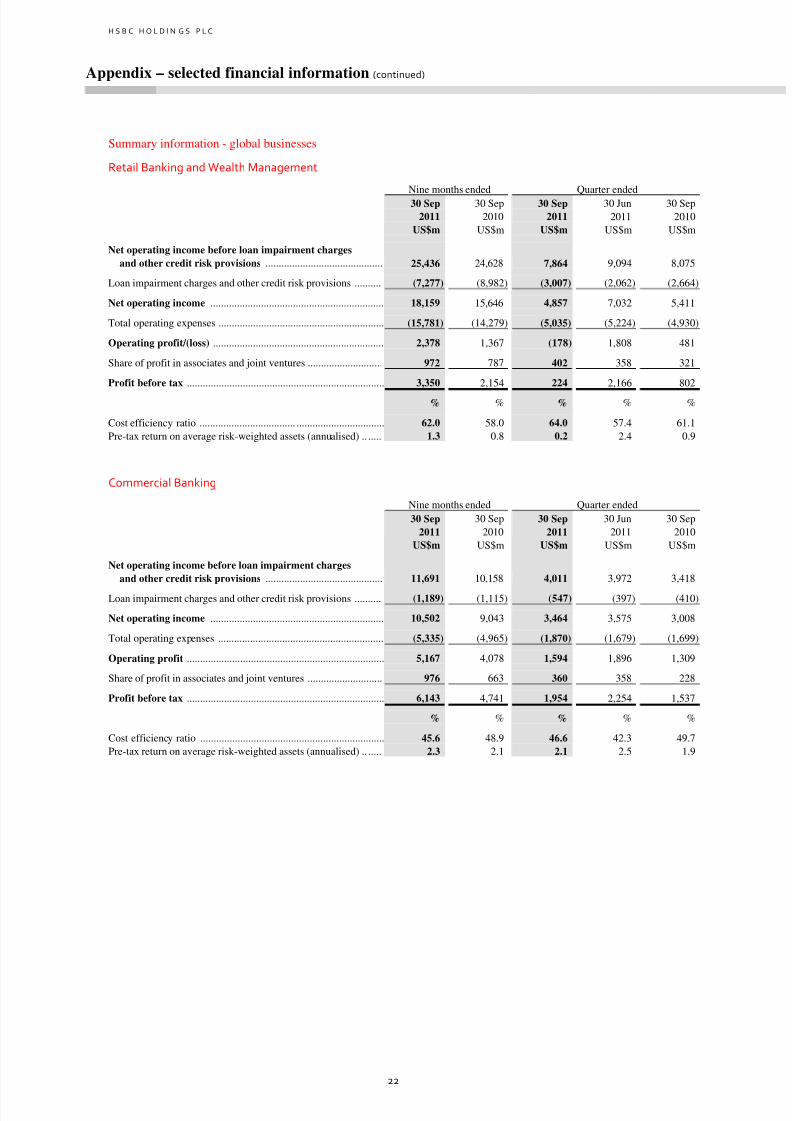
Summary information - global businesses
Retail Banking and Wealth Management
Nine months ended Quarter ended
30 Sep
2011
30 Sep
2010
30 Sep
2011
30 Jun
2011
30 Sep
2010
US$m US$m US$m US$m US$m
Net operating income before loan impairment charges
and other credit risk provisions ............................................ 25,436 24,628 7,864 9,094 8,075
Loan impairment charges and other credit risk provisions .......... (7,277) (8,982) (3,007) (2,062) (2,664)
Net operating income ................................................................. 18,159 15,646 4,857 7,032 5,411
Total operating expenses .............................................................. (15,781) (14,279) (5,035) (5,224) (4,930)
Operating profit/(loss) ................................................................ 2,378 1,367 (178) 1,808 481
Share of profit in associates and joint ventures ............................ 972 787 402 358 321
Profit before tax .......................................................................... 3,350 2,154 224 2,166 802
% % % % %
Cost efficiency ratio .................................... ................................. 62.0 58.0 64.0 57.4 61.1
Pre-tax return on average risk-weighted assets (annualised) .. ..... 1.3 0.8 0.2 2.4 0.9
Commercial Banking
Nine months ended Quarter ended
30 Sep
2011
30 Sep
2010
30 Sep
2011
30 Jun
2011
30 Sep
2010
US$m US$m US$m US$m US$m
Net operating income before loan impairment charges
and other credit risk provisions ............................................ 11,691 10,158 4,011 3,972 3,418
Loan impairment charges and other credit risk provisions .......... (1,189) (1,115) (547) (397) (410)
Net operating income ................................................................. 10,502 9,043 3,464 3,575 3,008
Total operating expenses .............................................................. (5,335) (4,965) (1,870) (1,679) (1,699)
Operating profit .......................................................................... 5,167 4,078 1,594 1,896 1,309
Share of profit in associates and joint ventures ............................ 976 663 360 358 228
Profit before tax .......................................................................... 6,143 4,741 1,954 2,254 1,537
% % % % %
Cost efficiency ratio ..................................................................... 45.6 48.9 46.6 42.3 49.7
Pre-tax return on average risk-weighted assets (annualised) .. ..... 2.3 2.1 2.1 2.5 1.9
8/3/2019 111109 Interim Management Statement
http://slidepdf.com/reader/full/111109-interim-management-statement 23/30
H S B C H O L D I N G S P L C
Appendix – selected financial information (continued)
23
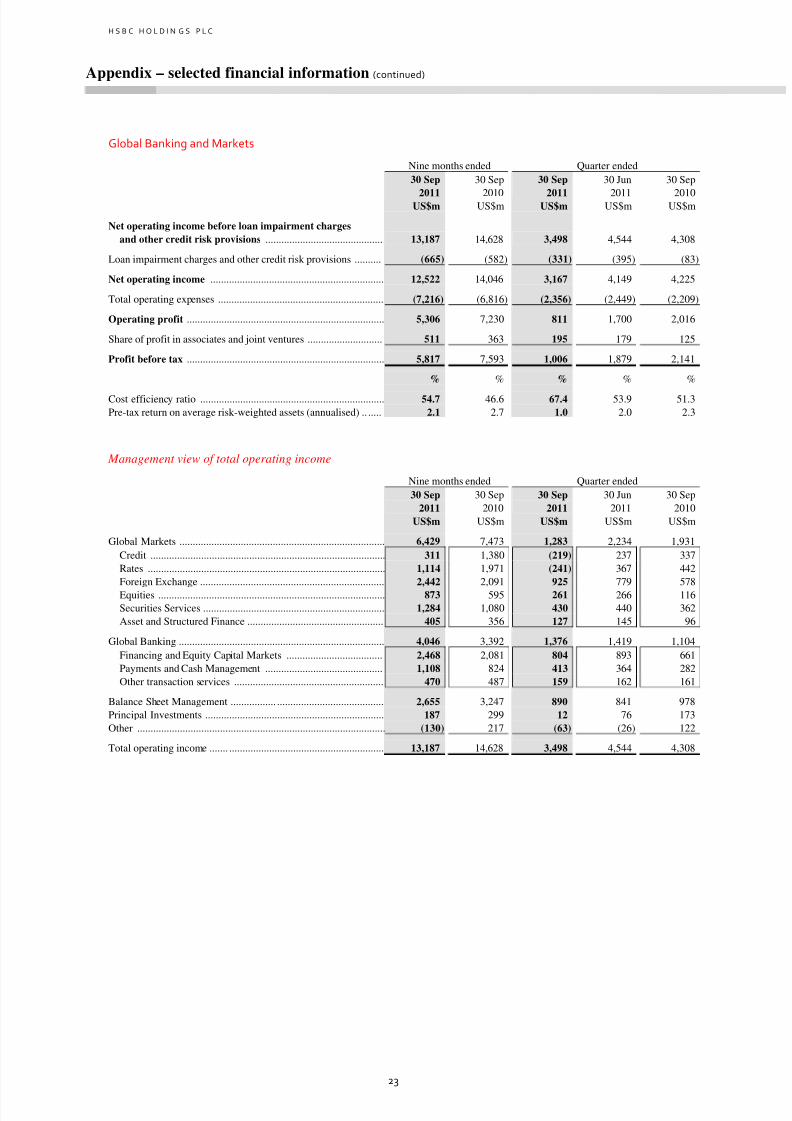
Global Banking and Markets
Nine months ended Quarter ended
30 Sep
2011
30 Sep
2010
30 Sep
2011
30 Jun
2011
30 Sep
2010US$m US$m US$m US$m US$m
Net operating income before loan impairment charges
and other credit risk provisions ............................................ 13,187 14,628 3,498 4,544 4,308
Loan impairment charges and other credit risk provisions .......... (665) (582) (331) (395) (83)
Net operating income ................................................................. 12,522 14,046 3,167 4,149 4,225
Total operating expenses .............................................................. (7,216) (6,816) (2,356) (2,449) (2,209)
Operating profit .......................................................................... 5,306 7,230 811 1,700 2,016
Share of profit in associates and joint ventures ............................ 511 363 195 179 125
Profit before tax .......................................................................... 5,817 7,593 1,006 1,879 2,141
% % % % %
Cost efficiency ratio ..................................................................... 54.7 46.6 67.4 53.9 51.3
Pre-tax return on average risk-weighted assets (annualised) .. ..... 2.1 2.7 1.0 2.0 2.3
Management view of total operating income
Nine months ended Quarter ended
30 Sep
2011
30 Sep
2010
30 Sep
2011
30 Jun
2011
30 Sep
2010
US$m US$m US$m US$m US$m
Global Markets ............................................................................. 6,429 7,473 1,283 2,234 1,931
Credit ........................................................................................ 311 1,380 (219) 237 337
Rates ......................................................................................... 1,114 1,971 (241) 367 442
Foreign Exchange ..................................................................... 2,442 2,091 925 779 578
Equities ..................................................................................... 873 595 261 266 116
Securities Services .................................................................... 1,284 1,080 430 440 362
Asset and Structured Finance ................................................... 405 356 127 145 96
Global Banking ............................................................................. 4,046 3,392 1,376 1,419 1,104
Financing and Equity Capital Markets .................................... 2,468 2,081 804 893 661
Payments and Cash Management ............................................ 1,108 824 413 364 282
Other transaction services ........................................................ 470 487 159 162 161
Balance Sheet Management ................. ........................................ 2,655 3,247 890 841 978
Principal Investments ................................................................... 187 299 12 76 173
Other ............................................................................................. (130) 217 (63) (26) 122
Total operating income ....... .......................................................... 13,187 14,628 3,498 4,544 4,308
8/3/2019 111109 Interim Management Statement
http://slidepdf.com/reader/full/111109-interim-management-statement 24/30
H S B C H O L D I N G S P L C
Appendix – selected financial information (continued)
24
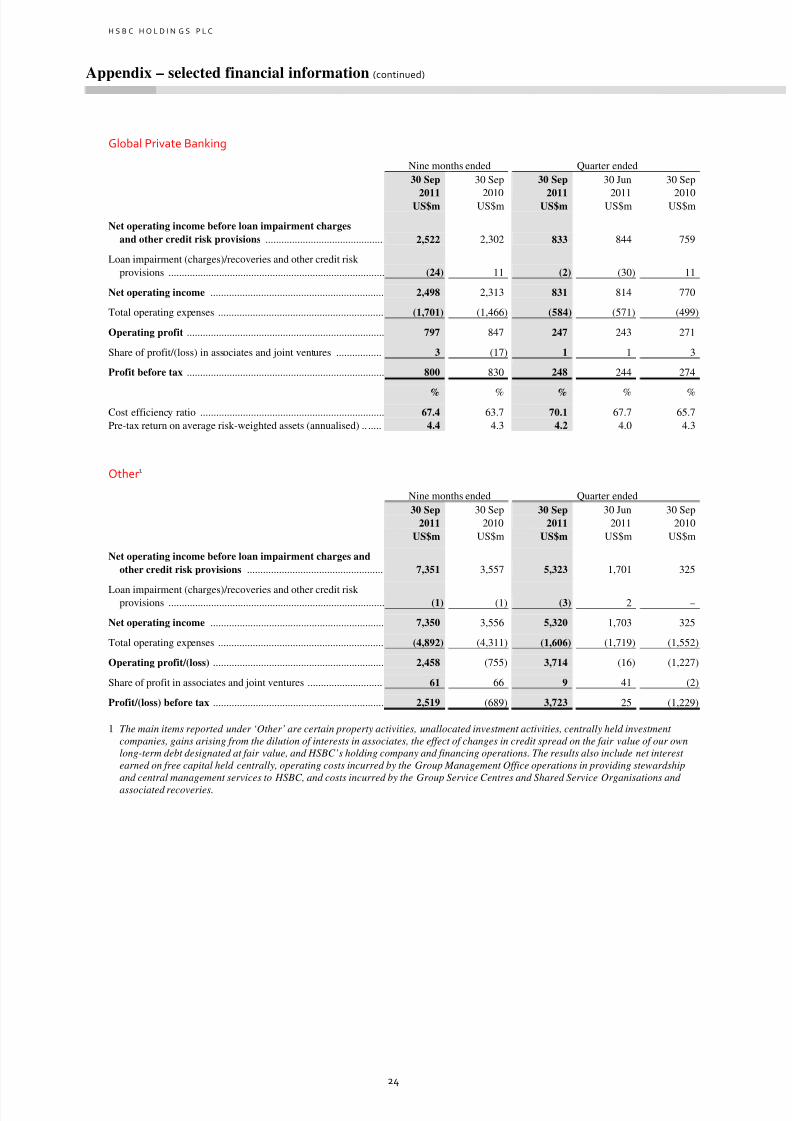
Global Private Banking
Nine months ended Quarter ended
30 Sep
2011
30 Sep
2010
30 Sep
2011
30 Jun
2011
30 Sep
2010US$m US$m US$m US$m US$m
Net operating income before loan impairment charges
and other credit risk provisions ............................................ 2,522 2,302 833 844 759
Loan impairment (charges)/recoveries and other credit risk
provisions ................................................................................. (24) 11 (2) (30) 11
Net operating income ................................................................. 2,498 2,313 831 814 770
Total operating expenses .............................................................. (1,701) (1,466) (584) (571) (499)
Operating profit .......................................................................... 797 847 247 243 271
Share of profit/(loss) in associates and joint ventures ................. 3 (17) 1 1 3
Profit before tax .......................................................................... 800 830 248 244 274
% % % % %
Cost efficiency ratio ..................................................................... 67.4 63.7 70.1 67.7 65.7
Pre-tax return on average risk-weighted assets (annualised) .. ..... 4.4 4.3 4.2 4.0 4.3
Other1
Nine months ended Quarter ended
30 Sep
2011
30 Sep
2010
30 Sep
2011
30 Jun
2011
30 Sep
2010
US$m US$m US$m US$m US$m
Net operating income before loan impairment charges and
other credit risk provisions ................................................... 7,351 3,557 5,323 1,701 325
Loan impairment (charges)/recoveries and other credit risk provisions ................................................................................. (1) (1) (3) 2 –
Net operating income ................................................................. 7,350 3,556 5,320 1,703 325
Total operating expenses .............................................................. (4,892) (4,311) (1,606) (1,719) (1,552)
Operating profit/(loss) ................................................................ 2,458 (755) 3,714 (16) (1,227)
Share of profit in associates and joint ventures ............................ 61 66 9 41 (2)
Profit/(loss) before tax ................................................................ 2,519 (689) 3,723 25 (1,229)
1 The main items reported under ‘Other’ are certain property activities, unallocated investment activities, centrally held investment
companies, gains arising from the dilution of interests in associates, the effect of changes in credit spread on the fair value of our own
long-term debt designated at fair value, and HSBC’s holding company and financing operations. The results also include net interest
earned on free capital held centrally, operating costs incurred by the Group Management Office operations in providing stewardship
and central management services to HSBC, and costs incurred by the Group Service Centres and Shared Service Organisations and
associated recoveries.
8/3/2019 111109 Interim Management Statement
http://slidepdf.com/reader/full/111109-interim-management-statement 25/30
8/3/2019 111109 Interim Management Statement
http://slidepdf.com/reader/full/111109-interim-management-statement 26/30
H S B C H O L D I N G S P L C
Appendix – selected financial information (continued)
26
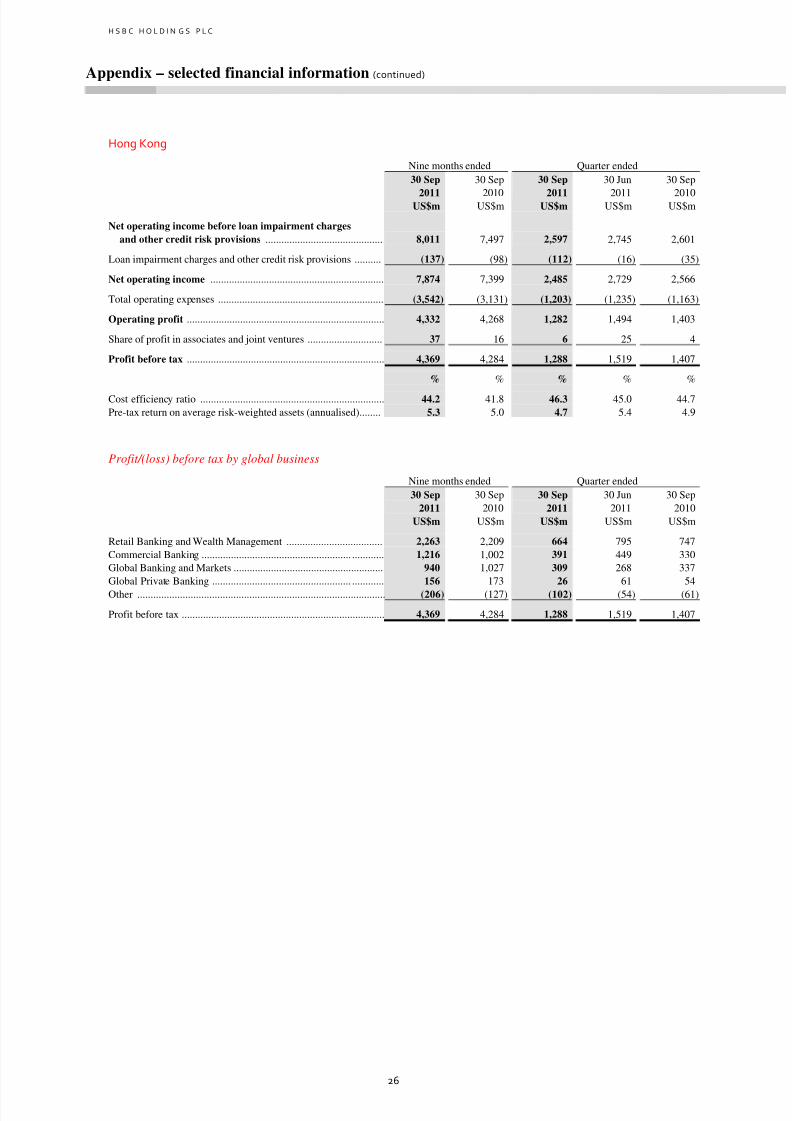
Hong Kong
Nine months ended Quarter ended
30 Sep
2011
30 Sep
2010
30 Sep
2011
30 Jun
2011
30 Sep
2010US$m US$m US$m US$m US$m
Net operating income before loan impairment charges
and other credit risk provisions ............................................ 8,011 7,497 2,597 2,745 2,601
Loan impairment charges and other credit risk provisions .......... (137) (98) (112) (16) (35)
Net operating income ................................................................. 7,874 7,399 2,485 2,729 2,566
Total operating expenses .............................................................. (3,542) (3,131) (1,203) (1,235) (1,163)
Operating profit .......................................................................... 4,332 4,268 1,282 1,494 1,403
Share of profit in associates and joint ventures ............................ 37 16 6 25 4
Profit before tax .......................................................................... 4,369 4,284 1,288 1,519 1,407
% % % % %
Cost efficiency ratio ..................................................................... 44.2 41.8 46.3 45.0 44.7
Pre-tax return on average risk-weighted assets (annualised)........ 5.3 5.0 4.7 5.4 4.9
Profit/(loss) before tax by global business
Nine months ended Quarter ended
30 Sep
2011
30 Sep
2010
30 Sep
2011
30 Jun
2011
30 Sep
2010
US$m US$m US$m US$m US$m
Retail Banking and Wealth Management .................................... 2,263 2,209 664 795 747
Commercial Banking ........................................................ ............ 1,216 1,002 391 449 330
Global Banking and Markets ........................................................ 940 1,027 309 268 337
Global Private Banking .................................................... ............ 156 173 26 61 54
Other ............................................................................................. (206) (127) (102) (54) (61)
Profit before tax ............................................................................ 4,369 4,284 1,288 1,519 1,407
8/3/2019 111109 Interim Management Statement
http://slidepdf.com/reader/full/111109-interim-management-statement 27/30
H S B C H O L D I N G S P L C
Appendix – selected financial information (continued)
27
Rest of Asia‐Pacific
Nine months ended Quarter ended
30 Sep
2011
30 Sep
2010
30 Sep
2011
30 Jun
2011
30 Sep
2010US$m US$m US$m US$m US$m
Net operating income before loan impairment charges
and other credit risk provisions ............................................ 8,103 6,771 2,755 2,823 2,273
Loan impairment charges and other credit risk provisions .......... (213) (320) (113) (38) (173)
Net operating income ................................................................. 7,890 6,451 2,642 2,785 2,100
Total operating expenses .............................................................. (4,335) (3,758) (1,499) (1,477) (1,341)
Operating profit .......................................................................... 3,555 2,693 1,143 1,308 759
Share of profit in associates and joint ventures ............................ 2,195 1,686 865 800 635
Profit before tax .......................................................................... 5,750 4,379 2,008 2,108 1,394
% % % % %
Cost efficiency ratio ..................................................................... 53.5 55.5 54.4 52.3 59.0
Pre-tax return on average risk-weighted assets (annualised) .. ..... 3.3 3.1 3.2 3.6 2.8
Profit before tax by global business
Nine months ended Quarter ended
30 Sep
2011
30 Sep
2010
30 Sep
2011
30 Jun
2011
30 Sep
2010
US$m US$m US$m US$m US$m
Retail Banking and Wealth Management .................................... 1,286 881 520 447 357
Commercial Banking ........................................................ ............ 1,674 1,179 613 593 422
Global Banking and Markets ........................................................ 2,297 1,796 757 796 538
Global Private Banking .................................................... ............ 78 62 29 22 19
Other ............................................................................................. 415 461 89 250 58
Profit before tax ............................................................................ 5,750 4,379 2,008 2,108 1,394
8/3/2019 111109 Interim Management Statement
http://slidepdf.com/reader/full/111109-interim-management-statement 28/30
H S B C H O L D I N G S P L C
Appendix – selected financial information (continued)
28
Middle East and North Africa
Nine months ended Quarter ended
30 Sep
2011
30 Sep
2010
30 Sep
2011
30 Jun
2011
30 Sep
2010US$m US$m US$m US$m US$m
Net operating income before loan impairment charges
and other credit risk provisions ............................................ 1,927 1,800 691 643 612
Loan impairment charges and other credit risk provisions .......... (185) (512) (86) (61) (74)
Net operating income ................................................................. 1,742 1,288 605 582 538
Total operating expenses .............................................................. (851) (789) (277) (286) (270)
Operating profit .......................................................................... 891 499 328 296 268
Share of profit in associates and joint ventures ............................ 261 142 77 116 27
Profit before tax .......................................................................... 1,152 641 405 412 295
% % % % %
Cost efficiency ratio ..................................................................... 44.2 43.8 40.1 44.5 44.1
Pre-tax return on average risk-weighted assets (annualised) .. ..... 2.7 1.6 2.8 2.9 2.2
Profit/(loss) before tax by global business
Nine months ended Quarter ended
30 Sep
2011
30 Sep
2010
30 Sep
2011
30 Jun
2011
30 Sep
2010
US$m US$m US$m US$m US$m
Retail Banking and Wealth Management .................................... 188 87 87 53 22
Commercial Banking ..................................................... ............... 425 391 129 149 133
Global Banking and Markets ........................................................ 509 181 170 195 139
Global Private Banking .................................................... ............ – (20) 1 – 3Other ............................................................................................. 30 2 18 15 (2)
Profit before tax ............................................................................ 1,152 641 405 412 295
8/3/2019 111109 Interim Management Statement
http://slidepdf.com/reader/full/111109-interim-management-statement 29/30
H S B C H O L D I N G S P L C
Appendix – selected financial information (continued)
29
North America
Nine months ended Quarter ended
30 Sep
2011
30 Sep
2010
30 Sep
2011
30 Jun
2011
30 Sep
2010US$m US$m US$m US$m US$m
Net operating income before loan impairment charges
and other credit risk provisions ............................................ 12,379 12,591 4,139 4,227 3,591
Loan impairment charges and other credit risk provisions .......... (5,441) (6,523) (2,392) (1,457) (1,969)
Net operating income ................................................................. 6,938 6,068 1,747 2,770 1,622
Total operating expenses .............................................................. (6,624) (6,036) (2,022) (2,354) (2,079)
Operating profit/(loss) ................................................................ 314 32 (275) 416 (457)
Share of profit in associates and joint ventures ............................ 27 12 10 9 9
Profit/(loss) before tax ................................................................ 341 44 (265) 425 (448)
% % % % %
Cost efficiency ratio ..................................................................... 53.5 47.9 48.9 55.7 57.9
Pre-tax return on average risk-weighted assets (annualised) .. ..... 0.1 – (0.3) 0.5 (0.6)
Profit/(loss) before tax by global business
Nine months ended Quarter ended
30 Sep
2011
30 Sep
2010
30 Sep
2011
30 Jun
2011
30 Sep
2010
US$m US$m US$m US$m US$m
Retail Banking and Wealth Management .................................... (2,047) (2,275) (1,602) (86) (809)
Commercial Banking .......................................................... .......... 756 772 268 200 200
Global Banking and Markets ........................................................ 738 1,274 (18) 267 294
Global Private Banking .................................................... ............ 83 82 34 17 28
Other ............................................................................................. 811 191 1,053 27 (161)
Profit/(loss) before tax .................................................................. 341 44 (265) 425 (448)
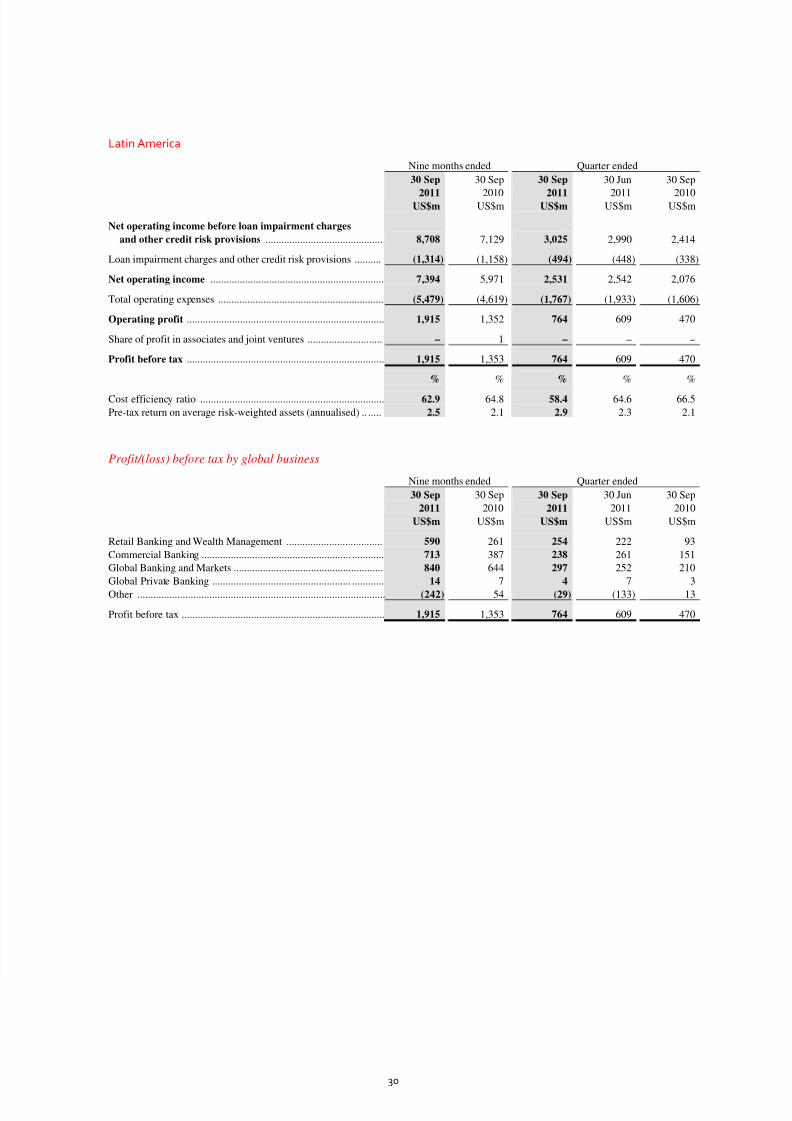
8/3/2019 111109 Interim Management Statement
http://slidepdf.com/reader/full/111109-interim-management-statement 30/30
Latin America
Nine months ended Quarter ended
30 Sep
2011
30 Sep
2010
30 Sep
2011
30 Jun
2011
30 Sep
2010US$m US$m US$m US$m US$m
Net operating income before loan impairment charges
and other credit risk provisions ............................................ 8,708 7,129 3,025 2,990 2,414
Loan impairment charges and other credit risk provisions .......... (1,314) (1,158) (494) (448) (338)
Net operating income ................................................................. 7,394 5,971 2,531 2,542 2,076
Total operating expenses .............................................................. (5,479) (4,619) (1,767) (1,933) (1,606)
Operating profit .......................................................................... 1,915 1,352 764 609 470
Share of profit in associates and joint ventures ............................ – 1 – – –
Profit before tax .......................................................................... 1,915 1,353 764 609 470
% % % % %
Cost efficiency ratio ..................................................................... 62.9 64.8 58.4 64.6 66.5
Pre-tax return on average risk-weighted assets (annualised) .. ..... 2.5 2.1 2.9 2.3 2.1
Profit/(loss) before tax by global business
Nine months ended Quarter ended
30 Sep
2011
30 Sep
2010
30 Sep
2011
30 Jun
2011
30 Sep
2010
US$m US$m US$m US$m US$m
Retail Banking and Wealth Management .................................... 590 261 254 222 93
Commercial Banking ........................................................ ............ 713 387 238 261 151
Global Banking and Markets ........................................................ 840 644 297 252 210
Global Private Banking .................................................... ............ 14 7 4 7 3
Other ............................................................................................. (242) 54 (29) (133) 13
Profit before tax ............................................................................ 1,915 1,353 764 609 470