112 extracting electron densities in n-type gaas from
TRANSCRIPT

1. Introduction
The carrier concentration is a key figure of meritassociated with a go/no-go decision for determiningwhether a wafer or an epitaxial layer meets specifica-tions and should undergo further processing.Technology roadmaps from the microelectronics andnanomaterials industries [1-3] call for non-destructiveand fast-turn around methods to measure transportproperties such as carrier concentrations in semicon-ductor wafers and epitaxial layers. Non-destructivemeasurements are economically more significant forIII-V compound semiconductor wafers with epitaxial
layers than for Si-based wafers with epitaxial layersbecause the regions of wafers used for making contactscannot be used for product. Contacting measurementmethods may be acceptable for Si wafers, but suchdestructive methods are much less acceptable for III-Vcompound semiconductor wafers with epitaxial layersbecause Si wafers are much less expensive per unit areathan compound semiconductor wafers.
Raman spectroscopy has been proposed as one pos-sible way to measure carrier concentrations non-destructively. The shape of the Raman spectral linesdue to the longitudinal-optical phonons interacting withthe plasmon collective modes of the electron gas (so
Volume 112, Number 4, July-August 2007Journal of Research of the National Institute of Standards and Technology
209
[J. Res. Natl. Inst. Stand. Technol. 112, 209-221 (2007)]
Extracting Electron Densities in N-Type GaAsFrom Raman Spectra: Theory
Volume 112 Number 4 July-August 2007
Herbert S. Bennett
National Institute of Standardsand Technology,Gaithersburg, MD 20899-8120
In this paper, we present the theory for cal-culating Raman line shapes as functions ofthe Fermi energy and finite temperaturesin zinc blende, n-type GaAs for donor den-sities between 1016 cm–3 and 1019 cm–3.Compared to other theories, this theory isunique in two respects: 1) the many-bodyeffects are treated self-consistently and 2)the theory is valid at room temperature forarbitrary values of the ratio R = (Q2/α ),where Q is the magnitude of the normal-ized wave vector and α is the normalizedfrequency used in the Raman measure-ments. These calculations solve the chargeneutrality equation self-consistently for atwo-band model of GaAs at 300 K thatincludes the effects of high carrier concen-trations and dopant densities on the per-turbed densities of states used to calculatethe Fermi energy as a function of tempera-ture. The results are then applied to obtainthe carrier concentrations from Fermienergies in the context of line shapes inRaman spectra due to the coupling
between longitudinal optical phonons andplasmons. Raman measurements havebeen proposed as a non-destructivemethod for wafer acceptance tests of carri-er density in semiconductor epilayers. Theinterpretation of Raman spectra to deter-mine the majority electron density in n-type semiconductors requires an interdisci-plinary effort involving experiments, theo-ry, and computer-based simulations andvisualizations of the theoretical calcula-tions.
Key words: complex dielectric responsefunction; compound semiconductors; elec-tron densities; line shape; non-destructiveand contactless measurements; Ramanspectra.
Accepted: August 17, 2007
Available online: http://www.nist.gov/jres

called coupled longitudinal optical (LO) phonon-plas-mon modes) provides information on transport proper-ties of the electron gas in polar semiconductors [4-8].The frequencies ω of the coupled modes are propor-tional to carrier concentrations, and the peak widths ∆ωof the coupled modes are proportional to the scatteringrates due to electron-phonon interactions. The qualita-tive determination of carrier concentration and mobili-ty, which is inversely proportional to the scattering rate,from Raman spectra is reasonably straightforwardbased on these proportionalities. The quantitative deter-mination of carrier concentrations and mobilitiesrequires more sophisticated modeling of the spectra.Many of these higher level models involve fitting thespectra with the Fermi energy as a parameter and thendetermining the carrier concentration from knowing thefitted Fermi energy [6].
Most interpretations of Raman measurements oncompound semiconductors such as GaAs require phys-ical models and associated input parameters thatdescribe how carrier densities vary with dopant concen-trations and Fermi energies. In this paper, we developthe theory for extracting electron densities from Ramanmeasurements of n-type GaAs at room temperature. Weintroduce two main classes of models that relate carrierconcentrations to the Fermi energy for a given temper-ature and donor dopant density:a) Bandgap narrowing (BGN) models based on twoequivalent bands at the Γ point in the first Brilluoinzone, andb) Parabolic densities of states (PDOS) models withand without a quartic term in the electron energy dis-persion EcΓ (k) for the Γ conduction sub-band, where kis the wave vector.
The BGN models include many-body quantumeffects and bandgap narrowing. The many-body quan-tum effects describe the electron-electron, electron-hole, and dopant ion-carrier interactions. The resultsare unique in two respects: 1) the many-body effectsare treated self-consistently and 2) the theory is valid atroom temperature for arbitrary values of the ratio R =(Q2/α), where Q is the magnitude of the normalizedwave vector and α is the normalized frequency used inthe Raman measurements. Other reported work eitheris valid at low temperatures near 0 K for arbitrary ratios(Q2/α) [4] or is valid at arbitrary temperatures for ratiosR typically R 1 [5-7].
2. Theory
Because the Fermi energy is one of the variables forcalculating line shapes in the Raman spectra from semi-conductors, we first present in Sec. 2.1 the theory forthe BGN and PDOS models by which numerical meth-ods give closed-form analytic expressions that relatecarrier concentrations to Fermi energy EF , temperatureT, and donor dopant densities ND . Then, within the con-text of these BGN and PDOS models, we develop inSec. 2.2 the theory for calculating the line shapesobserved in Raman spectra.
2.1 Fermi Energy and Electron Density
The temperature and donor dopant density are theindependent input parameters for evaluating the Ramanline shape factor given in Eq. (19). The Fermi energydepends in turn on the dopant density, in this case thedonor density ND and T. For given ND and T, we pres-ent here models to compute the Fermi energy with fullFermi-Dirac statistics for the carriers at finite tempera-ture. By using these models, we calculate the majorityelectron density as a function of the Fermi energy inzinc blende, n-type GaAs for donor densities between1016 cm–3 and 1019 cm–3. These calculations solve thecharge neutrality equation self-consistently in terms oftwo main classes of models: the bandgap narrowing(BGN) model and three different parabolic densities ofstates (PDOS) models.
Some researchers propose that Raman spectra maybe a way to determine temperatures with spatial resolu-tions across wafers on the order of micrometers whenthe Fermi energy and dopant density are known fromother independent measurements. Comparing theresults given by the BGN and PDOS models, which aredescribed below, also provides predictions on the sen-sitivity of the Fermi energy and Raman spectrum tovariations in temperature.
2.1.1 BGN Model
The bandgap narrowing (BGN) model is a two-bandmodel with one equivalent conduction band and oneequivalent valence band at the Γ point in Brilluoinspace. The BGN model is related to earlier work on n-type GaAs [9] and includes modifications to the densi-ties of states due to high concentrations of dopants,bandgap narrowing, and many-body effects associatedwith carrier-carrier interactions (carrier-carrierexchange and correlation). This BGN model is fullyself-consistent and uses the Klauder self-energy (fifth
Volume 112, Number 4, July-August 2007Journal of Research of the National Institute of Standards and Technology
210

level of approximation) to calculate the distorted-per-turbed densities of states for the carriers. This BGNmodel has the following main features:1) Many-body quantum effects of carrier-carrier inter-actions and carrier-dopant ion interactions, bandgapnarrowing, and distorted-perturbed densities of statesfor the carriers [9],2) Iterative and self-consistent solutions of the coupledcharge neutrality equation and Klauder’s fifth level ofapproximation for the renormalized self-energy propa-gator from which the distorted-perturbed densities ofstates are calculated,3) Full Fermi-Dirac statistics for the carriers at finitetemperature, and4) Statistical analyses to give closed-form analyticexpressions from very large, calculated data sets forcarrier densities as functions of the Fermi energy.Tables 1 and 2 contain the input parameters for theBGN calculations in Ref. [9] and for the BGN modelgiven here.
The electron n and hole h concentrations in units ofcm–3 at thermal equilibrium are given, respectively, by
(1)
where ρC (E) and ρV (E) are, respectively, the electrondensity of states for the equivalent conduction band andthe hole density of states for the equivalent valenceband [9], where f0(E) = 1 + exp[(E – EF)/kBT]–1 is theFermi-Dirac distribution function. The calculationsincorporate the Thomas-Fermi expression for thescreening radius,
(2)
and the charge neutrality condition
(3)
to compute self-consistently the Fermi energy EF andthe screening radius rs for given values of the ionizeddopant concentration NI and temperature T. The staticdielectric constant is ε and the permittivity of free spaceis ε0. The ionized dopant concentration is positive for n-type material (donor ions) and negative for p-typematerial (acceptor ions). The results reported here arefor n-type material. For the case discussed here, NI =ND. The results for the screening radius rs are notreported here because they are not needed to extractcarrier concentrations from Raman scattering measure-ments.
Volume 112, Number 4, July-August 2007Journal of Research of the National Institute of Standards and Technology
211
Table 1. Fundamental Constants
Parameter Symbol Value Units
Planck’s constant 6.5836 × 10⁻¹⁶ eV·sBoltzmann’s constant kB 8.6174 × 10⁻⁵ eV/Kelectron rest mass m0 9.1072 × 10⁻²⁸ gelectronic charge e –4.802 × 10⁻¹⁰ esuBohr radius aB 0.5291 × 10⁻⁸ cmenergy associated with 1 Rydberg e2/2aB 13.6 eVspeed of light c 2.9979 × 1010 cm/swave length associated with 1 eV [λ0] 1.2396 × 10⁻⁴ cmwave number associated with 1 eV [k0] 8.0668 × 103 cm–1
dielectric constant in vacuum ε 8.854 × 10⁻¹² F/m
Table 2. BGN model input parameters for intrinsic zinc blende GaAs at 300 K. The energies of the extrema of the con-duction and valence sub-bands are referenced to the bottom of the conduction sub-band at the Γ symmetry point in theBrillouin zone of the reciprocal lattice space. The mass of the free electron is m0. These GaAs data are from Ref. [12].
Parameter Symbol Value Units
bandgap EG = |–EvΓ | 1.424 eVeffective mass for conduction band (2-band model) density of states mC 0.067 m0effective mass for valence band (2-band model) density of states mV 0.572 m0number of equivalent conduction bands NC 1number of equivalent valence bands NV 1
0 C 0 V( ) ( )d and [1 ( )] ( )d ,n f E E E h f E E Eρ ρ+∞ +∞
−∞ −∞= = −∫ ∫
22 0
s C V0
d ( )4 [ ( ) ( )]d ,df Eer E E E
Eπ ρ ρεε
+∞
−∞= − −∫
I ,N n h= −

2.1.2 PDOS Models
The PDOS models use parabolic densities of statesfor all equivalent bands and sub-bands. Unlike theBGN model in Ref. [9], PDOS models such as the four-band PDOS model for GaSb in Ref. [10] do not includemodifications to the densities of states due to many-body effects and high concentrations of dopants andcarriers because of computational limitations associat-ed with treating a four-band model in the context of theKlauder self-energy method (fifth level of approxima-tion).
The zero of energy is at the minimum energy value(bottom) of the conduction Γ sub-band, EcΓ 0 = 0.0. Thebottoms of the conduction L and X sub-bands are,respectively, at EcL and EcX. The maximum energy value(top) of the degenerate valence Γ sub-band is –EG,where EG is the intrinsic bandgap of GaAs. The split-offvalence sub-band at Γ due to spin-orbit coupling is neg-lected. The probabilities for typical holes in equilibri-um to occupy appreciably these states in the split-offvalence sub-band at Γ are very low. This means that theFermi energies should be sufficiently above the valencesub-band maximum at Γ. Placing exact limits on theFermi energies for which the PDOS models are validwould be tenuous, because knowledge of how the vari-ous sub-bands move relative to one another due to thedopant concentrations considered here and due to many
body effects is not adequate. Table 3 lists the inputparameters for the PDOS models.
The heavy hole mass mhh and light hole mass mlh forthe two degenerate sub-bands at the top of the valenceband are combined to give an effective mass
(4)
for the valence topmost sub-band, which becomes theequivalent valence band with a hole energy dispersiongiven by EνΓ (k) ≈ – EG – ( 2k2/2mνΓ m0).
The general expression for the parabolic densities ofstates for electrons and holes per band extrema and perspin direction is given by
(5)
where Ne is the number of equivalent ellipsoids in thefirst Brillouin zone, the volume of the unit cell is V =aL
3, aL is the lattice constant, m* is one of the effectivemasses listed in Tables 2 and 3 for the appropriate bandextrema, and m0 is the free electron mass.
We sub-divide the PDOS models into the PDOS2,PDOS2NPG, and PDOS4 models. All three PDOSmodels include the equivalent valence band describedby Eq. (4).
Volume 112, Number 4, July-August 2007Journal of Research of the National Institute of Standards and Technology
212
Table 3. PDOS model input parameters for intrinsic zinc blende GaAs at 300 K. The energies of the extrema of the conduction and valence sub-bands are referenced to the bottom of the conduction sub-band at the Γ symmetry point in the Brillouin zone of the reciprocal lattice space. Themass of the free electron is m0. These GaAs data are from Refs. [11,12].
Parameter Symbol Value Units
bandgap EG = |–EvΓ | 1.424 eVbottom of the conduction L sub-band EcL 0.29 eVbottom of the conduction X sub-band EvX 0.48 eVtop of the degenerate valence Γ sub-band –EvΓ 1.424 eVspin-orbit splitting –Eso 0.34 eVtop of the split-off (spin-orbit splitting) valence Γ sub-band –EsoΓ = –EvΓ – Eso 1.764 eVeffective mass of conduction Γ sub-band mcΓ 0.063 m0non-parabolicity factor (quartic term prefactor) for conduction Γ sub-band ξ 0.824transverse L sub-band mass mtL 0.075 m0longitudinal L sub-band mass mlL 1.9 m0effective mass of conduction L sub-band mcL = (mlL mtL
2)1/3 0.222 m0transverse X sub-band mass mtX 0.19 m0longitudinal X sub-band mass mlX 1.9 m0effective mass of conduction X sub-band mcX = (mlX mtX
2)1/3 0.409 m0light hole mass of valence Γ sub-band mlh 0.082 m0heavy hole mass of valence Γ sub-band mhh 0.51 m0effective mass of valence Γ sub-band mvΓ 0.53 m0splitoff band mass of the valence sub-band at Γ mso 0.15 m0number of equivalent conduction L sub-bands NcL 4number of equivalent conduction X sub-bands NcX 3
3/ 2 3/ 2 2 / 3hh lh( ) ,m m m= +vÃ
e3 2 3/ 2
0
4( ) ,
(8 )( / 2 * )N V EE
m mπρ
π=
PDOS2 Model
The PDOS2 model uses one equivalent conductionband and one equivalent valence band at the Γ symme-try point in the Brilluoin space for the integrals thatappear in Eqs. (1) to (3). The electron energy dispersionfor the equivalent conduction band is EcΓ(k) ≈ EcΓ 0 +( 2k2/2mCm0).
PDOS2NPG Model
The PDOS2NPG model is a two-band model withone equivalent conduction band and one equivalentvalence band at the Γ point in Brilluoin space. It has nobandgap narrowing, but it includes the non-parabolici-ty for the electron energy dispersion in the equivalentconduction band at Γ. According to Ref. [11], we mayinclude non-quadratic |k|l terms in the electron energydispersion EcΓ(k) for the conduction Γ sub-band inGaAs when k is small, namely,
(6)
where ξ is the non-parabolicity factor. We use the Kanethree level k·p model [11], which does not include theconduction sub-bands at L and X, to include quarticterms in E(k) with l = 4.
PDOS4 Model
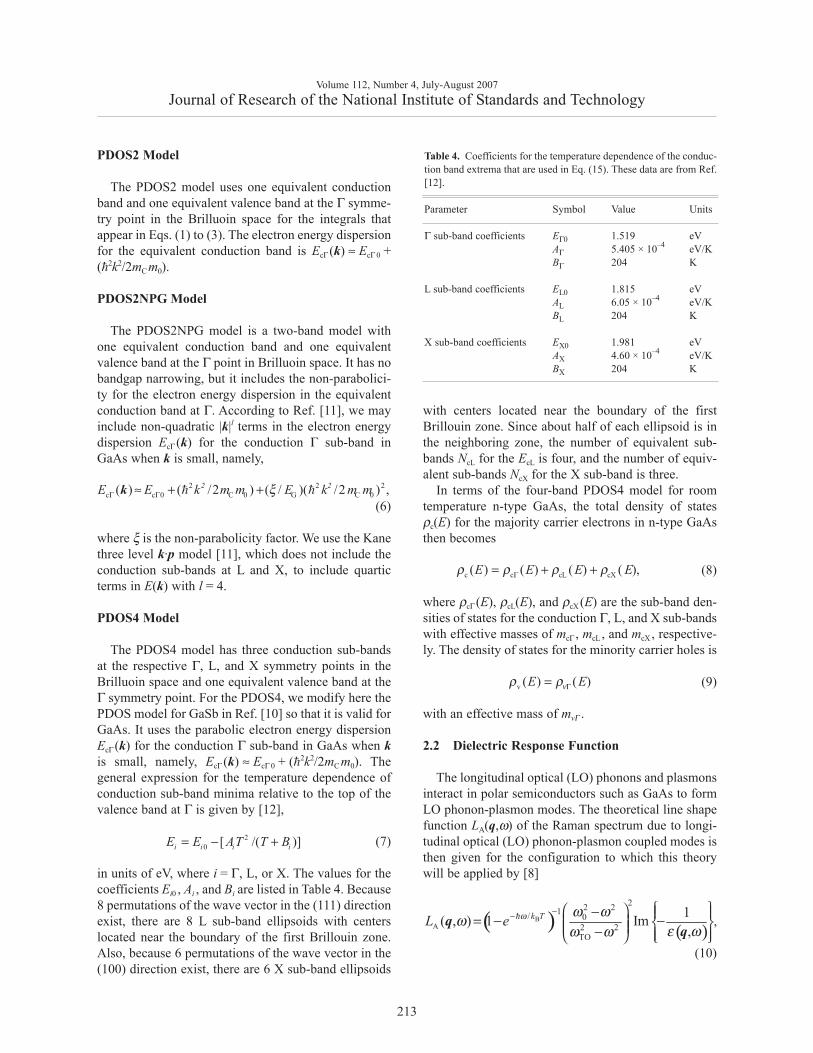
The PDOS4 model has three conduction sub-bandsat the respective Γ, L, and X symmetry points in theBrilluoin space and one equivalent valence band at theΓ symmetry point. For the PDOS4, we modify here thePDOS model for GaSb in Ref. [10] so that it is valid forGaAs. It uses the parabolic electron energy dispersionEcΓ(k) for the conduction Γ sub-band in GaAs when kis small, namely, EcΓ (k) ≈ EcΓ 0 + ( 2k2/2mC m0). Thegeneral expression for the temperature dependence ofconduction sub-band minima relative to the top of thevalence band at Γ is given by [12],
(7)
in units of eV, where i = Γ, L, or X. The values for thecoefficients Ei0 , Ai , and Bi are listed in Table 4. Because8 permutations of the wave vector in the (111) directionexist, there are 8 L sub-band ellipsoids with centerslocated near the boundary of the first Brillouin zone.Also, because 6 permutations of the wave vector in the(100) direction exist, there are 6 X sub-band ellipsoids
with centers located near the boundary of the firstBrillouin zone. Since about half of each ellipsoid is inthe neighboring zone, the number of equivalent sub-bands NcL for the EcL is four, and the number of equiv-alent sub-bands NcX for the X sub-band is three.
In terms of the four-band PDOS4 model for roomtemperature n-type GaAs, the total density of statesρc(E) for the majority carrier electrons in n-type GaAsthen becomes
(8)
where ρcΓ(E), ρcL(E), and ρcX(E) are the sub-band den-sities of states for the conduction Γ, L, and X sub-bandswith effective masses of mcΓ , mcL , and mcX , respective-ly. The density of states for the minority carrier holes is
(9)
with an effective mass of mvΓ .
2.2 Dielectric Response Function
The longitudinal optical (LO) phonons and plasmonsinteract in polar semiconductors such as GaAs to formLO phonon-plasmon modes. The theoretical line shapefunction LA(q,ω) of the Raman spectrum due to longi-tudinal optical (LO) phonon-plasmon coupled modes isthen given for the configuration to which this theorywill be applied by [8]
(10)
Volume 112, Number 4, July-August 2007Journal of Research of the National Institute of Standards and Technology
213
2 2 2c c 0 C 0 G C 0( ) ( /2 ) ( / )( /2 ) ,2 2E E k m m E k m mξΓ Γ≈ + +k
20 [ /( )]i i i iE E AT T B= − +
Table 4. Coefficients for the temperature dependence of the conduc-tion band extrema that are used in Eq. (15). These data are from Ref.[12].
Parameter Symbol Value Units
Γ sub-band coefficients EΓ0 1.519 eVAΓ 5.405 × 10⁻⁴ eV/KBΓ 204 K
L sub-band coefficients EL0 1.815 eVAL 6.05 × 10⁻⁴ eV/KBL 204 K
X sub-band coefficients EX0 1.981 eVAX 4.60 × 10–4 eV/KBX 204 K
c c cL cX( ) ( ) ( ) ( ),E E E Eρ ρ ρ ρΓ= + +
v ( ) ( )E Eνρ ρ Γ=
( ) ( )B
A
22 21/ 02 2TO
,1( , ) 1 Im,
k TL e ω ω ωωε ωω ω
−− ⎧ ⎫⎛ ⎞ ⎪ ⎪⎜ ⎟ ⎨ ⎬⎜ ⎟ ⎪ ⎪⎝ ⎠ ⎩ ⎭
−= − −−

where q is the scattering wave vector, ω is the Ramanangular frequency shift, is the Planck constant, kB isthe Boltzmann constant, T is the temperature in Kelvin,ω0 = ωTO(1 + CFH)1/2 is a parameter with the dimensionsof angular frequency, CFH is the dimensionless Faust-Henry coefficient which includes the LO/transverseoptical (TO) phonon scattering ratio, and ωTO is the TOphonon angular frequency. Table 5 contains values forthe parameters in Eq. (10). The total longitudinaldielectric response function ε (q,ω) in the randomphase approximation (RPA) is described by
(11)
where the dielectric susceptibility χVE is the contribu-tion from valence electrons, χL(ω) is the contributionfrom the polar lattice phonons, and χe(q,ω) is the con-tribution from the conduction electrons. The high fre-quency dielectric constant ε∞ is defined to be ε∞ = 1 +4πχVE . Equation (11) then becomes for a binary semi-conductor,
(12)
The contribution of the polar lattice is given by [8]
(13)
when phonon damping may be neglected and whereωLO is the LO phonon angular frequency.
Within the context of the RPA, the Lindhard expres-sion [13] gives the electronic contribution to the dielec-
tric response function 4πχe0(q,ω) that describes light
scattering by the conduction electrons in doped semi-conductors. We introduce the collision relaxation timeτ that describes the losses associated with electron-phonon and electron-dopant interactions and the corre-sponding angular collision frequency Γ = τ–1. Mermin[14] showed that replacing ω with ω + iΓ in theLindhard expression for 4πχe
0(q,ω) fails to conservethe number of local electrons and therefore is not thecorrect way to include collision broadening in4πχe
0(q,ω). Instead, Mermin assumed that within theframework of a relaxation time approximation the elec-tron-phonon and electron-dopant interactions relax theelectron density matrix to a local equilibrium densitymatrix [4,14]. He then obtained the followingLindhard-Mermin relation [14] for χe(q,ω),
(14)
where the Lindhard expression χe0(q,ω + iΓ ) for elec-
trons occupying states in a single equivalent conductionband is given by,
(15)
Volume 112, Number 4, July-August 2007Journal of Research of the National Institute of Standards and Technology
214
Table 5. Dielectric response function input parameters for intrinsic zinc blende GaAs at 300 K. The energiesof the extrema of the conduction and valence sub-bands are referenced to the bottom of the conduction sub-band at the Γ symmetry point in the Brillouin zone of the reciprocal lattice space. The mass of the free elec-tron is m0. These GaAs data are from Ref. [14].
Parameter Symbol Value Units
lattice constant aL 5.65 × 10⁻⁸ cmstatic dielectric constant ε0 13.1high frequency dielectric constant ε∞ 10.9longitudinal optical (LO) phonon energy ωLO 0.0353 eV
285 cm–1
transverse optical (TO) phonon energy ωTO 0.0332 eV268 cm–1
Energy associated with the angular collision frequency Γ Γ ~0.0124 eVdue to electron-phonon and electron-dopant ion interactions ~100 cm–1
Faust-Henry coefficient CFH –0.4effective mass for the single equivalent conduction mC 0.067 m0band density of states in Eq. (6)
VE L e( , ) 1 4 4 ( ) 4 ( , ),ε ω πχ πχ ω πχ ω= + + +q q
L e( , ) 4 ( ) 4 ( , ).ε ω ε πχ ω πχ ω∞= + +q q
2 2LO TO
L 2 2TO
4 ( ) ,ω ωπχ ω εω ω∞
⎛ ⎞−= ⎜ ⎟⎜ ⎟−⎝ ⎠
( ) ( ) ( )( ) ( )
0 0e e
e 0 0e e
( ) ,0 ,, ,
,0 ,i i
i iω Γ χ χ ω Γ
χ ωωχ Γχ ω Γ
+ +=
+ +q q
qq q
( )2
0e 02 2
12 2 2
C 0 C 0
12 2 23
C 0 C 0
4 , ( )
( )2
( ) d ,2
ei f Eq
q im m m m
q im m m m
πχ ω Γπ
ω Γ
ω Γ
−
−
+ = ∫
⎡⎛ ⎞⋅⎢ + − +⎜ ⎟⎢⎝ ⎠⎣
⎤⎛ ⎞⋅ ⎥+ − + +⎜ ⎟⎥⎝ ⎠ ⎦
q
q k
q k k
××

where f0(E) = 1 + exp[(E – EF)/kBT]–1 is the Fermi-Dirac distribution function, EF is the Fermi energy ineV, and T is the temperature in Kelvin.
The integrand in Eq. (15) is independent of theazimuthal angle ϕ so that,
where µ = cosθ, dµ = –sinθ, and q·k = qkµ. To simplifyEq. (15) further, we introduce the following dimension-less normalized quantities: Q = qaB, K = kaB, K(E) =
, and Ω2 = (ω + iΓ )mC /13.6 eVwhere (e2/2aB) = ( 2/2m0aB
2) = 13.6 eV. Equation (15)then becomes with these definitions the followingexpression,
(16)
Performing analytically the angular integration over µgives the complex results
(17)
where ρ± = Q2 ± 2QK – α, τ± = Q2 ± 2QK + α,η± = –sign(ρ±)arctan(γ /ρ±) – (π /2)[1 – sign(ρ±)],σ± = +sign(τ±)arctan(γ /τ±) + (π /2)[1 – sign(τ±)],Ω2 = α + iγ, α = ( ωmC /13.6 eV), γ = ( ΓmC /13.6 eV),and –π ≤ arctan(ψ) ≤ π.
When the temperature T = 0, the Fermi functionf0(E) = (1 + exp[(13.6 eV K2/mC) – EF/kBT])–1 is theunit step function. Then, the integral in Eq. (17)
K2dK(...) is K2dK(...), and an analytic evaluationis possible [4], where . But,when T is room temperature, analytic evaluations arenot possible. Researchers approximated the integral
K2dK(...) at finite temperatures by expanding its inte-grand in terms of the ratio R = (Q2/α) for either verysmall or large R. However, such expansions do not cap-ture all of the spectral information in Eq. (17).
The theoretical line shape function LA(q,ω) of theRaman spectrum then becomes
(18)
where
and
The Lindhard-Mermin relation Eq. (14) then givesexpressions for χre(q,ω + iΓ ) = Reχe(q,ω + iΓ ) andχie(q,ω + iΓ ) = Imχe(q,ω + iΓ ) as functions ofχre
0(q,ω + iΓ ) = Reχe0(q,ω + iΓ ) and χie
0(q,ω + iΓ )= Imχe
0(q,ω + iΓ ). Even though the factors in Eqs.(10) and (18) give the contributions to the Raman lineshape for each scattering mechanism, an examinationof only the factor
(19)
gives the spectral information for extracting the Fermienergy. The denominator in Eq. (19) is given by theexpression,
(20)
Section 3 below contains the procedures for extractingelectron densities from the Fermi energies.
3. Numerical Results – Electron Densityand Fermi Energy
Because the Fermi energy is one of the variables forcalculating the Raman line shape, we give the numeri-
Volume 112, Number 4, July-August 2007Journal of Research of the National Institute of Standards and Technology
215
( ) ( )2 12 2
0 0 0 0 1d sin d d 2 d dk k ... k k ...
π πθ θ ϕ π µ
∞ ∞
−=∫ ∫ ∫ ∫ ∫
2 20 C B(2 / )m m a E
( )
( )( ) ( )
0e
2C2 0
1 12C F B1
1 12 2 2 2
4 ,4
d
d 1 exp[(13.6 eV / ) / ]
2 2 .
im K KQ
K m E k T
Q QK Q QK
πχ ω Γ
π
µ
µ µ
∞
−
−
− −
+
=
+ −
⎡ ⎤+ − Ω + − + Ω⎣ ⎦
∫
∫
q
××
( )
( )
0e
12CC F B3 0
2 2 2 2
2 2 2 2
4 ,2
d 1 exp[(13.6 eV / ) / ]
ln ln ( ) ( ) ,
im K K K m E k TQ
i i
πχ ω Γ
π
ρ γ τ γ η η σ σρ γ τ γ
∞ −
+ ++ − + −
− −
+
= + −
⎡ ⎤⎛ ⎞ ⎛ ⎞+ ++ + − + −⎢ ⎥⎜ ⎟ ⎜ ⎟+ +⎢ ⎥⎝ ⎠ ⎝ ⎠⎣ ⎦
∫
q
××
0
∞
∫
0
∞
∫
F
0
K
∫F C F /13.6 eVK m E=
( )B
A22 21
0 i2 2 2 2TO r i
/ ( , ) ,( , ) ( , )
( , )
1 k T
L
e ω ε ωε ω ε ω
ω
ω ωω ω
−− ⎛ ⎞ ⎧ ⎫⎜ ⎟ ⎨ ⎬⎜ ⎟ +⎩ ⎭⎝ ⎠
−= −−
qq q
q
( )i
2 2r i
( , ),
( , ) ( , )1Im,
ε ωε ω ε ωε ω
⎧ ⎫ ⎧ ⎫⎪ ⎪ =⎨ ⎬ ⎨ ⎬+⎩ ⎭⎪ ⎪⎩ ⎭− q
q qq
2 2
LO TOr 2 2
TO
re
( , ) Re ( , )
4 ( , ),i
ω ωε ω ε ω ε
ω ωπχ ω Γ
∞
⎧ ⎫−= = ⎨ ⎬−⎩ ⎭
+ +
q q
q
i ie( , ) Im ( , ) 4 ( , ).iε ω ε ω πχ ω Γ= = +q q q
( ) 2 2r i
2 2 2TO ie
2r
( , )1Im( , ) ( , ),
( ) 4 ( , )( , )
i
iD i
ε ωε ω ε ωε ω
ω ω πχ ω Γω Γ
⎧ ⎫ ⎧ ⎫⎪ ⎪− =⎨ ⎬ ⎨ ⎬+⎩ ⎭⎪ ⎪⎩ ⎭⎧ ⎫− +
= ⎨ ⎬+⎩ ⎭
qq qq
2 2 2 2 2r LO TO
2 2 2 2LO TO ie
2 2 2 2TO re
2ie
( , ) ( )
2 ( )( )4 ( , )
( ) [4 ( , )
4 ( , ) ].
D i
i
i
i
ω Γ ε ω ωε ω ω ω ω πχ ω Γω ω πχ ω Γ
πχ ω Γ
∞
∞
+ = −
+ − − +
+ − +
+ +

cal results for calculating the Fermi energy in terms ofthe BGN and PDOS models and the analytic expres-sions that relate the carrier concentrations to the Fermienergy.
3.1 BGN Model
We solve self-consistently, by means of an iterativeprocedure, Eq. (3) with the distorted-perturbed carrierdensities of states ρC(E) and ρV(E) from Ref. [9] usedin the numerical integrations for n and h given by Eq.(1). The ρC(E) and ρV(E) are in tabular form and haveboth localized and continuum states. Their associatedband edges contain the many body effects related toexchange and correlation. The independent variablesare the temperature T and donor density ND. The Fermienergy is varied for a given temperature until Eq. (3) issatisfied to within an error of plus or minus 10–3 × ND.
Numerical fitting procedures then give a closed-formanalytic expression for the dependence of carrier con-centration nBGN on the Fermi energy EF ; namely,
(21)
During the fitting analyses, we rely substantially ongraphics and keep the number of fitting parameters to aminimum, subject to the constraint that the residualstandard deviation Sres is acceptably small; i.e., Sres ≤0.01. The standard deviation is a measure of the “aver-age” error by which a fitted model represents a set ofdata points and thereby is a metric for assessing thequality of the fit. A smaller Sres indicates a better fit. Theresidual standard deviation for a model Y f = f (Z) is
(22)
where Yj are the calculated data values, the are thepredicted values from the fitted model, N is the totalnumber of data points (here N = 28), and P is the totalnumber of parameters to be fitted in the model. We usethe NIST-developed DATAPLOT [15] software forboth the exploratory graphics and for the statisticalanalyses.
In addition, we compare the above BGN modelresults with an equivalent two-band PDOS2 model forwhich there is no bandgap narrowing and for which thetabular carrier densities of states ρC(E) and ρV(E) fromRef. [9] are replaced with
(23)
The corresponding polynomial fit for the carrier con-centration n0 versus Fermi energy EF relation is thendenoted by
(24)
Figure 1 compares the calculated carrier concentra-tion nBGN and n0 data for 28 values of donor densitiesbetween 1016 cm–3 and 1019 cm–3. For a given Fermienergy, the electron densities predicted by the BGNmodel (solid-black curve) are typically factors of twosmaller than the electron densities predicted by anequivalent parabolic two-band model (dashed-bluecurve).
3.2 PDOS Models
We solve self-consistently, by means of an iterativeprocedure, Eq. (3) with Eq. (5). The independent vari-ables are the temperature T and donor density ND.
We give here the results for fitting the logarithm tothe base 10 of the total electron density and the electron
Volume 112, Number 4, July-August 2007Journal of Research of the National Institute of Standards and Technology
216
310 BGN
2BGN0 BGN1 BGN2 BGN F
log ( cm )
... ... .lF F l
n
a a E a E a E= + + + +
f 2res
1
[ ( ) /( )],N
jjj
S Y Y N P=
= − −∑
Figure 1. The calculated electron density nBGN from the BGN modelas a function of Fermi energy for n-type GaAs at 300 K is given bythe solid-black curve. The calculated electron density n0 from thetwo-band PDOS2 model, no bandgap narrowing model, as a functionof Fermi energy for n-type GaAs at 300 K is given by the dashed-blue curve. The Fermi energy is relative to the majority conductionband edge at the Γ symmetry point in the first Brillouin zone.
fjY
CC 3 2 3/ 2
C 0
VV 3 2 3/ 2
V 0
4( ) and
(8 )( / 2 )
4( ) , respectively.
(8 )( / 2 )
N V EEm m
N V EEm m
πρπ
πρπ
=
=
3 210 0 00 01 F 02 F 0 Flog ( cm ) ... ... .l
ln a a E a E a E= + + + +

densities in each of the three conduction sub-bands atΓ, L, and X, nΓ , nL , and nX, respectively, to polynomi-als in EF , namely,
(25)
(26)
(27)
(28)
Figures 2 and 3 give the calculated electron densitiesas functions of the Fermi energy. The corresponding fit-ted curves are not shown in Figs. 2 and 3 because thepairs of curves (calculated and fitted) for each of theelectron densities nt , nΓ , nL , and nX, lie on top of oneanother to within the line widths of each curve. Also,since the screening radii for the carriers from Eq. (2)are not needed when interpreting the proposed meas-urements considered here, the corresponding screeningradii are not presented in this paper. Figure 2 comparesthe results from the PDOS2 model (dashed-blue curvewith long spaces), PDOS2NPG model (solid-greencurve), and PDOS4 model (dashed-red curve with short
spaces). The data for the blue curve in Fig. 1 is the samedata for the blue curve in Fig. 2. Figure 3 shows theresults for the four-band PDOS4 model. Unlike GaSb,most of the electrons are in the conduction sub-band atΓ . The conduction sub-band at L is only weakly popu-lated at the highest Fermi energies, and the conductionsub-band at X is negligible.
3.3 Polynomial Fits – Closed-Form AnalyticExpressions
Tables 6 to 11 give the fitting parameters for polyno-mial fits to log10(nBGN cm3), log10(n0 cm3), log10(nt cm3),log10(nΓ cm3), log10(nL cm3), and log10(nX cm3) as shown,respectively, in Eqs. (21) and (24) to (28) and the cor-responding residual standard deviations Sres. In general,the values of Sres decrease monotonically with increas-ing number l of terms in these polynomials. But, caremust be taken to avoid fitting noise in data sets. Thegeneral guideline for many data sets is that when thet-ratio (i.e., the absolute value of the ratio of the esti-mated parameter value divided by its estimated stan-dard deviation) is less than about 2, then the rate ofdecrease in Sres with increasing l tends to decrease, andproceeding with higher l values probably is not war-ranted. Because the changes in values of Sres betweenl = 4 and l = 5 are not experimentally significant, weuse the fitting parameters for the quartic case l = 4 inEqs. (21) and (24). Similary, because the changes invalues of Sres between l = 3 and l = 4 are not experimen-
Volume 112, Number 4, July-August 2007Journal of Research of the National Institute of Standards and Technology
217
3 210 t t0 t1 F t2 F t Flog ( cm ) ... ...,l
ln a a E a E a E= + + + +
3 210 0 1 F 2 F Flog ( cm ) ... ...,l
ln a a E a E a EΓ Γ Γ Γ Γ= + + + +
3 210 L L0 L1 F L2 F L Flog ( cm ) ... ..., andl
ln a a E a E a E= + + + +
3 210 X X0 X1 F X2 F X Flog ( cm ) ... ... .l
ln a a E a E a E= + + + +
Figure 2. Comparisons among three PDOS models with and with-out the non-parabolic factor ξ in Eq. (5) for the electron energy dis-persion EcΓ (k). The solid-green curve shows the results for an equiv-alent two-band model that has one equivalent Γ conduction bandwith non-parabolicity factor ξ and one equivalent Γ valence band;that is, the PDOS2NPG model. The dashed-blue curve with longspaces shows the results for an equivalent parabolic two-band modelPDOS2 (ξ = 0). The dashed-red curve short spaces shows the resultsfor the four-band PDOS4 model. The Fermi energy is relative to themajority conduction band edge at the Γ symmetry point in the firstBrillouin zone.
Figure 3. The calculated electron densities nt , nΓ , nL , and nX fromthe four-band PDOS4 model as functions of the Fermi energy for n-type GaAs at 300 K. The Fermi energy is relative to the majority con-duction band edge at the Γ symmetry point in the first Brillouin zone.

Volume 112, Number 4, July-August 2007Journal of Research of the National Institute of Standards and Technology
218
Table 6. Bandgap narrowing BGN model for log10(nBGN cm3). The five fitting parameters for a quar-tic polynomial fit Eq. (21) of the theoretical calculation for the equivalent conduction band electrondensity in n-type, zinc blende GaAs at 300 K as a function of the Fermi energy relative to the bottomof the equivalent conduction band at Γ. This quartic polynomial fit, which represents the theoreticalresults for Eq. (3), is valid only when –0.067 eV ≤ EF ≤ 0.286 eV. The t-ratio is the absolute value ofthe estimated fitting parameter |aBGNi| divided by its estimated standard deviation. The residual stan-dard deviation is Sres = 0.0130.
Fitting parameter Estimated value Estimated standard Units t-ratiodeviation
aBGN0 17.3292 0.4191 × 10⁻² 4.135 × 10³
aBGN1 13.1545 0.7646 × 10⁻¹ eV–1 1.72 × 10²
aBGN2 –37.4789 1.473 eV–2 25.45aBGN3 26.5678 12.86 eV–3 2.067aBGN4 53.7760 29.43 eV–4 1.827
Table 7. Two-band, no bandgap narrowing PDOS2 model for log10(n0 cm3). The five fitting parame-ters for a quartic polynomial fit Eq. (24) of the theoretical calculation for the L sub-band electron den-sity in n-type, zinc blende GaAs at 300 K as a function of the Fermi energy relative to the bottom ofthe conduction Γ sub-band. This quartic polynomial fit, which represents the theoretical results for Eq.(3), is valid only when –0.0974 eV ≤ EF ≤ 0.250 eV. The t-ratio is the absolute value of the estimatedfitting parameter |a0i| divided by the its estimated standard deviation. The residual standard deviationis Sres = 0.0122.
Fitting parameter Estimated value Estimated standard Units t-ratiodeviation
a00 17.5156 0.3411 × 10⁻² 5.136 × 10³
a01 12.8520 0.8063 × 10⁻¹ eV–1 3.1 × 10²
a02 –34.5783 0.6672 eV–2 51.83a03 –27.3728 9.166 eV–3 2.986a04 223.720 29.54 eV–4 7.573
Table 8. Four-band PDOS4 model for total electron density log10(nt cm3). The four fitting parametersfor a cubic polynomial fit Eq. (25) of the theoretical calculation for the total electron density in n-type,zinc blende GaAs at 300 K as a function of the Fermi energy relative to the bottom of the conductionΓ sub-band. This cubic polynomial fit, which represents the theoretical results for Eq. (3), is valid onlywhen –0.0974 eV ≤ EF ≤ 0.229 eV. The t-ratio is the absolute value of the estimated fitting parameter|ati| divided by its estimated standard deviation. The residual standard deviation is Sres = 0.0234.
Fitting parameter Estimated value Estimated standard Units t-ratiodeviation
at0 17.5198 0.6519 × 10⁻² 2.687 × 10³
at1 12.3461 0.9401 × 10⁻¹ eV–1 1.31 × 10²
at2 –35.5542 1.322 eV–2 26.90at3 40.1630 6.488 eV–3 6.190

Volume 112, Number 4, July-August 2007Journal of Research of the National Institute of Standards and Technology
219
Table 9. Four-band PDOS4 model for electron density in the Γ sub-band log10(nΓ cm3). The four fit-ting parameters for a cubic polynomial fit Eq. (26) of the theoretical calculation for the Γ sub-bandelectron density in n-type, zinc blende GaAs at 300 K as a function of the Fermi energy relative to thebottom of the conduction Γ sub-band. This cubic polynomial fit, which represents the theoretical resultsfor Eq. (3), is valid only when –0.0974 eV ≤ EF ≤ 0.229 eV. The t-ratio is the absolute value of the esti-mated fitting parameter |a Γ i| divided by its estimated standard deviation. The residual standard devia-tion is Sres = 0.0214.
Fitting parameter Estimated value Estimated standard Units t-ratiodeviation
aΓ0 17.5187 0.5978 × 10⁻² 2.930 × 10³
aΓ1 12.3944 0.8621 × 10⁻¹ eV–1 1.438 × 10²
aΓ2 –35.1795 1.212 eV–2 29.03aΓ3 33.7647 5.950 eV–3 5.675
Table 10. Four-band PDOS4 model for electron density in the L sub-band log10(nL cm3). The four fit-ting parameters for a cubic polynomial fit Eq. (27) of the theoretical calculation for the L sub-bandelectron density in n-type, zinc blende GaAs at 300 K as a function of the Fermi energy relative to thebottom of the conduction Γ sub-band. This cubic polynomial fit, which represents the theoretical resultsfor Eq. (3), is valid only when –0.0974 eV ≤ EF ≤ 0.229 eV. The t-ratio is the absolute value of the esti-mated fitting parameter |aLi| divided by its estimated standard deviation. The residual standard devia-tion is Sres = 0.001 17.
Fitting parameter Estimated value Estimated standard Units t-ratiodeviation
aL0 14.2422 0.3269 × 10⁻³ 4.357 × 10⁴
aL1 16.8180 0.4714 × 10⁻² eV–1 3.568 × 10³
aL2 0.162418 0.6627 × 10⁻¹ eV–2 2.451aL3 –2.1988 0.3253 eV–3 6.759
Table 11. Four-band PDOS4 model for the electron density X sub-band log10(nX cm3). The four fit-ting parameters for a cubic polynomial fit Eq. (28) of the theoretical calculation for the X sub-bandelectron density in n-type, zinc blende GaAs at 300 K as a function of the Fermi energy relative to thebottom of the conduction Γ sub-band. This cubic polynomial fit, which represents the theoretical resultsfor Eq. (3), is valid only when –0.0974 eV ≤ EF ≤ 0.229 eV. The t-ratio is the absolute value of the esti-mated fitting parameter |aXi| divided by its estimated standard deviation. The residual standard devia-tion is Sres = 0.000 019 5.
Fitting parameter Estimated value Estimated standard Units t-ratiodeviation
aX0 11.2919 0.5452 × 10⁻⁵ 2.071 × 106
aX1 16.7999 0.7862 × 10⁻⁴ eV–1 2.137 × 105
aX2 –0.542 16 × 10–3 0.1105 × 10⁻² eV–2 0.4905aX3 –0.4041 × 10⁻² 0.5426 × 10⁻² eV–3 0.7448

tally significant, we use the fitting parameters for thecubic l = 3 case in Eqs. (25) to (28).
4. Conclusions
The foregoing theory for extracting electron densi-ties from Raman spectra is unique in two ways: 1) Ittreats the many-body effects self-consistently, and 2) itis valid at room temperature for arbitrary values of theratio R = (Q2/α). When high concentrations of carriersexists, this theory and its associated numerical proce-dures for determining carrier concentrations fromFermi energies are necessary for interpreting room tem-perature Raman spectra self-consistently for arbitraryvalues of the ratio R, even for R ≈ 1. The BGN modelspresented here include many-body quantum effects andbandgap narrowing. However, obtaining Fermi ener-gies from experimental Raman spectra is beyond thescope of the present paper and involves the followingsteps to implement contactless measurements of carrierdensities:1) Numerical evaluation of Eq. (17) with adaptivegrids to treat the integrable singularities of the inte-grands,2) Three-dimensional visualization of computer resultsfor predicted Raman line shapes as functions of Fermienergy and frequency, and3) Iteration of the predicted Raman line shape with theFermi energy as a variation parameter to give the bestself-consistent fit to the measured Raman line shape.
Acknowledgments
The author acknowledges many discussions withJames Maslar concerning physical models for interpret-ing Raman measurements. He thanks Alan Heckert forguidance in using DATAPLOT and James Filliben forhelp in obtaining the closed-form analytic expressionsfor carrier densities from numerical tabulations of the-oretical calculations. He benefited substantially fromhaving access to computers in the NIST InformationTechnology Laboratory (ITL) and from support givenby other ITL staff members, particularly, HowardHung, Judith Terrill, and James Sims.
5. References
[1] 2003 International Technology Roadmap for Semiconductors,International SEMATECH, Austin, Texas, http://www.itrs.net/Links/2003ITRS/Home2003.htm.
[2] 2004 iNEMI Technology Roadmaps, International ElectronicsManufacturing Initiative, Inc., Herndon, VA, http://www.inemi.org/cms/roadmapping/2004_iNEMI_Roadmap.html.
[3] Chemical Industry R&D Roadmap for Nanomaterials byDesign: From Fundamentals to Function, December 2003,Chemical Industry Vision 2020 Technology Partnership,Baltimore, MD, http://www.chemicalvision2020.org/nanomaterialsroadmap.html.
[4] S. Ernst, A. R. Goñi, K. Syassen, and M. Cardona, PlasmonRaman Scattering and Photoluminescence of Heavily Doped n-type InP Near the Γ-X Crossover, Phys. Rev. B53, 1287 (1996).See Eq. (A4), p. 1291, therein.
[5] L. Artús, R. Cuscó, J. Ibáñez, N. Blanco, and G. González-Días,Raman Scattering by LO Phonon-Plasmon Coupled Modes inn-type InP, Phys. Rev. B60, 5456 (1999). See Eq. (5.4), p. 5462,therein.
[6] W. Richter, U. Nowak, H. Jürgensen, and U. Rössler, ElectronPlasma in a Non-Parabolic Conduction Band, Solid StateCommunications 67, 199 (1988). See Eq. (10), p. 201, therein.
[7] R. Cuscó, L. Artús, S. Hernández, J. Ibáñez, and M. Hopkinson,Raman Scattering by LO Phonon-Plasmon Coupled Modes inn-type In0.53Ga0.47As, Phys. Rev. B65, 035210-1 (2001).
[8] G. Abstreiter, M. Cardona, and A. Pinczuk, in Light Scatteringin Solids IV, Chapter 2 Light Scattering by Free CarrierExcitations in Semiconductors, edited by M. Cardona and G.Güntherodt, Springer, New York (1984) pp. 5-150, Eq. (2.108),p. 55 and references therein.
[9] H. S. Bennett, High Dopant and Carrier Concentration Effectsin Gallium Aluminum Arsenide: Densities of States andEffective Intrinsic Carrier Concentrations, J. Appl. Phys. 83,3102 (1998).
[10] H. S. Bennett and Howard Hung, Dependence of ElectronDensity on Fermi Energy in N-Type Gallium Arsenide, J. Res.Natl. Inst. Stand. Technol. 108, 193 (2003).
[11] J. S. Blakemore, Semiconducting and Other Major Properties ofGallium Arsenide, J. Appl. Phys. 53, R123 (1982).
[12] M. E. Levinshtein and S. Rumyantsev, in Handbook Series onSemiconductor Parameters, Volume I, edited by M.Levinshtein, S. Rumyantsev, and M. Shur, World ScientificPublishing, Singapore (1996) Capter 4, pp. 77-103.
[13] T. Lindhard, On The Properties of a Gas of Charged Particles,Dan. Mat. Fys. Medd. 28 8, 1 (1954).
[14] N. D. Mermin, Lindhard Dielectric Function in the Relaxation-Time Approximation, Phys. Rev. B1, 2362 (1970).
[15] J. J. Filliben and A. N. Heckert, the DATAPLOT software forgraphics and detailed statistical analyses runs on both UNIXand WINTEL platforms. It has both command-line versions andgraphical user interface (GUI) versions. It is available by down-loading from http://www.itl.nist.gov/div898/software/dataplot/.In addition, the NIST-SEMATECH Engineering StatisticsHandbook at http://www.itl.nist.gov/div898/handbook/ is basedin part on DATAPLOT. This latter website has tutorials thatexplain in some detail the statistical analysis methods used inthis paper.
About the authors: Herbert S. Bennett is a NISTFellow in the Semiconductor Electronics Division ofthe Electronics and Electrical Engineering Laboratory.He is a Life Fellow of the Institute of Electrical andElectronics Engineers and a Fellow of the AmericanPhysical Society. His research interests include
Volume 112, Number 4, July-August 2007Journal of Research of the National Institute of Standards and Technology
220

improved understanding, metrology, and standards fornanoelectronics, optoelectronics, and magnetic materi-als and assessing the quality of digital images such asthose used in medical imaging. He is active with inter-national industrial consensus building for technologyroadmaps on semiconductors and with internationalstandards development for nanoelectrotechnology. TheNational Institute of Standards and Technology is anagency of the U.S. Department of Commerce.
Volume 112, Number 4, July-August 2007Journal of Research of the National Institute of Standards and Technology
221