11.75 mm - ocbc bank reports/2011/ocbc 2011... · ocbc bank is the longest established singapore...
TRANSCRIPT

Oversea-Chinese Banking Corporation Limited(Incorporated in Singapore)
Company Registration Number: 193200032W
Annual Report 2011
Oversea-C
hin
ese Ban
king
Co
rpo
ration
Limited
An
nu
al Rep
ort 2011
11.7
5 m
m

OCBC Bank is the longest established Singapore bank, formed in 1932 from the merger of three local banks, the oldest of which was
founded in 1912. It is now the second largest financial services group in Southeast Asia by assets and one of the world’s most highly-rated
banks, with an Aa1 rating from Moody’s. It was ranked by Bloomberg Markets as the world’s strongest bank in 2011.
OCBC Bank and its subsidiaries offer a broad array of specialist financial services, ranging from consumer, corporate, investment, private and
transaction banking to treasury, insurance, asset management and stockbroking services.
OCBC Bank’s key markets are Singapore, Malaysia, Indonesia and Greater China. It has a network of over 500 branches and representative
offices in 15 countries and territories, including more than 400 branches and offices in Indonesia that are operated by its subsidiary,
Bank OCBC NISP.
OCBC Bank’s insurance subsidiary, Great Eastern Holdings, is the largest insurance group in Singapore and Malaysia by assets. Its asset
management subsidiary, Lion Global Investors, is one of the largest private sector asset management companies in Southeast Asia. Private
banking services are provided by subsidiary Bank of Singapore, which continued to gain industry recognition in 2011 including being voted
“Outstanding Private Bank in Asia Pacific“ by Private Banker International.
For more information, please visit www.ocbc.com
BOARD OF DIRECTORS
Dr Cheong Choong Kong
Chairman
Mr Bobby Chin
Mr David Conner
Mrs Fang Ai Lian
Mr Lai Teck Poh
Mr Lee Seng Wee
Dr Lee Tih Shih
Mr Colm McCarthy
Professor Neo Boon Siong
Dato’ Ooi Sang Kuang
Mr Quah Wee Ghee
Mr Pramukti Surjaudaja
Dr Teh Kok Peng
Mr Patrick Yeoh
NOMINATING COMMITTEE
Mrs Fang Ai Lian
Chairman
Dr Cheong Choong Kong
Mr Lai Teck Poh
Mr Lee Seng Wee
Professor Neo Boon Siong
EXECUTIVE COMMITTEE
Dr Cheong Choong Kong
Chairman
Mr Bobby Chin
Mr David Conner
Mr Lee Seng Wee
Mr Patrick Yeoh
AUDIT COMMITTEEMr Bobby Chin
Chairman
Mr Colm McCarthy
Professor Neo Boon Siong
REMUNERATION COMMITTEE
Mrs Fang Ai Lian
Chairman
Dr Cheong Choong Kong
Dr Lee Tih Shih
Professor Neo Boon Siong
RISK MANAGEMENT COMMITTEE
Mr Patrick Yeoh
Chairman
Dr Cheong Choong Kong
Mr David Conner
Mr Lai Teck Poh
Mr Colm McCarthy
Mr Pramukti Surjaudaja
SECRETARY
Mr Peter Yeoh
REGISTERED OFFICE
65 Chulia Street
#09-00 OCBC Centre
Singapore 049513
Tel: (65) 6318 7222 (Main Line)
Fax: (65) 6533 7955
Email: [email protected]
Website: www.ocbc.com
SHARE REGISTRATION OFFICE
M & C Services Private Limited
138 Robinson Road #17-00
The Corporate Office
Singapore 068906
Tel: (65) 6228 0505
AUDITORS
KPMG LLP
16 Raffles Quay #22-00
Hong Leong Building
Singapore 048581
Tel: (65) 6213 3388
PARTNER IN CHARGE OF THE AUDIT
Ms Lee Sze Yeng
(Year of Appointment: 2011)
Corporate Profile
Corporate Information
Design & Produced by: Sedgwick RichardsonPrinted by: Medialink Printing Services Pte Ltd
Contents
OUR VALUES
CustomersWe listen to our customers and understand their needs. We build enduring relationships with them by delivering superior products and quality service.
PeopleWe treat each other fairly and with respect. We support our colleagues and invest in their development to help them realise their full potential. We recognise and reward outstanding performance.
TeamworkWe, as team members, actively support each other across the organisation as we work towards our common purpose. As individuals, we expect total responsibility from ourselves.
IntegrityFair dealing is the basis of our business. We assume everything we do is in full public view.
Prudent Risk TakingWe are prudent risk takers because our customers rely on us for safety and soundness.
EffectivenessWe actively invest in infrastructure, process improvement and skills to lower our delivery costs. We do the right things right the first time, on time, every time.
OUR PURPOSE
We help individuals and businesses across communities achieve their aspirations by providing innovative financial services that meet their needs.
Our Purpose & Our Values Inside Front Cover
Letter to Shareholders 04Financial Highlights 08Board of Directors 10Principal Officers 14New Horizons III 182011 Report Card 19Operations Review 21Corporate Social Responsibility 28Corporate Governance 33Additional Information Required under
the SGX-ST Listing Manual 44Capital Management 45Risk Management 47Basel II Pillar 3 Risk Disclosure 57Financial Report 61 Management Discussion and Analysis
Financial Statements
Group’s Major Properties
Ordinary/Preference Shareholding Statistics 175Investor Reference 180Further Information on Directors 182International Network 187Financial Calendar 189Notice of Annual General Meeting 190Proxy Form 195
Corporate Profile and Information Inside Back Cover
11.7
5 m
m

Leveraging Group Synergies
Focused, relentless execution of our strategy over the past ten years has built OCBC into a comprehensive and integrated financial services Group spanning commercial banking, insurance, asset management, securities brokerage and private banking. With our unique combination of business capabilities and geographic footprint, we are in a good position to harness the potential synergies across our Group entities to deliver superior value to our customers, our employees and our shareholders.
We are leveraging on the expertise of the various entities within the Group to design and deliver better products and services for our customers, as well as to broaden our relationships with our customers.
We continue to invest in our people, helping them develop their capabilities by providing diverse and enriching opportunities to build their careers within the Group.
We continue to strive to deliver superior returns for our shareholders, as we further strengthen the collaboration within the Group to enhance operational effectiveness.

JOB POSTINGS
TRAINING
5-year CAGR: Core EPS 11%, DPS 10%
DesignCustomer
Deployment
Implementation
JOB POSTING
TRAINING
Singapore
Malaysia
Indonesia
China
Velocity@ocbc ATMsJOB POSTINGS
TRAINING
5-year CAGR: Core EPS 11%, DPS 10%
DesignCustomer
Deployment
Implementation
JOB POSTING
TRAINING
Singapore
Malaysia
Indonesia
China
Velocity@ocbc ATMs
JOB POSTINGS
TRAINING
5-year CAGR: Core EPS 11%, DPS 10%
DesignCustomer
Deployment
Implementation
JOB POSTING
TRAINING
Singapore
Malaysia
Indonesia
China
Velocity@ocbc ATMs
2 OCBC Annual Report 2011
We launched OCBC’s cash management platform, Velocity@ocbc, in Indonesia for OCBC NISP’s corporate clients, achieving improvements in service levels. We linked our ATMs in Singapore, Malaysia and Indonesia, providing our customers with greater convenience region-wide.
Strong collaboration across the Group has enabled OCBC to deliver differentiated products and services to our customers.
Based on customer insights, we launched a unique unit trust, LionGlobal New Target Return Fund, with Lion Global Investors.
Bringing greater value to customers

JOB POSTINGS
TRAINING
5-year CAGR: Core EPS 11%, DPS 10%
DesignCustomer
Deployment
Implementation
JOB POSTING
TRAINING
Singapore
Malaysia
Indonesia
China
Velocity@ocbc ATMs
JOB POSTINGS
TRAINING
5-year CAGR: Core EPS 11%, DPS 10%
DesignCustomer
Deployment
Implementation
JOB POSTING
TRAINING
Singapore
Malaysia
Indonesia
China
Velocity@ocbc ATMs
3OCBC Annual Report 2011
Improving operational effectiveness
We continued to provide our employees a broad range of career paths and development opportunities.
We aligned our internal job posting programmme across the Group to facilitate cross-fertilisation of talent across different businesses and geographies.
We continued to ensure our employees succeed in their new assignments by providing them appropriate training and development programmes.
We continued to leverage the product and distribution strengths of Great Eastern and OCBC to successfully maintain our top position in bancassurance in Singapore for 10 years. We established structures and tools to help generate customer referrals across the Group, delivering compelling business propositions. We further consolidated our Group corporate resources, such as data centres, to deliver significant cost savings.
LEVERAGINGGROUP SyNERGIESIN 2011
Investing in our people
Letter to Shareholders
“Over the past decade, we expanded our regional footprint and wealth management businesses significantly with major acquisitions. The improvements that we made in systems and processes, particularly in risk management, the organisational changes, and the emphasis on employee engagement, product innovation and quality and service excellence have not only eased our passage through some difficult periods, but have also firmly established us as a major regional financial services provider, one of the two largest banks in Southeast Asia by market capitalisation.”
4 OCBC Annual Report 2011

Financial services firms in the US and Europe faced a challenging
operating environment in 2011 and banks in Asia were not
unaffected. Optimism for a continuing economic recovery in
the early part of the year was replaced by fears of a widespread
slowdown arising from a confluence of concerns over US fiscal
problems, sovereign indebtedness in Europe and a possible hard
landing in China. These factors caused significant volatility in the
global financial markets. Asia saw economic growth moderating
in many countries after the sharp recovery in 2010. GDP growth
in Singapore was 4.9%, significantly lower than 14.5% in the
previous year, while the Malaysian economy grew by 5.1%, a slower
pace than the 7.2% of a year ago. China’s economy expanded by
9.2%, also slower than the 10.3% seen in 2010. Our other key
market, Indonesia, achieved healthy economic growth of 6.5%,
up from 6.1% a year ago, as its domestic-oriented economy
remained relatively resilient.
PERFORmANCE REVIEw
Despite volatile global financial markets, our customer franchise
continued to show healthy growth in 2011 and the Group
delivered a solid set of results. We achieved broad-based loan
growth, strong increase in our fee income and continued growth in
our life insurance business.
For the full year, our Group net profit grew 3% to S$2,312 million.
Minus the gain from the divestment of a non-core property in
Singapore, our core net profit was S$2,280 million, compared
with S$2,253 million in 2010. Based on core earnings, our return
on equity was 11.1%, compared with 12.1% in the previous year.
Earnings per share was 64.8 cents, a decrease from 66.1 cents in
2010, reflecting the strong acceptance of our scrip dividend offers
over the past few years.
Net interest income grew 16% to a new record of S$3,410 million,
contributed by strong growth in interest-earning assets. Our net
interest margin declined by 12 basis points to 1.86%, primarily
due to the low interest rate environment and solid growth in
lower-risk loans. Loans were up 27% for the year, with broad-based
contributions from both the corporate and consumer customer
segments across our key markets.
Non-interest income of S$2,212 million (excluding the above-
mentioned divestment gain) was 7% lower than the previous year,
as robust growth in our customer-related income was offset by the
adverse impact of volatile financial markets on trading income and
life insurance profits. Fee and commission income grew 16% to a
record S$1,137 million, contributed mainly by wealth management
income and trade-related fees. Treasury income from customer
flows grew 48% to S$324 million, as we continued to develop
innovative products and increased cross-selling of products. Trading
income declined 46% to S$217 million, and life insurance profits
declined 13% to S$383 million, both resulting from challenging
financial market conditions.
Operating expenses were well-managed, increasing 8% to
S$2,430 million. We expanded our staff strength by 6% to
support the expansion of our franchise; the balance of the cost
increase was largely attributable to salary increments and higher
costs associated with increased business volumes.
Our asset quality remained healthy, as reflected by our non-performing
loans (“NPL”) ratio, which was flat at 0.9% year-on-year. Our total
non-performing assets (“NPA”, which include assets other than
loans) increased S$229 million to S$1,437 million. The increase
in NPAs was mainly for substandard accounts which are well-
collateralised. Net allowances increased from S$134 million to
S$221 million despite gross specific allowances declining 23%
from the prior year. This was largely attributable to higher portfolio
allowances in line with loan growth, and lower recoveries and
write-backs.
We continued to maintain a strong capital position, with Tier 1 and
total capital adequacy ratios of 14.4% and 15.7%, respectively, as
of 31 December 2011. These ratios were well above the regulatory
minimum of 6% and 10% respectively. Our Core Tier 1 ratio, the
computation of which excluded Tier 1 preference shares, was 11.4%.
Customer businesses in our key subsidiaries continued their
healthy growth. Great Eastern Holdings (“GEH”) achieved 10%
growth in new business weighted premiums and 20% growth in
new business embedded value. The results reflected strong sales
growth across markets, with solid contributions from both the
bancassurance and agency channels, as well as GEH’s focus on
sales of regular premium and protection-based products. GEH’s
net profit contribution to the Group, however, was lower at S$297
million in 2011, down from S$405 million in 2010, as a result of
mark-to-market losses in the Non-participating Fund.
OCBC Bank (Malaysia) Berhad reported 6% growth in full year net
profit to MYR749 million (S$307 million). Revenue growth was
achieved in all areas - net interest income, Islamic finance income
and non-interest income. Expenses increased 14% as we expanded
our branch network and upgraded our capabilities and systems.
Loan growth of 20% was broad-based across industry sectors, and
the NPL ratio improved to 2.6% from 2.8%.
Bank OCBC NISP’s net profit increased 80% to IDR753 billion
(S$108 million) for 2011, boosted by synergies from the merger
with Bank OCBC Indonesia. Net interest income grew 13%
year-on-year with robust loan growth of 31%, while non-interest
income grew 16%. Overall revenue growth was underpinned
by the broader market coverage of the merged entity, improved
product capabilities and stronger collaboration with other
subsidiaries within the Group. If the one-time merger expense
of IDR204 billion (S$31 million) in 2010 was excluded, expenses
would have risen by 23% in 2011. Asset quality improved, with
the NPL ratio dropping to 1.3% from 2.0% a year ago.
5OCBC Annual Report 2011

Letter to Shareholders
Bank of Singapore ended the year with assets under management
of US$32 billion (S$41 billion), an increase of 19% year-on-year.
Bank of Singapore’s earning asset base, which included loans, grew
23% to US$40 billion (S$52 billion). Strong net inflow of fresh
funds was broad-based across Bank of Singapore’s major markets
of Southeast Asia, Greater China and customers from the Indian
Sub-continent. Headcount increased 20% in 2011 as we expanded
our team of relationship managers to meet the rapidly growing
demand for private banking services in Asia.
DIVIDENDS
The Board has recommended a final tax-exempt dividend of 15 cents
per share, bringing the full year 2011 total dividend to 30 cents per
share, unchanged from 2010. The dividend payout represents 45%
of core earnings, which meets our targeted payout ratio.
PROGRESS AGAINST NEw HORIzONS III STRATEGy
We launched our New Horizons III strategy in 2011. Progress of the
new strategy had been good with tangible achievements to show
in each of the main pillars:
Balanced Business Scorecard
We grew our customer base strongly across all segments – retail,
high net worth, corporates and SMEs – by continuing to
leverage on customer insights in designing better products and
delivering a differentiated experience for customers. Our innovation
index, measured by the ratio of revenues from new products
to total revenues, rose to 8% from 6% in the previous year.
We retained our focus in strengthening our risk management
capabilities, particularly in support of our expansion overseas.
At a time when many depositors and investors worldwide were
concerned about the financial soundness of banks, we were
pleased to receive industry recognition with a credit rating upgrade
by S&P to AA- from A+, and by being named the World’s
Strongest Bank (Bloomberg Markets) and the 25th safest bank
globally (Global Finance).
Customer Experience
We continued to build our capabilities in the areas of market
research, experience design and customer service. To improve our
customers’ experience in their dealings with us, we revamped our
written communications in several areas, simplifying documents
for ease of comprehension. We launched our new on-line banking
platform, which provided a user-friendly and jargon-free interface
for customers, introduced a paperless account opening process
in the branches, and reduced the cycle time for processing and
disbursement of various loans to customers. To position ourselves
with the Gen-Y customer segment, we launched a new banking
experience – “FRANK by OCBC”, which was designed around the
needs and preferences of youths and young adults.
Deeper Presence in malaysia, Indonesia and Greater China
Outside Singapore, we continued to expand our distribution
network and capabilities in Malaysia by adding two branches and
increasing our Emerging Business and Bumiputra sales force in
order to take market share. In Indonesia, we completed the merger
between Bank OCBC Indonesia and Bank OCBC NISP, and the
resulting operational synergies have improved the bottom-line.
OCBC NISP has also rolled out their Emerging Business Model
nationwide after seeing strong results from the implementation
in Jakarta and other key metro-cities. In China, we expanded our
branch and sub-branch network to 16, and now serve customers
in eight cities across the country. We have recently received
approval to commence preparation for a new branch in a ninth city,
Shaoxing, located in Zhejiang Province. We have further tightened
the coordination between our businesses across Greater China,
including Hong Kong and Taiwan, to effectively capitalise on the
emerging opportunities in the region.
Leveraging Group Synergies
Our unique combination of geographic footprint and business
capabilities offers us the opportunity to further harness the
potential synergies among various entities across the Group.
This enables us to deepen as well as widen our relationships with
customers, and further differentiates OCBC from our competitors.
During the year, we achieved good momentum in cross-selling
between Group entities. There was greater focus on serving the
needs of network customers and providing them with a seamless
customer experience across geographies and business divisions.
We also enhanced operational efficiencies across our footprint
through the alignment of risk and compliance processes and
capabilities, and further rationalised our common infrastructure
and shared services. To facilitate cross-fertilisation across businesses
and geographies, we offered more career opportunities to talented
individuals across the Group.
LEADERSHIP TRANSITION
After a distinguished career in banking, including 10 years in the
OCBC Group, David Conner will be stepping down as CEO in April
2012. Samuel Tsien, currently Senior Executive Vice-President and
Global Head, Global Corporate Bank, will succeed him as CEO.
Under David’s leadership, we expanded our regional footprint
and wealth management businesses significantly with major
acquisitions. Over the past decade the improvements that we
made in systems and processes, particularly in risk management,
the organisational changes, and the emphasis on employee
engagement, product innovation and quality and service excellence
have not only eased our passage through some difficult periods,
but have also firmly established us as a major regional financial
services provider, one of the two largest banks in Southeast Asia by
market capitalisation.
6 OCBC Annual Report 2011

The appointment of Sam to succeed David as CEO underscores
the Group’s emphasis on executive development and succession
planning. Having been a key member of the team that developed
our New Horizons III strategy, Sam is firmly committed to executing
it successfully and we are confident that our regional franchise will
continue to grow with Sam as CEO.
LOOkING AHEAD
The operating environment is expected to remain challenging in 2012,
with the global economy likely to decelerate further. The European
sovereign debt crisis and sub-par growth in the US may further
dampen Asian markets. Growth in our key markets is expected to
be slower: Singapore is expected to grow at 1-3%, while Malaysia
and Indonesia are expected to grow at rates of 4-6% and 6-7%,
respectively. The Chinese economy is forecast to grow at a slower
rate of 7-8%.
Nonetheless, we continue to see opportunities to invest in our
network, and leverage synergies across the Group to better serve
our customers.
ACkNOwLEDGEmENTS
The Board extends a warm welcome to Dr Teh Kok Peng, formerly
the President of GIC Special Investments Pte Ltd, who joined us
in August 2011 as an Independent Director. We also welcome
Dato’ Ooi Sang Kuang, former Deputy Governor and a member
of the Board of Directors of Bank Negara Malaysia, and Mr Quah
Wee Ghee, former Managing Director and President of GIC Asset
Management Pte Ltd. Both gentlemen joined the Board in the first
quarter of 2012.
We wish to thank our other fellow Board members for their
consistent support, counsel and guidance. We acknowledge
and commend our staff for their dedication and contribution in
bringing the Group to where it is today. We would also like to
express our gratitude to our shareholders and customers for their
unwavering support.
Mr Patrick Yeoh Khwai Hoh, who has served on the Board of
Directors for 10 years, has indicated that he does not wish to seek
re-election at the 2012 Annual General Meeting. We thank him for
his invaluable contributions during his term of office.
7OCBC Annual Report 2011
CHEONG CHOONG kONGChairman
17 February 2012
DAVID CONNERChief Executive Officer

Financial year ended 31 December 2011 2010 2009 2008 2007
Income statements (S$ million)
Total income 5,661 5,325 4,815 4,427 4,281
Operating expenses 2,430 2,254 1,796 1,854 1,680
Operating profit 3,231 3,071 3,019 2,573 2,601
Amortisation of intangible assets 61 55 47 47 47
Allowances for loans and impairment of other assets 221 134 429 447 36
Profit before tax 2,955 2,880 2,543 2,085 2,539
Profit attributable to equity holders of the Bank 2,312 2,253 1,962 1,749 2,071
Cash basis profit attributable to equity holders of the Bank (1) 2,373 2,308 2,009 1,796 2,118
Balance sheets (S$ million)
Non-bank customer loans (net of allowances) 133,557 104,989 80,876 79,808 71,316
Non-bank customer deposits 154,555 123,300 100,633 94,078 88,788
Total assets 277,758 229,283 194,300 181,385 174,607
Assets, excluding life assurance fund investment assets 228,670 181,797 151,223 142,508 133,471
Total liabilities 252,368 205,638 172,521 162,825 157,768
Ordinary shareholders' equity 20,675 18,894 17,075 13,978 14,782
Total equity attributable to the Bank's shareholders 22,571 20,790 18,971 15,874 15,678
Per ordinary share
Basic earnings (cents) 65.8 66.1 59.4 54.6 65.9
Cash earnings (cents) (1) 67.6 67.8 60.9 56.1 67.4
Net interim and final dividend (cents) (2) 30.0 30.0 28.0 28.0 28.0
Net asset value (S$)
Before valuation surplus 6.02 5.66 5.29 4.51 4.79
After valuation surplus 7.04 7.09 6.33 5.18 6.46
Ratios (%)
Return on ordinary shareholders' equity 11.3 12.1 12.2 11.8 14.8
Return on assets (3) 1.11 1.32 1.35 1.23 1.66
Dividend cover (times) 2.17 2.18 2.09 1.95 2.35
Cost to income 42.9 42.3 37.3 41.9 39.2
Capital adequacy ratio (4)
Tier 1 14.4 16.3 15.9 14.9 11.5
Total 15.7 17.6 16.4 15.1 12.4
(1) Excludes amortisation of intangible assets.(2) Dividends are stated net of tax, where relevant. With effect from the 2007 final dividend, the Group’s dividends are on a tax exempt basis.(3) The computation of return on average assets does not include life assurance fund investment assets.(4) 2008 to 2011 capital adequacy ratios are computed under the Basel II framework, in accordance with MAS Notice 637 to Banks.
Financial Highlights
Group Five-Year Financial Summary
8 OCBC Annual Report 2011

Total Income (S$ million)
Return on Assets (%)
Operating Expenses (S$ million)
Assets, Excluding Life AssuranceFund Investment Assets (S$ million)
Net Dividend Per Share (cents)
Tier 1 CAR (%)
Operating Profit (S$ million)
Ordinary Shareholders’ Equity(S$ million)
Return on OrdinaryShareholders’ Equity (%)
Total CAR (%)
Profit Attributable to Equity Holders of the Bank (S$ million)
Basic Earnings Per Share (cents)
+6%
+3%
-1%
-0.21
+8%
+26%
Unchanged
-1.9
+5%
+9%
-0.8
-1.9
4,281 4,4274,815
5,3255,661
2,071
1,749
1,962
2,253 2,312
65.9
54.659.4
66.1 65.8
1.66
1.231.35 1.32
1.11
1,6801,854 1,796
2,2542,430
133,471142,508
151,223
181,797
228,670
28.0 28.0 28.030.0 30.0
11.5
14.915.9 16.3
14.4
2,601 2,573
3,019 3,0713,231
14,78213,978
17,07518,894
20,675
14.8
11.8 12.2 12.111.3
12.4
15.116.4
17.6
15.7
FY 0
7FY
07
FY 0
7FY
07
FY 0
7FY
07
FY 0
7FY
07
FY 0
7FY
07
FY 0
7FY
07
FY 0
8FY
08
FY 0
8FY
08
FY 0
8FY
08
FY 0
8FY
08
FY 0
8FY
08
FY 0
8FY
08
FY 1
0FY
10
FY 1
0FY
10
FY 1
0FY
10
FY 1
0FY
10
FY 1
0FY
10
FY 1
0FY
10
FY 0
9FY
09
FY 0
9FY
09
FY 0
9FY
09
FY 0
9FY
09
FY 0
9FY
09
FY 0
9FY
09
F y 1
1Fy
11
Fy 1
1Fy
11
Fy 1
1Fy
11
Fy 1
1Fy
11
Fy 1
1Fy
11
Fy 1
1Fy
11
9OCBC Annual Report 2011

mRS FANG AI LIAN
Mrs Fang was first appointed to
the Board on 1 November 2008
and elected as a Director on
17 April 2009. She is presently
the Chairman of Great Eastern
Holdings Ltd and a Director of
several companies, including
Singapore Telecommunications
Ltd, Metro Holdings Ltd,
Banyan Tree Holdings Ltd and
MediaCorp Pte Ltd. She also
serves as a Member of several
institutions, including the Board
of Trustees of the Singapore
University of Technology and
Design. Mrs Fang was formerly
Chairman of Ernst & Young,
from which she retired after a
34-year career. She is a Fellow
of the Institute of Chartered
Accountants in England and
Wales and the Institute of
Certified Public Accountants of
Singapore, and a Member of the
Malaysian Institute of Certified
Public Accountants. Age 62.
DR CHEONG CHOONG kONG CHAIRMAN
Dr Cheong was first appointed to the Board on 1 July 1999 and last re-elected as a Director on 15 April 2011. On 1 July 2003, he was appointed Chairman, after having served as Vice Chairman from 26 March 2002 to 30 June 2003. Dr Cheong brings with him a wealth of experience gained in his extensive career, including 29 years at Singapore Airlines Ltd, where he last held the position of Deputy Chairman and Chief Executive Officer. He is a Director of several companies, including Great Eastern Holdings Ltd. Dr Cheong holds a Bachelor of Science with First Class Honours in Mathematics from the University of Adelaide, and a Master of Science and Ph.D. in Mathematics and (Honorary) Doctor of Science from the Australian National University. Age 70.
mR DAVID CONNERCHIEF EXECUTIVE OFFICER
Mr Conner was first appointed to the Board on 15 April 2002 and last re-elected as a Director on 16 April 2010. He has extensive banking experience in the Asia Pacific region, having worked for over 25 years with Citibank, N.A. where he served as Managing Director and Market Manager for Citibank Japan from 1999. He was also Chief Executive Officer of Citibank India from 1996 to 1999 and, prior to that, was Country Corporate Officer for Citibank’s Singapore operations. He is presently Chairman of Bank of Singapore Ltd, Singapore Island Bank Ltd and Lion Global Investors Ltd, a Member of the Corporate Governance Council of the Monetary Authority of Singapore (MAS) and serves as a Director of several companies, including Great Eastern Holdings Ltd, OCBC Bank (Malaysia) Berhad and OCBC Al-Amin Bank Berhad, as well as a Commissioner of PT Bank OCBC NISP Tbk. Mr Conner holds a Bachelor of Arts from Washington University in St. Louis and a Master of Business Administration from Columbia University. Age 63.
Board of Directors
mR BOBBy CHIN
Mr Chin was first appointed to the Board on 1 October 2005 and last re-elected as a Director on 17 April 2009. He is presently the Chairman of Singapore Totalisator Board and a member of the Council of Presidential Advisers of the Republic of Singapore. He serves on the board of several listed companies, including Neptune Orient Lines Ltd and Sembcorp Industries Ltd. He is also a Board Member of Singapore Labour Foundation, a Board Trustee of Singapore Indian Development Association and a Member of the Competition Commission of Singapore. Mr Chin was formerly the Managing Partner of KPMG Singapore, from which he retired in 2005 after a 30-year career. Mr Chin holds a Bachelor of Accountancy from the University of Singapore, is an Associate Member of the Institute of Chartered Accountants in England and Wales, and a Fellow of the Institute of Certified Public Accountants of Singapore. Age 60.
10 OCBC Annual Report 2011

DR LEE TIH SHIH
Dr Lee was first appointed to
the Board on 4 April 2003 and
last re-elected as a Director on
15 April 2011. He is presently
an Associate Professor at
the Duke University Medical
School in Durham, USA and
Duke-NUS Graduate Medical
School in Singapore. He has
previously served in senior
positions at both OCBC Bank
and the Monetary Authority
of Singapore. He is a Director
of Lee Foundation and
several Lee Rubber Group
Companies. Dr Lee graduated
with M.D. and Ph.D. degrees
from Yale University. He also
holds a Master of Business
Administration with Distinction
from Imperial College, London.
Age 48.
mR LAI TECk POH
Mr Lai was appointed to the
Board on 1 June 2010 and
elected as a Director on 15 April
2011. He served more than 20
years in OCBC Bank in several
senior capacities, including
Head of Corporate Banking,
Head of Information Technology
& Central Operations and Head
of Risk Management. He was
Head, Group Audit prior to
retiring in April 2010. Before
joining OCBC Bank, he was
Managing Director of Citicorp
Investment Bank Singapore
Ltd and had served stints with
Citibank N.A. in Jakarta, London
and New York. He is presently
a Director of AV Jennings Ltd,
WBL Corporation Ltd, OCBC
Bank (Malaysia) Berhad and
OCBC Al-Amin Bank Berhad,
and a Commissioner of PT
Bank OCBC NISP Tbk. Mr Lai
holds a Bachelor of Arts with
Honours from the University of
Singapore. Age 67.
mR LEE SENG wEE
Mr Lee was first appointed
to the Board on 25 February
1966 and last re-appointed as
a Director on 15 April 2011.
He was Chairman of OCBC
Bank from 1 August 1995 to
30 June 2003, and continues
to serve on the Board Executive
Committee and the Board
Nominating Committee. He is
presently Chairman of the Board
of Trustees of the Temasek
Trust and a Director of several
companies, including Great
Eastern Holdings Ltd, Lee Rubber
Group Companies and Lee
Foundation. Mr Lee holds a
Bachelor of Applied Science in
Engineering from the University
of Toronto and a Master of
Business Administration from
the University of Western
Ontario. Age 81.
mR COLm mCCARTHy
Mr McCarthy was first
appointed to the Board on 1
November 2008 and elected
as a Director on 17 April 2009.
He served for 29 years with
Bank of America where he last
held the position of President,
Bank of America, Asia, from
2001 to 2008. He had held
various key positions in Bank
of America, including Chief
Executive Officer of Singapore,
Head of South Asia and Head
of Southeast Asia, and was
a Board Member of Bank of
America’s legal entities in
Singapore, Malaysia, Hong
Kong and Japan. He is presently
a Director of Bank of Singapore
Ltd, Wheelock Properties (S)
Ltd and The Irish Chamber of
Commerce Singapore. He holds
a Bachelor of Commerce and
a Master of Business Studies
from University College Dublin.
Age 54.
11OCBC Annual Report 2011

PROFESSOR NEO BOON SIONG
Professor Neo was first
appointed to the Board on
1 January 2005 and last
re-elected as a Director on
16 April 2010. He is presently
a Professor at the Nanyang
Business School in Nanyang
Technological University,
Singapore, and serves as
a Director of k1 Ventures
Ltd. He holds a Bachelor of
Accountancy with Honours
from the National University
of Singapore and a Master of
Business Administration and
Ph.D. from the University of
Pittsburgh. Age 54.
mR PRAmUkTI SURJAUDAJA
Mr Pramukti was first appointed
to the Board on 1 June 2005
and last re-elected as a Director
on 15 April 2011. He has been
with PT Bank OCBC NISP Tbk for
23 years, holding key positions,
including President Director, and is
presently President Commissioner
of the bank. Mr Pramukti holds
a Bachelor of Science (Finance
& Banking) from San Francisco
State University, a Master of
Business Administration (Banking)
from Golden Gate University
and has participated in Special
Programs in International
Relations at the International
University of Japan. Age 49.
Board of Directors
mR QUAH wEE GHEE
Mr Quah Wee Ghee was
appointed to the Board on
9 January 2012. He is presently
an Advisor to the Government
of Singapore Investment
Corporation (GIC) Executive
Committee and the GIC
Investment Review Committee.
He is also Chairman of its India
and Natural Resources Business
Groups, and a Director of GIC
Asset Management Pte Ltd.
He also serves as a Director of
EDBI Pte Ltd, Great Eastern
Life Assurance Co Ltd,
Singapore Exchange Ltd
and SLF Strategic Advisers
Pte Ltd, the Chairman of the
Ministry of Health Holdings
Investment Committee, and
a Member of the Board
of Trustees of Singapore
University of Technology and
Design. He holds a Bachelor of
Engineering (Civil Engineering)
from the National University
of Singapore, is a Chartered
Financial Analyst, and Alumni
Member of the Stanford
Graduate Business School.
Age 50.
DATO’ OOI SANG kUANG
Dato’ Ooi Sang Kuang was
first appointed to the Board
on 21 February 2012. He was
Special Advisor in Bank Negara
Malaysia (BNM) until he
retired on 31 December 2011.
Prior to this, he was Deputy
Governor and Member of the
Board of Directors of BNM, from
2002 to 2010. Dato’ Ooi is at
present Chairman of Cagamas
Berhad (the national mortgage
corporation in Malaysia) and
its subsidiaries, and Malaysian
Electronic Clearing Corporation
Sendirian Berhad (subsidiary of
BNM). He holds a Bachelor of
Economics with Honours from
the University of Malaya and a
Master of Arts (Development
Finance) from Boston University,
USA, and is a Fellow Member
of the Institute of Bankers
Malaysia. Age 64.
12 OCBC Annual Report 2011

DR TEH kOk PENG
Dr Teh Kok Peng was appointed
to the Board on 1 August 2011.
He was President of GIC Special
Investments Pte Ltd, the private
equity arm of Government of
Singapore Investment Corporation
Pte Ltd (GIC). Prior to this, he was
concurrently Deputy Managing
Director of MAS and Deputy
Managing Director of GIC. He
began his career at the World Bank
under the Young Professionals
Program in Washington D.C.
Dr Teh is at present a Director
of GIC Special Investments Pte
Ltd and China International
Capital Corporation Ltd. He is
also a Member of the Urban
Redevelopment Authority Board,
Governing Board of the Lee Kuan
Yew School of Public Policy, Board
of Trustees of National University
of Singapore, The Trilateral
Commission, and Asia and Pacific
Department Advisory Group of
International Monetary Fund.
He holds a First Class Honours in
Economics at La Trobe University,
Melbourne, and a Doctorate in
Economics at Nuffield College,
Oxford University, England.
He attended the Advanced
Management Program at the
Harvard Business School. Age 64.
mR PATRICk yEOH kHwAI HOH
Mr Yeoh was first appointed to
the Board on 9 July 2001 and
last re-appointed as a Director
on 15 April 2011. He served
for more than 25 years at
Development Bank of Singapore
where he last held the position
of President and Director. He is
presently Chairman of Tuan Sing
Holdings Ltd and a Director of
Accuron Technologies Ltd. Mr Yeoh
holds a Bachelor of Science with
Honours from the University of
Malaya (Singapore). Age 74.
13OCBC Annual Report 2011

Principal Officers
mR DAVID CONNER CHIEF EXECUTIVE OFFICERMr David Conner was first appointed to the Board on 15 April 2002 and last re-elected as a Director on 16 April 2010. He has extensive banking experience in the Asia Pacific region, having worked for over 25 years with Citibank, N.A. where he served as Managing Director and Market Manager for Citibank Japan from 1999. He was also Chief Executive Officer of Citibank India from 1996 to 1999 and, prior to that, was Country Corporate Officer for Citibank’s Singapore operations. He is presently Chairman of Bank of Singapore Ltd, Singapore Island Bank Ltd and Lion Global Investors Ltd, a Member of the Corporate Governance Council of the Monetary Authority of Singapore (“MAS”) and serves as a Director of several companies, including Great Eastern Holdings Ltd, OCBC Bank (Malaysia) Berhad and OCBC Al-Amin Bank Berhad, as well as a Commissioner of PT Bank OCBC NISP Tbk. Mr Conner holds a Bachelor of Arts from Washington University in St. Louis and a Master of Business Administration from Columbia University. Age 63.
mR SAmUEL N. TSIEN GLOBAL CORPORATE BANKMr Samuel N. Tsien was appointed Senior Executive Vice President in July 2007 when he joined OCBC Bank. As Head of Global Corporate Bank, he has bankwide responsibilities for corporate, commercial and institutional banking, covering Singapore and all overseas countries. Since July 2008, he also oversees the International and Transaction Banking divisions. Mr Tsien has 34 years of banking experience and has held various senior management roles in corporate banking, retail banking and risk management at Bank of America and China Construction Bank. Prior to joining OCBC Bank, he was President and Chief Executive Officer of Bank of America (Asia) and China Construction Bank (Asia) Corporation respectively. He holds a Bachelor of Arts with Honours in Economics from the University of California, Los Angeles (“UCLA”). Age 57.
mR JEFFREy CHEw DIRECTOR AND CEO, OCBC BANK MALAYSIAMr Jeffrey Chew was appointed Executive Vice President in October 2006. He currently oversees the Group’s Malaysian business. He joined OCBC Malaysia in April 2003 initially as Head of the SME business and subsequently, as Head of Business Banking. Mr Chew began his career at PriceWaterhouseCoopers and subsequently joined Citibank in Malaysia where he held various roles over 12 years, including customer relationship management, risk management and international offshore banking and product management. A qualified accountant by training, he is a fellow member of the Chartered Association of Certified Accountants, UK. Age 46.
mR CHING wEI HONG GLOBAL CONSUMER FINANCIAL SERVICESMr Ching Wei Hong was appointed Senior Executive Vice President in April 2007 and is currently Head of Global Consumer Financial Services. He is responsible for building our consumer banking business in our key markets. In his tenure with OCBC Bank, he has held senior management responsibilities across various roles including Chief Financial Officer, Head of Group Operations and Technology and Head of Transaction Banking. Mr Ching has more than 26 years of experience in regional finance, corporate banking and cash management. Before joining OCBC, he was Director of Corporate Finance, Philips Electronics Asia Pacific Pte Ltd. He also held senior regional assignments in Bank of America and was Treasurer of Union Carbide Asia Pacific. Mr Ching holds a Bachelor of Business Administration from the National University of Singapore. Age 52.
mR LINUS GOH TI LIANG ENTERPRISE BANKING & FINANCIAL INSTITUTIONS –GLOBAL CORPORATE BANKMr Linus Goh Ti Liang was appointed Executive Vice President in April 2004 when he joined OCBC Bank as Head of International. Presently, as Global Head of Enterprise Banking and Financial Institutions, he has responsibility for our commercial banking and financial institutions businesses internationally. Mr Goh has over 25 years of banking experience, including 17 years at Citibank N.A. Singapore, where he held several senior positions overseeing corporate banking, financial institutions, e-business and transaction banking. Mr Goh holds a Bachelor of Arts (Philosophy) with Honors from the National University of Singapore. Age 49.
14 OCBC Annual Report 2011

mR LAm kUN kIN GLOBAL TREASURYMr Lam Kun Kin was appointed Head of Global Treasury in January 2007 and Senior Executive Vice President in April 2011. He has global responsibility for OCBC Bank’s financial market businesses and asset liability management in Singapore, Malaysia and seven other overseas markets. With over 25 years of business experience covering global fund management, global markets sales & trading and Asian emerging market business, Mr Lam has held senior management positions in the Government of Singapore Investment Corporation, Citibank N.A. and Temasek Holdings. Prior to joining OCBC Bank, he was managing director of Asia Financial Holdings, a subsidiary of Temasek Holdings. He holds a Bachelor of Accountancy with Honours from the National University of Singapore and is a Chartered Financial Analyst. Age 49.
mR GEORGE LEE LAP wAH GROUP INVESTMENT BANKINGMr George Lee Lap Wah was appointed Executive Vice President in August 2005. As the Head
of Group Investment Banking, he oversees our debt capital markets, corporate finance, merger
and acquisition and mezzanine investment businesses. Mr Lee has more than 33 years of banking
experience and has held senior level positions in Credit Suisse First Boston, Credit Suisse Singapore
and Security Pacific National Bank. Mr Lee holds a Bachelor of Business Administration with
Honours from the University of Singapore and is a Chartered Financial Analyst. Age 59.
mS kNG HwEE TIN GROUP AUDITMs Kng Hwee Tin was appointed Head of Group Audit in April 2010 and promoted to Executive Vice President in April 2011. She oversees the full spectrum of audit activities for OCBC Bank and our subsidiaries. She reports directly to the Audit Committee and administratively to the Chief Executive Officer. Ms Kng has more than 20 years of experience in banking, most notably establishing the Bank’s thrust into Premier Banking. During her tenure with OCBC, she was also Executive Assistant to the Group Chairman, Secretary to the Board Risk Committee, and a Project Manager in the Bank’s implementation of Basel II requirements for credit risk. Ms Kng holds a Masters of Business Administration from the National University of Singapore, where she was awarded the Saw Gold Medal in Finance. Age 45.
mR NA wU BENG INTERNATIONALMr Na Wu Beng was appointed Executive Vice President in March 2001. Currently assigned to
OCBC NISP as Deputy President Director, he joined its Board of Directors in September 2005.
Mr Na joined OCBC Bank in February 1990, and was responsible for our operations in Hong Kong
and North Asia. Prior to that, he was at International Bank of Singapore for 11 years, where he
was based in Taiwan for seven years. He holds a Bachelor of Arts (Economics) with Honours from
Coventry University, UK. Age 55.
mR NEO BOCk CHENG GROUP TRANSACTION BANKING – GLOBAL CORPORATE BANKMr Neo Bock Cheng joined OCBC Bank in October 2003 as Head of Cash Management. He was appointed Senior Vice President in April 2005 to oversee the Group Transaction Banking Division which provides cash management, trade finance, and nominee services to corporate and commercial banking customers. Mr Neo brings with him more than 22 years of corporate banking experience, including over 13 years with regional assignments at several major international banks such as Citibank and JP Morgan Chase. Mr Neo graduated with a Bachelor of Engineering (Civil) degree from the National University of Singapore. Age 47.
15OCBC Annual Report 2011
mR DARREN TAN SIEw PENG GROUP FINANCEMr Darren Tan Siew Peng was appointed Executive Vice President and OCBC Bank’s Chief Financial Officer in December 2011. As CFO, he oversees financial, regulatory and management accounting, capital management, corporate development and investor relations. He joined OCBC Bank in March 2007 as Head of Asset Liability Management in Global Treasury and assumed the role of Deputy Chief Financial Officer in May 2011. Prior to joining OCBC, Mr Tan worked for 13 years in the Government of Singapore Investment Corporation (“GIC”) with his last position in GIC as Head of Money Markets. He graduated with First Class Honours in Accountancy from Nanyang Technological University and is a Chartered Financial Analyst. Age 41.

mS LEONG wAI LENG CHAIRMAN, OCBC BANK CHINAMs Leong Wai Leng was appointed as Chairman of OCBC China in August 2007. She has overall
responsibility for directing and executing our growth strategy in China in her current role.
A Singaporean and a graduate of the National University of Singapore with a Bachelor’s degree in
Business Administration, Ms Leong has more than 23 years of experience in finance both in the
corporate world and in corporate banking. She has worked in China for the last 11 years, including
seven years of corporate experience with Philips Electronics Group as its China Country Treasurer
and Vice President, China Group Chief Financial Officer. She held several senior banking positions
in Citibank Singapore, JP Morgan Chase Singapore, and HSBC China. Age 46.
mR GILBERT kOHNkE GROUP RISK MANAGEMENTMr Gilbert Kohnke was appointed Executive Vice President and Head of Group Risk Management in September 2005. As Chief Risk Officer, he covers the full spectrum of risk, including Credit, Information Security, Liquidity, Market and Operational risk management. Jointly reporting to both the Chief Executive Officer and the Board Risk Committee of OCBC Bank, he has been leading the change in redefining the risk management approaches used by OCBC Bank in a Basel II world. He has over 23 years of banking experience. Prior to joining OCBC Bank, he was Head of Risk Management for Asia at Canadian Imperial Bank of Commerce (“CIBC”), and subsequently, Head of European Portfolio Management of CIBC based in London. He holds a Bachelor of Arts in Economics from the University of Western Ontario, a Bachelor of Commerce in Accounting from the University of Windsor, Ontario and a Master of Business Administration from the University of Hawaii. Age 53.
mRS TENG SOON LANG GROUP QUALITY & SERVICE EXCELLENCEMrs Teng Soon Lang was appointed Executive Vice President in January 2003. She heads the Group Quality & Service Excellence Division which is responsible for building a quality culture, facilitating cross-functional process transformations and enhancing collaborations across the organisation. She joined OCBC Bank in 1996 as Group Chief Information Officer. Mrs Teng holds a Bachelor of Accounting with Honours and a Master of Science (Computer and Information Sciences) from the National University of Singapore as well as a Post Graduate Qualification from the Institute of Cost and Management Accountants, UK. Age 61.
mS CyNTHIA TAN GUAN HIANG GROUP HUMAN RESOURCESMs Cynthia Tan Guan Hiang was appointed Executive Vice President in April 2005. Being Head of Group Human Resources, she is responsible for the management as well as training and development of our human capital. Ms Tan has over 27 years of experience in this field, having held senior level positions in DFS Ventures, Mentor Graphics, Apple Computer and National Semiconductor. She was also a former lecturer in Business Studies at Ngee Ann Polytechnic.She holds a Masters in Business Administration from the University of Hull, UK. Age 61.
mR RENATO DE GUzmAN CHIEF EXECUTIVE OFFICER, BANK OF SINGAPORE Mr Renato de Guzman is presently the Chief Executive Officer of Bank of Singapore. An accomplished banker with over 35 years of extensive banking experience, he has been instrumental in growing the private banking business in Asia where he was the Chief Executive Officer of ING Private Banking Asia from 2000. He was also Country Manager for ING Barings in Manila from 1990 to 2000. Mr de Guzman holds a Bachelor of Science in Management Engineering from Ateneo de Manila University, a Masters in Business Administration (with distinction) from Katholieke Universiteit Leuven, Belgium and a Masters in Management from McGill University, Canada. Age 61.
Principal Officers
16 OCBC Annual Report 2011

mR DAVID mCQUILLEN GROUP CUSTOMER EXPERIENCEMr David McQuillen joined OCBC in January 2010 as Senior Vice President and Head of Group Customer Experience. He leads OCBC Bank’s initiatives on building a stronger customer focus within our bank, running market research and improving the quality of customer experience across all customer touchpoints. He has previously held senior customer experience positions in major organisations and prior to joining OCBC Bank, he was Director of Client Experience at Credit Suisse in Switzerland since 2001. Mr McQuillen holds an MBA in IT Strategy from the Cass Business School in London and a Bachelor of Business Administration in Marketing from Mercyhurst College. Age 41.
mS LORETTA yUEN GROUP LEGAL AND REGULATORY COMPLIANCEMs Loretta Yuen was appointed General Counsel and Head of Group Legal and Regulatory Compliance in September 2010 and Senior Vice-President in April 2011. She oversees the full spectrum of legal and regulatory risks, including anti-money laundering, across OCBC Bank and its subsidiaries, and provides advice on regulatory risks and legal issues involved in decisions to management, so that management can make informed strategic choices within an acceptable legal and regulatory risk profile. Ms Yuen has over 11 years of legal and regulatory experience in banking and finance. She graduated with Second Class honours in Law from the National University of Singapore. Age 37.
mR PETER yEOH GROUP SECRETARIAT Mr Peter Yeoh joined OCBC Bank in January 1984 and was appointed Company Secretary in
August 2002. Since joining OCBC Bank, he has held responsibilities in finance, accounting,
management information services and strategic projects. He holds a Bachelor of Commerce from
the University of Western Australia, and is a Member of the Institute of Chartered Accountants in
Australia, and a Member of the Institute of Certified Public Accountants of Singapore. Age 57.
mR VINCENT SOH GROUP PROPERTY MANAGEMENTMr Vincent Soh was appointed Senior Vice President in June 2004. As Head of Group Property Management, he is responsible for managing OCBC Group’s real estate portfolio. He has held senior level positions in the public and private sectors. Mr Soh holds a Master of Science (Property & Maintenance Management) and Master of Public Policy, both from the National University of Singapore. He is also an Associate Member of the Royal Institution of Chartered Surveyors, UK. Age 56.
mS kOH CHING CHING GROUP CORPORATE COMMUNICATIONSMs Koh Ching Ching was appointed Head of Group Corporate Communications in November 2004 and Senior Vice President in April 2006. She leads our group communications initiatives with the media, employees, customers, shareholders and the general public. Prior to her role in corporate communications, she led OCBC Bank’s franchise expansion efforts in trade finance in Malaysia. Before this, Ms Koh had 16 years of corporate and retail banking experience, having held various senior customer and product positions in local and foreign financial institutions. She graduated with First Class Honors in Business Administration from the National University of Singapore. Age 44.
mR LIm kHIANG TONG GROUP OPERATIONS AND TECHNOLOGYMr Lim Khiang Tong joined OCBC Bank in September 2000 as Chief Technology Officer of finatiQ.com and was transferred to OCBC Bank, assuming the role of Head of IT Management in January 2002. He was appointed Executive Vice President in December 2007 and Head of Group Operations and Technology in May 2010. He oversees OCBC Bank’s regional processing centres and technology operations, driving for productivity gains and lower unit costs by instilling a quality culture and leveraging on the synergy from cross border processing hubs in Singapore and Malaysia. Mr Lim has more than 22 years of information technology experience, including regional infrastructure implementation, service management, technology strategy development, project management and systems support. He holds a Bachelor of Science (Computer Science & Economics) from the National University of Singapore. Age 51.
17OCBC Annual Report 2011

New Horizons III
BALANCED BUSINESS SCORECARD
We will continue our disciplined approach to driving
performance improvement through a balanced business
scorecard, focusing on customers, products, risk
management, productivity, people and shareholder value.
The main areas of focus include the strengthening of our
market position in Singapore, continuing to enhance our
customer and product capabilities, including the wealth
management platform of OCBC Bank, Great Eastern
Holdings, Lion Global, Bank of Singapore, OCBC Securities
and PacificMas, extending our risk management and capital
management capabilities across our Group, and continuing
to strengthen employee engagement.
LEVERAGING GROUP SyNERGIES
We plan to differentiate ourselves by further leveraging
potential synergies among the entities within our Group,
which include OCBC Malaysia, OCBC Al-Amin, OCBC NISP,
OCBC China, Great Eastern Holdings, Lion Global,
Bank of Singapore, OCBC Securities and PacificMas.
We will seek to broaden relationships with our various
sets of customers by increasing cross-selling and customer
referrals across our Group, and we will enhance operational
effectiveness by coordinating the development and
deployment of common corporate resources. We will
also continue to balance organic growth with selective
acquisitions that fit our overall franchise.
DEEPER PRESENCE IN mALAySIA,INDONESIA & GREATER CHINA
Outside our home market, we plan to remain focused on
deepening our presence and driving growth in Malaysia,
Indonesia and Greater China. We expect to continue to
expand our distribution capabilities and strive to expand
market share in Malaysia, including Islamic banking and
Takaful. In Indonesia, we intend to build on the enlarged
OCBC NISP franchise (following the merger of our two
subsidiaries in Indonesia) to invest and grow more effectively
through a single business presence. In China, we plan to
expand our business through closer integration of our
operations across Greater China, including Hong Kong and
Taiwan, and building our private banking business through
Bank of Singapore.
CUSTOmER ExPERIENCE
We will continue to focus on delivering a superior and
differentiated customer experience in order to gain a
sustainable competitive advantage. The key elements include
leveraging customer insights to develop and implement
superior customer value propositions, focusing on quality
and investing in customer experience delivery capabilities
across our Group.
In February 2011, we announced New Horizons III, our five-year strategy for 2011 to 2015.
This strategy continues the broad direction, and builds on the successes, of our New Horizons (2003-2005) and New Horizons II
(2006-2010) strategies. Under New Horizons, we transformed and integrated our Malaysia operations, and expanded our regional network
through strategic investments in Indonesia and China. Under New Horizons II, we improved our market position in Singapore and Malaysia,
and strengthened our presence in Indonesia and China. We also expanded our wealth management franchise across multiple product and
distribution platforms and customer segments.
The New Horizons III strategy focuses on four key elements:
18 OCBC Annual Report 2011

2011 Report Card
BALANCED BUSINESS SCORECARD
Customers
• Expanded consumer customer base by 1.3% despite closing dormant accounts
• Maintained assets under management (“AUM”) per consumer customer with growing customer base
• Leveraged on customer insights to improve products, services and customer experience
• Launched enhanced on-line banking platform
• Increased AUM for high net worth individuals by 19% and earning assets base (“EAB”) by 23%
• Expanded SME customer base by 10%
• Improved cross-sell ratio by 6%
• Named Outstanding Private Bank in Asia Pacific by Private Banker International and Best Private Bank in Singapore in 2011 and 2010 by FinanceAsia
• Named Best Wealth Management Bank in Southeast Asia in 2011 and 2010 by Alpha Southeast Asia
Products
• Launched 94 new products, accounting for 8% of total revenue
• Named Best SME Bank (Cash Management) in Singapore and Rising Star Cash Management Bank in Malaysia by The Asset
• Named Best Trade Finance Bank in Singapore by FinanceAsia and Best Trade Finance Bank (Foreign Bank Category) in Malaysia by The Asset
• Ranked first in Singapore and Malaysia Loans Mandated Arranger league tables by IFR Asia
• Topped the Bloomberg 2011 mandated arranger league tables for syndicated loans in Singapore
• Ranked first in Currency Derivatives (Structured Hedging) and Interest Rate Derivatives (Vanilla/Structured Hedging) for SGD, MYR and IDR by Asia Risk
• Lion Global won six awards at the Lipper Fund Awards 2011 (Singapore and Taiwan)
Risk management
• Refined and expanded internal ratings framework with significant Risk Weighted Assets (“RWA”) optimisation, and adopted the Internal Ratings Based (“IRB”) approach for 84% of credit portfolios for Basel II Pillar 1
• Improved internal capital adequacy assessments with expanded coverage and more refined methodologies for Basel II Pillar 2
• Published additional disclosures on risk and capital management for Basel II Pillar 3
• Received S&P’s rating upgrade from A+ to AA-
• Ranked the World’s Strongest Bank by Bloomberg Markets
• Rated 25th safest bank globally by Global Finance
Productivity
• Improved operational productivity by 4% and reduced unit processing cost by 3% across Singapore and Malaysia
• Hubbed additional processes to Malaysia, with annualised savings of S$0.26 million
• Executed 21 cross-functional process improvement projects, resulting in S$26 million in margin improvement, bringing cumulative margin improvements to S$219 million
People
• Improved employee engagement score for the ninth consecutive year since 2002
• Maintained employee share ownership at above 60%
• Maintained average training days per employee at above seven days for the sixth consecutive year, exceeding target of five days
• Revamped the OCBC Staff Volunteer Programme to encourage more personal volunteering
Shareholder Value
• Achieved ROE of 11.1% and cash ROE of 11.4%
• Achieved core EPS of 64.8 cents per share in 2011, down 2% due to the high participation in the scrip dividend scheme
• Maintained stable dividends at 30 cents per share, and kept total dividend payout at 45% of core earnings
19OCBC Annual Report 2011

2011 Report Card
CUSTOmER ExPERIENCE
• Established market research, experience design and customer-focused capabilities
• Implemented new customer metrics, net promoter score and E-B score, to track progress on exceeding customer expectations
• Revamped communication materials for various products such as Dual Currency Returns and New Target Unit Trust
• Received the Plain English Campaign’s Crystal Mark, the first financial institution in Southeast Asia to do so. Since then, more than 10 Crystal Marks were awarded across consumer and business banking businesses
• Launched FRANK by OCBC, a revolutionary banking experience for Gen-Y customers based on in-depth customer research and a Design Thinking methodology
INTERNATIONAL ExPANSION
• Sustained double-digit revenue growth, driven by loan growth and treasury activities
malaysia
• Increased inter-bank cash withdrawal transactions since joining MEPS in 2010
• Expanded Emerging Business and Bumi sales force
• Opened one branch in Ijok, Selangor and another in Cheras, bringing total network to 31 conventional branches and five Islamic Banking branches
Indonesia
• Completed the merger between Bank OCBC Indonesia with Bank OCBC NISP; fully integrated within two months
• Rolled out the Emerging Business model nationwide
China
• Increased network to 16 branches and sub-branches covering eight cities
• Received approval to open a new branch in a ninth city, Shaoxing in Zhejiang Province
Vietnam
• Sustained revenue growth of more than 100% through successful penetration of the top tier state-owned-enterprises and Southeast Asia network clients
LEVERAGING ON GROUP SyNERGIES
• Strengthened the cross-sell momentum among Group entities with processes aligned and tracking mechanisms put in place
• Focused on serving the needs of Southeast Asia network customers and providing seamless customer experience across the region
• Launched several new products through the collaboration among Group entities e.g. LionGlobal New Target Return Fund
• Extended capabilities across geographies, including the roll-out of our internet cash management platform in Indonesia
• Improved the co-ordination between Group entities across geographies to capture emerging opportunities
• Continued to align risk / compliance practices and capabilities across geographies and subsidiaries
• Facilitated the knowledge transfer of Quality and Customer Experience concepts across subsidiaries
• Rationalised common infrastructures and shared services e.g. consolidation of Great Eastern (“GEH”) and OCBC data centres
• Developed structured career paths and aligned Internal Job Posting programmes across Group entities to facilitate cross-fertilisation of talented individuals across businesses and geographies
20 OCBC Annual Report 2011
Operations Review
Building on the success of our New Horizons and New Horizons II strategies, we launched our follow-on strategy, New Horizons III in 2011. Retaining the key pillars of our previous strategies, which remain relevant, we intend to continue to utilise our balanced business scorecard, and to accelerate our progress in delivering improved quality and a differentiated customer experience to gain a sustainable competitive advantage in the marketplace. The roll-out of the “FRANK by OCBC” banking programme and the FRANK retail stores is a good example of us leveraging customer insights to deliver a differentiated customer experience. FRANK, which was dubbed “maybe the coolest bank Gen-Y has ever seen” by TheFinancialBrand.com, was the result of in-depth market research to understand the banking needs of young adults. The market reception of FRANK has been strong since its launch, and we received the Financial Insights Innovation Award in recognition of our delivery of a superior customer experience.
GLOBAL CONSUmER FINANCIAL SERVICES
In a year marked by low interest rates and financial market volatility,
our consumer banking business delivered a healthy set of operating
results. Overall revenue increased by 5% to S$1.2 billion led by robust
loan growth of 19%, and higher fee and commission income from our
bancassurance, unit trusts and credit card businesses. Home loans and
personal loans, on a combined basis, registered double-digit growth
in Singapore and Malaysia, while deposits rose 9% in Singapore
and 13% in Malaysia, as we continued to strengthen our consumer
banking franchises in both countries. Pre-tax profit nevertheless fell
11% to S$452 million, mainly attributable to higher staff costs as we
continued to invest in deepening our bench strength to grow our
consumer banking business.
We launched several new products and services during the year,
successfully deploying customer insights to drive innovation. In
Singapore, we worked with Lion Global Investors to launch a new
unit trust called the LionGlobal New Target Return Fund in October
2011. Based on our customer research findings, we focused our
efforts on investors who had not invested in unit trusts before,
and created a fund that addresses their fears of low or negative
returns from unit trust investments resulting from low interest rates
and continued market volatility. More than 40% of the customers
who subsequently invested in the Fund were first time unit-trust
investors, confirming the relevance of the Fund’s product features.
To attract the youth and young working adults segment, we
launched “FRANK by OCBC”, an innovative banking programme
that includes a customised suite of savings, debit and credit
card offerings, a tailored cards rewards programme and unique
internet banking capabilities. Three “FRANK by OCBC” stores were
opened in the Singapore Management University and Nanyang
Technological University campuses, and VivoCity, a shopping mall.
These stores feature a unique retail concept, with a contemporary
layout and 130-card display stand that allows customers to browse,
touch and ask questions as they would do when shopping. We
transformed the experience for this group of customers by making
banking easy, by enabling them to express themselves and by giving
them better control over their finances. Providing a choice of 130
distinct debit and credit card designs is the first such initiative in the
region. One limited-edition credit card design was sold for S$1,000,
which we matched, and we then donated the entire S$2,000 to the
Singapore Children’s Society.
In November 2011, we rolled out a new account-opening system
that delivers an engaging and hassle-free experience for customers.
Customers are no longer required to complete multiple forms when
they apply for several products at one time. This has resulted in a
57% increase in requests for additional products and services, such
as debit cards and internet banking.
Several innovative features were introduced on our mobile and
internet banking platforms. In March 2011, we rolled out our
mobile banking application for Android mobile phones that includes
a unique “Scan and Pay” feature. This allows Android phone users
to scan barcodes to obtain billing details and make payments
from their OCBC Bank accounts using their phones. The billing
organisations’ details can also be stored in the phones for making
future payments. In October 2011, we also enhanced our on-line
and mobile banking platforms with the intention of increasing the
usage rate and customer stickiness. We received positive customer
feedback on the new features and the simplified user interfaces.
New features include a facility to create multiple on-line savings
goals using one bank account, the ability to top up prepaid cards
and make overseas remittances.
21OCBC Annual Report 2011

Our collaboration with the National Trades Union Congress
(“NTUC”) reached another milestone in September 2011, with
the opening of our first Plus! Lite Branch in a NTUC Fairprice
supermarket, FairPrice Xtra Jurong Point. This branch, offering
FairPrice customers banking services such as account enquiry and
financial advisory services, is the first of its kind in the region.
In October 2011, we also started a partnership with nEbO, the
junior membership arm of NTUC, by providing “FRANK by OCBC”
products and services to nEbO members. This collaboration was
branded “FRANK for nEbO”.
In both Singapore and Malaysia, we introduced home loans for
residential properties in Australia and London. We were also the first
financial institution to bundle renovation and refurbishment loans
with home loans in Malaysia, a combined offering with more attractive
interest rates than for standalone unsecured renovation loans.
We continued to leverage on our strategic partnership with
Great Eastern to cross-sell products that meet the diverse needs
of our customers. In Singapore, we continued to be the top
bancassurance player with a market share of 34%. In April 2011,
we added a new Universal Life insurance plan to complement our
two existing popular offerings. With the new PremierLife Heritage
(Enhanced) plan, insurance coverage is maintained even if the
policy’s account value falls to zero. This is an improvement over
the classic plan, the PremierLife Heritage (Classic), which requires
customers to top up the insurance premium if the account value
falls to zero in order to maintain the insurance coverage. The new
product helped to drive strong demand for Universal Life insurance
plans among our high net worth customers. In Malaysia, we also
grew bancassurance revenue by 53%.
We currently have a network of over 600 ATMs and 55 branches
in Singapore, of which 21 branches provide full service banking
on Sundays. During the year, we added two new Premier Banking
Centres, one at Marina Bay Sands and the other at Marina Bay
Financial Centre, bringing the total number of Premier Banking
Centres to 15. In Malaysia, we have 79 ATMs and 36 branches. We
opened a new branch in Ijok, Selangor, and joined the MEPS ATM
network, which allows our customers to make cash withdrawals at
10,000 ATMs located across the country.
During the year, we won several awards for our products and service
excellence. The OCBC YES! Card received the Product Excellence
Award (Singapore) in the inaugural Banking and Payments Asia
Trailblazers Awards, and the Gold Award in the Best Credit Card
Category by Asian Banking and Finance. In the inaugural “We
Welcome Families” Awards, we received the Achiever Award for
our Hougang Mall branch and our Ang Mo Kio Central branch was
the sole recipient of the Excellence Award in the Services category.
Some 364 staff from our Consumer Financial Services unit received
SPRING Singapore’s Excellence Service Award for outstanding
service. Out of the 364 staff, 51 received the top Star Award, 141
received the Gold Award, and 172 received the Silver Award.
We were recognised for our efforts to make banking information
simple and easy for our customers and to enable them to make
more informed financial decisions. We became the first financial
institution in Singapore to receive Crystal Marks for Clarity from the
UK Plain English Campaign for, among others, our Dual Currency
Returns product marketing brochures, Financial Needs Analysis
forms and for all our home loan documents.
GLOBAL CORPORATE BANk
At our Global Corporate Bank, revenue rose 23% to a record
S$2.1 billion, led by strong growth in net interest income and
higher fee income from trade finance, cash management and
treasury activities. Pre-tax profits increased 17% to S$1.4 billion.
Our core markets of Singapore and Malaysia remained our key
revenue contributors, while our other overseas markets registered
strong double-digit growth as our regional expansion efforts
gathered pace.
We achieved 28% loan growth for the year, led by broad-based
growth across all geographies. Notable corporate banking
transactions in Singapore included our appointment as one of the
lead arrangers for the S$4.2 billion refinancing for Resorts World
at Sentosa Pte Ltd; the US$2.4 billion financing for BW Offshore
– the world’s second largest FPSO (floating, production, storage
and offloading) owner and operator – and a S$1.3 billion facility
to Guocoland Limited. In Malaysia, we were the agent bank,
and mandated lead arranger and lender, in the MYR1.4 billion
syndicated term loan facility for Digi Telecommunications Sdn Bhd;
and the MYR3.0 billion facility for Astro Malaysia Holdings Sdn Bhd.
In Singapore, we established a small and medium enterprises
(“SME”) regional business team to support our customers as they
build their regional presence in countries such as China, Malaysia
and Indonesia. Our base of SME customers with regional operations
doubled, and cross-border SME business revenue more than tripled.
Our total SME customer base expanded by 10% overall.
Discovering and acting on customer insights remains a key
driver of our innovation efforts as we continue to strive to make
banking with OCBC “simple, fast and convenient” for SMEs. We
implemented an integrated credit processing system which allows
customers to submit fewer supporting documents and shortens the
turnaround time for credit applications. For commercial property
loans (“CPL”), we introduced “CPL 120 mins”, whereby customers
are informed of the status of their loan applications within two
hours of their submitting the documents.
In Malaysia, we launched OCBC Easi-2Pay, a real-time internet
payment portal within the Financial Process Exchange (“FPX”)
gateway. This service enables customers to receive payments via
their own websites. We also enhanced our process to allow prompt
issuance of cash-backed letters of credit and Islamic letters of credit,
reducing turnaround to within two business days.
Operations Review
22 OCBC Annual Report 2011

In recognition of our efforts to serve SMEs in 2011, we were named
the Best ASEAN SME Bank by the Asian Banking and Finance
magazine, and Best SME Bank in Singapore by the Alpha Southeast
Asia magazine for the second year in a row.
Group Transaction Banking
Our Group Transaction Banking team had a record year in 2011,
with strong growth in both the cash management and trade
businesses. We secured a significant number of cash management
mandates in Singapore, Malaysia and China. Our trade volumes
increased strongly in Singapore and China, driven mainly by the growth
of commodities trade finance and Renminbi trade-related activities.
Our customer base for Velocity@ocbc, our award-winning internet
banking platform, grew 25% in Singapore, 28% in Malaysia and
66% in China. Our enhanced electronic mobile and email corporate
notification service, eAlerts@ocbc, continued to be well-accepted
by our customers, with the base of customers using the service
expanding by 26%.
In Malaysia, leveraging on our expertise in trade finance and treasury
products, we introduced a structured trade financing solution for
customers exporting to China in Renminbi. In China, we introduced
new trade finance and cash management products and services,
including an Export LC Refinancing service and an Escrow Account
Service. The expansion of our existing product suite has also helped
to grow the number of Velocity@ocbc payment transactions by 87%
and doubled the amount of trade settlement transactions.
We also garnered several industry accolades: we were named the
Best Domestic Cash Management Bank (Singapore) and the Best
Domestic Trade Finance Bank (Singapore) by The Asian Banker;
the Best Trade Finance Bank in Singapore by FinanceAsia; the Best
SME Bank (Cash Management) in Singapore, the Rising Star Cash
Management Bank in Malaysia and the Best Trade Finance Bank in
Malaysia (Foreign Bank category) for the second consecutive year,
by The Asset; and awarded by Alpha Southeast Asia in Singapore;
the Best Trade Solution of the Year in Southeast Asia and Best Yuan
Trade Settlement Solution of the Year in Southeast Asia.
GLOBAL TREASURy
We registered positive growth amidst the uncertain macro-
environment and challenging financial market conditions in
2011. Treasury revenue increased 28% to S$1.1 billion, driven by
contributions from overseas centres and strong customer sales
activities. Sales revenue arising from strong cross-sell efforts grew
48%, and our pre-tax profits rose 34% to S$780 million.
In line with our New Horizon III strategy of deepening our business
presence in strategic overseas markets, revenue from overseas
Treasury centres grew by 107%. While Singapore and Malaysia
continued to be our largest geographical markets, combined
revenue contributions from our overseas Treasury centres, mainly
in the Greater China region, exceeded the contribution from
Malaysia. This performance is a result of the continuous efforts
to diversify our revenue streams across geographies, business
activities and asset classes.
We continued to receive market recognition for our product
innovation, service excellence and market dominance in Asian
currency products. We were ranked as the top provider of SGD,
MYR and IDR-denominated currency and interest rate products
by Asia Risk. In the Asiamoney’s FX Poll 2011, we were voted by
corporate organisations as the Best Domestic Provider of FX Services
in Singapore, the Best Domestic Provider for Innovative FX Products
& Structured Idea in Singapore and the Best Domestic Provider of
FX Prime Broking Services in Singapore. We topped Asiamoney’s
Fixed Income Poll 2011 for having the Most Innovative Trading Ideas
and Best Pricing & Execution Capabilities in credit and interest rate
sales in Singapore.
GROUP INVESTmENT BANkING
OCBC Bank was highly ranked in the Bloomberg 2011 mandated
arranger league tables for syndicated loans. We topped the
Singapore table with S$4.3 billion from 32 deals and achieved a
market share of 10.6%. We were also listed among the top ten
arrangers in the Asia ex-Japan table, with US$7.7 billion from
78 deals, representing a 2.4% market share in the region.
Notable deals we arranged included financings for the
redevelopment of the landmark Capitol Theatre and the
development of MGPA Asia Square Towers at the new Marina Bay
downtown. We also arranged the only offshore syndicated loan in
2011 for Indonesia’s Eximbank.
Our Capital Markets team also did well in 2011. We were ranked
among the top five arrangers in the Bloomberg 2011 mandated
arranger league table for Singapore dollar bonds. Key transactions
included bond issuances for Hong Kong-based Henderson Land and
JSC VTB Bank of Russia.
Our Corporate Finance team remained active in supporting
our corporate customers in accessing equity capital markets in
Singapore. During the year, the team lead-managed various equity
deals and raised over S$185 million. Key transactions included the
IPOs of homegrown companies UE E&C and Sheng Siong, and a
secondary placement for First Ship Lease Trust. We also co-managed
various IPO offerings including Hutchison Port Holdings Trust,
the largest IPO for the year, and Mapletree Commercial Trust. In
addition, we provided advisory services to Pacific One Energy during
its S$393 million takeover bid for KS Energy.
Our Mezzanine Capital unit continued to provide private equity
and customised equity-linked financing solutions to our corporate
customers in Singapore, Malaysia, Greater China and Indonesia.
One landmark transaction was the successful listing of Shindoo
Chemical Industry Co, a company we have supported for three
years, on the Shenzhen Stock Exchange in January 2011.
23OCBC Annual Report 2011

In line with our sponsorship of the Emerging Enterprise Awards,
which has been recognising well-run small businesses in Singapore
for four years, we extended interest-free loans to the winners of
Emerging Enterprise 2011 to help them build their capabilities and
grow their businesses.
In Malaysia, we topped the Thomson Reuters 2011 Malaysia
syndicated loans bookrunner league table with a market share
of 41.6%. Key transactions included a cross border plantation
syndication of US$240 million in Papua New Guinea arranged for
London Stock Exchange-listed New Britain Palm Oil, a MYR4 billion
dual currency privatisation financing package for Astro Malaysia
Holdings, and a US$265 million syndicated loan arrangement for
Genting New York, for the construction of the city’s first combined
race track and casino. We were also the joint lead manager for
several benchmark Malaysian capital market transactions, namely
Khazanah’s 20-year MYR1.0 billion Sukuk and Alliance Bank’s
MYR1.5 billion subordinated bond.
OCBC mALAySIA
OCBC Malaysia registered a 6% increase in net profit to MYR749
million, supported by higher revenues. Customer loans grew 20%
to MYR43.1 billion, driven by greater demand for home loans and
corporate loans. In 2011, OCBC Malaysia maintained its ranking
among the largest foreign banks by assets, deposits, loans, and
branch network size. We now have five Islamic banking branches
and, in January 2012, we opened our 31st conventional branch
in Cheras. Our long-term financial institutional rating was reaffirmed
at AAA and our short term financial institutional rating at P1,
by RAM Rating Services Berhad.
We launched several new products and services during the year. In
March 2011, we introduced the country’s only commercial study
loan programme for tertiary education, OCBC Secured Study Loan,
offering each student a loan amount of up to MYR400,000. This
study loan programme allows students to supplement the loan
offered by the government-backed Perbadanan Tabung Pendidikan
Nasional loan scheme and minimises the use of their parents’
Employee Provident Funds. In the same month, OCBC Malaysia
joined the Malaysian Electronic Payment System (“MEPS”) network,
thus enabling OCBC Premier Banking and Mass Affluent customers
to make up to four free withdrawals every month at any ATM in the
MEPS shared ATM network.
In July 2011, we became the first foreign bank in Malaysia to issue
structured warrants. Our structured warrants on MSM Malaysia
Holdings Berhad, the biggest sugar refiner in Malaysia, and Benalec
Holdings Berhad, a marine construction specialist, received a
healthy response from the growing pool of investors interested in
sophisticated investment products. In August 2011, we issued a
third structured warrant on Bumi Armada Berhad, an international
offshore services provider for the oil and gas industry, which proved
an equally popular issue among Malaysian investors.
In November 2011, we introduced the first Ringgit-based
mortgage loan facility for the purchase of residential properties in
Australia, focusing on the prime areas of Sydney and Melbourne.
Denominating the home loan in Ringgit and not in Australian dollars
will help customers with Ringgit-based cash flows mitigate the risks
of foreign exchange fluctuations.
Our efforts to leverage on our strategic relationship with Great
Eastern Life Assurance (Malaysia) continued with the launch of
Premier Heritage, a single-premium Universal Life Insurance estate
planning product developed by Great Eastern Life Assurance
(Malaysia) for high net worth individuals seeking effective estate
planning for wealth preservation and transfer.
In partnership with Credit Guarantee Corporation Malaysia Berhad
(“CGC”), we launched what became the largest credit portfolio
guarantee program for small and medium enterprises in Malaysia,
with a total of MYR500 million unsecured loans. Under the scheme,
CGC guarantees 70% of the approved loan amount. With
pre-determined loan eligibility criteria established, loan applications
are approved within three days compared to the industry standard
of at least two weeks.
OCBC Malaysia was again recognised as a leading service provider
of cash management and trade products and services when we
were awarded the 2011 Rising Star Cash Management Bank and
Best Trade Finance Bank (Foreign Bank Category) in Malaysia by
The Asset.
BANk OCBC NISP
2011 was another year of solid financial performance for Bank
OCBC NISP. Total assets registered 19% growth, underpinned by
loan growth of 31%. Asset quality was maintained at a healthy level
with a low non-performing loans ratio of 1.3%. Deposits rose 20%
to IDR47.3 trillion.
The legal completion of the merger of our two licensed bank
subsidiaries in Indonesia, Bank OCBC NISP and Bank OCBC
Indonesia took place on 1 January 2011. Within two months, the
businesses, operations, systems and people of both entities were
fully integrated. This successful merger allows us to serve the
Indonesia market with a single banking presence, expanded Bank
OCBC NISP’s customer segments to include more large corporate
clients, and strengthened our corporate banking capability with a
wider product range.
Over the year, Bank OCBC NISP worked closely with Great Eastern
Holdings in the area of bancassurance, with a 25% increase in
bancassurance revenue growth this year. Through its collaboration
with OCBC’s Capital Markets unit, Bank OCBC NISP also won
mandates to lead-arrange or co-lead arrange four syndicated
loan deals.
Operations Review
24 OCBC Annual Report 2011
Bank OCBC NISP expanded its network to 352 branches and offices
(excluding dedicated micro banking offices), and 652 ATMs during
the year. A comprehensive performance measurement framework
was put in place to manage branch performance which resulted in
increased employee productivity and customer satisfaction.
Bank OCBC NISP continued to make good progress in process and
service quality improvements. The Bank was named Indonesia’s
Retail Bank of The Year 2011 by Asian Banking & Finance and Brand
Equity Champion by MarkPlus Independent Research Institution.
For the 10th consecutive year, the bank was commended for
Excellent Financial Performance by Infobank Indonesia Magazine
and received the Banking Efficiency Award from Bisnis Indonesia Magazine and the Banking Service Excellence Awards from
Marketing Research Indonesia.
OCBC CHINA
Our China operations doubled revenues in 2011, largely driven by
strong growth in deposits which allowed us to grow our loan book and
and expand our interbank activities and placements, with an improved
net interest margin. Total deposits surged 62%, with corporate
customer deposits increasing 38%, and retail customer deposits
growing by more than six times. Our total customer base grew 53%
compared to a year ago. Total assets increased from RMB34 billion to
RMB52 billion. Our staff strength in China grew 14% to 775.
We also expanded our suite of wealth management products to
better serve the needs of our retail banking customers. Added
to the existing suite of products were securities funds domiciled
in Singapore under the Qualified Domestic Institutional
Investors (“QDII”) scheme, new structured investments and
bancassurance products.
We continued to support our corporate customers from Singapore,
Malaysia, Indonesia and other parts of the Greater China region
who are expanding into China, as well as our China customers
who are venturing overseas – particularly into the ASEAN region
where OCBC has a strong presence. We leveraged our international
network, and offered products such as cross border Renminbi trade
financing to help these customers grow their businesses. Our
Renminbi trade financing business in China more than doubled.
We further engaged our customers through several networking
events. The inaugural OCBC China Spring Forum held in Shanghai
in April 2011 was attended by more than 600 corporate and high
net worth customers of OCBC China, OCBC Singapore and Bank of
Singapore. Our speakers - who are all well-regarded and sought-after
for their expertise and knowledge of the economic and business
landscape in China – offered thought-provoking and useful insights
about the Chinese economy. They included Mr Andy Xie, one of
the top economists and financial investment advisers in China, Mr Ba
Shusong – a well-known researcher with the Finance Development
Research Centre of the State Council – and Professor Sun Li Jian,
deputy dean of the School of Economics and Professor of Finance
at the prestigious Fudan University in Shanghai. We received many
positive comments from customers, local regulators and the media.
We expanded our footprint in China by opening new sub-branches
in the following areas: Yubei in Chongqing, Daning in Shanghai and
South Renmin Road in Chengdu; and upgraded our representative
office in Qingdao to a branch. Our network thereby increased to a
total of 16 main and sub-branches in eight major cities.
We were named the Best Foreign Bank in Chengdu by the Chengdu Business Daily newspaper for the third consecutive year. We received
the 2011 Excellent Corporate Social Responsibility (CSR) Practical
Financial Organization Award by the Chinese Business Journal, for
our CSR efforts in China.
BANk OF SINGAPORE
Tapping the opportunities of the growing high net worth individual
segment in Asia, as well as leveraging on OCBC’s extensive network
and products and services, Bank of Singapore registered a strong
revenue increase of 20% – underpinned by the growth of assets
under management (“AUM”) of 19% to US$31.5 billion and
earning assets base (“EAB”) growth of 23% to US$39.6 billion.
AUM growth was broad-based across the major markets of
Southeast Asia, the Philippines, Greater China and for customers
from the India Sub-continent. Additional customer mandates for our
discretionary portfolio management service were secured during the
year, resulting in 33% growth in AUM for that service. Including our
advisory service, we recorded a net inflow of US$6.5 billion of fresh
funds in 2011. We also retained our Aa1 rating by Moody’s.
Staff strength increased 20% in 2011 – to more than 850,
of which 60% were client-facing – as the team of relationship
managers was expanded to serve Asia’s growing private banking
customer segment.
Bank of Singapore continued to garner industry recognition, being
named the 2011 Outstanding Private Bank in Asia Pacific by Private Banker International, the Best Private Bank in Singapore in 2010 and
2011 by FinanceAsia, and the Best Wealth Management Bank in
Southeast Asia in 2010 and 2011 by Alpha Southeast Asia.
GREAT EASTERN HOLDINGS (“GEH”)
Great Eastern Holdings’ insurance business remained healthy
in 2011, with strong growth in new business weighted sales,
and higher long term profitability as measured by new business
embedded value. Total weighted new business premiums for the
year rose 10% to S$798 million, led by 16% growth in regular
premium products. New business embedded value grew 20% to
S$365 million, reflecting GEH’s focus on higher sales of regular
premium and protection products. Reported net profit for the year
fell 24% to S$386 million, largely attributable to weaker investment
income in the challenging financial market conditions.
More details on GEH’s financials and business operations can be
found in their published annual report.
25OCBC Annual Report 2011

PARTNER BANkSBank of Ningbo, China
We continued to deepen our collaboration with Bank of Ningbo
(“BON”) in the areas of product development, risk management,
information technology and talent development.
BON reported a strong set of financial results, with net profit in
2011 growing 40% to RMB3,257 million (S$634 million). Total loans
grew 21%, driven by healthy loan demand and BON’s continuing
business expansion in key cities in China. Its nationwide network
increased from 110 to 146 branches and sub-branches, covering the
cities of Ningbo, Suzhou, Shanghai, Hangzhou, Nanjing, Shenzhen,
Wenzhou, Beijing and Wuxi.
VP Bank
VP Bank increased its charter capital from VND4,000 billion to
VND5,050 billion through the distribution of share dividends and
bonus shares. We were allotted approximately 15.6 million new
shares, enabling us to maintain our shareholding at 15%. VP Bank
has a network size of 199 branches and offices in Ho Chi Minh City
and Hanoi.
GROUP OPERATIONS & TECHNOLOGy
Our Operations and Technology division continued to focus on
enhancing our customers’ banking experience by standardising
technology platforms across the region, improving our operational
productivity and quality, and delivering capabilities for differentiated
customer experience at branches and on-line.
Significant service improvements were realised through the
completion of 37 process re-engineering projects, reaping more
than S$3 million in annualised savings. In Singapore, we streamlined
the business debit card approval process – reducing the turnaround
time from 4 weeks to 7 days – and improved the process for
placing foreign currency fixed deposits, reducing the waiting time
at branches from 30 minutes to 15 minutes. In Malaysia, the time
required to obtain valuation reports for properties used as collateral
for overdraft facilities was shortened from 53 days to 20 days,
speeding up approvals and achieving cost savings.
We executed several technology projects during the year. We:
• Linked the ATMs of OCBC NISP in Indonesia, OCBC Singapore
and OCBC Malaysia, allowing our customers to make cash
withdrawals at any OCBC Bank-owned ATM in the three
countries.
• Deployed a new on-line banking platform with more intuitive user
interfaces and first-of-its-kind features. The latter included virtual
savings jars that allow customers to set up different sub-saving
accounts to meet different saving goals in one account, and a
“Scan and Pay” feature that allows customers using Android
devices or iPhones to scan barcodes, and pay their utility and
telecommunications bills via their OCBC Bank accounts.
• Deployed a front-end paperless account opening system to
enable the opening of personal banking accounts without
multiple forms with multiple signatures.
• Rolled out a single technology platform in Singapore and
Malaysia to support our treasury business, for better reporting
and management of operational risk.
• Implemented a Credit Cards Global Rewards System allowing
customers to transfer their reward points among their
OCBC credit cards – and even to OCBC credit cards held by
other customers. Rewards can now be redeemed in real time
via mobile and internet banking, or at card merchants’ point
of sale terminals.
• Implemented a new Wealth Management system in
OCBC China to support the sale of investment products.
GROUP QUALITy & SERVICE ExCELLENCE
We continued our bank-wide quality efforts as an important
dimension for delivering service excellence.
We executed 21 cross-functional process improvements projects
across Singapore, Malaysia and Indonesia – delivering S$26 million
in potential margin improvements.
Our Private Banking business, Bank of Singapore, successfully
executed their first two projects, which focused on enhancing their
customers’ experience when starting a banking relationship with
us, and the financing of properties. We were also pleased with the
successful collaboration between Great Eastern and OCBC Malaysia
in redesigning the bancassurance application process, resulting in a
reduction in cycle time by more than 90% for our customers.
GROUP CUSTOmER ExPERIENCE
We continued to build up our Customer Experience capabilities
and worked on three key areas to deliver a differentiated banking
experience for our customers: obtaining better customer insights
through customer research and experiential laboratory findings;
adopting a Design Thinking methodology to improve the quality of
experience at all customer touchpoints; and training employees in
effective research and design thinking.
More than 30 customer insight studies were conducted during the
year allowing us to gain a deeper understanding of the needs and
expectations of our customers. These research studies have been
instrumental in the development of our products and services.
Notable new initiatives included the launch of the “FRANK by OCBC”
banking programme, an innovative concept designed to get young
working adults to bank with OCBC, and the LionGlobal New Target
Return Fund – a new unit trust launched by Lion Global that aims to
provide positive returns despite uncertain market conditions over an
investment timeframe of five years.
Operations Review
26 OCBC Annual Report 2011

We enhanced our customer satisfaction tracker, Customer
Experience Radar (“CX Radar”). CX Radar is an on-line system
that gathers feedback from thousands of customers each month
across 28 customer touchpoints in Singapore and Malaysia. The
information obtained by CX Radar helps us to continuously improve
our customer service and experience.
As part of our commitment to provide our customers with clear,
relevant and timely information to help them make informed
financial decisions, in May 2011, we became the first financial
institution in Southeast Asia to earn – for our HDB mortgage
documents – the Crystal Mark, awarded by the well-known Plain
English Campaign. We have since earned Crystal Marks for several
other banking documents such as the Commercial Property Loan
Letter of Offer and the marketing brochure for our Dual Currency
Returns investment product.
OCBC PROPERTy mANAGEmENT
Our office and residential properties, which are held for own-use
and investment purposes, remained full or near full occupancy
during the year. These properties have an aggregate net lettable
area of approximately two million square feet.
To support the expansion of our banking business in China, we
acquired a completed six-storey office building located in Pudong,
Shanghai, with an approximate gross floor area of 249,161 square feet.
The redevelopment of the former Specialists’ Shopping Centre and
Hotel Phoenix site at Orchard Road, which began in July 2010, is
targeted for completion in 2013, culminating in a new shopping
and hotel complex.
In addition to refurbishing 12 OCBC branches, we added seven new
branches to our network in Singapore, Malaysia & China. These
comprised three conventional branches, three “FRANK by OCBC”
stores and a Plus! Lite branch. In addition, 160 off-site ATMs
and three off-site eLobbies across Singapore were upgraded.
Renovation works were also carried out at the Bank of Singapore’s
new headquarters at 63 Market Street, now renamed Bank of
Singapore Centre, and the offices of our subsidiaries, Great Eastern,
Banking Computer Services and BCS Information Systems.
In recognition of our ongoing efforts to achieve higher energy
efficiency and sustainability in our buildings, OCBC Centre
and OCBC Centre South were both awarded the Building and
Construction Authority Green Mark Gold Awards.
GROUP HUmAN RESOURCES
Our Group staff strength – including Bank of Singapore, Bank OCBC
NISP and Great Eastern Holdings – increased 6% to 22,892.
Most of the headcount increase came from our overseas markets,
primarily Malaysia and China, reflecting our New Horizons III
strategy of deepening market penetration in our core markets.
Employee development and engagement remained a key focus
in our human resource management. We increased our training-
related expenditure by 35%, and maintained the average
man-days of training per employee at above seven days for the
sixth consecutive year, once more exceeding our target of five days.
We further strengthened our e-learning infrastructure to facilitate
learning across different geographies and time zones, increasing the
amount of training conducted via e-learning by 31%.
Our employee engagement score increased by four percentage
points in 2011, marking a ninth year of consecutive improvement.
Our score is now within Hewitt’s High Performance/Best Employer
Range, and above the Global Financial Norm engagement score.
To give deserving children of our employees the opportunity to
pursue their aspirations, we increased the number of undergraduate
scholarships for children of staff from six to 11, and extended the
program to employees of OCBC China.
Our employee share ownership schemes continued to receive a high
participation rate. 61% of bank employees were OCBC shareholders
(including share options and deferred shares) at the end of 2011 –
well above our target of 30%.
27OCBC Annual Report 2011

CARING FOR UNDERPRIVILEGED CHILDREN
At OCBC, we give back to the communities in which we prosper
by focusing on community development with two themes, namely
nurturing children and young adults, and promoting education.
In Singapore, our long running charity partner is the Singapore
Children’s Society (“SCS”). We have been supporting the SCS on an
annual basis since 2004, and by 2013, our contributions will have
amounted to S$5 million. Our donations are used to cover the costs
of programmes to give children and youth from low-income and
disadvantaged families the opportunity to build their emotional,
intellectual, social and physical skills at various SCS centres, as well
as covering the operating costs of running Sunbeam Place. Located
in Hong San Terrace, Sunbeam Place is a stay-in facility that offers
a safe and home-like environment to more than 65 abused and
neglected children aged between two and 18 years.
In China, our philanthropic effort has been centred around the
Shanghai Soong Ching Ling Foundation (“SSCLF”) since 2007,
a partnership we started close to the time when we locally
incorporated our bank there. We initiated our partnership with a
donation of RMB1.5 million (S$300,000) to be released in equal
annual installments over six years. Our contributions, which are
disbursed through the Soong Ching Ling Scholarship (“SCLS”)
under the SCLS-OCBC Fund, have helped more than 350
outstanding children across China who require financial assistance
to pursue their education.
STAFF VOLUNTEER PROGRAmmE
Over the past year, more than 950 employees in Singapore, Malaysia
and China volunteered for activities that helped needy children and
their families.
In Singapore, the appointment of CSR co-ordinators at divisional
levels to encourage volunteerism helped raise staff participation
from 250 to 600 volunteers, and saw the number of organised
volunteer events double, compared with the previous year.
Our employees helped organise various activities for the children at
the SCS. These activities were broad ranging, including an artistic
graffiti rendition at the Jurong Youth Centre, an in-line skating
adventure with the children of the Yishun Family Service Centre,
movie outings, computer workshops and reading programmes
as well as participation at the SCS Bully-Free forum and Walk for
our Children 2011. Through fund-raising activities organised by
employees such as food fairs and auctions, more than S$29,000
was raised for the SCS. For the ninth consecutive year, we received
the Gopal Haridas award from the SCS for being the biggest donor
in the preceding year.
Every year, employees from our Group Human Resources division in
Singapore perform a traditional Lion Dance during the Lunar New
Year, visiting various OCBC and Great Eastern departments to raise
funds. Last year, this activity raised close to S$18,000 for the
Straits Times School Pocket Money Fund, which provides needy
children with pocket money for school.
Finalists of the Little Debate organised by OCBC China and the Shanghai Soong Ching Ling Foundation, to encourage the children of migrant workers in Shanghai.
Corporate Social Responsibility
28 OCBC Annual Report 2011

The funds raised totalled S$100,000. The money went to Child
Aid, a fund-raising event organised by Singapore Press Holdings
to support its two social causes – the Straits Times Pocket Money
Fund and the Business Times Budding Artists Fund.
In Malaysia, we continued to focus on helping underprivileged
children. More than 230 employees of OCBC Malaysia participated
in various volunteer activities including conducting eye examination
tests for school children, distributing spectacles to needy individuals,
visiting orphanages and helping out at the Pertiwi Soup Kitchen,
which provides meals to the homeless at various locations around
Kuala Lumpur.
In China, at the launch of the first OCBC China Family Day, our
employees organised a charity sale and auction – raising close to
RMB24,000 to help fund the education of needy children.
OCBC China and SSCLF jointly hosted the inaugural OCBC China
Little Debate to encourage the children of migrant workers in
Shanghai to express their views and thereby build confidence as they
assimilate into life in that city. In the finals held on 8 December 2011,
Jinding Primary School emerged champions. More than 12 schools
and 100 students took part in the event. We received very good
feedback from academics, parents and teachers on the impact the
Debate had on the students.
In Indonesia, our Group Operations and Technology division worked
with our subsidiary, Bank OCBC NISP, to support a community
development initiative in Banjaran, Bandung, in collaboration
with Habitat for Humanity. 2011 marked the final year of the
programme which saw more than 50 volunteers from OCBC Bank
Students from Dengkil, Selangor were delighted when volunteers from OCBC Malaysia, Market Risk Management visited them to present gifts of spectacles.The staff raised funds to help pay for the children’s eye examinations and spectacles.
More than 140 employees from various divisions helped to prepare
meals at Willing Hearts, a 100% volunteer-based non-profit
organisation that operates a soup kitchen which supplies simple
and nutritious meals to more than 1,000 needy families throughout
Singapore on a daily basis. Our Consumer Financial Services division
has chosen Willing Hearts as its adopted charity, with a commitment
of S$34,000 to support a 12-month food contribution programme
and volunteers to help at the kitchen at least once a month.
Our Treasury and Investment Banking divisions in Singapore held an
auction at their combined Dinner and Dance event in December 2011.
Our volunteers from OCBC Singapore, Group Operations and Technology and Bank OCBC NISP at the classroom building site in Banjaran, Bandung.
29OCBC Annual Report 2011

OCBC Singapore volunteers helping out at Willing Hearts, a soup kitchen that prepares meals for more than 1,000 needy families daily.
Colleagues from OCBC Singapore, Group Operations and Technology and youths from Jurong Youth Centre exercise meaningful self-expression through graffiti.
and Bank OCBC NISP return to Bandung for further construction
efforts. In total, 20 houses have been built by our volunteers, along
with four new classrooms and a computer laboratory.
To bring about a sustainable increase in our employee volunteerism
rate, we set up a task force to develop an enhanced employee
volunteer programme. The task force reviewed the current OCBC
CSR framework, conducted a peer-comparison exercise, and
initiated an employee survey on our current CSR programme.
Based on the findings, we launched an expanded Staff Volunteer
programme in January 2012 to cover five categories, namely the
environment, families (including children, young adults and the
elderly), humanitarian efforts, education and cycling.
SUPPORTING EDUCATION
We continued to encourage and support academic excellence by
awarding book prizes and bond-free scholarships to outstanding
young adults from Singapore, Malaysia, Indonesia and China to
pursue tertiary education in Singapore and Malaysia. Over the
years, we have presented more than 530 book prizes in Singapore
to outstanding students in various tertiary institutions, to recognise
their academic achievements. To date, we have also awarded
more than 500 bond-free undergraduate scholarships in Singapore
and Malaysia to deserving students who were selected based
on merit, to help them achieve their goals in view of their less
fortunate family circumstances. We also offered our scholars and
other undergraduates the opportunity to experience working in
OCBC, and more than 170 students participated in our Structured
Internship Programme in Singapore and Malaysia in 2011.
Corporate Social Responsibility
30 OCBC Annual Report 2011

SUPPORTING CyCLING, A GROwING SPORT
2011 was our third year as the main sponsor of OCBC Cycle
Singapore, the mass cycling event organised to promote an active
lifestyle, engagement with the community and staff bonding within
the OCBC group of companies. Our sponsorship was also another
way for us to give back to the community.
With the growing interest in cycling as a community sport and
increased awareness of OCBC Cycle Singapore, more than 10,000
cyclists took to closed roads in Singapore on 4 and 5 March 2011.
More than 340 OCBC and Great Eastern employees rode in the
Corporate Challenge, an increase of almost 40% over the
previous year.
To further play our part to help the needy in Singapore, OCBC
Cycle Singapore supported two charities - the National Cancer
Centre Research Foundation (“NCCRF”) and our adopted charity
partner, the SCS. Cyclists could choose to raise funds among their
friends and relatives to support one of the two charities. More than
S$10,600 was raised.
In line with this sponsorship, OCBC, the Singapore Sports Council
(“SSC”) and the Singapore Cycling Federation (“SCF”) continued
our partnership to train and develop a pool of talented cyclists who
represent Singapore at major Games. The team is sponsored by
OCBC and trained by the SSC and SCF.
The inaugural OCBC Cycle Malaysia 2011 was held from 14 to 16 October at Dataran Merdeka in the heart of Kuala Lumpur.
OCBC Cycle Singapore 2011 attracted more than 10,000 participants, includingthe young.
31OCBC Annual Report 2011

Home of Peace, a shelter for abused, neglected and orphaned girls
aged five to 18. CEO and Director of OCBC Malaysia, Jeffrey Chew,
together with employees of OCBC Malaysia and the organisers of
OCBC Cycle Malaysia, accompanied the children on their first ride
on their bicycles.
PARTNERING LIkE-mINDED ORGANISATIONS
We are a pioneer member of Singapore Compact for CSR and
have been a signatory to the United Nations (“UN”) Global Compact
since 2006.
The Singapore Compact functions as a national society in furthering
the CSR movement in Singapore, through ongoing dialogues,
training, collaboration and practical project implementation. Last year,
we participated in the Singapore Compact CSR Summit 2011 to
better understand that value of sustainability efforts on investor
and shareholder relations, human capital and the environment.
OCBC supports the 10 principles of the UN Global Compact
covering the areas of human rights, labour laws, the environment
and the fight against corruption.
Corporate Social Responsibility
On 8 December 2011, we launched the second OCBC Cycle
Singapore Safe Cycling Campaign to promote cycling in a safe
environment. 17 December 2011 was designated the OCBC Cycle
Singapore Safe Cycling Day. Many cyclists donned OCBC Safe
Cycling jerseys and rode on various roads to raise awareness of the
need for both cyclists and motorists to respect each other in sharing
the roads. Launched in partnership with Caltex, the month-long
campaign involved the distribution of OCBC-sponsored materials
– 50,000 car decals and 2,000 cycling jerseys – carrying the key
message, “1.5M Matters. Sharing Saves Lives”.
Following the success of OCBC Cycle Singapore, we launched
OCBC Cycle Malaysia 2011, held from 14 to 16 October. More
than 3,500 participants cycled on closed roads in the heart of
Kuala Lumpur City across six categories, from tricycle rides for toddlers
to the 52-km Challenge and 21-km Community Ride. A total of
97 Malaysian professional cyclists including the Malaysian cyclist,
Anuar Manan, and several of his teammates from the Terengganu
Pro-Asia Cycling Team, took part in the local professional criterium.
In line with the inaugural launch of OCBC Cycle Malaysia,
we presented 15 bicycles to underprivileged children at the
Mr Jeffrey Chew, CEO of OCBC Malaysia (facing children, second from right) presenting a gift of bicycles to children at the Home of Peace in Kuala Lumpur.
32 OCBC Annual Report 2011

OCBC Bank is fully committed to integrity and fair dealing in
all its activities, and upholds the highest standards of corporate
governance. It adopts corporate governance practices in conformity
with the Banking (Corporate Governance) Regulations 2005, Banking
(Corporate Governance) (Amendment) Regulations 2010 and
corporate governance guidelines issued by the Monetary Authority
of Singapore (“MAS”), as well as with the Code of Corporate
Governance 2005 (the “Code”) adopted by the Singapore Exchange
Securities Trading Ltd (“SGX-ST”).
BOARD OF DIRECTORS
Board Composition and Independence
An independent Director in OCBC Bank is one who is independent
from management, substantial shareholder, business relationship with
the Bank, and has not served for more than 9 years on the Board.
The Board at present comprises 14 Directors, of whom, eight are
independent Directors. They are Mr Bobby Chin, Mrs Fang Ai Lian,
Mr Colm McCarthy, Professor Neo Boon Siong, Mr Quah Wee Ghee,
Dato’ Ooi Sang Kuang, Dr Teh Kok Peng and Mr Patrick Yeoh.
Mr Patrick Yeoh has decided to retire and will not seek re-appointment
at the forthcoming AGM. The Board will comprise a majority of
independent Directors after the AGM. Seven are independent
Directors out of a total of 13 Directors.
Mr Lee Seng Wee and Dr Lee Tih Shih are not independent from
substantial shareholder, but deemed independent from management
and business relationships. The Chairman, Dr Cheong Choong Kong,
although a non-executive Director, is deemed not independent from
business relationship because of an agreement made between
Dr Cheong and OCBC Management Services Private Limited, a
wholly-owned subsidiary of the Bank, under which Dr Cheong is
appointed as a consultant and entitled to certain payments and
benefits (details of which are provided in the Directors’ Report).
Mr David Conner, Mr Lai Teck Poh and Mr Pramukti Surjaudaja
are not independent from management. Mr David Conner is Chief
Executive Officer (“CEO”) of the Bank. Mr Lai Teck Poh was a former
executive of the Bank who retired in April 2010. (A director who
has been employed by the Bank in any of the preceding three
financial years is deemed to be non-independent). Mr Pramukti
Surjaudaja has an immediate relative, a sister, who is chief
executive of the Bank’s subsidiary, PT Bank OCBC NISP Tbk.
The roles of the Chairman and the CEO are separated, which is
consistent with the principle of instituting an appropriate balance
of power and authority. The Board has not appointed a Lead
Independent Director because the Chairman and CEO are already
separate persons and the Chairman, a non-executive Director,
performs an effective check and balance on management. The
appointment of a Lead Independent Director will unnecessarily
diffuse board leadership, given the board size of 12-14 deemed
appropriate for the Bank. The Nominating Committee, which assesses
the performance of the Directors, including the Chairman, is also
chaired by an independent Director.
The Chairman’s responsibilities, to name a few, include leading the
Board to ensure its effectiveness on all aspects of its role; setting its
meeting agenda; ensuring that Directors receive accurate, timely
and clear information; ensuring effective communication with
shareholders; encouraging constructive relations between the
Board and Management; facilitating the effective contribution of
non-executive Directors; ensuring constructive relations between the
executive Director and non-executive Directors; and, promoting high
standards of corporate governance.
The Board identifies the skills that it collectively needs to discharge
its responsibilities effectively, and steps are taken to improve
effectiveness, where necessary. It is assessed that the members of
the Board as a group provide skills and competencies to ensure
the effectiveness of the Board and its committees. These include
banking, insurance, accounting, finance, law, strategy formulation,
business acumen, management experience, understanding of
industry and customer, familiarity with regulatory requirements
and knowledge of risk management. Details of the Directors’
professional qualifications and background can be found on pages
182 to 186.
As a principle of good corporate governance, all Directors are
subject to re-nomination and re-election at regular intervals and at
least every three years. The Bank’s Articles of Association provide
for the retirement of Directors by rotation and all appointments
and re-appointments of Directors have to be approved by the MAS.
Given the size of the Bank, its business complexity and the number
of board committees, the Board considered that an appropriate
board size is between 12 and 14 members. The number of Board
members is currently 14.
Board Conduct and Responsibilities
The Board is elected by the shareholders to supervise the
management of the business and affairs of the Bank. The prime
stewardship responsibility of the Board is to ensure the viability of
the Bank and to ensure that it is managed in the best interest of the
shareholders as a whole while taking into account the interests of
other stakeholders. Broadly, the responsibilities of the Board include
the following:
• reviewing and approving overall business strategy, as well
as organisation structure, developed and recommended by
management;
• ensuring that decisions and investments are consistent with
long-term strategic goals;
• ensuring that the Bank is operated to preserve its financial
integrity and in accordance with policies approved by the Board;
• overseeing, through the Audit Committee, the quality and
integrity of the accounting and financial reporting systems,
disclosure controls and procedures and internal controls; and
through the Risk Management Committee, the quality of the
risk management processes and systems;
Corporate Governance
33OCBC Annual Report 2011

• providing oversight in ensuring that the Bank’s risk appetite
and activities are consistent with the strategic intent, operating
environment, effective internal controls, capital sufficiency and
regulatory standards;
• overseeing, through the Risk Management Committee,
the establishment and operation of an independent risk
management system for managing risks on an enterprise-wide
basis, the adequacy of the risk management function (including
ensuring that it is sufficiently resourced to monitor risk by the
various risk categories and that it has appropriate independent
reporting lines), and the quality of the risk management
processes and systems;
• reviewing any transaction for the acquisition or disposal of
assets that is material to the Bank;
• ensuring that the necessary human resources are in place for the
Bank to meet its objectives, as well as appointing and removing
executive officers, as deemed necessary;
• reviewing management performance and ensuring that
management formulates policies and processes to promote fair
practices and high standards of business conduct by staff;
• establishing corporate values and standards, emphasising
integrity, honesty and proper conduct at all times with respect to
internal dealings and external transactions, including situations
where there are potential conflicts of interest;
• overseeing, through the Remuneration Committee, the design
and operation of an appropriate remuneration framework, and
ensuring that the remuneration practices are aligned and in
accord with the remuneration framework;
• providing a balanced and understandable assessment of the
Bank’s performance, position and prospects, and this extends to
interim and other price-sensitive public reports, and reports to
regulators;
• ensuring that obligations to shareholders and others are
understood and met; and
• maintaining records of all meetings of the Board and Board
Committees, in particular records of discussion on key
deliberations and decisions taken.
The non-executive Directors on the Board constructively challenge
and help develop proposals on strategy, and review the performance
of management in meeting agreed goals and objectives and
monitor the reporting of performance. They meet during the year,
without the presence of management, to discuss the effectiveness
of management.
In 2011, the Board and its committees held a total of 43 meetings.
Prior to each meeting, members are provided with timely and
complete information to enable them to fulfil their responsibilities.
Information provided includes background information on matters to
be addressed by the Board, copies of disclosure documents, monthly
internal financial statements, risk management reports, budgets,
forecasts, and reports of variances from budgets and forecasts.
The Board and its committees have unfettered access to information
which the Bank is in possession of and to the Bank’s senior
management and company secretary. The Directors, in addition,
could take independent professional advice from legal firms at the
Bank’s expense. The role of the company secretary is defined. He
attends all board meetings and ensures that board procedures and
applicable regulations are complied with. Under the direction of
the Chairman, he ensures good information flows within the Board
and its committees and between senior management and non-
executive Directors, as well as facilitates orientation of new Directors
and professional development of Directors, as required. The
appointment and removal of the company secretary is considered to
be a matter for the Board as a whole.
Board Development
The Directors receive appropriate development on a continuing
basis, to perform their roles on the Board and its committees.
This, among other subjects, includes updates on regulatory
developments, new business and products, accounting and finance,
corporate governance, and risk management, which are provided
by subject-matter experts from within and outside the Bank. The
Directors will participate in external courses, as and when needed.
When deciding on the development to be provided, the skills
required at the Board and its committees are taken into account.
A separate programme is established for new Directors. This focuses
on introductory information, briefings by senior executives on their
respective areas and participation in external courses, where relevant.
Board Performance
The Board has an annual performance evaluation process, carried
out by the Nominating Committee, to assess the effectiveness of
the Board, Board Committees and each Director’s contribution.
The purpose of the evaluation process is to increase the overall
effectiveness of the Board. An independent consultant facilitates
this process.
The Directors participate in the evaluation. Each Director evaluates the
performance of the Board and Board Committees and conducts a peer
assessment of the other Directors. The assessments are made against
pre-established criteria which are derived from the Board’s charter and
responsibilities. The results of the evaluation are used constructively
by the Nominating Committee to discuss improvements with the
Board and ensure that each Director remains qualified for office.
The Chairman acts on the results of the evaluation, and if appropriate,
proposes new Directors or seeks the resignation of Directors, in
consultation with the Nominating Committee.
Directors are expected to set aside adequate time for their oversight
of matters relating to the Bank. The Bank has guidelines on
meeting attendance and the extent of other appointments that a
Director could assume. The Nominating Committee, based on the
guidelines established, assesses annually each Director’s attendance
record and degree of participation at meetings. In respect of other
Corporate Governance
34 OCBC Annual Report 2011

appointments, it takes into account, among various factors, the
nature of the appointment (full-time or otherwise), number of
meetings to attend, complexity of organisation, and degree of
participation in sub-committees.
BOARD COmmITTEES
Executive Committee
The Executive Committee comprises Dr Cheong Choong Kong
(Chairman), Mr Bobby Chin, Mr David Conner, Mr Lee Seng Wee and
Mr Patrick Yeoh. Following the AGM in April 2012, the Committee
will comprise Dr Cheong Choong Kong (Chairman), Mr Bobby
Chin, Mr David Conner, Mr Colm McCarthy and Dr Teh Kok Peng,
subject to the respective Director’s re-appointment or re-election
at the AGM, where applicable. A majority of the Committee, i.e.
Mr Bobby Chin, Mr Colm McCarthy and Dr Teh Kok Peng, will be
independent Directors.
The Committee has written terms of reference that describe the
responsibilities of its members.
The Executive Committee oversees the management of the business
and affairs of the Bank and the Group, within the parameters
delegated by the Board. It reviews the Bank’s policies, principles,
strategies, values, objectives and performance targets. These include
investment and divestment policies. It also endorses such other
matters and initiates any special reviews and actions as appropriate
for the prudent management of the Bank.
Nominating Committee
The Nominating Committee comprises Mrs Fang Ai Lian (Chairman),
Dr Cheong Choong Kong, Mr Lai Teck Poh, Mr Lee Seng Wee and
Professor Neo Boon Siong. Following the AGM in April 2012, the
Committee will comprise Mrs Fang Ai Lian (Chairman), Dr Cheong
Choong Kong, Mr Lee Seng Wee, Professor Neo Boon Siong and
Dato’ Ooi Sang Kuang, subject to the respective Director’s
re-appointment or re-election at the AGM, where applicable. A majority
of the Committee, i.e. Mrs Fang Ai Lian, Professor Neo Boon Siong
and Dato’ Ooi Sang Kuang, will be independent Directors.
The Committee has written terms of reference that describe the
responsibilities of its members.
The Nominating Committee plays a vital role in reinforcing the
principles of transparency and meritocracy at the Bank. It plans
for board succession and ensures that only the most competent
individuals capable of contributing to the success of the organisation
are appointed. This includes review of all nominations for the
appointment, re-appointment, election or re-election of Directors of
the Bank and members of the Executive Committee, Remuneration
Committee, Audit Committee and Risk Management Committee
of the Bank. The Nominating Committee is also charged with
determining annually whether or not a Director is independent,
capable of carrying out the relevant duties and qualified to remain in
office. It also reviews nominations for senior management positions
in the Bank, including the CEO, Chief Operating Officer, Chief
Financial Officer and Chief Risk Officer. The Nominating Committee
makes recommendations to the Board on all such appointments.
The Nominating Committee establishes annually the profile required
of Board members, having regard to the competencies and skills
required at the Board, and makes recommendations to the Board on
appointment of new Directors, when necessary. When the need for
a new Director is identified, the Nominating Committee will prepare
a shortlist of candidates with the appropriate profile and qualities
for nomination. The Nominating Committee may engage external
search consultants to search for the Director. The Board reviews
the recommendation of the Nominating Committee and appoints
the new Director, subject to the approval of MAS. In accordance
with the Bank’s Articles of Association, the new Director will hold
office until the next AGM, and if eligible, the Director can stand for
re-election.
Audit Committee
The Audit Committee comprises Mr Bobby Chin (Chairman),
Mr Colm McCarthy and Professor Neo Boon Siong. Following
the AGM in April 2012, the Committee will comprise Mr Bobby
Chin (Chairman), Mr Colm McCarthy, Dato’ Ooi Sang Kuang and
Dr Teh Kok Peng, subject to the respective Director’s re-election
at the AGM, where applicable. All the Committee members are
independent Directors and have accounting or related financial
management expertise and experience.
The Audit Committee performs the functions specified in the
Companies Act, the Code, the SGX-ST Listing Manual, and the
MAS’ corporate governance regulations and guidelines.
The Committee has written terms of reference that describe the
responsibilities of its members. The Board approved the terms of
reference of the Audit Committee. The Committee may meet at
any time but no less than four times a year. It has full access to, and
co-operation from management, and has the discretion to invite any
Director and executive officer to attend its meetings. It has explicit
authority to investigate any matter within its terms of reference.
In addition to the review of the Group Financial Statements, the
Audit Committee reviews and evaluates with the external auditors
and internal auditors, the adequacy of the system of internal
controls including financial, operational and compliance controls,
and risk management policies and systems. It reviews the scope
and results of the audits, the cost effectiveness of the audits, and
the independence and objectivity of the external auditors. When
the external auditors provide non-audit services to the Bank, the
Committee keeps the nature, extent and costs of such services
under review. This is to balance the objectivity of the external
auditors against their ability to provide value-for-money services. The
Audit Committee also reviews significant financial reporting issues
and judgments to ensure the integrity of the financial statements,
and announcements relating to financial performance.
35OCBC Annual Report 2011

The Bank has in place a whistle blowing policy and the Audit
Committee reviews concerns, including anonymous complaints,
which staff may, in confidence, raise about possible improprieties
in matters of financial reporting or other matters, and have the
concerns independently investigated and followed up. It meets at
least once a year with the external auditors and internal auditors
in separate sessions and without the presence of management, to
consider any matters which might be raised privately. In addition,
the Chairman of the Audit Committee meets the head of internal
audit on a regular basis to discuss the work undertaken, key
findings and any other significant matters arising from the Group’s
operations. Formal reports are sent to the Audit Committee on a
regular basis. The Board is updated on these reports. The Audit
Committee has received the requisite disclosures from the external
auditors evidencing the latter’s independence. It is satisfied that the
financial, professional and business relationships between the Group
and the external auditors are compatible with maintaining the
independence of the external auditors.
In respect of the 2011 financial year, the Audit Committee
(a) has reviewed the audited financial statements with
management, including discussions of the quality of the
accounting principles applied and significant judgments
affecting the financial statements;
(b) has discussed with the external auditors the quality of the above
principles and judgments;
(c) believes that the financial statements are fairly presented in
conformity with the relevant Singapore Financial Reporting
Standards in all material aspects, based on its review and
discussions with management and the external auditors.
Where appropriate, the Audit Committee has adopted relevant
best practices set out in the Guidebook for Audit Committees in
Singapore issued by the Audit Committee Guidance Committee.
Internal Audit Function
The Audit Committee approves the terms of reference of internal
audit (Group Audit) and reviews the effectiveness of the internal
audit function. In line with leading practice, Group Audit’s mission
statement and charter requires it to provide independent and
reasonable, but not absolute, assurance that the Banking Group’s
system of risk management, control, and governance processes, as
designed and implemented by senior management, are adequate
and effective. Group Audit reports on the adequacy of the system
of internal controls to the Audit Committee and management, but
does not form any part of the system of internal controls. Group
Audit meets or exceeds the Standards for the Professional Practice
of Internal Auditing of The Institute of Internal Auditors.
Group Audit has implemented risk-based audit processes. Audit
work is prioritised and scoped according to an assessment of
risk exposures, including not only financial risks, but operational,
compliance and strategic risks as well.
The work undertaken by Group Audit includes the audit of the
Group’s system of internal controls over its key operations (including
overseas branches), review of security and access controls for the
Group’s key computer systems, review of control processes within
and around new products and system enhancements, and review
of controls over the monitoring of market, liquidity, and credit risks.
Group Audit also participates in major new system developments
and special projects, to help evaluate risk exposures and to help
ensure that proposed compensating internal controls are adequately
evaluated on a timely basis. It also ascertains that the internal
controls are adequate to ensure prompt and accurate recording of
transactions and proper safeguarding of assets, and that the Bank
complies with laws and regulations, adheres to established policies
and takes appropriate steps to address control deficiencies.
The Audit Committee is responsible for the adequacy of the
internal audit function, its resources and its standing, and ensures
that processes are in place for recommendations raised in internal
audit reports to be dealt with in a timely manner and outstanding
exceptions or recommendations are closely monitored. Group Audit
reports functionally to the Audit Committee and administratively to
the CEO, and has unfettered access to the Audit Committee, Board
and senior management, as well as the right to seek information
and explanations. Currently, the number of internal audit staff is
129 in the division (and 208 in the Group). The division is organised
into departments that are aligned with the structure of the Bank.
The Audit Committee approves the appointment and removal of the
Head of Group Audit.
Internal Controls
The Board believes, with the concurrence of the Audit Committee,
that the system of internal controls, including financial, operational
and compliance controls and risk management systems, maintained
by the Bank’s management and that was in place throughout the
financial year and up to and as of the date of this report, is adequate
to meet the needs of the Bank in its current business environment.
The system of internal controls provides reasonable, but not
absolute, assurance that the Bank will not be adversely affected
by any event that could be reasonably foreseen as it strives to
achieve its business objectives. However, the Board also notes that
no system of internal controls can provide absolute assurance in this
regard, or absolute assurance against the occurrence of material
errors, poor judgment in decision-making, human error, losses, fraud
or other irregularities.
Remuneration Committee
The Remuneration Committee comprises Mrs Fang Ai Lian
(Chairman), Dr Cheong Choong Kong, Dr Lee Tih Shih and
Professor Neo Boon Siong. Following the AGM in April 2012,
the Committee will comprise Mrs Fang Ai Lian (Chairman),
Dr Cheong Choong Kong, Dr Lee Tih Shih, Professor Neo Boon Siong
and Mr Quah Wee Ghee, subject to the respective Director’s
re-appointment or re-election at the AGM, where applicable.
Corporate Governance
36 OCBC Annual Report 2011

A majority of the Committee, i.e. Mrs Fang Ai Lian, Professor Neo
Boon Siong and Mr Quah Wee Ghee, will be independent Directors.
All the Committee members are well versed with executive
compensation matters, given their extensive experience in senior
corporate positions and major appointments.
The Committee has written terms of reference that describe the
responsibilities of its members.
The Remuneration Committee recommends to the Board a
framework for determining the remuneration of the directors
and executive officers, and reviews the remuneration practices
to ensure that they are aligned with the approved framework. It
also recommends the remuneration and fees of non-executive
Directors as well as the compensation of executive Directors, and is
empowered to review the human resources management policies
and the policies governing the compensation of executive officers of
the Bank and its subsidiaries, as well as the remuneration of senior
executives. In addition, it administers the various employee share
ownership schemes. The Remuneration Committee, if necessary,
will seek independent expert advice from outside the Bank on
remuneration matters. In its deliberations, the Remuneration
Committee takes into account remuneration principles, practices
and standards that may be specified by the MAS from time to time.
Risk management Committee
The Risk Management Committee, which supports the Board in
performing its risk oversight responsibilities, comprises Mr Patrick
Yeoh (Chairman), Dr Cheong Choong Kong, Mr David Conner,
Mr Lai Teck Poh, Mr Colm McCarthy and Mr Pramukti Surjaudaja.
Following the AGM in April 2012, the Committee will comprise
Mr Lai Teck Poh (Chairman), Dr Cheong Choong Kong,
Mr David Conner, Mr Colm McCarthy, Mr Quah Wee Ghee and
Mr Pramukti Surjaudaja, subject to the respective Director’s
re-appointment or re-election at the AGM, where applicable.
All the Committee members are non-executive Directors (including
Mr David Conner who will have retired as CEO). Members of the
Committee have relevant technical financial sophistication in risk
disciplines or business experience.
The Committee has written terms of reference that describe the
responsibilities of its members.
The Committee reviews the overall risk management philosophy,
guidelines and major policies for effective risk management,
including the risk profile, risk tolerance level and risk strategy. The
Committee reviews the scope, effectiveness and objectivity of Group
Risk Management and the risk reports that monitor and control risk
exposures. It also oversees the establishment and operation of an
independent risk management system for identifying, measuring,
monitoring, controlling and reporting risks on an enterprise-
wide basis, including ensuring the adequacy of risk management
practices for material risks.
Board (3) Executive Committee Audit Committee
Name of Director Scheduled meeting Scheduled meeting Scheduled meeting Ad hoc meeting
Held (1) Attended Held (1) Attended Held (1) Attended Attended
Cheong Choong Kong 10 10 7 7 – – –
Bobby Chin 10 10 7 7 6 6 1
David Conner 10 10 7 7 – – –
Fang Ai Lian 10 10 – – – – –
Lai Teck Poh 10 10 – – – – –
Lee Seng Wee 10 10 7 7 – – –
Lee Tih Shih 10 10 – – – – –
Colm McCarthy 10 10 – – 6 6 –
Neo Boon Siong 10 10 – – 6 6 1
Pramukti Surjaudaja 10 10 – – – – –
Teh Kok Peng (2) 4 4 – – – – –
Patrick Yeoh 10 10 7 7 – – –
DIRECTORS’ ATTENDANCE AT BOARD AND BOARD COmmITTEE mEETINGS IN 2011
37OCBC Annual Report 2011
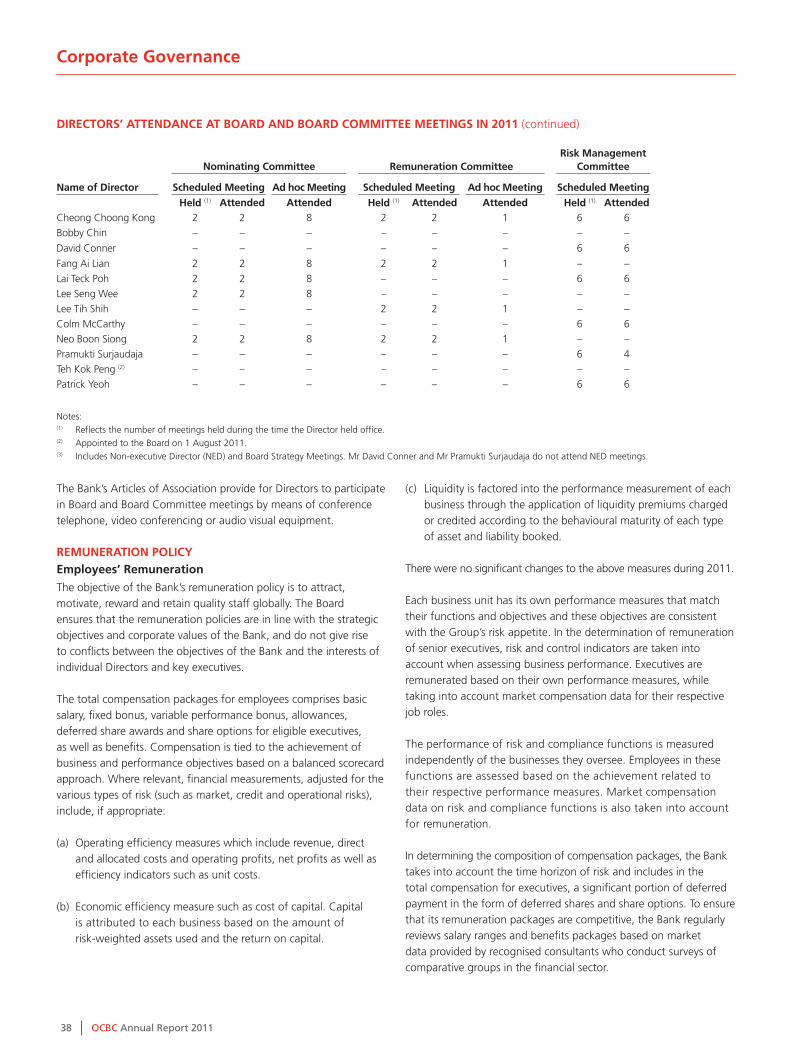
Nominating Committee Remuneration CommitteeRisk management
Committee
Name of Director Scheduled meeting Ad hoc meeting Scheduled meeting Ad hoc meeting Scheduled meeting
Held (1) Attended Attended Held (1) Attended Attended Held (1) Attended
Cheong Choong Kong 2 2 8 2 2 1 6 6
Bobby Chin – – – – – – – –
David Conner – – – – – – 6 6
Fang Ai Lian 2 2 8 2 2 1 – –
Lai Teck Poh 2 2 8 – – – 6 6
Lee Seng Wee 2 2 8 – – – – –
Lee Tih Shih – – – 2 2 1 – –
Colm McCarthy – – – – – – 6 6
Neo Boon Siong 2 2 8 2 2 1 – –
Pramukti Surjaudaja – – – – – – 6 4
Teh Kok Peng (2) – – – – – – – –
Patrick Yeoh – – – – – – 6 6
Notes: (1) Reflects the number of meetings held during the time the Director held office. (2) Appointed to the Board on 1 August 2011. (3) Includes Non-executive Director (NED) and Board Strategy Meetings. Mr David Conner and Mr Pramukti Surjaudaja do not attend NED meetings.
The Bank’s Articles of Association provide for Directors to participate
in Board and Board Committee meetings by means of conference
telephone, video conferencing or audio visual equipment.
REmUNERATION POLICyEmployees’ Remuneration
The objective of the Bank’s remuneration policy is to attract,
motivate, reward and retain quality staff globally. The Board
ensures that the remuneration policies are in line with the strategic
objectives and corporate values of the Bank, and do not give rise
to conflicts between the objectives of the Bank and the interests of
individual Directors and key executives.
The total compensation packages for employees comprises basic
salary, fixed bonus, variable performance bonus, allowances,
deferred share awards and share options for eligible executives,
as well as benefits. Compensation is tied to the achievement of
business and performance objectives based on a balanced scorecard
approach. Where relevant, financial measurements, adjusted for the
various types of risk (such as market, credit and operational risks),
include, if appropriate:
(a) Operating efficiency measures which include revenue, direct
and allocated costs and operating profits, net profits as well as
efficiency indicators such as unit costs.
(b) Economic efficiency measure such as cost of capital. Capital
is attributed to each business based on the amount of
risk-weighted assets used and the return on capital.
(c) Liquidity is factored into the performance measurement of each
business through the application of liquidity premiums charged
or credited according to the behavioural maturity of each type
of asset and liability booked.
There were no significant changes to the above measures during 2011.
Each business unit has its own performance measures that match
their functions and objectives and these objectives are consistent
with the Group’s risk appetite. In the determination of remuneration
of senior executives, risk and control indicators are taken into
account when assessing business performance. Executives are
remunerated based on their own performance measures, while
taking into account market compensation data for their respective
job roles.
The performance of risk and compliance functions is measured
independently of the businesses they oversee. Employees in these
functions are assessed based on the achievement related to
their respective performance measures. Market compensation
data on risk and compliance functions is also taken into account
for remuneration.
In determining the composition of compensation packages, the Bank
takes into account the time horizon of risk and includes in the
total compensation for executives, a significant portion of deferred
payment in the form of deferred shares and share options. To ensure
that its remuneration packages are competitive, the Bank regularly
reviews salary ranges and benefits packages based on market
data provided by recognised consultants who conduct surveys of
comparative groups in the financial sector.
DIRECTORS’ ATTENDANCE AT BOARD AND BOARD COmmITTEE mEETINGS IN 2011 (continued)
Corporate Governance
38 OCBC Annual Report 2011

The determination of the Bank’s variable bonus pool is fully
discretionary and the factors taken into consideration include
the Bank’s performance, market conditions and competitive
market practices.
The Bank adopts a performance-driven approach to compensation.
Compensation packages are linked to personal performance,
the performance of the organisational function as a whole and
the overall performance of the Bank. Compensation is reviewed
each year based on information from market surveys provided by
reputable management consultants.
As a consequence of the financial crisis, financial institutions
globally have been reviewing compensation practices to reduce
incentives that encourage excessive risk taking. In 2009, the Financial
Stability Forum (FSF) developed principles and implementation
standards for Sound Compensation Practices for significant financial
institutions. While the Bank’s compensation practices largely meet
the FSF principles and implementation standards, the Bank continues
to review its compensation practices to comply with the required
standards on an ongoing basis. In FY 2011, the Remuneration
Committee made changes to the compensation structure resulting in
an increase in the proportion of the deferred remuneration component
for senior executives.
The Bank has identified a group of senior executives whose
authorities and actions are deemed to have a major influence on the
long term performance of the Bank. This group comprises “senior
management” (the CEO and his direct reports) and “material risk
takers” (employees of Senior Vice President rank and above). The
Board approves the compensation of employees who are direct
reports to the CEO and are of at least Executive Vice President rank,
and the Remuneration Committee approves the compensation of
the other employees in this group of senior executives.
The remuneration practices for staff in bargainable positions are
established through negotiation with the Bank’s unions.
The Bank’s remuneration policy is also applied to all OCBC overseas
branches and the following subsidiaries:
- OCBC Management Services Pte Ltd
- OCBC Securities Pte Ltd
- OCBC Investment Research Pte Ltd
- OCBC Trustee Limited
- e2 Power Pte Ltd
- e2 Power Sendirian Berhad
- OCBC Bank (Malaysia) Berhad
- OCBC Al-Amin Bank Berhad
- OCBC Bank (China) Ltd
Directors’ Remuneration
The Remuneration Committee recommends the remuneration
for executive Directors and non-executive Directors of the Bank.
The remuneration for non-executive Directors is subject to
shareholders’ approval at the AGM.
Compensation of Non-Executive DirectorsOCBC’s remuneration for non-executive Directors is intended
to attract capable individuals to the Board, as well as retain and
motivate them in their roles as non-executive Directors. It aligns
their interest to those of shareholders, is competitive in the region
and recognises individual contributions.
The Remuneration Committee has considered market practices for
non-executive director compensation and on its recommendation,
the Board has decided to adopt the following fee structure to compute
the fee for each non-executive Director of the Bank:
• annual board chairman fee of S$45,000;
• annual retainer fee of S$45,000;
• annual committee chairperson fee of S$60,000 for Audit, Risk
Management and Executive Committees, and S$30,000 for
Nominating and Remuneration Committees;
• annual committee member fee of S$30,000 for Audit, Risk
Management and Executive Committees, and S$15,000
for Nominating and Remuneration Committees (committee
chairpersons are not awarded these fees); and
• attendance fee of S$3,000 per Board or Board Committee
meeting. These attendance fees are paid to non-executive
Directors to recognise their commitment and time spent in
attending each meeting.
The previous year, shareholders approved the grant of 6,000
remuneration shares to each non-executive Director. The remuneration
shares align the interest of non-executive Directors with the interest
of shareholders. At the Remuneration Committee’s recommendation,
the Board has decided to continue with the grant of 6,000 new
ordinary shares to each non-executive Director. Any non-executive
Director who has served less than a full annual term with the Board
will be awarded shares, pro-rated based on the term he has served
in office in the financial year. The resolution proposing these share
grants will be presented to shareholders at the AGM in April 2012.
The CEO is not eligible to receive the Directors’ fees and
remuneration shares.
Under the OCBC Share Option Scheme 2001, the Remuneration
Committee also has the discretion to grant share options to
non-executive Directors in recognition of their contributions.
Compensation of Executive Directors
The compensation plan for the executive Directors is formulated
and reviewed by the Remuneration Committee to ensure that it is
market competitive and that the rewards commensurate with their
contributions. The compensation package comprises basic salary,
benefits-in-kind, performance bonus, incentive bonus, share options,
share awards and compensation in the event of early termination where
service contracts are applicable. Performance and incentive bonuses
relate directly to the financial performance of the Group and the
contributions of the individual executive Director. Under the OCBC Share
Option Scheme 2001, the guidelines on granting of share options to
executive Directors are similar to those for the executives of the Bank.
39OCBC Annual Report 2011
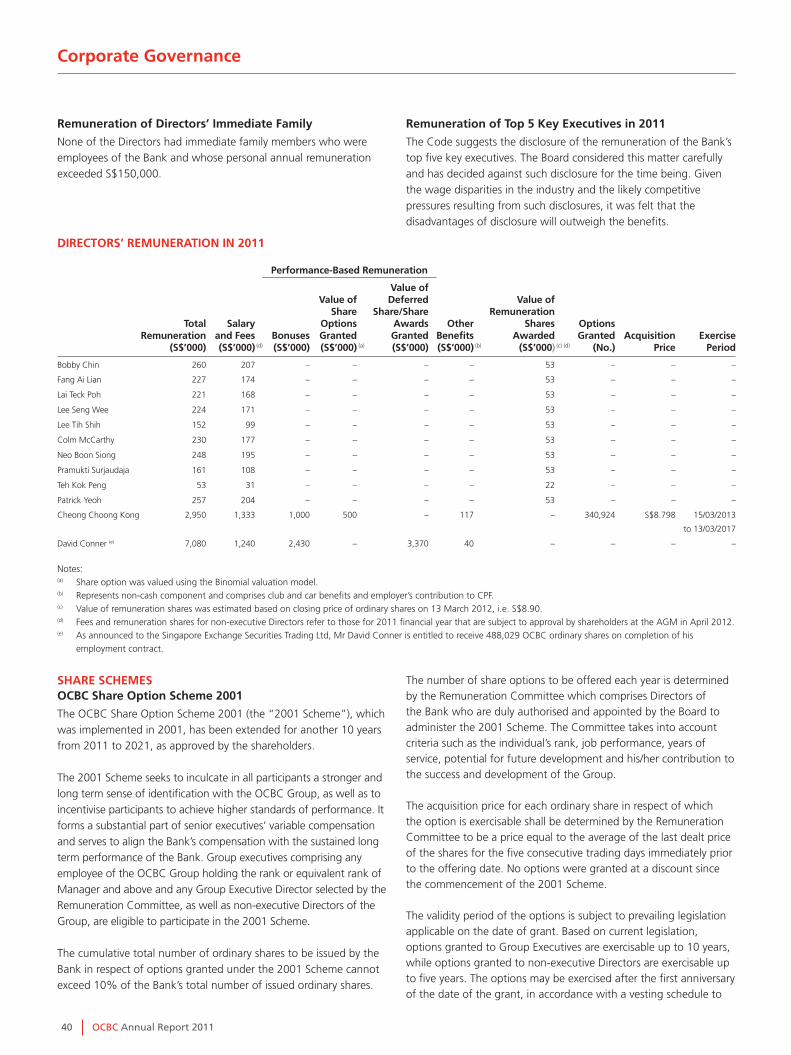
DIRECTORS’ REMUNERATION IN 2011
Remuneration of Directors’ Immediate Family
None of the Directors had immediate family members who were employees of the Bank and whose personal annual remuneration exceeded S$150,000.
Performance-Based Remuneration
Total Remuneration
(S$’000)
Salary and Fees(S$’000)
(d)
Bonuses(S$’000)
Value of Share
Options Granted (S$’000)
(a)
Value of Deferred
Share/Share Awards Granted (S$’000)
Other Benefits (S$’000) (b)
Value of Remuneration
Shares Awarded
(S$’000) (c) (d)
Options Granted
(No.)Acquisition
PriceExercise
Period
Bobby Chin 260 207 – – – – 53 – – –
Fang Ai Lian 227 174 – – – – 53 – – –
Lai Teck Poh 221 168 – – – – 53 – – –
Lee Seng Wee 224 171 – – – – 53 – – –
Lee Tih Shih 152 99 – – – – 53 – – –
Colm McCarthy 230 177 – – – – 53 – – –
Neo Boon Siong 248 195 – – – – 53 – – –
Pramukti Surjaudaja 161 108 – – – – 53 – – –
Teh Kok Peng 53 31 – – – – 22 – – –
Patrick Yeoh 257 204 – – – – 53 – – –
Cheong Choong Kong 2,950 1,333 1,000 500 – 117 – 340,924 S$8.798 15/03/2013
to 13/03/2017
David Conner (e) 7,080 1,240 2,430 – 3,370 40 – – – –
Notes: (a) Share option was valued using the Binomial valuation model. (b) Represents non-cash component and comprises club and car benefits and employer’s contribution to CPF. (c) Value of remuneration shares was estimated based on closing price of ordinary shares on 13 March 2012, i.e. S$8.90. (d) Fees and remuneration shares for non-executive Directors refer to those for 2011 financial year that are subject to approval by shareholders at the AGM in April 2012.(e) As announced to the Singapore Exchange Securities Trading Ltd, Mr David Conner is entitled to receive 488,029 OCBC ordinary shares on completion of his
employment contract.
Remuneration of Top 5 Key Executives in 2011
The Code suggests the disclosure of the remuneration of the Bank’s top fi ve key executives. The Board considered this matter carefully and has decided against such disclosure for the time being. Given the wage disparities in the industry and the likely competitive pressures resulting from such disclosures, it was felt that the disadvantages of disclosure will outweigh the benefi ts.
SHARE SCHEMESOCBC Share Option Scheme 2001
The OCBC Share Option Scheme 2001 (the “2001 Scheme”), which was implemented in 2001, has been extended for another 10 years from 2011 to 2021, as approved by the shareholders.
The 2001 Scheme seeks to inculcate in all participants a stronger and long term sense of identifi cation with the OCBC Group, as well as to incentivise participants to achieve higher standards of performance. It forms a substantial part of senior executives’ variable compensation and serves to align the Bank’s compensation with the sustained long term performance of the Bank. Group executives comprising any employee of the OCBC Group holding the rank or equivalent rank of Manager and above and any Group Executive Director selected by the Remuneration Committee, as well as non-executive Directors of the Group, are eligible to participate in the 2001 Scheme.
The cumulative total number of ordinary shares to be issued by the Bank in respect of options granted under the 2001 Scheme cannot exceed 10% of the Bank’s total number of issued ordinary shares.
The number of share options to be offered each year is determined by the Remuneration Committee which comprises Directors of the Bank who are duly authorised and appointed by the Board to administer the 2001 Scheme. The Committee takes into account criteria such as the individual’s rank, job performance, years of service, potential for future development and his/her contribution to the success and development of the Group.
The acquisition price for each ordinary share in respect of which the option is exercisable shall be determined by the Remuneration Committee to be a price equal to the average of the last dealt price of the shares for the fi ve consecutive trading days immediately prior to the offering date. No options were granted at a discount since the commencement of the 2001 Scheme.
The validity period of the options is subject to prevailing legislation applicable on the date of grant. Based on current legislation, options granted to Group Executives are exercisable up to 10 years, while options granted to non-executive Directors are exercisable up to fi ve years. The options may be exercised after the fi rst anniversary of the date of the grant, in accordance with a vesting schedule to
Corporate Governance
40 OCBC Annual Report 2011
T25595 242163 p40 ONLY.indd 40T25595 242163 p40 ONLY.indd 40 3/15/12 10:17 AM3/15/12 10:17 AM

be determined by the Remuneration Committee on the date of the
grant of the respective options. The Committee has adopted the
following vesting schedule:
Vesting SchedulePercentage of shares over which
an option is exercisable
On or before the first anniversary of the date of grant Nil
After the first anniversary but on or before the second
anniversary of the date of grant
33%
After the second anniversary but on or before the third
anniversary of the date of grant
33%
After the third anniversary but before the date of expiry
of the exercise period
34%
These options will lapse immediately on the termination of
employment and appointment, except in the event of retirement,
redundancy, death, or where approved by the Remuneration
Committee, in which case the Committee may allow the options
to be retained and exercisable within the relevant option periods
or such option periods as may be determined by the Remuneration
Committee. Shares granted on exercise of options are allocated
from treasury shares or from the issue of new ordinary shares by
the Bank.
All awards are subject to cancellation if it is determined that
they were granted on the basis of materially inaccurate financial
statements and/or the employee has engaged in conduct that results
in financial loss, reputational harm, restatement of financial results
and/or adverse changes of the Bank’s risk profile/rating.
OCBC Deferred Share Plan
The OCBC Deferred Share Plan (“Plan”) aims to increase the
performance-orientation and retention factor in compensation
packages of executives, and foster an ownership culture within
the organisation. It also aligns the interests of executives to the
sustained business performance of the Bank. Group executives
holding the rank or equivalent rank of Assistant Manager
and above, and any Group Executive Director selected by the
Remuneration Committee are eligible to participate in the Plan. In
2011, the participants are executives of the Bank, selected overseas
locations and subsidiaries.
There are 2 different types of deferred share awards:
(a) Share awards, which are granted annually to eligible executives
who are paid variable performance bonus of S$70,000 and
above. The share awards form 20% to 40% of their total
variable performance bonus for the year. Half (50%) of the share
awards will vest after two years with the remaining 50% vesting
at the end of three years in accordance with the guidelines
established under the Plan. Prior to the vesting date, the
executives will not be accorded voting rights on the shares.
(b) In addition to the above, senior executives are also granted
deferred share awards as part of their long term incentive
compensation. The whole award vests after three years.
Shares granted are allocated from treasury shares or acquired from
the market in accordance with guidelines established under the
Plan. The unvested deferred share grants will be adjusted to take
into account dividends declared by the Bank. The additional shares
granted in respect of this adjustment are also acquired from the
market in accordance with guidelines established under the Plan.
The awards will lapse immediately on the termination of
employment and appointment, except in the event of retirement,
redundancy, death, or where approved by the Remuneration
Committee, in which case the Committee may allow the awards to
be retained and vested within the relevant vesting periods or such
periods as may be determined by the Remuneration Committee.
All awards are subject to cancellation if it is determined that
they were granted on the basis of materially inaccurate financial
statements and/or the employee has engaged in conduct that results
in financial loss, reputational harm, restatement of financial results
and/or adverse changes of the Bank’s risk profile/rating.
During the financial year, an aggregate of 3,738,677 ordinary shares
were granted to eligible executives of the Group pursuant to the Plan.
OCBC Employee Share Purchase Plan
The OCBC Employee Share Purchase Plan (“ESPP”) was
implemented in 2004 for all employees of the Group, including
executive Directors. It was implemented to inculcate in all
participants a stronger and more lasting sense of identification with
the Group.
The ESPP is a saving-based share ownership plan to help employees
own ordinary shares in the Bank through their monthly contributions
via deductions from payroll and/or CPF funds. The employees have
the option to convert the contributions to ordinary shares after
one year or withdraw the contributions. As a further incentive
to employees to enrol in the ESPP, the Bank pays interest on the
amounts saved at a preferential interest rate.
The duration of offering period is 24 months and the share
acquisition price is fixed before the offering period based on
average of the last traded prices over five consecutive trading days
immediately preceding the price fixing date.
Shares granted on conversions in accordance with the rules of the
ESPP are allocated from treasury shares or from the issue of new
ordinary shares by the Bank.
The aggregate number of new ordinary shares issued by the Bank
pursuant to the 2001 Scheme and the ESPP cannot exceed 5 per
cent of the Bank’s total number of issued ordinary shares.
41OCBC Annual Report 2011

Guaranteed Bonuses, Sign-on Awards, Severance Payments and Variable Remuneration
Category Senior management material Risk Takers
Number of guaranteed bonuses 0 4
Number of sign-on awards 0 1
Number of severance payments 0 0
Total amounts of above payments made during the financial year ($’000) 0 1,326
Number of employees 18 61
Number of employees that received variable remuneration 18 59
Breakdown of Remuneration Awarded in Current Financial yearSenior management material Risk Takers
CategoryUnrestricted
%Deferred
%Unrestricted
%Deferred
%
Fixedremuneration
Cash-based 26 0 46 0
Shares and share-linked instruments 0 0 0 0
Other forms of remuneration 0 0 0 0
Variableremuneration
Cash-based 43 1 32 0
Shares and share-linked instruments 0 30 0 22
Other forms of remuneration 0 0 0 0
Total 100 100
Breakdown of Long-term Remuneration Awards Category Senior management % material Risk Takers %
Change in deferred remuneration awarded in current financial year -8 44
Change in amount of outstanding deferred remuneration from previous financial year
-9 -30
Outstanding deferred remuneration (breakdown):CashShares and share-linked instrumentsOther forms of remunerationTotal
1990
100
01000
100
Outstanding deferred remuneration (performance adjustments):Of which exposed to ex-post adjustmentsReductions in current year due to ex-post adjustments (explicit1)Reductions in current year due to ex-post adjustments (implicit2)
99099
1000
100
Outstanding retained remuneration (performance adjustments):Of which exposed to ex-post adjustmentsReductions in current year due to ex-post adjustments (explicit)Reductions in current year due to ex-post adjustments (implicit)
N.A. N.A.
1 Examples of explicit ex-post adjustments include malus, clawbacks or similar reversals or downward revaluations of awards.2 Examples of implicit ex-post adjustments include fluctuations in the value of shares or performance units.
ADDITIONAL INFORmATION
Corporate Governance
42 OCBC Annual Report 2011

COmmUNICATION wITH SHAREHOLDERS
OCBC Bank recognises the importance of communicating regularly
and effectively with its shareholders so that they can better
understand its operations, strategies and directions. One of the
key roles of the Group’s Corporate Communications and Investor
Relations Units is to keep the market and investors apprised of
the Group’s corporate developments and financial performance
through regular media releases, briefings and meetings with the
media, analysts and fund managers. In addition, shareholders and
the public can access the Group’s media releases, financial results,
presentation materials used at briefings and other corporate
information on the Bank’s website.
Shareholders are given the opportunity to participate actively at
OCBC Bank’s AGMs and EGMs, where they can ask questions and
communicate their views. They are allowed to vote in person or by
proxy. The Directors as well as the external auditors are present at
these meetings to address any relevant queries raised by shareholders.
RELATED PARTy TRANSACTIONS
OCBC Bank has established policies and procedures on related party
transactions. These include definitions of relatedness, limits applied,
terms of transactions, and the authorities and procedures for
approving and monitoring the transactions. The Audit Committee
reviews material related party transactions and keeps the Board
informed of such transactions, if any. Measures are taken to ensure
that terms and conditions of related party lendings are not more
favourable than those granted to non-related obligors under similar
circumstances. The Bank also complies with the SGX-ST Listing
Manual on interested person transactions.
ETHICAL STANDARDSThe Bank has adopted the SGX-ST Listing Manual’s guidelines
on dealings in securities and has a policy against insider trading.
Directors and officers are prohibited from dealing in the securities
of the Bank during the period commencing two weeks before the
announcement of the Bank’s financial statements for each of the
first three quarters of the financial year, and during the period
commencing one month before the announcement of the financial
statements for the financial year, and ending on the date of the
announcement of the relevant results. The Bank also has a policy
on dealings in the listed securities of customers of the Group.
Employees with access to price-sensitive information in the course
of their duties are instructed to conduct all their personal securities
transactions through the Group’s stockbroking subsidiary.
43OCBC Annual Report 2011

Additional Information Required Under the SGx-ST Listing manual
1. INTERESTED PERSON TRANSACTIONS Interested person transactions carried out during the financial year under review:
Aggregate value of all interested person transactions during the
financial year under review (excluding transactions less
than S$100,000 and transactions conducted under shareholders’ mandate pursuant to Rule 920)
Aggregate value of all interested person transactions during the
financial year under review conducted under shareholders’ mandate pursuant to Rule 920
(excluding transactions less than S$100,000)
Name of interested person2011
S$’0002011
S$’000
Tenancy agreement with lessor, Dasar Sentral (M) Sdn Bhd (1)
- lease of premises at Wisma Lee Rubber, Kuala Lumpur 4,138 –
Tenancy agreement with lessee, Lee Rubber Company (Pte) Limited
- lease of premises at OCBC Centre, Singapore 6,787 –
Dr Cheong Choong Kong See below (2) –
(1) Wholly-owned subsidiary of Lee Rubber Company (Pte) Limited (2) There is an existing agreement between Dr Cheong Choong Kong (“Dr Cheong”), non-executive director and Chairman of the Bank, and OCBC Management
Services Private Limited, a wholly-owned subsidiary of the Bank. Please see ”Directors’ Contractual Benefits” in the Directors’ Report for details of payments
made to Dr Cheong during the financial year under review.
2. mATERIAL CONTRACTS
Since the end of the previous financial year, no material contract involving the interest of any Director or controlling shareholder of the
Bank has been entered into by the Bank or any of its subsidiary companies, and no such contract subsisted as at 31 December 2011.
3. APPOINTmENT OF AUDITORS
The Group has complied with Rules 712, 715 and 716 of the Listing Manual issued by Singapore Exchange Securities Trading Limited in
relation to its auditors.
44 OCBC Annual Report 2011

CAPITAL POLICy
The key objective of the Group’s capital management policy is to
maintain a strong capital position to support business growth and
strategic investments, and to sustain investor, depositor, customer
and market confidence. In line with this, OCBC targets a minimum
credit rating of “A” and ensures that its capital adequacy ratios
are comfortably above the regulatory minima, while balancing
shareholders’ desire for sustainable returns and high standards of
prudence. OCBC actively manages its capital composition to achieve
an efficient mix of different capital instruments in order to optimise
its overall cost of capital.
CAPITAL mONITORING AND PLANNING
OCBC Group’s capital is closely monitored and actively managed to
ensure that there is sufficient capital to support business growth,
and to pursue strategic business and investment opportunities
that will create value for our stakeholders, while taking into
consideration the Group’s risk appetite. OCBC Group’s internal
capital adequacy assessment process (“ICAAP”) involves a
comprehensive assessment of all material risks that the Group
is exposed to and an evaluation of the adequacy of the Group’s
capital in relation to those risks. This includes an annual capital
planning exercise to forecast capital demands and assess the
Group’s capital adequacy over a 3-year period. This process
takes into consideration OCBC’s business strategy, operating
environment, target capital ratios and composition, as well as
expectations of its various stakeholders. In addition, capital stress
tests are also conducted to understand the sensitivity of the key
assumptions in the capital plan to the effects of plausible stress
scenarios and evaluate how the Group can continue to maintain
adequate capital under such scenarios.
Within OCBC Group, excess capital will be centralised as far
as possible in order that the Bank can hold all excess capital at
parent level to ensure easy deployment across the Group.
Whilst the transfer of capital resources within the Group is
generally subject to regulations in local jurisdictions, where
applicable, OCBC has not faced significant impediments on
the flow of capital within the Group.
CAPITAL INITIATIVES
The following significant capital initiatives were undertaken by the
Group during the financial year ended 31 December 2011:
Tier 1 Capital
• Issue of 50.7 million new ordinary shares by OCBC Bank on
7 October 2011, representing S$409 million in ordinary share
capital, to shareholders who had elected to participate in the
Scrip Dividend Scheme in respect of the interim dividend for the
financial year ended 31 December 2011.
• Issue of 49.3 million new ordinary shares by OCBC Bank on
13 June 2011, representing S$416 million in ordinary share
capital, to shareholders who had elected to participate in the
Scrip Dividend Scheme in respect of the final dividend for the
financial year ended 31 December 2010.
Capital management
(This section forms an integral part of OCBC’s audited financial statements)
Others
• Issue of S$400 million subordinated notes by The Great Eastern
Life Assurance Co Ltd on 19 January 2011.
• Reduction of capital of S$364 million by Great Eastern
Holdings Ltd on 13 June 2011.
DIVIDEND
Our dividend policy aims to provide shareholders with a predictable
and sustainable dividend return, payable on at least a half-yearly
basis. For the financial year ended 31 December 2011, the Board
of Directors has recommended a final tax exempt dividend of
15 cents per share. This brings the full year 2011 dividend to 30 cents
per share, or an estimated total dividend payout of S$1,024 million,
representing 45% of the Group’s core net profit of S$2,280 million
(2010: total dividend payout of S$994 million, representing 44% of
the Group’s core net profit of S$2,253 million).
SHARE BUyBACk AND TREASURy SHARES
Shares purchased under the share buyback programme are held
as treasury shares. These are recorded as a deduction against
share capital, and may be subsequently cancelled, sold or used to
meet delivery obligations under employee share schemes. During
the financial year ended 31 December 2011, the Bank purchased
10.1 million of its ordinary shares for S$92 million as part of its
third S$500 million share buyback programme, while 9.4 million
treasury shares were delivered to meet obligations under its
employee share schemes.
CAPITAL ADEQUACy RATIOS
OCBC is required by MAS to maintain minimum Tier 1 and total
capital adequacy ratios of 6% and 10%, respectively, at the
Bank and Group levels. In addition, our banking operations in
jurisdictions outside Singapore are subject to local regulations.
OCBC and each of its regulated banking entities were in
compliance with all prescribed capital ratios throughout the
financial period.
The table below shows the composition of the Group’s regulatory
capital and capital adequacy ratios as of 31 December 2011.
The capital adequacy ratios are determined in accordance with the
requirements of MAS Notice 637, which include the definitions
for Tier 1 and Tier 2 capital, the deductions required (mainly for
goodwill, intangible assets, and capital investments in associates
and insurance subsidiaries), as well as the methodologies available
for computing risk-weighted assets. A description of the key terms
and conditions of the capital instruments included within eligible
total capital can be found in Notes 13, 16 and 21 of the financial
statements, and the approaches adopted by OCBC for the
computation of risk-weighted assets can be found in the “Basel II
Pillar 3 Risk Disclosure” chapter.
45OCBC Annual Report 2011

Insurance subsidiaries of Great Eastern Holdings (“GEH”) are not
consolidated for the computation of the above capital adequacy
ratios, as per the requirements of MAS Notice 637. Capital
investments in these insurance subsidiaries are deducted from
OCBC’s Tier 1 and Tier 2 capital, and their assets and liabilities are
excluded from the computation of OCBC’s risk-weighted assets.
GEH’s insurance subsidiaries are required to comply with the capital
ratios prescribed in the insurance regulations of the jurisdiction
in which they operate. As of 31 December 2011, the capital
adequacy ratios for GEH’s insurance subsidiaries in Singapore and
Malaysia were 218% and 279% respectively. These ratios were well
above the minimum regulatory ratios of 120% in Singapore and
130% in Malaysia.
$ million 2011 2010
Tier 1 CapitalOrdinary shares 7,127 6,315
Preference shares 1,896 1,896
Innovative Tier 1 capital instruments 2,062 2,065
Disclosed reserves 12,391 11,216
Non-controlling interests 749 776
24,225 22,268
Goodwill / others (4,009) (4,044)
Deductions from Tier 1 capital (1,604) (1,076)
Eligible Tier 1 Capital 18,612 17,148
Tier 2 CapitalSubordinated term notes 3,343 3,467
Revaluation surplus on available-for-sale equity securities 361 –
Others 140 170
Deductions from Tier 2 capital (2,270) (2,277)
Eligible Total Capital 20,186 18,508
Credit 104,546 84,033
Market 15,817 13,595
Operational 8,144 7,434
Risk weighted Assets 128,507 105,062
Tier 1 capital adequacy ratio 14.4% 16.3%
Total capital adequacy ratio 15.7% 17.6%
REGULATORy CHANGE
In December 2010, the Basel Committee published the Basel III
framework to strengthen global capital standards, with the goal
of promoting a more resilient banking sector. In response to the
Basel Committee’s framework, in December 2011, MAS released
its consultation paper detailing the implementation of the Basel III
capital standards in Singapore. The implementation of the
Basel III capital standards will be phased in from 1 January 2013
to 1 January 2019.
Capital management
(This section forms an integral part of OCBC’s audited financial statements)
46 OCBC Annual Report 2011
Risk management
(This section forms an integral part of OCBC’s audited financial statements)
DEVELOPmENTS IN 2011
During the year, OCBC Group remained focused on our key clients
and markets in Asia. This strategy provided us with healthy and
strong broad based growth, including increased contribution from
our wealth management business through Bank of Singapore
(“BOS”). Loan origination was predominantly focused on firms
with strong risk ratings as we carefully increased our activities
within internal risk limits. Our franchise in China further grew
with emphasis on secured lending and loans to selected top tier
corporates and financial institutions. We also continued to integrate
and consolidate our wealth management platform into BOS and
align its risk approaches and practices towards Group standards.
Despite lingering concerns over a global slowdown caused by problems
of several European economies, we continued to strengthen our
liquidity sources with new and expanded international issuances
aggregating some US$13 billion, including a US$5 billion commercial
paper programme. In core markets of Singapore, Malaysia, Indonesia
and China, we managed to further boost our retail and corporate
deposit bases. OCBC’s asset quality remains solid, and the sound
capital ratio trend continues to improve, well ahead of Basel III
capital requirements. As at 31 December 2011, the non-performing
loan ratio was 0.9% and capital adequacy ratio was 15.7%.
OCBC Group takes a proactive and forward-looking stance in
identifying emerging risks. We have minimal exposure to troubled
European economies and we continue to pare down our overall
exposure to Eurozone counterparties. As we look ahead, we
remain vigilant against slowing global economic growth, uncertain
outcomes from the Eurozone crisis and political instability in
the Middle East. Our strong asset quality and capital position,
underpinned by sound risk practices across the OCBC Group,
position us well to manage the unfolding uncertainties and
challenges. We expect to further deepen our ties with our existing
customers as many global banks, weakened in consolidating their
resources and exposures, reduce their footprint in the region.
RISk mANAGEmENT IN OCBC GROUP
At OCBC Group, we believe that sound risk management is essential
to ensuring success in our risk-taking activities. Our philosophy is to
ensure risks and returns remain consistent with our established risk
appetite. To achieve this, we regularly refine our risk management
approaches to ensure we thoroughly understand the risks we are
taking to identify any emerging portfolio threats at an early stage,
and to develop timely and appropriate risk-response strategies.
The key elements of OCBC Group’s enterprise-wide risk
management strategy are:
• Risk appetite – The Board of Directors approves the Group’s
risk appetite, and risks are managed in alignment with the risk
appetite. Risk-taking decisions must be consistent with strategic
business goals and returns should compensate for the risk taken.
• Risk frameworks – The Group’s risk management
frameworks for all risk types are documented, comprehensive,
and consistent.
• Holistic risk management – Risks are managed holistically,
with a view to understand the potential interactions among
risk types.
• Qualitative and quantitative evaluations – Risks are
evaluated both qualitatively and with appropriate quantitative
analyses and robust stress testing. Risk models are regularly
reviewed to ensure they are appropriate and effective.
The Board of Directors and senior management provide the
direction to the Group’s effective risk management that emphasises
well-considered risk-taking and proactive risk management. This
is reinforced with appropriate risk management staff, ongoing
investments in risk systems, regular review and enhancement of
risk management policies and procedures for consistent application,
overlaid with a strong internal control environment throughout the
Group. Accountability for managing risks is jointly owned among
customer-facing and product business units, dedicated functional
risk management units, as well as other support units such as
Operations and Technology. Group Audit also provides independent
assurance that the Group’s risk management system, control and
governance processes are adequate and effective. Rigorous portfolio
management tools such as stress testing and scenario analyses
identify possible events or market conditions that could adversely
affect the Group. These results are taken into account in the Group’s
capital adequacy assessment.
The discussion in this risk management chapter covers the risk
management practices, policies, and frameworks of OCBC Group,
and does not cover Great Eastern Holdings (“GEH”) and PT Bank
OCBC NISP Tbk (“NISP”). Group management collaborates with
GEH and NISP on aligning their risk management infrastructure
to Group standards through knowledge transfer and training
assistance, and to ensure the risk practices are appropriate for
their businesses. GEH and NISP are listed on Singapore Exchange
and Indonesia Stock Exchange, respectively. As listed companies,
GEH and NISP publish their own annual reports, which contain
information on their risk management frameworks and practices
(refer to Note 39 in the Group’s Financial Statements for
information on GEH’s risk management).
All banking subsidiaries, including Bank of Singapore, are required
to implement risk management policies that conform to Group
standards. Approving authority and limit structures are consistent with
Head Office to ensure accountability and effective risk management.
RISk GOVERNANCE AND ORGANISATION
The Board of Directors establishes the Group’s risk appetite and risk
principles. The Board Risk Management Committee is the principal
Board committee that oversees the Group’s risk management.
It reviews and approves the Group’s overall risk management
philosophy, risk management frameworks, major risk policies,
47OCBC Annual Report 2011

and risk models. The Board Risk Management Committee also
oversees the establishment and operation of the risk management
systems, and receives regular reviews as to their effectiveness. The
Group’s various risk exposures, risk profiles, risk concentrations, and
trends are regularly reported to the Board of Directors and senior
management for discussion and appropriate action.
The Board Risk Management Committee is supported by Group
Risk Management Division, which has functional responsibility
on a day-to-day basis for providing independent risk control and
managing credit, market, operational, liquidity, and other key
risks. Within the division, risk officers are dedicated to establishing
Group-wide policies, risk measurement and methodology, as well
as monitoring the Group’s risk profiles and portfolio concentrations.
The Group’s risk management and reporting systems are designed
to ensure that risks are comprehensively captured in order to support
well-considered decision making, and that the relevant risk information
is effectively conveyed to the appropriate senior management
executives for those risks to be addressed and risk response
strategies to be formulated. To ensure the objectivity of the risk
management functions, compensation of risk officers is determined
independently of other business areas and is reviewed regularly to
ensure compensation remains competitive with market levels.
Credit officers are involved in transaction approvals, and personal
approval authority limits are set based on the relevant experience
of the officers and portfolio coverage. Representatives from the
division also provide expertise during the design and approval
process for new products offered by the Group. This ensures that
new or emerging risks from new products are adequately identified,
measured, and managed within existing risk systems and processes.
Various risk management committees have been established for
active senior management oversight, understanding, and dialogue
on policies, profiles, and activities pertaining to the relevant risk
types. These include the Credit Risk Management Committee,
the Market Risk Management Committee, the Asset and Liability
Management Committee, and the Operational Risk Management
and Information Security Committee. Both risk-taking and risk
control units are represented on these committees, emphasising
shared risk management responsibilities. Group Audit conducts
regular independent reviews of loan portfolios and business
processes to ensure compliance with the Group’s risk management
frameworks, policies, processes, and methodologies.
BASEL II
OCBC Group has implemented Monetary Authority of Singapore
(“MAS”) Notice 637 on Risk Based Capital Adequacy Requirements
for banks incorporated in Singapore with effect from 1 January
2008. MAS Notice 637 adopts the Basel Committee on Banking
Supervision’s proposal on “International Convergence of Capital
Measurement and Capital Standards,” commonly referred to as
Basel II. This framework provides a stronger linkage between capital
requirements and the level of risks undertaken by banks to enhance
their risk management practices and establishes minimum capital
requirements to support credit, market, and operational risks.
As part of enhanced public disclosures on risk profile and capital
adequacy required under MAS Notice 637, the Group has made
additional disclosures since 2008. Please refer to the OCBC Group
Basel II Pillar 3 Risk Disclosure section in the annual report for
more information.
The Group has adopted the Foundation Internal Ratings-Based
(“F-IRB”) approach and supervisory slotting criteria to calculate
credit risk-weighted assets for major non-retail portfolios, and the
Advanced Internal Ratings-Based (“A-IRB”) approach for major retail
and small business lending portfolios. Other credit portfolios are
on the standardised approach (“SA”) and they will be progressively
migrated to the internal ratings-based approaches. The regulatory
capital to be set aside for credit risk-weighted assets depends
on various factors, including internal risk grades, product type,
counterparty type, and maturity.
The Group has adopted the standardised approaches for market
risk and operational risk. Market risk-weighted assets are marked to
market and are risk weighted according to the instrument category,
maturity period, credit quality grade, and other factors. Operational
risk-weighted assets are derived by applying specified beta factors or
percentages to the annual gross income for the prescribed business
lines in accordance with regulatory guidelines. Initiatives are in place
to move toward Internal Model Approach for market risk. The Group
is also conducting the feasibility study on the implementation of
Advanced Measurement Approach for operational risk.
The Group has also established an Internal Capital Adequacy
Assessment Process (“ICAAP”). Capital adequacy assessments and
plans, incorporating stress test results, are submitted annually to MAS.
Implementing the Basel II framework is an integral part of our efforts
to refine and strengthen, as well as to ensure our management of
risks is appropriate for the risks we undertake. Group management
remains vigilant to ongoing industry and regulatory developments,
including risk-adjusted compensation and new standards established
in the Basel III Framework published in December 2010. We are
constantly reviewing to further improve and refine our businesses
and risk management capabilities as well as engaging in dialogue
with industry peers and regulators to position ourselves for the
far-reaching consequences of these reforms.
CREDIT RISk mANAGEmENT
Credit risk arises from the risk of loss of principal or income on
the failure of an obligor or counterparty to meet their contractual
obligations. As our primary business is commercial banking, the
Group is exposed to credit risks from loans to retail, corporate,
and institutional customers. Trading and investment banking
activities, such as trading of derivatives, debt securities, foreign
exchange, commodities, securities underwriting, and settlement
of transactions, also expose the Group to counterparty and issuer
credit risks.
Risk management
(This section forms an integral part of OCBC’s audited financial statements)
48 OCBC Annual Report 2011

The Group seeks to take only credit risks that meet our underwriting
standards. We seek to ensure that risks are commensurate with
potential returns that enhance shareholder value.
Credit Risk management Oversight and Organisation
The Credit Risk Management Committee is the senior management
committee that supports the CEO and the Board Risk Management
Committee in managing the Group’s overall credit risk exposures,
taking a proactive view of risks and to position the credit portfolio.
The Credit Risk Management Committee also reviews the Group’s
credit risk philosophy, framework, and policies, and aligns credit risk
management with business strategy and planning. The Credit Risk
Management Committee recommends credit approval authority
limits, reviews the credit profile of material portfolios, and
recommends actions where necessary to ensure that credit risks
remain within established risk tolerances.
Within Group Risk Management Division, Credit Risk Management
(“CRM”) departments have functional responsibility for credit risk
management, including formulating and ensuring compliance with
Group-wide risk policies, guidelines, and procedures. Other Group
Risk departments are responsible for risk portfolio monitoring, risk
measurement methodology, risk reporting, risk control systems, and
remedial loan management. Group Risk units also conduct regular
credit stress tests to assess the credit portfolio’s vulnerability to
adverse credit risk events.
Regular risk reporting is made to the Board of Directors, Board
Risk Management Committee, and the Credit Risk Management
Committee in a timely, objective, and transparent manner. These
reports include various credit risk aspects such as portfolio quality,
credit migration, expected losses, and concentration risk exposures
by business portfolio and geography. Such reporting allows
senior management to identify adverse credit trends, formulate
and implement timely corrective action, and ensure appropriate
risk-adjusted decision making.
Credit Risk management Approach
Our credit risk management framework includes comprehensive
credit risk policies for approval and management of credit risk,
as well as methodologies and models to quantify these risks in a
consistent manner. While Group policies set our minimum credit
risk management standards, the key to our success lies also in
the experience and sound judgement of our credit officers and
embedded regular credit review process. The internal audit review
also provides an independent assessment of the effectiveness and
adequacy of our credit risk management practices.
Credit underwriting criteria are regularly updated to reflect
prevailing economic conditions in our key markets. In addition,
we remain selective in purchasing debt securities. Portfolio
reviews and stress tests are conducted regularly to identify any
portfolio vulnerabilities. Fair dealing is an integral part of OCBC’s
core corporate values: credit extensions are only offered after a
comprehensive assessment of the borrower’s creditworthiness, as
well as the suitability and appropriateness of the product offering.
Lending to Consumers and Small Businesses
Credit risks for the consumer and small business sectors are
managed on a portfolio basis. Such products include mortgages,
credit cards, auto loans, commercial property loans, and business
term loans. Loans are underwritten under product programmes
that clearly define the target market, underwriting criteria, terms
of lending, maximum exposure, credit origination guidelines, and
verification processes to prevent fraud. The portfolios are closely
monitored using MIS analytics. Scoring models are used in the
credit decision process for some products to enable objective risk
evaluations and consistent decisions, cost efficient processing, and
behavioural score monitoring of expected portfolio performance.
Lending to Corporate and Institutional Customers
Loans to corporate and institutional customers are individually
underwritten and risk-rated. Credit officers identify and assess
the credit risks of large corporate or institutional customers, or
customer groups, taking into consideration their financial and
business profiles, industry and economic factors, collateral, or other
credit support. Credit extensions have to meet pre-defined target
market and risk acceptance criteria. To ensure objectivity in credit
extensions, co-grantor approvals – or joint approvals – are required
from both the business unit as well as credit controllers from the
credit risk function.
Lending to Private Banking Customers
With the acquisition of Bank of Singapore, OCBC has taken a
strategic step towards becoming a leading player in private banking
and wealth management across Asia. The Bank of Singapore
is now an integral part of OCBC, and credit extensions to our
wealth management clients are subject to the same standards
of comprehensive credit assessment, setting of limits, as well as
continuous risk monitoring. Joint approvals from the business and
risk units also ensure objectivity in credit extensions. Loan advance
rates are dependent on the liquidity, volatility and diversification
of the collateral portfolio. Credit exposures that are secured by
marketable securities are subject to daily valuation and independent
price verification.
Credit Risk from Investment or Trading Activities
Counterparty credit risks from our trading, derivative, and debt
securities activities are closely monitored and actively managed
to protect against potential losses in replacing a contract if a
counterparty defaults. Counterparty credit limits are established
for each counterparty following an assessment of the counterparty’s
creditworthiness in accordance with internal policies, as well as
the suitability and appropriateness of the product offering. Credit
exposures are also controlled through independent monitoring and
reporting of excesses and breaches against approved limits and risk
mitigation thresholds.
The Group has limited exposure to asset-backed securities and
collateralised debt obligations and is not active in securitisation
activities.
49OCBC Annual Report 2011

Internal Credit Rating models
Internal credit rating models are an integral part of OCBC Group’s
credit risk management, decision-making process, and regulatory
capital calculations. These internal rating models and the parameters
– probability of default (“PD”), loss given default (“LGD”), and
exposure at default (“EAD”) – are used in limit setting, credit approval,
monitoring, reporting, remedial management, stress testing, and
internal assessment of the adequacy of capital and provisions.
An internal ratings framework has been established to govern the
development and validation of rating models and the application
of these models. Approval for the models and annual validation
tests rests with the Credit Risk Management Committee or Board
Risk Management Committee, depending on the materiality of the
portfolios. All models are subject to independent validation before
implementation to ensure that all aspects of the model development
process have been satisfied. The models are developed with active
participation by credit experts from risk control and business units.
In addition, they are subject to annual review or more frequent
monitoring and independent validation to ensure that they are
performing as expected, and that the assumptions used in model
development remain appropriate. All rating models are also assessed
against regulatory requirements to ensure that they are fit to be
used for regulatory purposes.
The Group’s internal risk grades are not explicitly mapped to
external credit agency ratings. Nevertheless, our internal risk grades
may correlate to external ratings in terms of the probability of
default ranges as factors used to rate obligors would be similar;
an obligor rated poorly by an external rating agency is likely to have
a weaker internal risk rating.
A-IRB for major Retail Portfolios
For regulatory capital requirements, the Group has adopted the
Advanced Internal Ratings-Based (“A-IRB”) approach for major
retail portfolios, including residential mortgages, credit cards, auto
loans, as well as small business lending. Internal rating models,
developed from internal data, are used to estimate PD, LGD, and
EAD parameters for each of these portfolios. Application and
behaviour scorecards are used as key inputs for several retail PD
models. Product, collateral, and geographical characteristics are
major factors used in the LGD and EAD models.
F-IRB for major Non-Retail Portfolios
The Group’s major non-retail portfolios are on the Foundation
Internal Ratings-Based (“F-IRB”) approach for regulatory capital
requirements. Under this approach, internal models are used to
estimate the PD for each obligor, while LGD and EAD parameters
are prescribed by MAS. These PD models are statistically based
or expert judgement models that make use of quantitative and
qualitative factors to assess an obligor’s repayment capacity and
are calibrated to expected long-term average one-year default rate
over an economic cycle. Expert judgement models are typically used
for portfolios where there are a low number of internal default
observations. These models are developed with credit experts
who have in-depth experience with the specific portfolio being
modelled. The models also comply with the regulatory criteria
for parameterisation. For major specialised lending portfolios,
risk grades derived from internal models are mapped to the five
supervisory slotting categories as prescribed in MAS Notice 637.
The risk weights prescribed for these slotting categories are used to
determine the regulatory capital requirements for such exposures.
IRB Approach for Securitisation Exposures
The credit risk weighted assets for securitisation exposures are
computed using the ratings based method for such exposures as
prescribed by MAS Notice 637.
Standardised Approach for Other Portfolios
Other credit portfolios, such as private banking and exposures
to sovereigns are under the standardised approach, and will be
progressively migrated to the ratings-based approaches. Under
this approach, regulatory prescribed risk weights based on asset
class and external ratings from approved credit rating agencies,
where available, are used to determine the risk weighted assets
and regulatory capital. Approved external rating agencies include
Standard & Poor’s, Moody’s, and Fitch.
Credit Risk ControlCredit Risk mitigation
Transactions are entered into primarily on the strength of a
borrower’s creditworthiness, ability to repay, and repayment sources.
To mitigate credit risk, the Group accepts collateral as security,
subject to Group policies on collateral eligibility. Types of collateral
include cash and marketable securities; residential and commercial
real estate; vessels, aircraft, and automobiles; and other tangible
business assets, such as inventory and equipment.
The value of collateral is prudently assessed on a regular basis, and
valuations are performed by independent appraisers. Discounts are
applied to the market value of collateral, reflecting the quality, liquidity,
volatility, and collateral type. The loan-to-value ratio is a key factor in
the credit granting decision. OCBC Group also accepts guarantees
from individuals, corporates, and institutions as a form of support.
To mitigate counterparty credit risk, financial collateral may be taken
to partially or fully cover mark-to-market exposures on outstanding
positions in accordance with internal policies on collateral eligibility.
A discount is normally applied on the collateral to cover potential
adverse market volatility and currency risk. The collateral agreement
typically includes a minimum threshold amount where additional
collateral is to be posted by either party if the mark-to-market
exposures exceed the agreed threshold amount. Master agreements,
such as those from International Swaps and Derivatives Agreement
(“ISDA”), are also used and these allow for close out netting if
either counterparty defaults. For derivative contracts, the total
credit exposure of the contract is the mark-to-market value plus the
estimate of the potential credit exposure over the remaining term of
the contract. The Group calculates such exposures and uses statistical
modelling tools to estimate the potential worst-case scenario.
Risk management
(This section forms an integral part of OCBC’s audited financial statements)
50 OCBC Annual Report 2011

Some netting and collateral agreements may contain rating triggers,
although the thresholds in the majority of our agreements are
identical in the event of a one-notch rating downgrade. Given
the Group’s investment grade rating, there is minimal increase in
collateral required to be provided to our counterparties if there is a
one-notch downgrade of our credit rating.
managing Credit Risk Concentrations
Credit risk concentrations exist in lending to single customer
groups, borrowers engaged in similar activities, or diverse groups
of borrowers that could be affected by similar economic or other
factors. To manage these concentrations, exposure limits are
established for single borrowing groups, counterparties, industry
segments, countries, and cross-border transfer risks. Limits are
aligned with the Group’s business strategy and resources, and take
into account the credit quality of the borrower, available collateral,
regulatory requirements, and country risk ratings. Limits are typically
set taking into consideration factors such as impact on earnings and
capital as well as regulatory constraints.
While we are steadily diversifying our exposure internationally, and
expanding in China, our credit risk concentrations remain significant
in our traditional home markets of Singapore and Malaysia. In terms
of industries, we have a significant exposure to the real estate
market in Singapore. This is supported by dedicated specialist teams
in origination as well as credit risk management. Particular attention
is paid to borrower and collateral quality, project feasibility, and
emerging market conditions. Regular stress tests are performed on
the portfolio.
The Bank is in compliance with Section 35 of the Banking Act,
which limits its exposure to real estate in Singapore to not more
than 35% of its total eligible loan assets.
Remedial management
The Group has been able to anticipate areas of potential weakness
at an early stage through the regular monitoring of the credit
quality of our exposures, with an emphasis on a proactive and
forward-looking approach to early problem recognition. We value
long-term relationships with our customers by working closely
with them at the onset of their difficulties. Applying specialist
remedial management techniques even before the loan becomes
non-performing allows us to maintain sound asset quality and
promote customer loyalty and retention.
Loans are categorised as “Pass” or “Special Mention”, while
non-performing loans (“NPLs”) are categorised as “Substandard”,
“Doubtful”, or “Loss” in accordance with MAS Notice 612. These
indicators allow us to have a consistent approach to early problem
recognition and effective remedial management.
OCBC Group has established specialist and centralised units
to manage problem exposures to ensure timely NPL reduction
and maximise loan recoveries. Time, risk-based, and discounted
cash flow approaches are deployed to optimise collection and
asset recovery returns, including monitoring set indicators like
delinquency buckets, adverse status, and behavioural score trigger
points for consumer NPLs. The Group uses a suite of collection
information systems to constantly fine-tune and optimise its
objectives of recovery, effectiveness, and customer retention.
Impairment Allowances for Loans
The Group maintains allowances for loans that are sufficient to
absorb credit losses inherent in its loan portfolio. Total loan loss
reserves comprise specific allowances against each NPL and a
portfolio allowance for all loans on books to cover any losses that
are not yet evident. The Group’s policy for loan allowances is
guided by Financial Reporting Standard 39 (“FRS 39”), as modified
by MAS Notice 612.
Specific allowance is established when the present value of future
recoverable cash flows of the impaired loan is lower than the
carrying value of the loan. Assessment for impairment is conducted
on a loan-by-loan basis. The exceptions are homogenous loans
(such as housing loans, consumer loans, and credit card receivables)
below a certain materiality threshold, where such loans may
be pooled together according to their risk characteristics and
collectively assessed according to the degree of impairment, taking
into account the historical loss experience on such loans.
Portfolio allowances are set aside based on management’s credit
experiences and judgement for estimated inherent losses that
may exist but have not been identified to any specific financial
asset. Credit experiences are based on historical loss rates that
take into account geographic and industry factors. A minimum 1%
portfolio allowance is set aside under the transitional arrangement
in MAS Notice 612.
write-offs
Loans are written off against impairment allowances when recovery
action has been instituted and the loss can be reasonably determined.
Ceasing of Interest Accrual on Loans
When a loan is classified “Substandard”, “Doubtful”, or “Loss”,
interest income ceases to be recognised in the income statement
on an accrual basis. However, this non-accrual of interest does not
preclude the Group’s entitlement to the interest income as it merely
reflects the uncertainty in the collectability of such interest income.
Collateral Held Against NPLs
Real estate in Singapore forms the main type of collateral for the
Group’s NPLs. The realisable value of the real estate collateral is used
to determine the adequacy of the collateral coverage. Proceeds from
the sale of collateral pledged for a particular loan cannot be applied
to other classified loans unless the accounts are related and legal
cross collateralisation of the facilities have been provided for.
51OCBC Annual Report 2011

mARkET RISk mANAGEmENT
Market risk is the risk of loss of income or market value due to
fluctuations in market factors such as interest rates, foreign exchange
rates, equity and commodity prices, or changes in volatility or
correlations of such factors. OCBC Group is exposed to market risks
from its trading and client servicing activities.
OCBC Group’s market risk management strategy and market risk
limits are established within the Group’s risk appetite and business
strategies, taking into account macroeconomic and market
conditions. Market risk limits are subject to regular review.
market Risk management Oversight and Organisation
The Market Risk Management Committee is the senior management
committee that supports the Board Risk Management Committee
and the CEO in market risk oversight. The Market Risk Management
Committee establishes market risk management objectives,
framework, and policies governing prudent market risk taking,
which are backed by risk methodologies, measurement systems,
and internal controls.
The Market Risk Management Committee is supported at the
working level by the Market Risk Management Department
(“MRMD”) of Group Risk Management Division. MRMD is the
independent risk control unit responsible for operationalising the
market risk management framework to support business growth
while ensuring adequate risk control and oversight.
market Risk management Approach
Market risk management is a shared responsibility. Business units
are responsible for undertaking proactive risk management along
with their pursued trading strategies, while the MRMD acts as
the independent monitoring unit that ensures sound governance
practices. Key risk management activities of identification,
measurement, monitoring, control, and reporting are regularly
reviewed to ensure they are commensurate with the Group’s market
risk taking activities.
market Risk Identification
Risk identification is addressed via the Group’s new product approval
process at product inception. Market risks are also identified by our
risk managers who proactively interact with the business units on an
ongoing basis.
market Risk measurements Value-At-Risk
Value-at-risk (“VaR”) is a key market risk measure for the Group’s
trading activities. The Board Risk Management Committee agrees
on an aggregate market risk appetite based on VaR. VaR is
measured and monitored by its individual market risk components,
namely interest rate risk, foreign exchange risk, equity risk and
credit spread risk, as well as at the aggregate level. VaR is based on
a historical simulation approach and is applied against a one-day
holding period at a 99% confidence level. As VaR is a statistical
measure based on historical market fluctuations, it might not
accurately predict forward-looking market conditions all the time.
As such, losses on a single trading day may exceed VaR, on average,
once every 100 days.
Other Risk measures
As the Group’s main market risk is interest rate fluctuations,
Present Value of a Basis Point (“PV01”), which measures the change
in value of interest rate sensitive exposures resulting from one basis
point increase across the entire yield curve, is an additional measure
monitored on a daily basis. Other than VaR and PV01, the Group
also utilises notional amounts, CS01 (1 Basis Point move in
Credit Spreads) and derivative greeks for specific exposure types,
where appropriate, to supplement its risk measurements.
Stress Testing and Scenario Analyses
The Group also performs stress testing and scenario analyses
to better quantify and assess potential losses arising from low
probability but plausible extreme market conditions. The stress
scenarios are regularly reviewed and fine-tuned to ensure that
they remain relevant to the Group’s trading activities, risk profile,
and prevailing and forecast economic conditions. These analyses
determine if potential losses from such extreme market conditions
are within the Group’s risk tolerance and capital level.
The following table provides a summary of the Group’s trading VaR
profile by risk types as at 31 December 2011 and 31 December 2010.
Risk management
(This section forms an integral part of OCBC’s audited financial statements)
52 OCBC Annual Report 2011

Risk monitoring and Control Limits
Only authorised trading activities may be undertaken by the various
business units within the allocated limits. All trading risk positions
are monitored on a daily basis against these limits by independent
support units. Limits are approved for various business activity levels,
with clearly defined exception escalation procedures. All exceptions
are promptly reported to senior management for appropriate
rectification. The imposition of limits on the multiple risks (VaR and
risk sensitivities), profit/loss, and other measures allow for more
holistic analysis and management of market risk exposures.
model and Valuation Control
Model and valuation control is also an integral part of the Group’s
risk control process. Valuation and risk models are deployed
in the Group for pricing of financial instruments and VaR
calculation, respectively. The Group ensures the models used are
fit for their intended purpose, through verifying the parameters,
assumptions, and robustness associated with each model before it
is implemented for use. Market rates used for risk measurements
and valuation by the Market Risk Management Department are
sourced independently, thereby adding to the integrity of the
trading profits and losses (“P&L”), risk measures and limit control.
Valuation reserves and other operational controls are also imposed
to strengthen overall general and model risk management. To ensure
the continued integrity of the VaR model, the Group conducts
back-testing to confirm the consistency of actual daily trading P&L,
as well as theoretical P&L against the model’s statistical assumptions.
VaR By Risk Type – Trading Portfolio
2011 2010
SGD millions year End Average minimum maximum year End Average minimum maximum
Interest Rate Risk VaR 14.88 10.63 6.49 16.91 11.10 7.72 5.45 12.21
Foreign Exchange Risk VaR 2.79 8.02 2.25 26.70 3.62 7.55 1.49 18.91
Equity Risk VaR 2.51 2.03 0.94 4.91 1.12 1.43 0.31 3.03
Credit Spread Risk VaR 3.71 3.04 1.12 5.08 1.31 1.74 0.61 3.19
Diversification Effect (1) -3.98 -9.70 Nm (2) Nm (2) -8.95 -8.37 NM (2) NM (2)
Aggregate VaR 19.91 14.02 6.77 26.06 8.20 10.07 6.76 17.27
(1) Diversification effect is computed as the difference between Aggregate VaR and sum of asset class VaRs.(2) Not meaningful as the minimum and maximum VaR may have occurred on different days for different asset classes.
53OCBC Annual Report 2011

Frequency Distribution of Group Trading Book Daily Aggregate VaR(One Day Holding Period) for Fy 2011
Frequency Distribution of Group Trading Book Daily Revenue for Fy 2011
Number of Trading Days
Number of Trading Days
50
50
45
45
40
40
35
35
30
30
25
25
20
20
15
6 -
8
8 -
10
10 -
12
12 -
14
14 -
16
16 -
18
18 -
20
20 -
22
22 -
24
24 -
26
26 -
28
4 -
6
2 -
4
(34)
- (3
2)
(30)
- (2
8)
(28)
- (2
6)
(26)
- (2
4)
(24)
- (2
2)
(22)
- (2
0)
(20)
- (1
8)
(18)
- (1
6)
(16)
- (1
4)
(14)
- (1
2)
(12)
- (1
0)
(10)
- (8
)
(8) -
(6)
(6) -
(4)
(4) -
(2)
SGD $ millions
SGD $ millions
(2) -
(0)
0 -
2
2 -
4
4 -
6
6 -
8
8 -
10
10 -
12
12 -
14
14 -
16
16 -
18
18 -
20
20 -
22
22 -
24
24 -
26
26 -
28
15
10
10
5
5
0
0
Risk management
(This section forms an integral part of OCBC’s audited financial statements)
(32)
- (3
0)
28 -
30
54 OCBC Annual Report 201154 OCBC Annual Report 2011

ASSET LIABILITy mANAGEmENT
Asset liability management is the strategic management of the
balance sheet structure and liquidity needs, covering funding
liquidity risk management, structural interest rate management and
structural foreign exchange management.
Asset Liability management Oversight and Organisation
The Asset Liability Management Committee (“ALCO”) is responsible
for the oversight of our Group liquidity and balance sheet risks.
The ALCO is chaired by the CEO and includes senior management
from the business, risk and support units. The ALCO is supported by
the Asset Liability Management Department within the Group Risk
Management Division.
Asset Liability management Approach
The Asset Liability Management framework comprises liquidity risk
management, structural interest rate risk management and structural
foreign exchange risk management.
Liquidity Risk
The objective of liquidity risk management is to ensure that there are
sufficient funds to meet contractual and regulatory financial obligations
as well as to undertake new transactions.
Our liquidity management process involves establishing liquidity
management policies and limits, regular monitoring against liquidity
risk limits, regular stress testing, and establishing contingency funding
plans. These processes are subject to regular reviews to ensure that
they remain relevant in the context of prevailing market conditions.
Liquidity monitoring is performed daily within a framework for
projecting cash flows on a contractual and behavioural basis.
Simulations of liquidity exposures under stressed market scenarios
are performed and the results are taken into account in the risk
management processes. Structural liquidity indicators such as liquidity
and deposit concentration ratios are employed to maintain an optimal
funding mix and asset composition. Funding strategies are in place
to provide effective diversification and stability in funding sources
across tenors, product and geography. In addition, we maintain a
level of liquid assets exceeding the regulatory requirement for use in
the event of a liquidity crisis. These assets comprise statutory reserve
eligible securities as well as marketable shares and debt securities.
Structural Interest Rate Risk
The primary goal of interest rate risk management is to ensure that
interest rate risk exposures are maintained within defined risk tolerances.
Interest rate risk is the risk to earnings and capital arising from
exposure to adverse movements in interest rates. The material sources
of interest rate risk are repricing risk, yield curve risk, basis risk and
optionality risk. A range of techniques are employed to measure these
risks from an earnings and economic value perspective. One method
involves the simulation of the impact of a variety of interest rate
scenarios on the net interest income as well as the economic value
of the Group’s equity. Other measures include interest rate sensitivity
measures such as PV01 as well as repricing gap profile analysis.
Limits and policies to manage interest rate exposures are established
in line with the Group’s strategy and risk appetite, appropriately
approved, and reviewed regularly to ensure they remain relevant
to the external environment. Control systems are established to
monitor the profile against the approved risk thresholds.
Structural Foreign Exchange Risk
Structural foreign exchange exposure arises primarily from net
investment in overseas branches, subsidiaries, strategic investments,
as well as property assets. The objective is to protect the capital
and financial soundness by identifying, measuring, and managing
the potential adverse impact of structural foreign exchange risk
exposures. OCBC actively manages this risk through hedges and
funding investments in foreign currencies, in order to minimise
potential adverse impact.
OPERATIONAL RISk mANAGEmENT
Operational risk is the risk of loss resulting from inadequate or failed
internal processes, people, systems and management, or from external
events. Operational risk includes legal risk and reputation risk.
The Group’s operational risk management aims to minimise unexpected
and catastrophic losses and to manage expected losses. This enables
new business opportunities to be pursued in a risk-conscious and
controlled manner.
Operational Risk management Oversight and Organisation
The Operational Risk Management and Information Security
Committee (“ORISC”) is the senior management committee
that oversees the execution of the Group’s Operational Risk
Management, Information Security and Technology Risk practices,
and ensures that the respective risk management programmes are
appropriate, effective, and support the Group’s business strategy.
ORISC also has oversight over the management of the Group’s
fiduciary, reputational and legal risks.
The Operational Risk Management (“ORM”) Department of
Group Risk Management Division establishes the ORM framework,
including policies and methodologies. The ORM department also
provides independent oversight of operational risk monitoring and
control. The ORM programmes are actively implemented through
the respective operational risk co-ordinators or managers in the
business units.
Operational Risk management Approach
The Group manages operational risks through a framework
that ensures operational risks are properly identified, managed,
monitored, mitigated, and reported in a structured and consistent
manner. The framework is underpinned by an internal control
system that reinforces the Group’s control culture by establishing
clear roles and responsibilities for staff and preserving their rights
in executing their control functions without fear of intimidation
or reprisal. The Group recognises the importance of establishing a
risk-awareness culture in the managing of operational risk through
embedding risk management in the Group’s core processes.
55OCBC Annual Report 2011 55OCBC Annual Report 2011

Identification and
Assessment
man
agem
ent
Each business unit undertakes regular self-assessment of the risk and
control environment to identify, assess, and measure its operational
risks, which include regulatory and legal risks. Risk metrics are
also used to detect early warning signals and drive appropriate
management actions before risks materialise into material losses.
Senior management also attests annually to the CEO and Board Risk
Management Committee on the effectiveness of the internal control
system, as well as report key control deficiencies and appropriate
remedial plans. Operational risk losses and incidents are used as
information for reporting and for providing risk profiling information
to senior management and the Board Risk Management Committee.
For information security, the Group protects and ensures the
confidentiality, integrity, and availability of its information assets
through implementing appropriate security controls to protect
against the misuse or compromise of information assets. New
and appropriate security technologies are regularly identified and
implemented as part of the Group’s technology risk management
strategy to mitigate any possible threats to the Group’s information
technology environment.
To mitigate the impact of unforeseen operational risk events, Group
management has implemented business continuity management
and crisis management programmes to ensure the uninterrupted
availability of all business resources to support essential business
activities. On an annual basis, Senior Management provides an
attestation to the Board Risk Management Committee on the
state of business continuity management including the internally
developed business continuity management maturity scorecard,
extent of alignment to MAS guidelines and declaration of residual
risk. The Group also monitors the health and security environment
of the locations of the Group’s key operations to assess possible
threats that may adversely affect the Group and its employees.
The Group’s Fraud Risk Management (“FRM”) and whistle-blowing
programmes help prevent and detect fraud or misconduct,
as well as enable rapid and co-ordinated incident responses,
including establishing the cause, remedial actions, and damage
control procedures. The Group is proactively strengthening its
FRM infrastructure to manage emerging threats through new
programmes and initiatives.
Reputation Risk management
Reputation risk is the current or prospective risk to earnings and capital arising from adverse perception of the image of the Group on the part of customers, counterparties, shareholders, investors and regulators. The Group has a reputation risk management programme to manage any such potential current, or future adverse impact on earnings and continued access to sources of funding. The programme focuses on understanding and managing our responsibilities toward our different stakeholders, and protecting our reputation. A key emphasis of the programme is effective information sharing and engagement with stakeholders.
Fiduciary Risk management
The Group has a fiduciary risk management programme to manage
risks associated with fiduciary relationships created in managing
funds or providing other services. The programme provides
guidelines on regular identification, assessment, mitigation, and
monitoring of fiduciary risk exposures, to ensure the Group’s
compliance with applicable corporate standards.
Regulatory and Legal Risks
Each business unit is responsible for the adequacy and effectiveness
of controls in managing both regulatory and legal risks. An
annual Regulatory Compliance Certification is provided by senior
management to the CEO and Board Risk Management Committee
on the state of regulatory compliance.
ORm Framework
Board Oversight and Senior Management Involvement
Internal Control Fram
ework and A
ttestation
Risk-based Audit Review
and Inspection
Operational Risk
management
Programme
• Operational Loss Reporting• Self-Assessment • Scenario Analysis• New Product Approval
Operational Risk management Programme
• Fraud Risk and Whistle-blowing
• Technology Risk • Fiduciary Risk • Reputation Risk
• Key Risk Indicator / Performance Metrics
• Operational Risk Profiling and Reporting
• Business Continuity Management
• Risk-based Insurance Management
• Outsourcing
Risk management
(This section forms an integral part of OCBC’s audited financial statements)
mitigation
monito
ring
and
Rep
ort
ing
56 OCBC Annual Report 2011

Basel II Pillar 3 Risk Disclosure
(OCBC Group – As at 31 December 2011)
The purpose of this disclosure is to provide the information in
accordance with Pillar 3 directives under MAS Notice 637.
This supplements the disclosure in the Risk Management and
Capital Management Chapters as well as related information in the
Notes to the Financial Statements and Management Discussion
and Analysis.
The Group successfully migrated the small business and commercial
property lending to individuals portfolio in Malaysia to the Advanced
Internal Ratings-Based (“A-IRB”), as well as the equity portfolio to
the Internal Ratings-Based (“IRB”) approach in 2011.
The Group’s overall credit quality remained healthy against a
backdrop of continuing economic uncertainty. Total risk weighted
assets increased compared to 2010, driven by higher wholesale as
well as retail credit exposures. The asset growth was proactively
balanced with disciplined risk management, as reflected in the
broadly stable average risk weights for the IRB portfolios.
Exposures and Risk weighted Assets (“RwA”) by Portfolio
Capital Adequacy Ratio (“CAR”) forSignificant Banking Subsidiaries
EAD RwA
S$ million S$ million
Credit Risk
Standardised Approach
Corporate 7,734 7,725
Sovereign 29,533 295
Bank 876 203
Retail 2,155 1,617
Residential Mortgage 1,741 730
Others 5,941 5,212
Total Standardised 47,980 15,782
Internal Ratings-Based (“IRB”) Approach
Foundation IRB
Corporate 59,383 40,554
Bank 46,241 11,285
Advanced IRB
Residential Mortgage 37,292 4,364
Qualifying Revolving Retail 4,318 1,121
Small Business 7,303 3,356
Other Retail 1,396 300
Specialised Lending under
Supervisory Slotting Criteria 21,408 20,324
Securitisation 135 22
Equity 2,169 7,438
Total IRB 179,645 88,764
Total Credit Risk 227,625 104,546
market Risk
Standardised Approach 15,817
Operational Risk
Standardised Approach 7,489
Basic Indicator Approach 655
Total Operational Risk 8,144
Total RwA 128,507
Subsidiary Tier 1 CAR Total CAR
Bank of Singapore Limited 21.5% 21.6%
Singapore Island Bank Limited 429.8% 429.8%
OCBC Bank (Malaysia) Berhad 14.3% 16.0%
OCBC Al-Amin Bank Berhad 8.8% 13.5%
OCBC Bank (China) Limited 23.1% 23.6%
PT Bank OCBC NISP Tbk 11.0% 13.7%
Note: The capital adequacy ratios of Bank of Singapore Limited and Singapore
Island Bank Limited are computed based on the standardised approach under
the Basel II framework. Capital adequacy ratio computations of OCBC Bank
(Malaysia) Berhad and OCBC Al-Amin Bank Berhad are based on the IRB
approach. The computations at the other overseas banking subsidiaries are
currently based on Basel I requirements.
57OCBC Annual Report 2011

CREDIT RISk
With Basel II implementation, OCBC Group has adopted the Internal
Ratings-Based (“IRB”) Approach for major credit portfolios, where 3 key
parameters – Probability of Default (“PD”), Exposure at Default (“EAD”)
and Loss Given Default (“LGD”) are used to quantify credit risk.
Specialised Lending Exposures underSupervisory Slotting Criteria
Specialised lending exposures include financing of income-producing
real estate as well as project, object and commodity finance.
Credit Exposures under Foundation Internal Ratings-Based Approach (“F-IRBA”)
Corporate exposures are mainly exposures to corporate and
institutional customers as well as major non-bank financial
institutions. Bank exposures are exposures to banks and eligible
public sector entities.
Corporate Exposures
Bank Exposures
EAD
Risk weight S$ million
0% 29,892
20% - 35% 2,357
50% - 75% 2,475
100% 13,226
>100% 30
Total 47,980
Rated exposures 37,800
Unrated exposures 10,180
EAD Average
S$ million Risk weight
Strong 7,841 62%
Good 4,051 81%
Satisfactory 8,787 122%
Weak 543 265%
Default 186 NA
Total 21,408 95%
EAD Average
PD Range S$ million Risk weight
up to 0.05% 7,171 18%
> 0.05 to 0.5% 20,162 45%
> 0.5 to 2.5% 22,226 75%
> 2.5 to 9% 7,039 136%
> 9% 1,898 204%
Default 887 NA
Total 59,383 68%
EAD Average
PD Range S$ million Risk weight
up to 0.05% 27,335 8%
> 0.05 to 0.5% 12,147 35%
> 0.5 to 2.5% 5,275 59%
> 2.5 to 9% 1,478 116%
> 9% 6 196%
Default – NA
Total 46,241 24%EAD Average
S$ million Risk weight
Listed securities 1,658 318%
Other equity holdings 511 424%
Total 2,169 343%
1. What is the probability of an obligor going into default?
PD (%)
EAD
LGD (%)
Probability of Default
Exposure at Default
Loss Given Default
2. What is our exposure in the event of a default?
3. How much of the exposure amount should we expect to lose?
Credit Exposures under Standardised Approach
Credit exposures under the standardised approach comprise mainly
exposures to sovereigns, private banking customers in Bank of
Singapore and other assets. Rated exposures relate mainly to debt
securities and sovereign portfolios while unrated exposures relate
mainly to other assets.
Credit Exposures subject to Supervisory Risk weights under Internal Ratings-Based Approach
Equity Exposures under Simple Risk weight method
Equities for regulatory capital computation are risk weighted and/
or deducted from capital in accordance with MAS Notice 637 under
the IRB Simple Risk Weight Method. Equity exposures of S$8 million
have been deducted from regulatory capital.
Basel II Pillar 3 Risk Disclosure
(OCBC Group – As at 31 December 2011)
58 OCBC Annual Report 2011

Credit Exposures under Advanced Internal Ratings-Based Approach (“A-IRBA”)
Residential Mortgages are loans to individuals secured by residential
properties. Qualifying Revolving Retail exposures are revolving
unsecured loans to individuals e.g. credit cards. Other Retail
exposures are mainly auto loans in Singapore. Small Business
exposures include lending to small businesses and commercial
property loans to individuals in Singapore and Malaysia.
Residential mortgages
Actual Loss and Expected Loss for Exposures under Foundation and Advanced IRB Approaches
Actual loss refers to impairment loss allowance and direct write-off
to the income statement during the year. Expected loss (“EL”)
represents model derived and/or regulatory prescribed estimates
of future loss on potential defaults over a one-year time horizon.
Comparison of the two measures has limitations because they are
calculated using different methods. EL computations are based on
LGD and EAD estimates that reflect downturn economic conditions
and regulatory minimums, and PD estimates that reflect long run
through-the-cycle approximation of default rates. Actual loss is
based on accounting standards and represents the point-in-time
impairment experience for the financial year.EAD
UndrawnCommitment EAD weighted Average
PD Range S$ million S$ million LGD Risk weight
up to 0.5% 25,505 2,678 11% 5%
> 0.5 to 3% 7,296 694 11% 19%
> 3 to 10% 3,895 278 10% 34%
> 10% 396 8 11% 61%
100% 200 – 16% 87%
Total 37,292 3,658 11% 12%
Actual Loss forthe year ended
31 December 2011
Regulatory Expected Loss (Non-defaulted)
as at 31 December 2010
S$ million S$ million
Corporate 16 342
Bank – 34
Small Business 15 26
Retail 25 96
Total 56 498
Note: The Malaysia small business portfolio was migrated to the IRB approach with
effect from 2011. There was hence no Regulatory EL as at end 2010.
Eligible Financial
Collateral
Other Eligible
Collateral
Amount by which exposures have been
reduced by eligible credit protection
S$ million S$ million S$ million
Standardised Approach
Corporate 2,507 – –
Sovereign and Bank 2,149 – –
Retail andResidential Mortgage 316 – –
Others 3,255 – –
Total 8,227 – –
Foundation IRB Approach
Corporate 4,700 8,934 628
Bank 702 – –
Total 5,402 8,934 628
Note:
1. Not all forms of collateral or credit risk mitigation are included for regulatory
capital calculations.
2. Does not include collateral for exposures under Advanced IRB Approach and
Specialised Lending.
EADUndrawn
Commitment EAD weighted Average
PD Range S$ million S$ million LGD Risk weight
up to 0.5% 3,222 2,516 81% 7%
> 0.5 to 3% 544 234 79% 41%
> 3 to 10% 408 141 83% 97%
> 10% 124 32 84% 223%
100% 20 – 82% 0%
Total 4,318 2,923 81% 26%
EADUndrawn
Commitment EAD weighted Average
PD Range S$ million S$ million LGD Risk weight
up to 0.5% 2,404 317 27% 17%
> 0.5 to 3% 2,945 244 35% 46%
> 3 to 10% 1,476 51 40% 68%
> 10% 329 32 46% 123%
100% 149 3 41% 129%
Total 7,303 647 34% 46%
EADUndrawn
Commitment EAD weighted Average
PD Range S$ million S$ million LGD Risk weight
up to 0.5% 880 242 30% 11%
> 0.5 to 3% 352 145 29% 34%
> 3 to 10% 118 99 27% 41%
> 10% 44 1 28% 61%
100% 2 # 34% 170%
Total 1,396 488 30% 21%
# represents amounts less than $0.5 million
Qualifying Revolving Retail Exposures
Exposures Covered by Credit Risk mitigation
Small Business Exposures
Other Retail Exposures
59OCBC Annual Report 2011

S$ million
Gains/(losses) from disposal of AFS equities 14
Unrealised gains included in fair value reserve 962
Total 976
mARkET RISkCapital Requirement by market Risk Type under Standardised Approach
EQUITy ExPOSURES
Disclosures on valuation and accounting treatment of equity
holdings can be found in Notes to the Financial Statements 2.2.3,
2.6.2 and 2.23.3.
Equity exposures comprise equity securities categorised as
“Available-for-sale” (“AFS”) and investments in associates and joint
ventures. AFS securities are carried at fair value in the balance sheet
of the Group while investments in associates are carried at cost and
adjusted for post-acquisition changes of the Group’s share of the
net assets of the associates and joint ventures.
Equity exposures categorised and measured in accordance with the
Singapore Financial Reporting Standards differ from the regulatory
definition under MAS Notice 637 in the following key areas:
1. Equity investments held by insurance subsidiaries (included
below) are not consolidated for regulatory computation.
2. Debt instruments approved for inclusion as Tier 1 capital are
treated as equity exposures under MAS Notice 637.
Counterparty Credit Risk Exposures
Credit Derivatives
Securitisation Exposures Purchased
There are no re-securitisation exposures and all the securitisation
exposures are in the banking book.
S$ million
Replacement Cost 5,539
Potential Future Exposure 4,353
Less: Effects of Netting 4,553
EAD under Current Exposure method 5,339
Analysed by type:
Foreign Exchange Contracts and Gold 3,176
Interest Rate Contracts 1,364
Equity Contracts 148
Precious Metals Contracts #
Other Commodities Contracts 29
Credit Derivative Contracts 621
Less: Eligible Financial Collateral 451
Other Eligible Collateral –
Net Derivatives Credit Exposure 4,888
# represents amounts less than $0.5 million
S$ million
Interest rate risk 667
Equity position risk 21
Foreign exchange risk 576
Commodity risk 1
Total 1,265
S$ million Notional amount
Bought Sold
Credit Default Swaps
for own credit portfolio 5,853 5,818
for intermediation activities 5 –
Total 5,858 5,818
Note: Credit derivatives for own credit portfolio include trading portfolio and
hedges, if any.
S$ million
Risk weight EADCapitalCharge
up to 20% 85 1
> 20% to 50% 18 1
> 50% to 100% – –
>100% to 500% – –
>500% – –
Deductions from Tier 1 and Tier 2 Capital 32 –
Total 135 2
S$ million
Quoted equity exposure - AFS 2,878
Unquoted equity exposure - AFS 311
Quoted equity exposure - Associates –
Unquoted equity exposure - Associates 360
Total 3,549
Carrying Value of Equity Exposures
Realised and Unrealised Gains and Losses
Basel II Pillar 3 Risk Disclosure
(OCBC Group – As at 31 December 2011)
60 OCBC Annual Report 2011
62 Management Discussion and Analysis
Financial Statements
74 Directors’ Report
79 Statement by Directors
80 Independent Auditors’ Report
81 Income Statements
82 Statements of Comprehensive Income
83 Balance Sheets
84 Statement of Changes in Equity – Group
86 Statement of Changes in Equity – Bank
87 Consolidated Cash Flow Statement
88 Notes to the Financial Statements
174 Group’s Major Properties
Financial Report

62 OCBC Annual Report 2011
Management Discussion and Analysis
OVERVIEW
2011 2010 +/(-) %
Selected Income Statement Items (S$ million)
Net interest income 3,410 2,947 16
Non-interest income 2,212 2,378 (7)
Total core income 5,622 5,325 6
Operating expenses (2,430) (2,254) 8
Operating profit before allowances and amortisation 3,192 3,071 4
Amortisation of intangible assets (61) (55) 12
Allowances for loans and impairment of other assets (221) (134) 65
Operating profit after allowances and amortisation 2,910 2,882 1
Share of results of associates and joint ventures 7 (2) 442
Profit before income tax 2,917 2,880 1
Core net profit attributable to shareholders 2,280 2,253 1
Divestment gain, net of tax 32 – –
Reported net profit attributable to shareholders 2,312 2,253 3
Cash basis net profit attributable to shareholders (1) 2,373 2,308 3
Selected Balance Sheet Items (S$ million)
Ordinary equity 20,675 18,894 9
Total equity (excluding non-controlling interests) 22,571 20,790 9
Total assets 277,758 229,283 21
Assets excluding life assurance fund investment assets 228,670 181,797 26
Loans and bills receivable (net of allowances) 133,557 104,989 27
Deposits of non-bank customers 154,555 123,300 25
Per Ordinary Share
Basic earnings (cents) (2) 64.8 66.1 (2)
Basic earnings – Cash basis (cents) (2) 66.7 67.8 (2)
Diluted earnings (cents) (2) 64.7 65.9 (2)
Net asset value – Before valuation surplus (S$) 6.02 5.66 6
Net asset value – After valuation surplus (S$) 7.04 7.09 (1)
Key Financial Ratios (%)
Return on equity (2) 11.1 12.1
Return on equity – Cash basis (2) 11.4 12.4
Return on assets (3) 1.09 1.32
Return on assets – Cash basis (3) 1.12 1.35
Net interest margin 1.86 1.98
Non-interest income to total income 39.3 44.7
Cost to income 43.2 42.3
Loans to deposits 86.4 85.1
NPL ratio 0.9 0.9
Total capital adequacy ratio 15.7 17.6
Tier 1 ratio 14.4 16.3
(1) Excludes amortisation of intangible assets. (2) Calculated based on core net profit less preference share dividends.(3) Computation of return on assets excludes life assurance fund investment assets.
Amounts less than S$0.5 million are shown as “0”.
“NM” denotes not meaningful.

63OCBC Annual Report 2011
Group net profit increased 3% to S$2,312 million for the financial year ended 31 December 2011. Core net profit, which excluded gains from the divestment of non-core assets, was S$2,280 million, up 1% from a year ago. Full year performance was underpinned by robust growth in the Group’s customer-related businesses, as reflected by the record net interest income and fee income, as well as healthy growth in insurance new business weighted premiums and new business embedded value.
Net interest income grew 16% to S$3,410 million on broad-based loan growth of 27%. Net interest margin declined 12 basis points, primarily due to the low interest rate environment and strong growth in lower-risk loans. Fees and commissions grew 16% to S$1,137 million, led by wealth management revenue and trade-related fees. Trading income was affected by challenging financial market conditions, resulting in a 46% decline to S$217 million. Great Eastern Holdings’ (“GEH”) life assurance profits from the Participating and Investment-linked funds grew 25% to S$249 million. Investment performance of the Non-participating fund was adversely affected by the widening credit spreads and falling equity prices with the fund’s profits declining 44% to S$134 million. The Group’s operating expenses increased 8% to S$2,430 million, reflecting continued disciplined cost management. Net allowances for loans and other assets increased to S$221 million from S$134 million, largely attributable to increased portfolio allowances in line with robust loan growth, and lower recoveries and write-backs. The non-performing loans (“NPL”) ratio was unchanged at 0.9%.
Return on equity, based on core earnings, was 11.1% in 2011, compared to 12.1% in 2010. Core earnings per share was 64.8 cents, compared to 66.1 cents a year ago.
GEH achieved healthy growth in its underlying insurance business in 2011, with new business weighted premiums increasing 10% and new business embedded value growing strongly by 20%. The results reflected strong sales growth across markets, with contribution from the bancassurance and agency channels, as well as GEH’s focus on sales of regular premium and protection-based products to better serve the needs of customers. GEH’s net profit for the year was S$386 million, compared with S$507 million in 2010. Profit from insurance operations was S$412 million, underpinned by strong underwriting profits which were offset by weaker investment income due to the challenging financial market conditions. Net investment income in the Shareholders’ Fund of S$96 million was up marginally from 2010. The investment portfolios of the insurance funds and Shareholders’ Fund remained sound with no significant impairment charges. GEH’s contribution to the Group’s net profit, after deducting amortisation of intangible assets and non-controlling interests, declined from S$405 million in 2010 to S$297 million in 2011, contributing 13% of the Group’s core earnings in 2011.
OCBC Bank (Malaysia) Berhad achieved 6% growth in full year net profit to MYR749 million (S$307 million). Revenue growth was broad-based, with net interest income, Islamic finance income and non-interest income registering growth rates of 7%, 19% and 6%, respectively. Net interest margin declined from 2.42% to 2.32%, partly due to increases in the statutory reserve requirements during the year. Expenses grew 14% as the Group continued to invest in branch expansion and upgrading of capabilities and systems. Allowances were reduced marginally during the year. Loans grew 20% during the year, and the NPL ratio improved from 2.8% to 2.6%.
Bank OCBC NISP’s net profit increased 80% to IDR753 billion (S$108 million) for 2011, boosted by the merger with Bank OCBC Indonesia. Net interest income grew 13% on robust loan growth of 31%, and non-interest income grew 16%. Revenue growth was enabled by the broader market coverage of the merged entity, improved product capabilities and increased synergies from stronger collaboration with other subsidiaries within the Group. Expenses grew 7% for the year; excluding the one-time merger expense of IDR204 billion (S$31 million) in 2010, expenses rose by 23%. Allowances increased 2% during the year. Asset quality remained healthy, with the NPL ratio improving to 1.3% from 2.0% a year ago.
A final tax-exempt dividend of 15 cents per share has been proposed, bringing the 2011 total dividend to 30 cents per share, unchanged from 2010. The Scrip Dividend Scheme will not be applicable to the final dividend. The estimated total net dividend of S$1,024 million for 2011 represents 45% of the Group’s core net profit of S$2,280 million. This is in line with the Group’s dividend policy which targets a minimum payout of 45% of core earnings.

64 OCBC Annual Report 2011
NET INTEREST INCOMEAverage Balance Sheet
2011 2010
AverageBalance
S$ millionInterest
S$ million
AverageRate
%
AverageBalance
S$ millionInterest
S$ million
Average Rate
%
Interest earning assets
Loans and advances to non-bank customers 118,744 3,675 3.10 94,022 3,201 3.40
Placements with and loans to banks 34,207 850 2.48 26,722 423 1.58
Other interest earning assets 29,979 795 2.65 28,029 739 2.63
Total 182,930 5,320 2.91 148,773 4,363 2.93
Interest bearing liabilities
Deposits of non-bank customers 136,485 1,444 1.06 112,591 1,061 0.94
Deposits and balances of banks 22,365 187 0.83 14,942 103 0.69
Other borrowings 11,262 279 2.48 8,962 252 2.82
Total 170,112 1,910 1.12 136,495 1,416 1.04
Net interest income/margin 3,410 1.86 2,947 1.98
Net interest income grew 16% to S$3,410 million in 2011, led by robust loan growth of 27%. This was partly offset by a 12 basis points decline in net interest margin to 1.86% from 1.98% a year ago. The margin compression was attributable to the persistently low interest rate environment, strong growth in well-collateralised, lower-yielding trade-linked loans, and price competition, particularly for housing loans.
Volume and Rate Analysis
Increase/(decrease) for 2011 over 2010Volume
S$ millionRate
S$ millionNet change
S$ million
Interest income
Loans and advances to non-bank customers 842 (368 ) 474
Placements with and loans to banks 119 308 427
Other interest earning assets 51 5 56
Total 1,012 (55 ) 957
Interest expense
Deposits of non-bank customers 225 158 383
Deposits and balances of banks 51 33 84
Other borrowings 65 (38 ) 27
Total 341 153 494
Impact on net interest income 671 (208 ) 463
Due to change in number of days –
Net interest income 463
Management Discussion and Analysis
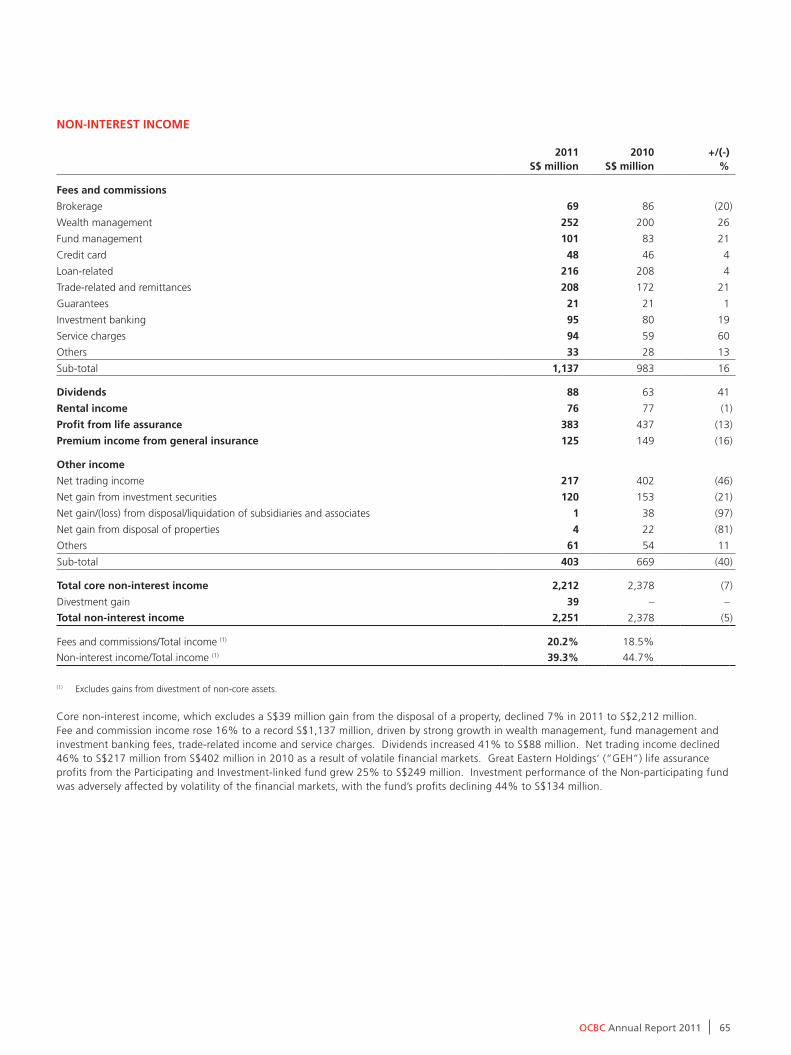
65OCBC Annual Report 2011
NON-INTEREST INCOME
2011S$ million
2010S$ million
+/(-)%
Fees and commissions
Brokerage 69 86 (20 )
Wealth management 252 200 26
Fund management 101 83 21
Credit card 48 46 4
Loan-related 216 208 4
Trade-related and remittances 208 172 21
Guarantees 21 21 1
Investment banking 95 80 19
Service charges 94 59 60
Others 33 28 13
Sub-total 1,137 983 16
Dividends 88 63 41
Rental income 76 77 (1 )
Profit from life assurance 383 437 (13 )
Premium income from general insurance 125 149 (16 )
Other income
Net trading income 217 402 (46 )
Net gain from investment securities 120 153 (21 )
Net gain/(loss) from disposal/liquidation of subsidiaries and associates 1 38 (97 )
Net gain from disposal of properties 4 22 (81 )
Others 61 54 11
Sub-total 403 669 (40 )
Total core non-interest income 2,212 2,378 (7 )
Divestment gain 39 – –
Total non-interest income 2,251 2,378 (5 )
Fees and commissions/Total income (1) 20.2% 18.5%
Non-interest income/Total income (1) 39.3% 44.7%
(1) Excludes gains from divestment of non-core assets.
Core non-interest income, which excludes a S$39 million gain from the disposal of a property, declined 7% in 2011 to S$2,212 million. Fee and commission income rose 16% to a record S$1,137 million, driven by strong growth in wealth management, fund management and investment banking fees, trade-related income and service charges. Dividends increased 41% to S$88 million. Net trading income declined 46% to S$217 million from S$402 million in 2010 as a result of volatile financial markets. Great Eastern Holdings’ (“GEH”) life assurance profits from the Participating and Investment-linked fund grew 25% to S$249 million. Investment performance of the Non-participating fund was adversely affected by volatility of the financial markets, with the fund’s profits declining 44% to S$134 million.

66 OCBC Annual Report 2011
OPERATING EXPENSES
2011S$ million
2010S$ million
+/(-)%
Staff costs
Salaries and other costs 1,338 1,177 14
Share-based expenses 10 12 (17 )
Contribution to defined contribution plans 100 94 6
1,448 1,283 13
Property and equipment
Depreciation 166 152 10
Maintenance and hire of property, plant & equipment 75 70 7
Rental expenses 68 59 14
Others 142 126 13
451 407 11
Other operating expenses 531 564 (6 )
Total operating expenses 2,430 2,254 8
Group staff strength
Period end 22,892 21,585 6
Average 22,371 21,126 6
Cost-to-income ratio 43.2% 42.3%
Operating expenses were S$2,430 million in 2011, an increase of 8% from a year ago. Staff costs increased 13% to S$1,448 million, reflecting the impact of a 6% growth in staff strength to support the expansion of the Group’s franchise; as well as salary increments and sales commissions linked to stronger business volumes. Property and equipment related expenses increased by 11%, largely attributable to higher technology related costs. Excluding the one-time cost of S$31 million in 2010 relating to the merger of Bank OCBC NISP and Bank OCBC Indonesia, operating expenses would have increased 9% from 2010.
The cost-to-income ratio was 43.2% for 2011, compared to 42.3% in 2010.
ALLOWANCES FOR LOANS AND OTHER ASSETS
2011S$ million
2010S$ million
+/(-)%
Specific allowances/(write-back) for loans
Singapore 47 (11) 543
Malaysia 10 32 (70)
Others 22 36 (37)
79 57 38
Portfolio allowances for loans 127 98 31
Allowances and impairment charges/(write-back) for other assets 15 (21) 172
Allowances for loans and impairment of other assets 221 134 65
Allowances for loans and other assets were S$221 million in 2011, up from S$134 million in 2010. Portfolio allowances increased 31% to S$127 million, in line with robust loan growth. Specific allowances for new and existing NPLs decreased 23% to S$231 million, while recoveries and write-backs of S$151 million were 37% lower than a year ago. As a result, net specific allowances increased to S$79 million from S$57 million in 2010.
Management Discussion and Analysis

67OCBC Annual Report 2011
LOANS AND ADVANCES
2011S$ million
2010S$ million
+/(-)%
By Industry
Agriculture, mining and quarrying 4,042 2,909 39
Manufacturing 8,424 7,057 19
Building and construction 20,365 18,532 10
Housing loans 32,076 27,076 18
General commerce 20,347 11,793 73
Transport, storage and communication 9,208 6,447 43
Financial institutions, investment and holding companies 15,150 12,887 18
Professionals and individuals 13,952 10,954 27
Others 11,568 8,794 32
135,132 106,449 27
By Currency
Singapore Dollar 61,198 54,850 12
United States Dollar 35,716 18,937 89
Malaysian Ringgit 16,724 14,885 12
Indonesian Rupiah 4,465 3,551 26
Others 17,029 14,226 20
135,132 106,449 27
By Geography (1)
Singapore 68,260 59,967 14
Malaysia 21,064 17,080 23
Rest of SEA 10,954 6,884 59
Greater China 19,952 11,079 80
Other Asia Pacific 6,302 5,311 19
Rest of the World 8,600 6,128 40
135,132 106,449 27
(1) Loans by geography are based on where the credit risks reside, which may be different from the borrower’s country of residence or the booking location of the loans.
Gross loans grew 27% from a year ago to S$135 billion as of 31 December 2011. Loan growth was broad-based, with the largest increases coming from the general commerce sector, housing loans, and loans to professionals and individuals.

68 OCBC Annual Report 2011
Management Discussion and Analysis
NON-PERFORMING ASSETS
Total NPAs S$ million
(1)
Substandard
S$ millionDoubtful
S$ millionLoss
S$ million
Secured NPAs/
Total NPAs %
NPLs S$ million
(2) NPL Ratio %
(2)
Singapore
2011 390 205 151 34 61.7 330 0.5
2010 399 272 54 73 57.8 318 0.5
Malaysia
2011 580 462 72 46 67.0 486 2.3
2010 605 419 114 72 53.3 478 2.8
Rest of SEA
2011 129 14 57 58 49.3 125 1.1
2010 114 41 10 63 59.5 115 1.7
Greater China
2011 42 39 3 – 73.1 42 0.2
2010 24 10 14 – 29.1 24 0.2
Other Asia Pacific
2011 188 178 10 – 83.4 87 1.4
2010 – – – – – – –
Rest of the World
2011 108 94 12 2 80.5 102 1.2
2010 66 37 25 4 78.1 60 1.0
Group
2011 1,437 992 305 140 67.3 1,172 0.9
2010 1,208 779 217 212 56.2 995 0.9
(1) Comprise non-bank loans, debt securities and contingent liabilities.(2) Exclude debt securities and contingent liabilities.
Non-performing loans (“NPLs”) were S$1,172 million as of 31 December 2011, 18% higher than a year ago. By geography, the increase was mainly from Other Asia Pacific and Rest of the World. By industry segment, the increases were mainly from financial institutions, investment and holding companies, building and construction, and transport, storage and communication.
The Group’s NPL ratio at 0.9% was unchanged from a year ago.
Including classified debt securities and contingent liabilities, the Group’s total non-performing assets (“NPAs”) were S$1,437 million as of 31 December 2011, 19% higher than a year ago. Of the total NPAs, 69% were in the substandard category and 67% were secured by collateral.

69OCBC Annual Report 2011
NON-PERFORMING ASSETS (continued)
2011 2010
S$ million% of
gross loans S$ million% of
gross loans
NPLs by Industry
Loans and advances
Agriculture, mining and quarrying 6 0.1 7 0.2
Manufacturing 294 3.5 299 4.2
Building and construction 149 0.7 97 0.5
Housing loans 188 0.6 190 0.7
General commerce 133 0.7 127 1.1
Transport, storage and communication 128 1.4 77 1.2
Financial institutions, investment and holding companies 124 0.8 29 0.2
Professionals and individuals 114 0.8 139 1.0
Others 36 0.3 30 0.5
Total NPLs 1,172 0.9 995 0.9
Classified debt securities 111 13
Classified contingent liabilities 154 200
Total NPAs 1,437 1,208
2011 2010
S$ million % S$ million %
NPAs by Period Overdue
Over 180 days 512 36 511 42
Over 90 to 180 days 85 6 98 8
30 to 90 days 204 14 166 14
Less than 30 days 25 2 20 2
Not overdue 611 42 413 34
1,437 100 1,208 100
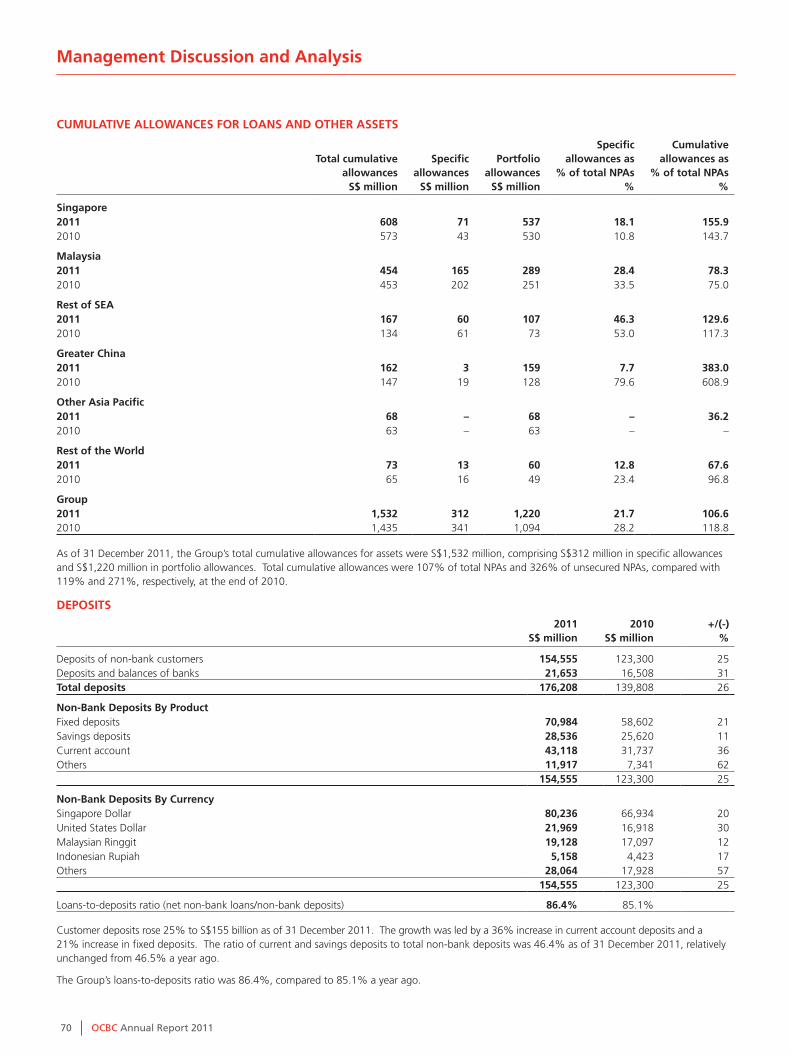
70 OCBC Annual Report 2011
Management Discussion and Analysis
CUMULATIVE ALLOWANCES FOR LOANS AND OTHER ASSETS
Total cumulative allowances
S$ million
Specific allowances
S$ million
Portfolio allowances
S$ million
Specific allowances as
% of total NPAs%
Cumulative allowances as
% of total NPAs%
Singapore2011 608 71 537 18.1 155.92010 573 43 530 10.8 143.7
Malaysia2011 454 165 289 28.4 78.32010 453 202 251 33.5 75.0
Rest of SEA2011 167 60 107 46.3 129.62010 134 61 73 53.0 117.3
Greater China2011 162 3 159 7.7 383.02010 147 19 128 79.6 608.9
Other Asia Pacific2011 68 – 68 – 36.22010 63 – 63 – –
Rest of the World 2011 73 13 60 12.8 67.62010 65 16 49 23.4 96.8
Group 2011 1,532 312 1,220 21.7 106.62010 1,435 341 1,094 28.2 118.8
As of 31 December 2011, the Group’s total cumulative allowances for assets were S$1,532 million, comprising S$312 million in specific allowances and S$1,220 million in portfolio allowances. Total cumulative allowances were 107% of total NPAs and 326% of unsecured NPAs, compared with 119% and 271%, respectively, at the end of 2010.
DEPOSITS
2011S$ million
2010S$ million
+/(-)%
Deposits of non-bank customers 154,555 123,300 25Deposits and balances of banks 21,653 16,508 31Total deposits 176,208 139,808 26
Non-Bank Deposits By ProductFixed deposits 70,984 58,602 21Savings deposits 28,536 25,620 11Current account 43,118 31,737 36Others 11,917 7,341 62
154,555 123,300 25
Non-Bank Deposits By CurrencySingapore Dollar 80,236 66,934 20United States Dollar 21,969 16,918 30Malaysian Ringgit 19,128 17,097 12Indonesian Rupiah 5,158 4,423 17Others 28,064 17,928 57
154,555 123,300 25
Loans-to-deposits ratio (net non-bank loans/non-bank deposits) 86.4% 85.1%
Customer deposits rose 25% to S$155 billion as of 31 December 2011. The growth was led by a 36% increase in current account deposits and a 21% increase in fixed deposits. The ratio of current and savings deposits to total non-bank deposits was 46.4% as of 31 December 2011, relatively unchanged from 46.5% a year ago.
The Group’s loans-to-deposits ratio was 86.4%, compared to 85.1% a year ago.

71OCBC Annual Report 2011
PERFORMANCE BY BUSINESS SEGMENTOCBC Group’s businesses are presented in the following customer and product segments: Global Consumer Financial Services, Global Corporate Banking, Global Treasury and Insurance.
Operating Profit by Business Segment
2011S$ million
2010S$ million
+/(-)%
Global Consumer Financial Services 468 525 (11)
Global Corporate Banking 1,500 1,265 19
Global Treasury 780 582 34
Insurance 437 564 (22)
Others (1) 247 413 (40)
Operating profit after allowances and amortisation for total business segments 3,432 3,349 2
Add/(Less):
- Joint income elimination (2) (454) (373 ) 22
- Items not attributed to business segments (68) (94 ) (27)
Operating profit after allowances and amortisation 2,910 2,882 1
(1) Excludes gains from divestment of non-core assets.(2) These are joint income allocated to business segments to reward cross-selling activities.
Global Consumer Financial Services Global Consumer Financial Services comprises a full range of products and services offered to individuals, including deposit products (checking accounts, savings and fixed deposits), consumer loans (housing loans and other personal loans), credit cards and wealth management products (unit trusts, bancassurance products and structured deposits).
Operating profit after allowances of the consumer segment declined 11% to S$468 million in 2011. Strong fee and commission income were offset by a decline in net interest income, and an increase in expenses and portfolio allowances.
Global Corporate BankingGlobal Corporate Banking serves business customers ranging from large corporates and the public sector to small and medium enterprises. The products and services offered include long-term loans such as project financing, short-term credit such as overdrafts and trade financing, deposit accounts and fee-based services such as cash management and custodian services.
Global Corporate Banking’s operating profit after allowances grew 19% to S$1,500 million in 2011. Higher net interest income, led by robust loan growth, and fee income more than offset lower net interest margin, higher expenses and portfolio allowances.
Global TreasuryGlobal Treasury engages in foreign exchange activities, money market operations, fixed income and derivatives trading, and also offers structured treasury products and financial solutions to meet customers’ investment and hedging needs.
Global Treasury’s operating profit in 2011 grew 34% to S$780 million, as significantly higher fees and commissions from cross selling activities more than offset the drop in trading income and higher expenses.
InsuranceThe Group’s insurance business, including its fund management activities, is undertaken by 87.2%-owned subsidiary GEH and its subsidiaries, which provide both life and general insurance products to its customers mainly in Singapore and Malaysia.
GEH’s results in 2011 were underpinned by strong growth in underwriting profits and 10% increase in new business weighted premiums. Operating profit in 2011 fell 22% to S$437 million, as GEH’s performance was impacted by the volatile markets and widening credit spreads. After tax and non-controlling interests, GEH’s contribution to the Group’s core net profit was S$297 million in 2011, as compared with S$405 million in 2010.
OthersThe “Others” segment comprises Bank of Singapore, PacificMas Berhad, corporate finance, capital markets, property holding, stock brokerage and investment holding. Operating profit after allowances for this segment declined 40% to S$247 million. The decrease was mainly attributed to lower gains from investment securities and decrease in profits from stockbroking activities.

72 OCBC Annual Report 2011
PERFORMANCE BY GEOGRAPHICAL SEGMENT
2011 2010
S$ million % S$ million %
Total core income
Singapore (1) 3,405 60 3,350 63
Malaysia 1,220 22 1,233 23
Rest of SEA 435 8 389 7
Greater China 387 7 216 4
Other Asia Pacific 122 2 95 2
Rest of the World 53 1 42 1
5,622 100 5,325 100
Profit before income tax
Singapore (1) 1,732 59 1,958 68
Malaysia 750 26 768 27
Rest of SEA 123 4 60 2
Greater China 195 7 34 1
Other Asia Pacific 94 3 53 2
Rest of the World 23 1 7 –
2,917 100 2,880 100
Total assets
Singapore 173,522 62 145,864 64
Malaysia 53,327 19 47,673 21
Rest of SEA 9,962 4 8,550 4
Greater China 28,878 10 17,263 7
Other Asia Pacific 7,854 3 6,987 3
Rest of the World 4,215 2 2,946 1
277,758 100 229,283 100
(1) Excludes gain of S$39 million from divestment of non-core assets for 2011.
The geographical segment analysis is based on the location where assets or transactions are booked. For 2011, Singapore accounted for 60% of total income and 59% of pre-tax profit, while Malaysia accounted for 22% of total income and 26% of pre-tax profit.
Pre-tax profit for Singapore declined 12% to S$1,732 million, as higher net interest income and fee and commission income was more than offset by lower insurance and trading income, as well as higher expenses and allowances. Malaysia’s pre-tax profit for 2011 was 2% lower from a year ago at S$750 million, mainly attributable to a decline in trading income and lower investment gains.
Management Discussion and Analysis

73OCBC Annual Report 2011
CAPITAL ADEQUACY RATIOSAs of 31 December 2011, the Group’s Tier 1 ratio and total capital adequacy ratio (“CAR”) were 14.4% and 15.7%, respectively. These were well above the regulatory minimum of 6% and 10%, respectively.
Total eligible capital increased year-on-year, contributed by the following factors: retained earnings for the year; the issue of approximately 100 million new shares to shareholders who participated in the Scrip Dividend Schemes for the 2010 final dividend and 2011 interim dividend; and with effect from 1 January 2011, arising from changes in the MAS Notice 637 in July 2010, the inclusion of 45% of unrealised gains on quoted available-for-sale equity securities in Tier 2 capital. Risk weighted assets (“RWA”) increased 22%, driven by loan growth, and by the change, with effect from 1 January 2011, from the Standardised Approach to the Simple Risk Weight method under the Internal Ratings-Based Approach for the calculation of RWA for equity exposures.
The Group’s core Tier 1 ratio, which excludes Tier 1 preference shares, was 11.4% as of 31 December 2011, compared with 12.5% as of 31 December 2010.
UNREALISED VALUATION SURPLUS
2011S$ million
2010S$ million
Properties (1) 2,877 2,549
Equity securities (2) 636 2,216
Total 3,513 4,765
(1) Includes properties classified as investment properties and assets held for sale. Property values are determined mainly based on external valuations at the end of the year.(2) Comprises mainly investments in quoted subsidiaries, which are valued based on their market prices at the end of the year.
The Group’s unrealised valuation surplus largely represents the difference between the carrying values of its properties and investments in quoted subsidiaries and associates as compared to the property values and market prices of the quoted investments. The carrying values of subsidiaries and associates on the balance sheet are measured at cost plus post-acquisition reserves, while those of properties are measured at cost less accumulated depreciation, and impairment, if any.
The valuation surplus as of 31 December 2011 was S$3.51 billion, a decline of 26% from S$4.77 billion a year ago, mainly attributable to lower equity securities valuation surplus from the Group’s equity stakes in GEH and Bank OCBC NISP.

74 OCBC Annual Report 2011
Directors’ Report
For the financial year ended 31 December 2011
The directors present their report to the members together with the audited consolidated financial statements of the Group and the income statement, statement of comprehensive income, balance sheet and statement of changes in equity of the Bank for the financial year ended31 December 2011.
DIRECTORSThe directors of the Bank in office at the date of this report are as follows:
Cheong Choong Kong, ChairmanBobby Chin Yoke Choong David Philbrick Conner, Chief Executive OfficerFang Ai LianLai Teck Poh Lee Seng Wee Lee Tih Shih Colm Martin McCarthyNeo Boon SiongQuah Wee Ghee (appointed on 9 January 2012) Pramukti Surjaudaja Teh Kok Peng (appointed on 1 August 2011) Patrick Yeoh Khwai Hoh
Mr Bobby Chin Yoke Choong, Mrs Fang Ai Lian and Mr Colm Martin McCarthy retire by rotation under Articles 95 and 96 of the Articles of Association of the Bank and, being eligible, offer themselves for re-election.
Dr Teh Kok Peng and Mr Quah Wee Ghee, who were appointed to the Board under Article 101 of the Articles of Association of the Bank retire in accordance with the provisions of that Article and, being eligible, offer themselves for re-election.
Dr Cheong Choong Kong and Mr Lee Seng Wee retire pursuant to section 153 of the Companies Act, Cap. 50. Resolutions will be proposed for their re-appointment under section 153(6) of the said Act to hold office until the next annual general meeting of the Bank.
Mr Patrick Yeoh Khwai Hoh, having attained the age of 74, will cease to hold office at the conclusion of the forthcoming annual general meeting pursuant to section 153 of the Companies Act, Cap. 50, but will not be standing for re-appointment thereat.
ARRANGEMENTS TO ENABLE DIRECTORS TO ACQUIRE SHARES AND DEBENTURESNeither at the end of nor at any time during the financial year was the Bank a party to any arrangement whose object is to enable the directors of the Bank to acquire benefits by means of the acquisition of shares in, or debentures of, the Bank or any other body corporate, other than as disclosed in this report.

75OCBC Annual Report 2011
DIRECTORS’ INTERESTS IN SHARES OR DEBENTURESAccording to the register of directors’ shareholdings, the directors holding office at the end of the financial year had interests in the share capital of the Bank and its related corporation, as follows:
Direct interest Deemed interest
At 31.12.2011
At 1.1.2011/Date of
appointment At 31.12.2011
At 1.1.2011/Date of
appointment
BANK
Ordinary shares
Cheong Choong Kong 178,373 172,063 10,831 (1) 10,447 (1)
Bobby Chin Yoke Choong 28,917 21,893 45,130 (1) 43,533 (1)
David Philbrick Conner 1,880,311 1,580,281 1,754,224 (2) 1,530,811 (3)
Fang Ai Lian 62,671 6,222 – –
Lai Teck Poh 416,703 392,511 36,070 (4) 44,244 (4)
Lee Seng Wee 7,525,454 7,253,265 4,401,409 (1) 4,245,723 (1)
Lee Tih Shih 2,683,860 2,582,926 – –
Colm Martin McCarthy 12,561 6,115 – –
Neo Boon Siong 34,332 27,117 – –
Pramukti Surjaudaja 12,561 6,115 – –
Teh Kok Peng 386,991 170,580 – –
Patrick Yeoh Khwai Hoh 40,622 33,184 – –
5.1% Class B non-cumulative non-convertible preference shares
Fang Ai Lian 1,700 1,700 – –
Lai Teck Poh 2,500 2,500 – –
4.2% Class G non-cumulative non-convertible preference shares
Cheong Choong Kong 15,000 15,000 – –
Bobby Chin Yoke Choong – – 8,227 (1) 8,227 (1)
David Philbrick Conner 50,000 50,000 – –
Lee Seng Wee 800,000 800,000 600,000 (1) 600,000 (1)
Lee Tih Shih 240,000 240,000 – –
Teh Kok Peng 40,000 40,000 – –
OCBC Capital Corporation (2008)
5.1% non-cumulative non-convertible guaranteed preference shares
Cheong Choong Kong 10,000 10,000 – –
Lee Tih Shih 10,000 10,000 – –
Patrick Yeoh Khwai Hoh 10,000 10,000 10,000 (1) 10,000 (1)
(1) Ordinary shares/preference shares held by spouse.(2) Comprises interest of 1,258,173 ordinary shares under OCBC Deferred Share Plan, acquisition rights of 8,022 ordinary shares under OCBC Employee Share Purchase
Plan and 488,029 ordinary shares under employment contract.(3) Comprises interest of 1,050,485 ordinary shares under OCBC Deferred Share Plan, acquisition rights of 9,560 ordinary shares under OCBC Employee Share Purchase
Plan and 470,766 ordinary shares under employment contract.(4) Ordinary shares under OCBC Deferred Share Plan.
None of the directors have direct or deemed interest in the 4.5% Class E non-cumulative non-convertible preference shares.
Save as disclosed above, no directors had any interest in shares, or debentures of, the Bank or related corporations either at the beginning of the financial year, date of appointment, or at the end of the financial year.
There were no changes to any of the above mentioned interests in the Bank between the end of the financial year and 21 January 2012, except for Mr Lai Teck Poh whose shareholdings in the Bank in which he has a direct interest has increased by 70,000 shares pursuant to the exercise of his share options on 13 January 2012.

76 OCBC Annual Report 2011
Directors’ Report
For the financial year ended 31 December 2011
DiRectoRs’ contRactual benefitsSince the end of the previous financial year, no director has received, or become entitled to receive, benefits by reason of a contract made by the Bank or a related corporation with the director, or with a firm of which he is a member, or with a company in which he has a substantial financial interest, except as disclosed in this report, or in the financial statements of the Company and of the Group.
An agreement was made between Dr Cheong Choong Kong (“Dr Cheong”), non-executive director and Chairman of the Bank, and OCBC Management Services Private Limited, a wholly-owned subsidiary of the Bank, under which Dr Cheong is appointed as consultant to oversee and supervise the strategic planning of the Bank and its subsidiaries with respect to customer service, talent identification, and the development and succession of senior management within the Group. Under the agreement, in respect of the financial year ended 31 December 2011, Dr Cheong has received payments and benefits amounting to $1,117,155, and will receive a variable bonus of $100,000, or any additional bonus as may be determined by the Remuneration Committee and the Board of Directors of the Bank. In respect of the financial year ended 31 December 2010, Dr Cheong has received aggregate payments and benefits of $1,118,993 and a variable bonus of a total amount of $1,290,000, comprising a bonus of $100,000 and an additional bonus of $1,190,000.
In his capacity as a director of the Bank, Dr Cheong is also eligible for any directors’ fees or share options that are recommended by the Board of Directors. Dr Cheong’s total remuneration (including the payments mentioned above and all benefits, variable bonus, directors’ fees and share options) for the financial year ended 31 December 2011 is reflected in the Directors’ Remuneration table in the Corporate Governance Section of the Annual Report.
shaRe-baseD compensation plansThe Bank’s share-based compensation plans are administered by the Remuneration Committee, which comprises:
Fang Ai Lian, ChairmanCheong Choong KongLee Tih ShihNeo Boon Siong
Dr Cheong Choong Kong did not participate in any deliberation or decision in respect of options granted to him.
Under the share-based compensation plans, no options or rights have been granted to controlling shareholders of the Bank or their associates, nor has any participant received 5% or more of the total number of options or rights available under each respective scheme or plan during the financial year. No options or rights were granted at a discount during the financial year. The persons to whom the options or rights were issued have no right by virtue of these options or rights to participate in any share issue of any other company.
The Bank’s share-based compensation plans are as follows:
(a) OCBC Share Option Schemes
The OCBC Share Option Scheme 2001 (“2001 Scheme”), which was implemented in 2001, had been extended for another 10 years from 2011 to 2021, as approved by the shareholders. Executives of the Group ranked Manager and above (including executive and non-executive directors), are eligible for this scheme. The Bank will either issue new shares or transfer treasury shares to the executives upon their exercise of options.
Particulars of Options 2002, 2002B, 2003, 2004, 2004A, 2004B, 2005, 2005A, 2006, 2006B, 2007, 2007A, 2007B, 2007NED, 2008, 2008NED, 2009, 2009NED, 2010 and 2010NED were set out in the Directors’ Reports for the financial years ended 31 December 2002 to 2010.
During the financial year, pursuant to the 2001 Scheme, options to acquire 2,824,281 ordinary shares at $9.350 per ordinary share were granted to 125 eligible executives of the Group (“2011 Options”), as well as to a non-executive director of the Bank (“2011NED Options”). The acquisition price was equal to the average of the last traded price of the ordinary shares of the Bank on the Singapore Exchange over five consecutive trading days immediately prior to the date when the offer to grant an option was made to a grantee.
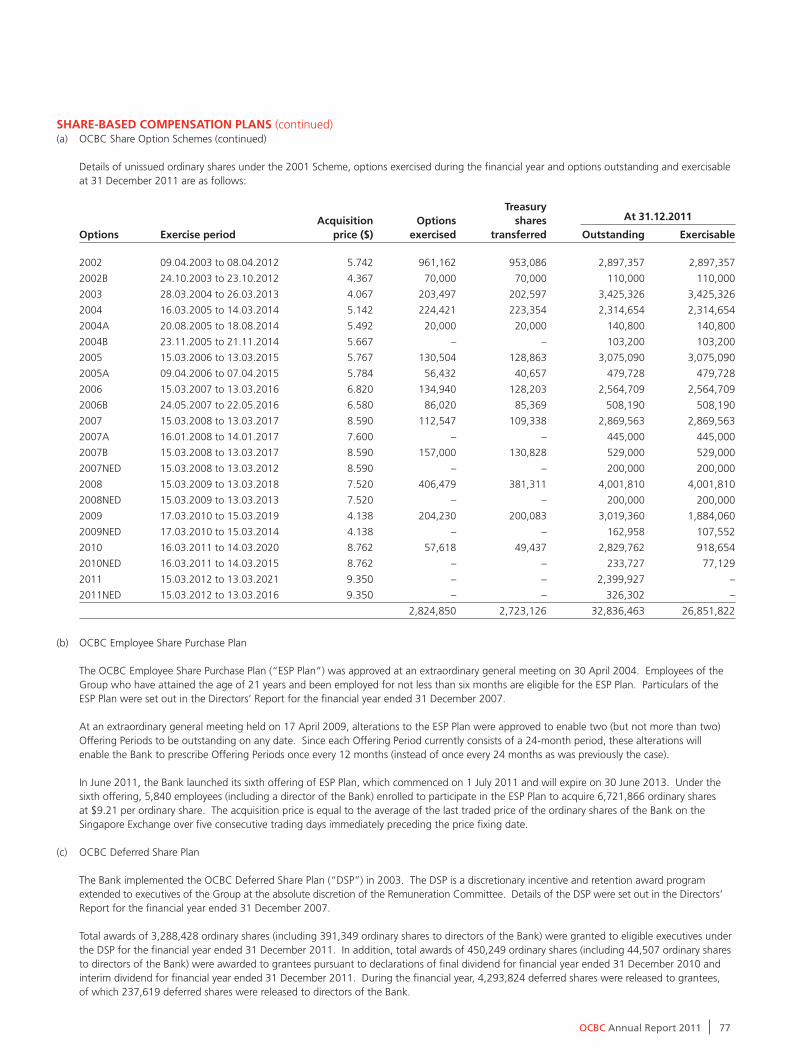
77OCBC Annual Report 2011
shaRe-baseD compensation plans (continued) (a) OCBC Share Option Schemes (continued)
Details of unissued ordinary shares under the 2001 Scheme, options exercised during the financial year and options outstanding and exercisable at 31 December 2011 are as follows:
options exercise periodacquisition
price ($)options
exercised
treasuryshares
transferred
at 31.12.2011
outstanding exercisable
2002 09.04.2003 to 08.04.2012 5.742 961,162 953,086 2,897,357 2,897,357
2002B 24.10.2003 to 23.10.2012 4.367 70,000 70,000 110,000 110,000
2003 28.03.2004 to 26.03.2013 4.067 203,497 202,597 3,425,326 3,425,326
2004 16.03.2005 to 14.03.2014 5.142 224,421 223,354 2,314,654 2,314,654
2004A 20.08.2005 to 18.08.2014 5.492 20,000 20,000 140,800 140,800
2004B 23.11.2005 to 21.11.2014 5.667 – – 103,200 103,200
2005 15.03.2006 to 13.03.2015 5.767 130,504 128,863 3,075,090 3,075,090
2005A 09.04.2006 to 07.04.2015 5.784 56,432 40,657 479,728 479,728
2006 15.03.2007 to 13.03.2016 6.820 134,940 128,203 2,564,709 2,564,709
2006B 24.05.2007 to 22.05.2016 6.580 86,020 85,369 508,190 508,190
2007 15.03.2008 to 13.03.2017 8.590 112,547 109,338 2,869,563 2,869,563
2007A 16.01.2008 to 14.01.2017 7.600 – – 445,000 445,000
2007B 15.03.2008 to 13.03.2017 8.590 157,000 130,828 529,000 529,000
2007NED 15.03.2008 to 13.03.2012 8.590 – – 200,000 200,000
2008 15.03.2009 to 13.03.2018 7.520 406,479 381,311 4,001,810 4,001,810
2008NED 15.03.2009 to 13.03.2013 7.520 – – 200,000 200,000
2009 17.03.2010 to 15.03.2019 4.138 204,230 200,083 3,019,360 1,884,060
2009NED 17.03.2010 to 15.03.2014 4.138 – – 162,958 107,552
2010 16.03.2011 to 14.03.2020 8.762 57,618 49,437 2,829,762 918,654
2010NED 16.03.2011 to 14.03.2015 8.762 – – 233,727 77,129
2011 15.03.2012 to 13.03.2021 9.350 – – 2,399,927 –
2011NED 15.03.2012 to 13.03.2016 9.350 – – 326,302 –
2,824,850 2,723,126 32,836,463 26,851,822
(b) OCBC Employee Share Purchase Plan
The OCBC Employee Share Purchase Plan (“ESP Plan”) was approved at an extraordinary general meeting on 30 April 2004. Employees of the Group who have attained the age of 21 years and been employed for not less than six months are eligible for the ESP Plan. Particulars of the ESP Plan were set out in the Directors’ Report for the financial year ended 31 December 2007.
At an extraordinary general meeting held on 17 April 2009, alterations to the ESP Plan were approved to enable two (but not more than two) Offering Periods to be outstanding on any date. Since each Offering Period currently consists of a 24-month period, these alterations will enable the Bank to prescribe Offering Periods once every 12 months (instead of once every 24 months as was previously the case).
In June 2011, the Bank launched its sixth offering of ESP Plan, which commenced on 1 July 2011 and will expire on 30 June 2013. Under the sixth offering, 5,840 employees (including a director of the Bank) enrolled to participate in the ESP Plan to acquire 6,721,866 ordinary shares at $9.21 per ordinary share. The acquisition price is equal to the average of the last traded price of the ordinary shares of the Bank on the Singapore Exchange over five consecutive trading days immediately preceding the price fixing date.
(c) OCBC Deferred Share Plan
The Bank implemented the OCBC Deferred Share Plan (“DSP”) in 2003. The DSP is a discretionary incentive and retention award program extended to executives of the Group at the absolute discretion of the Remuneration Committee. Details of the DSP were set out in the Directors’ Report for the financial year ended 31 December 2007.
Total awards of 3,288,428 ordinary shares (including 391,349 ordinary shares to directors of the Bank) were granted to eligible executives under the DSP for the financial year ended 31 December 2011. In addition, total awards of 450,249 ordinary shares (including 44,507 ordinary shares to directors of the Bank) were awarded to grantees pursuant to declarations of final dividend for financial year ended 31 December 2010 and interim dividend for financial year ended 31 December 2011. During the financial year, 4,293,824 deferred shares were released to grantees, of which 237,619 deferred shares were released to directors of the Bank.
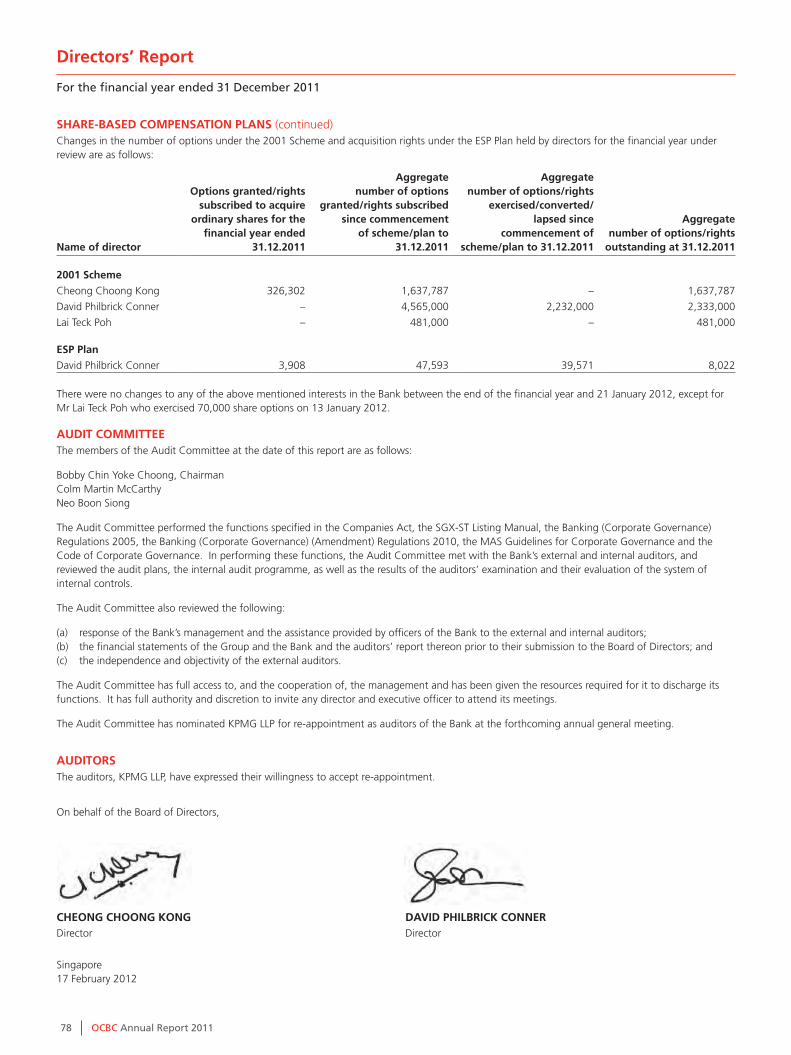
78 OCBC Annual Report 2011
SHARE-BASED COMPENSATION PLANS (continued) Changes in the number of options under the 2001 Scheme and acquisition rights under the ESP Plan held by directors for the financial year under review are as follows:
Name of director
Options granted/rights subscribed to acquire
ordinary shares for the financial year ended
31.12.2011
Aggregate number of options
granted/rights subscribed since commencement
of scheme/plan to 31.12.2011
Aggregatenumber of options/rights
exercised/converted/lapsed since
commencement ofscheme/plan to 31.12.2011
Aggregate number of options/rights
outstanding at 31.12.2011
2001 Scheme
Cheong Choong Kong 326,302 1,637,787 – 1,637,787
David Philbrick Conner – 4,565,000 2,232,000 2,333,000
Lai Teck Poh – 481,000 – 481,000
ESP Plan
David Philbrick Conner 3,908 47,593 39,571 8,022
There were no changes to any of the above mentioned interests in the Bank between the end of the financial year and 21 January 2012, except for Mr Lai Teck Poh who exercised 70,000 share options on 13 January 2012.
AUDIT COMMITTEEThe members of the Audit Committee at the date of this report are as follows:
Bobby Chin Yoke Choong, ChairmanColm Martin McCarthy Neo Boon Siong
The Audit Committee performed the functions specified in the Companies Act, the SGX-ST Listing Manual, the Banking (Corporate Governance) Regulations 2005, the Banking (Corporate Governance) (Amendment) Regulations 2010, the MAS Guidelines for Corporate Governance and the Code of Corporate Governance. In performing these functions, the Audit Committee met with the Bank’s external and internal auditors, and reviewed the audit plans, the internal audit programme, as well as the results of the auditors’ examination and their evaluation of the system of internal controls.
The Audit Committee also reviewed the following:
(a) response of the Bank’s management and the assistance provided by officers of the Bank to the external and internal auditors; (b) the financial statements of the Group and the Bank and the auditors’ report thereon prior to their submission to the Board of Directors; and(c) the independence and objectivity of the external auditors.
The Audit Committee has full access to, and the cooperation of, the management and has been given the resources required for it to discharge its functions. It has full authority and discretion to invite any director and executive officer to attend its meetings.
The Audit Committee has nominated KPMG LLP for re-appointment as auditors of the Bank at the forthcoming annual general meeting.
AUDITORSThe auditors, KPMG LLP, have expressed their willingness to accept re-appointment.
On behalf of the Board of Directors,
CHEONG CHOONG KONG DAVID PHILBRICK CONNERDirector Director
Singapore17 February 2012
Directors’ Report
For the financial year ended 31 December 2011

79OCBC Annual Report 2011
Statement by Directors
For the financial year ended 31 December 2011
In the opinion of the directors,
(a) the financial statements set out on pages 81 to 173 are drawn up so as to give a true and fair view of the state of affairs of the Group and of the Bank as at 31 December 2011, the results and changes in equity of the Group and of the Bank for the financial year ended on that date, and cash flows of the Group for the financial year ended on that date; and
(b) at the date of this statement, there are reasonable grounds to believe that the Bank will be able to pay its debts as and when they fall due. The Board of Directors has, on the date of this statement, authorised these financial statements for issue.
On behalf of the Board of Directors,
CHEONG CHOONG KONG DAVID PHILBRICK CONNERDirector Director
Singapore17 February 2012

80 OCBC Annual Report 2011
Report on the financial statementsWe have audited the accompanying financial statements of Oversea-Chinese Banking Corporation Limited (“the Bank”) and its subsidiaries (“the Group”), which comprise the balance sheets of the Group and the Bank as at 31 December 2011, the income statements, statements of comprehensive income and statements of changes in equity of the Group and the Bank and cash flow statement of the Group for the year then ended, and a summary of significant accounting policies and other explanatory information, as set out on pages 81 to 173.
Management’s responsibility for the financial statementsManagement is responsible for the preparation of financial statements that give a true and fair view in accordance with the provisions of the Singapore Companies Act, Chapter 50 (“the Act”) and Singapore Financial Reporting Standards, and for devising and maintaining a system of internal accounting controls sufficient to provide a reasonable assurance that assets are safeguarded against loss from unauthorised use or disposition; and transactions are properly authorised and that they are recorded as necessary to permit the preparation of true and fair profit and loss accounts and balance sheets and to maintain accountability of assets.
Auditors’ responsibilityOur responsibility is to express an opinion on these financial statements based on our audit. We conducted our audit in accordance with Singapore Standards on Auditing. Those standards require that we comply with ethical requirements and plan and perform the audit to obtain reasonable assurance about whether the financial statements are free from material misstatement.
An audit involves performing procedures to obtain audit evidence about the amounts and disclosures in the financial statements. The procedures selected depend on the auditor’s judgement, including the assessment of the risks of material misstatement of the financial statements, whether due to fraud or error. In making those risk assessments, the auditor considers internal control relevant to the entity’s preparation of financial statements that give a true and fair view in order to design audit procedures that are appropriate in the circumstances, but not for the purpose of expressing an opinion on the effectiveness of the entity’s internal control. An audit also includes evaluating the appropriateness of accounting policies used and the reasonableness of accounting estimates made by management, as well as evaluating the overall presentation of the financial statements.
We believe that the audit evidence we have obtained is sufficient and appropriate to provide a basis for our audit opinion.
OpinionIn our opinion, the consolidated financial statements of the Group and the financial statements of the Bank are properly drawn up in accordance with the provisions of the Act and Singapore Financial Reporting Standards, including the modification of the requirements of FRS 39 Financial Instruments: Recognition and Measurement in respect of loan loss provisioning by Notice to Banks No. 612 ‘Credit Files, Grading and Provisioning’ issued by the Monetary Authority of Singapore, to give a true and fair view of the state of affairs of the Group and of the Bank as at 31 December 2011, the results and changes in equity of the Group and of the Bank and cash flows of the Group for the year ended on that date.
Report on other legal and regulatory requirementsIn our opinion, the accounting and other records required by the Act to be kept by the Bank and by those subsidiaries incorporated in Singapore of which we are the auditors have been properly kept in accordance with the provisions of the Act.
KPMG LLP
Public Accountants and
Certified Public Accountants
Singapore17 February 2012
Independent Auditors’ Report
To The Members Of Oversea-Chinese Banking Corporation Limited

81OCBC Annual Report 2011
GROUP BANK
Note2011$’000
2010$’000
2011$’000
2010$’000
Interest income 5,319,991 4,363,260 3,069,746 2,585,502
Interest expense (1,909,569) (1,416,381) (1,053,601) (820,326)
Net interest income 3 3,410,422 2,946,879 2,016,145 1,765,176
Premium income 6,106,288 5,866,349 – –
Investment income 1,675,469 2,439,931 – –
Net claims, surrenders and annuities (4,530,694) (4,181,156) – –
Change in life assurance fund contract liabilities (1,697,463) (2,545,154) – –
Commission and others (1,171,072) (1,142,738) – –
Profit from life assurance 4 382,528 437,232 – –
Premium income from general insurance 125,079 148,584 – –
Fees and commissions (net) (1) 5 1,137,127 982,815 646,520 513,210
Dividends 6 88,048 62,639 339,183 292,270
Rental income 76,009 77,069 31,001 33,583
Other income (1) 7 441,465 669,510 271,404 367,353
Non-interest income 2,250,256 2,377,849 1,288,108 1,206,416
Total income 5,660,678 5,324,728 3,304,253 2,971,592
Staff costs (1,448,181) (1,283,285) (576,689) (537,908)
Other operating expenses (981,731) (970,294) (665,420) (617,750)
Total operating expenses 8 (2,429,912) (2,253,579) (1,242,109) (1,155,658)
Operating profit before allowances and amortisation 3,230,766 3,071,149 2,062,144 1,815,934
Amortisation of intangible assets 37 (61,337) (54,799) – –
Allowances for loans and impairment for other assets 9 (221,406) (134,026) (126,632) (35,885)
Operating profit after allowances and amortisation 2,948,023 2,882,324 1,935,512 1,780,049
Share of results of associates and joint ventures 7,166 (2,095) – –
Profit before income tax 2,955,189 2,880,229 1,935,512 1,780,049
Income tax expense 10 (476,586) (433,302) (200,865) (188,981)
Profit for the year 2,478,603 2,446,927 1,734,647 1,591,068
Attributable to:
Equity holders of the Bank 2,312,216 2,253,466
Non-controlling interests 166,387 193,461
2,478,603 2,446,927 Earnings per share (cents) 11
Basic 65.8 66.1
Diluted 65.6 65.9
(1) Comparatives have been restated to conform to current year’s presentation.
Income Statements
For the financial year ended 31 December 2011
The accompanying notes, as well as the Capital Management and Risk Management sections, form an integral part of these financial statements.
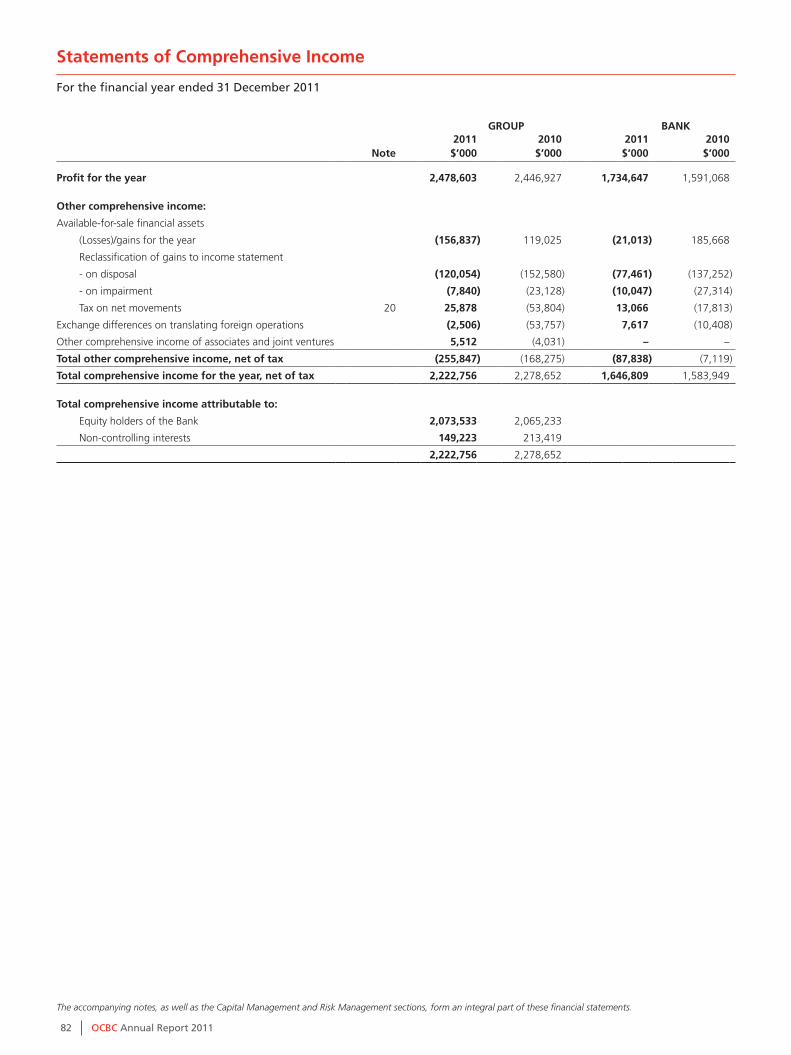
82 OCBC Annual Report 2011
GROUP BANK
Note2011$’000
2010$’000
2011$’000
2010$’000
Profit for the year 2,478,603 2,446,927 1,734,647 1,591,068
Other comprehensive income:
Available-for-sale financial assets
(Losses)/gains for the year (156,837) 119,025 (21,013) 185,668
Reclassification of gains to income statement
- on disposal (120,054) (152,580) (77,461) (137,252)
- on impairment (7,840) (23,128) (10,047) (27,314)
Tax on net movements 20 25,878 (53,804) 13,066 (17,813)
Exchange differences on translating foreign operations (2,506) (53,757) 7,617 (10,408)
Other comprehensive income of associates and joint ventures 5,512 (4,031) – –
Total other comprehensive income, net of tax (255,847) (168,275) (87,838) (7,119)
Total comprehensive income for the year, net of tax 2,222,756 2,278,652 1,646,809 1,583,949
Total comprehensive income attributable to:
Equity holders of the Bank 2,073,533 2,065,233
Non-controlling interests 149,223 213,419
2,222,756 2,278,652
Statements of Comprehensive Income
For the financial year ended 31 December 2011
The accompanying notes, as well as the Capital Management and Risk Management sections, form an integral part of these financial statements.

83OCBC Annual Report 2011
Balance Sheets
As at 31 December 2011
GROUP BANK
Note
2011$’000
2010 $’000
2011$’000
2010$’000
EQUITY
Attributable to equity holders of the Bank
Share capital 13 9,022,918 8,210,550 9,022,918 8,210,550
Capital reserves 14 279,402 612,826 90,289 432,498
Fair value reserves 1,124,668 1,374,198 510,394 605,849
Revenue reserves 15 12,143,711 10,592,671 7,721,619 6,605,466
22,570,699 20,790,245 17,345,220 15,854,363
Non-controlling interests 16 2,819,322 2,854,919 – –
Total equity 25,390,021 23,645,164 17,345,220 15,854,363
LIABILITIES
Deposits of non-bank customers 17 154,554,839 123,300,026 109,826,711 88,890,546
Deposits and balances of banks 17 21,653,245 16,508,477 18,880,685 13,810,825
Due to subsidiaries – – 5,912,981 4,623,552
Due to associates 178,050 139,028 164,361 118,374
Trading portfolio liabilities 1,655,040 1,734,253 1,655,040 1,734,236
Derivative payables 18 6,112,768 4,562,754 5,782,256 4,222,133
Other liabilities 19 4,023,408 3,186,719 1,458,675 1,062,633
Current tax 800,161 744,224 304,098 311,113
Deferred tax 20 1,123,125 1,126,541 120,854 131,277
Debt issued 21 13,063,178 6,854,466 13,797,463 7,887,194
203,163,814 158,156,488 157,903,124 122,791,883
Life assurance fund liabilities 22 49,203,775 47,481,158 – –
Total liabilities 252,367,589 205,637,646 157,903,124 122,791,883
Total equity and liabilities 277,757,610 229,282,810 175,248,344 138,646,246
ASSETS
Cash and placements with central banks 23 12,896,605 11,492,891 6,985,599 6,786,943
Singapore government treasury bills and securities 24 13,250,113 11,156,522 12,592,280 10,485,222
Other government treasury bills and securities 24 7,396,804 5,944,527 3,987,623 3,174,142
Placements with and loans to banks 25 28,614,577 18,568,632 20,654,266 13,612,284
Loans and bills receivable 26–29 133,556,851 104,989,207 97,786,527 75,877,251
Debt and equity securities 30 15,081,434 14,254,552 9,721,440 9,835,616
Assets pledged 44 1,838,981 745,737 1,328,905 708,171
Assets held for sale 45 6,195 3,540 – 1,654
Derivative receivables 18 5,898,815 4,836,906 5,462,372 4,461,711
Other assets 31 3,191,439 3,116,482 1,186,728 828,060
Deferred tax 20 43,416 78,529 4,321 6,454
Associates and joint ventures 33 360,435 255,097 215,073 113,018
Subsidiaries 34 – – 12,461,828 9,934,430
Property, plant and equipment 35 1,663,870 1,624,737 425,289 400,627
Investment property 36 922,335 732,893 568,917 553,487
Goodwill and intangible assets 37 3,947,394 3,996,481 1,867,176 1,867,176
228,669,264 181,796,733 175,248,344 138,646,246
Life assurance fund investment assets 22 49,088,346 47,486,077 – –
Total assets 277,757,610 229,282,810 175,248,344 138,646,246
The accompanying notes, as well as the Capital Management and Risk Management sections, form an integral part of these financial statements.
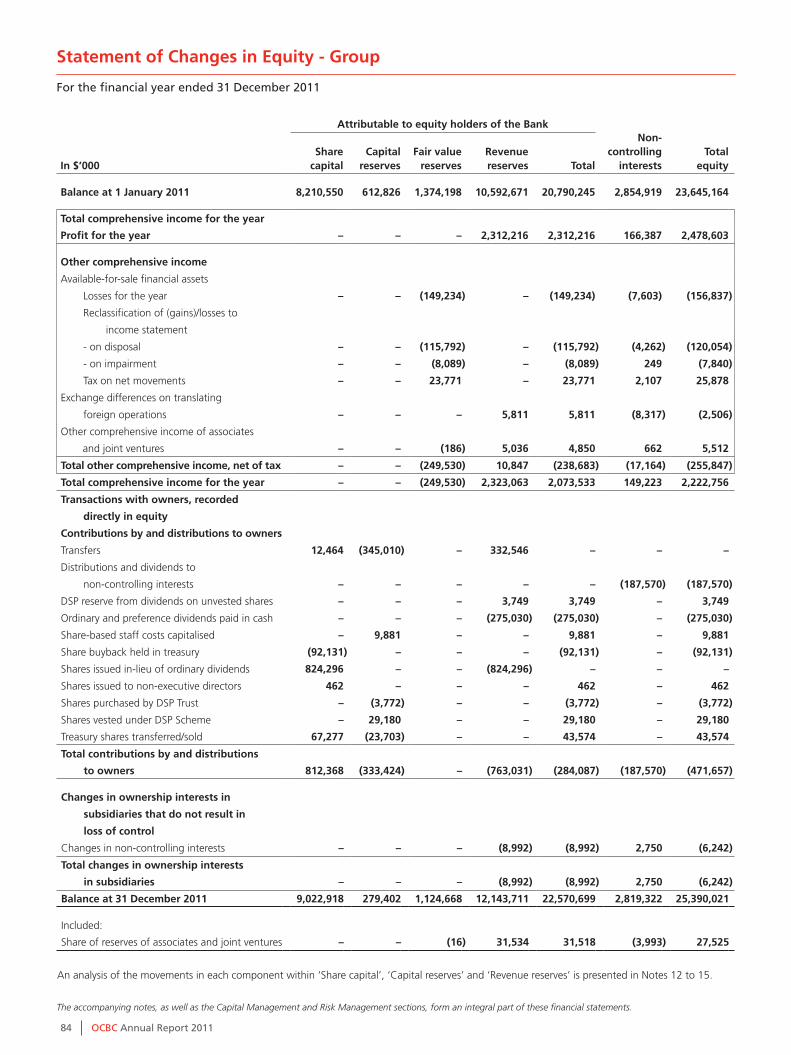
84 OCBC Annual Report 2011
Statement of Changes in Equity - Group
For the financial year ended 31 December 2011
Attributable to equity holders of the Bank
In $’000Share
capitalCapital
reservesFair value
reservesRevenuereserves Total
Non-controlling
interestsTotal
equity
Balance at 1 January 2011 8,210,550 612,826 1,374,198 10,592,671 20,790,245 2,854,919 23,645,164
Total comprehensive income for the year
Profit for the year – – – 2,312,216 2,312,216 166,387 2,478,603
Other comprehensive income
Available-for-sale financial assets
Losses for the year – – (149,234) – (149,234) (7,603) (156,837)
Reclassification of (gains)/losses to
income statement
- on disposal – – (115,792) – (115,792) (4,262) (120,054)
- on impairment – – (8,089) – (8,089) 249 (7,840)
Tax on net movements – – 23,771 – 23,771 2,107 25,878
Exchange differences on translating
foreign operations – – – 5,811 5,811 (8,317) (2,506)
Other comprehensive income of associates
and joint ventures – – (186) 5,036 4,850 662 5,512
Total other comprehensive income, net of tax – – (249,530) 10,847 (238,683) (17,164) (255,847)
Total comprehensive income for the year – – (249,530) 2,323,063 2,073,533 149,223 2,222,756
Transactions with owners, recorded
directly in equity
Contributions by and distributions to owners
Transfers 12,464 (345,010) – 332,546 – – –
Distributions and dividends to
non-controlling interests – – – – – (187,570) (187,570)
DSP reserve from dividends on unvested shares – – – 3,749 3,749 – 3,749
Ordinary and preference dividends paid in cash – – – (275,030) (275,030) – (275,030)
Share-based staff costs capitalised – 9,881 – – 9,881 – 9,881
Share buyback held in treasury (92,131) – – – (92,131) – (92,131)
Shares issued in-lieu of ordinary dividends 824,296 – – (824,296) – – –
Shares issued to non-executive directors 462 – – – 462 – 462
Shares purchased by DSP Trust – (3,772) – – (3,772) – (3,772)
Shares vested under DSP Scheme – 29,180 – – 29,180 – 29,180
Treasury shares transferred/sold 67,277 (23,703) – – 43,574 – 43,574
Total contributions by and distributions
to owners 812,368 (333,424) – (763,031) (284,087) (187,570) (471,657)
Changes in ownership interests in
subsidiaries that do not result in
loss of control
Changes in non-controlling interests – – – (8,992) (8,992) 2,750 (6,242)
Total changes in ownership interests
in subsidiaries – – – (8,992) (8,992) 2,750 (6,242)
Balance at 31 December 2011 9,022,918 279,402 1,124,668 12,143,711 22,570,699 2,819,322 25,390,021
Included:
Share of reserves of associates and joint ventures – – (16) 31,534 31,518 (3,993) 27,525
An analysis of the movements in each component within ‘Share capital’, ‘Capital reserves’ and ‘Revenue reserves’ is presented in Notes 12 to 15.
The accompanying notes, as well as the Capital Management and Risk Management sections, form an integral part of these financial statements.

85OCBC Annual Report 2011
Attributable to equity holders of the Bank
In $’000Share
capitalCapital
reservesFair value
reservesRevenuereserves Total
Non-controlling
interestsTotal
equity
Balance at 1 January 2010 7,376,252 985,445 1,506,279 9,102,681 18,970,657 2,808,378 21,779,035
Total comprehensive income for the year
Profit for the year – – – 2,253,466 2,253,466 193,461 2,446,927
Other comprehensive income
Available-for-sale financial assets
Gains for the year – – 93,734 – 93,734 25,291 119,025
Reclassification of (gains)/losses to
income statement
- on disposal – – (152,750) – (152,750) 170 (152,580)
- on impairment – – (23,670) – (23,670) 542 (23,128)
Tax on net movements – – (49,156) – (49,156) (4,648) (53,804)
Exchange differences on translating
foreign operations – – – (52,887) (52,887) (870) (53,757)
Other comprehensive income of associates
and joint ventures – – (239) (3,265) (3,504) (527) (4,031)
Total other comprehensive income, net of tax – – (132,081) (56,152) (188,233) 19,958 (168,275)
Total comprehensive income for the year – – (132,081) 2,197,314 2,065,233 213,419 2,278,652
Transactions with owners, recorded
directly in equity
Contributions by and distributions to owners
Transfers 10,004 (360,316) – 350,312 – – –
Divestment of an associate – – – 82 82 (82) –
Dividends to non-controlling interests – – – – – (132,854) (132,854)
DSP reserve from dividends on unvested shares – – – 5,786 5,786 – 5,786
Ordinary and preference dividends paid in cash – – – (279,092) (279,092) – (279,092)
Share-based staff costs capitalised – 14,116 – – 14,116 – 14,116
Share buyback held in treasury (42,260) – – – (42,260) – (42,260)
Shares issued in-lieu of ordinary dividends 757,373 – – (757,373) – – –
Shares issued to non-executive directors 541 – – – 541 – 541
Shares purchased by DSP Trust – (4,000) – – (4,000) – (4,000)
Shares vested under DSP Scheme – 8,240 – – 8,240 – 8,240
Treasury shares transferred/sold 108,640 (30,659) – – 77,981 – 77,981
Total contributions by and distributions
to owners 834,298 (372,619) – (680,285) (218,606) (132,936) (351,542)
Changes in ownership interests in
subsidiaries that do not result in
loss of control
Changes in non-controlling interests – – – (27,039) (27,039) (33,942) (60,981)
Total changes in ownership interests
in subsidiaries – – – (27,039) (27,039) (33,942) (60,981)
Balance at 31 December 2010 8,210,550 612,826 1,374,198 10,592,671 20,790,245 2,854,919 23,645,164
Included:
Share of reserves of associates and joint ventures – – 171 25,381 25,552 (3,429) 22,123
An analysis of the movements in each component within ‘Share capital’, ‘Capital reserves’ and ‘Revenue reserves’ is presented in Notes 12 to 15.
The accompanying notes, as well as the Capital Management and Risk Management sections, form an integral part of these financial statements.
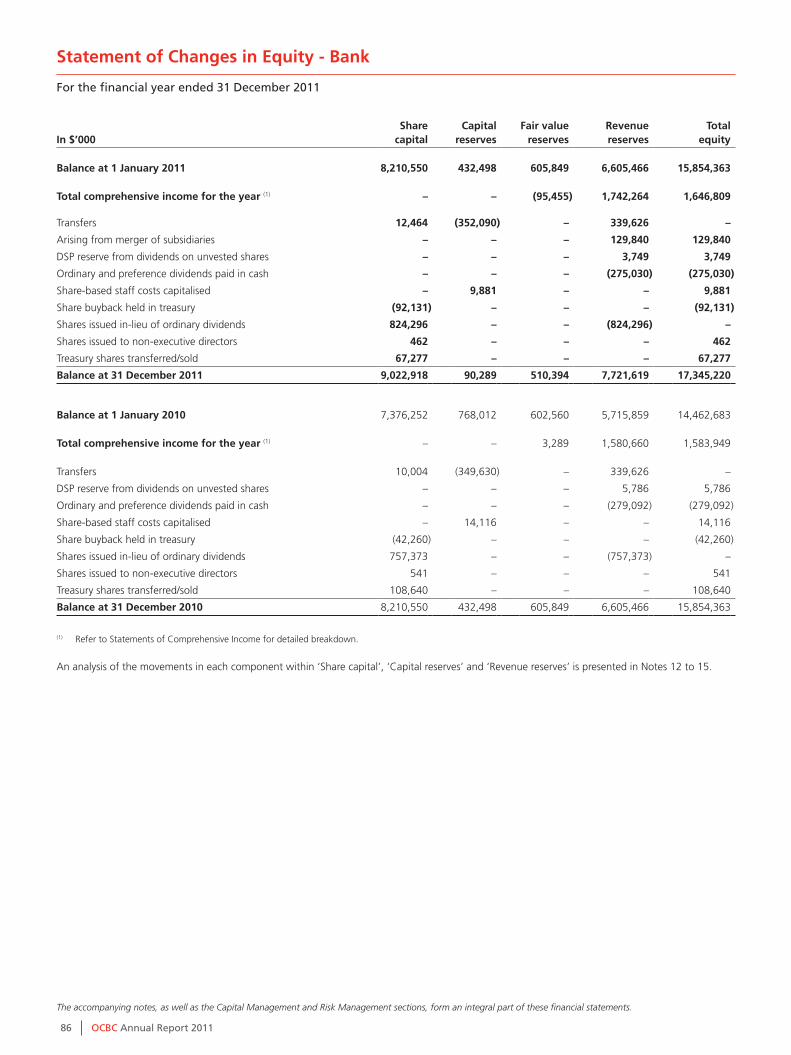
86 OCBC Annual Report 2011
Statement of Changes in Equity - Bank
For the financial year ended 31 December 2011
In $’000Share
capitalCapital
reservesFair value
reservesRevenuereserves
Total equity
Balance at 1 January 2011 8,210,550 432,498 605,849 6,605,466 15,854,363
Total comprehensive income for the year (1) – – (95,455) 1,742,264 1,646,809
Transfers 12,464 (352,090) – 339,626 –
Arising from merger of subsidiaries – – – 129,840 129,840
DSP reserve from dividends on unvested shares – – – 3,749 3,749
Ordinary and preference dividends paid in cash – – – (275,030) (275,030)
Share-based staff costs capitalised – 9,881 – – 9,881
Share buyback held in treasury (92,131) – – – (92,131)
Shares issued in-lieu of ordinary dividends 824,296 – – (824,296) –
Shares issued to non-executive directors 462 – – – 462
Treasury shares transferred/sold 67,277 – – – 67,277
Balance at 31 December 2011 9,022,918 90,289 510,394 7,721,619 17,345,220
Balance at 1 January 2010 7,376,252 768,012 602,560 5,715,859 14,462,683
Total comprehensive income for the year (1) – – 3,289 1,580,660 1,583,949
Transfers 10,004 (349,630) – 339,626 –
DSP reserve from dividends on unvested shares – – – 5,786 5,786
Ordinary and preference dividends paid in cash – – – (279,092) (279,092)
Share-based staff costs capitalised – 14,116 – – 14,116
Share buyback held in treasury (42,260) – – – (42,260)
Shares issued in-lieu of ordinary dividends 757,373 – – (757,373) –
Shares issued to non-executive directors 541 – – – 541
Treasury shares transferred/sold 108,640 – – – 108,640
Balance at 31 December 2010 8,210,550 432,498 605,849 6,605,466 15,854,363
(1) Refer to Statements of Comprehensive Income for detailed breakdown.
An analysis of the movements in each component within ‘Share capital’, ‘Capital reserves’ and ‘Revenue reserves’ is presented in Notes 12 to 15.
The accompanying notes, as well as the Capital Management and Risk Management sections, form an integral part of these financial statements.

87OCBC Annual Report 2011
In $’000 2011 2010
Cash flows from operating activitiesProfit before income tax 2,955,189 2,880,229Adjustments for non-cash items:
Allowances for loans and impairment for other assets 221,406 134,026Amortisation of intangible assets 61,337 54,799Change in fair value for hedging transactions and trading securities 69,498 (53,578)Depreciation of property, plant and equipment and investment property 166,437 151,579Net gain on disposal of government, debt and equity securities (120,054) (152,591)Net gain on disposal of property, plant and equipment and investment property (42,722) (22,902)Net gain on disposal/liquidation of subsidiaries and associates (977) (37,991)Share-based staff costs 10,223 12,295Share of results of associates and joint ventures (7,166) 2,095Items relating to life assurance fund
Surplus before income tax 531,744 703,176Surplus transferred from life assurance fund (382,528) (437,232)
Operating profit before change in operating assets and liabilities 3,462,387 3,233,905Change in operating assets and liabilities:
Deposits of non-bank customers 31,293,835 16,688,042Deposits and balances of banks 5,144,768 5,316,434Derivative payables and other liabilities 2,157,244 398,948Trading portfolio liabilities (79,213) (281,864)Government securities and treasury bills (3,115,640) 357,530Trading securities (272,069) (730,388)Placements with and loans to banks (10,659,563) (937,487)Loans and bills receivable (28,789,318) (19,526,988)Derivative receivables and other assets (1,377,593) (1,046,463)Net change in investment assets and liabilities of life assurance fund 58,894 (181,131)
Cash (used in)/from operating activities (2,176,268) 3,290,538Income tax paid (409,296) (419,487)Net cash (used in)/from operating activities (2,585,564) 2,871,051
Cash flows from investing activitiesDividends from associates 6,226 3,746Increase in associates and joint ventures (106,787) (48,615)Net cash outflow from acquisition of a business/subsidiaries (103,657) (2,002,700)Purchases of debt and equity securities (6,371,047) (6,357,410)Purchases of property, plant and equipment and investment property (250,890) (183,183)Proceeds from disposal of associates 1,776 13,853Proceeds from disposal of debt and equity securities 4,798,321 4,017,877Proceeds from disposal of interest in a subsidiary 82,006 –Proceeds from disposal of property, plant and equipment and investment property 48,606 29,393
Net cash used in investing activities (1,895,446) (4,527,039)
Cash flows from financing activitiesChanges in non-controlling interests (6,242) (64,140)Redemption of subordinated debt issued (2,466,829) –Issue of subordinated debt (1) 399,025 984,966Increase/(decrease) in other debt issued (1) 8,468,543 (588,678)Dividends paid to equity holders of the Bank (275,030) (279,092)Distributions and dividends paid to non-controlling interests (187,570) (132,854)Proceeds from treasury shares transferred/sold under the Bank’s employee share schemes 43,574 77,981Share buyback held in treasury (92,131) (42,260)
Net cash from/(used in) financing activities 5,883,340 (44,077)
Net currency translation adjustments 1,384 21,839
Net change in cash and cash equivalents 1,403,714 (1,678,226)Cash and cash equivalents at 1 January 11,492,891 13,171,117Cash and cash equivalents at 31 December 12,896,605 11,492,891
(1) Comparatives have been restated to conform to current year’s presentation.
Consolidated Cash Flow Statement
For the financial year ended 31 December 2011
The accompanying notes, as well as the Capital Management and Risk Management sections, form an integral part of these financial statements.

88 OCBC Annual Report 2011
Notes to the Financial Statements
For the financial year ended 31 December 2011
These notes form an integral part of the financial statements.
The Board of Directors of Oversea-Chinese Banking Corporation Limited authorised these financial statements for issue on 17 February 2012.
1. GENERALOversea-Chinese Banking Corporation Limited (“the Bank”) is incorporated and domiciled in Singapore and is listed on the Singapore Exchange. The address of the Bank’s registered office is 65 Chulia Street, #09-00 OCBC Centre, Singapore 049513.
The consolidated financial statements relate to the Bank and its subsidiaries (together referred to as the Group) and the Group’s interests in associates and joint ventures. The Group is principally engaged in the business of banking, life assurance, general insurance, asset management, investment holding, futures and stockbroking.
2. SUMMARY OF SIGNIFICANT ACCOUNTING POLICIES2.1 Basis of preparationThe financial statements have been prepared in accordance with Singapore Financial Reporting Standards (“FRS”) as required by the Singapore Companies Act (the “Act”) including the modification to FRS 39 Financial Instruments: Recognition and Measurement requirement on loan loss provisioning under Notice to Banks No. 612 ‘Credit Files, Grading and Provisioning’ issued by the Monetary Authority of Singapore (“MAS”).
The financial statements are presented in Singapore Dollar, rounded to the nearest thousand unless otherwise stated. The financial statements have been prepared under the historical cost convention, except as disclosed in the accounting policies below.
The preparation of financial statements in conformity with FRS requires management to exercise its judgement, use estimates and make assumptions in the application of accounting policies on the reported amounts of assets, liabilities, revenues and expenses. Although these estimates are based on management’s best knowledge of current events and actions, actual results may ultimately differ from these estimates. Critical accounting estimates and assumptions used that are significant to the financial statements, and areas involving a high degree of judgement or complexity, are disclosed in Note 2.23.
The following new/revised financial reporting standards and interpretations were applied with effect from 1 January 2011:• FRS 24 (Revised) Related Party Disclosures• INT FRS 114 (Amendments) Prepayment of a Minimum Funding
Requirement• INT FRS 119 Extinguishing Financial Liabilities with
Equity Instruments• Improvements to FRSs 2010
The revised FRS 24 requires disclosure of transactions in all direct relationships involving control, joint control or significant influence and excludes the need to disclose transactions between two entities in which a person has significant influence over one entity, and a close family member of that person has significant influence over the other entity.
The initial application of the above standards (including their consequential amendments) and interpretations does not have any material impact on the Group’s financial statements.
2.2 Basis of consolidation 2.2.1 SubsidiariesSubsidiaries are entities over which the Bank, directly or indirectly, has power to govern the financial and operating policies, generally accompanied by a shareholding of more than 50% of the voting rights. The existence and effect of potential voting rights that are presently exercisable or convertible are considered when assessing whether the Bank controls another entity.
The purchase method of accounting is used to account for the acquisition of subsidiaries. The cost of an acquisition is measured as the fair value of the assets given, equity instruments issued or liabilities incurred or assumed at the date of exchange, plus costs directly attributable to the acquisition. Identifiable assets acquired and liabilities and contingent liabilities assumed in a business combination are measured at their fair values on the date of acquisition.
Subsidiaries are consolidated from the date on which control is transferred to the Bank to the date that control ceases. In preparing the consolidated financial statements, intra-group transactions, balances and unrealised gains on transactions among group companies are eliminated. Unrealised losses are also eliminated unless the transaction provides evidence of an impairment of the asset transferred. Where necessary, adjustments are made to the financial statements of subsidiaries to ensure consistency of accounting policies within the Group.
Non-controlling interests represent the portion of net results of operations and of net assets in subsidiaries that do not belong to equity holders of the Bank. They are disclosed separately in the Group income statement and balance sheet accordingly.
2.2.2 Special purpose entitiesSpecial purpose entities (“SPE”) which are established for a narrow and well-defined objective are consolidated where the substance of the relationship indicates that the Group has control over the SPE notwithstanding that the Group holds little or no equity interest in the SPE.
2.2.3 Associates and joint ventures Associates are entities over which the Bank has significant influence, but not control, generally accompanied by a shareholding of 20% to 50% of the voting rights. Joint ventures are entities which are jointly controlled by the Group and its joint venture partners. The parties involved have entered into a contractual arrangement to undertake an economic activity and none of them unilaterally has control over the entity.
Investments in associates and joint ventures are accounted for in the consolidated financial statements using the equity method of accounting, and include goodwill identified on acquisition, where applicable. Certain entities in which the Group had total shareholdings of between 20% and 50% were excluded from equity accounting because investments in the Life Funds of Great Eastern Holdings Limited were not included in determining associates.
Equity accounting involves recording investments in associates and joint ventures initially at cost, adjusted thereafter for post-acquisition changes of the Group’s share of the net assets of the associates and joint ventures until the date the significant influence or joint control ceases. When the Group’s share of losses equals or exceeds its interests in the associates and joint ventures, including any other unsecured receivables, the Group does not recognise further losses, unless it has incurred obligations or made payments on behalf of the entities.
89OCBC Annual Report 2011
2. SUMMARY OF SIGNIFICANT ACCOUNTING POLICIES (continued)
2.2 Basis of consolidation (continued)2.2.3 Associates and joint ventures (continued)In applying the equity method of accounting, unrealised gains on transactions between the Group and its associates and joint ventures are eliminated to the extent of the Group’s interests in these entities. Unrealised losses are also eliminated unless the transaction provides evidence of an impairment of the asset transferred. Where necessary, adjustments are made to the financial statements of associates and joint ventures to ensure consistency of accounting policies with those of the Group.
The results of associates and joint ventures are taken from audited financial statements or unaudited management accounts of the entities concerned, made up to dates of not more than three months prior to the reporting date of the Group.
2.2.4 Life assurance companiesCertain subsidiaries of the Group engaged in life assurance business are structured into one or more long-term life assurance funds, and shareholders’ fund. All premiums received, investment returns, claims and expenses, and changes in liabilities to policyholders are accounted for within the related life assurance fund. Any surplus, which is determined by the appointed Actuary after taking into account these items, may either be distributed between the shareholders and the policyholders according to a predetermined formula or retained within the life assurance funds. The amount distributed to shareholders is reported as “Profit from life assurance” in the consolidated income statement.
2.2.5 Accounting for subsidiaries and associates by the BankInvestments in subsidiaries and associates are stated in the Bank’s balance sheet at cost less any impairment in value after the date of acquisition.
2.3 Currency translation 2.3.1 Foreign currency transactions Transactions in foreign currencies are recorded in the respective functional currencies of the Bank and its subsidiaries at the exchange rates prevailing on the transaction dates. Monetary items denominated in foreign currencies are translated to the respective entities’ functional currencies at the exchange rates prevailing at the balance sheet date. Exchange differences arising on settlement and translation of such items are recognised in the income statement.
Non-monetary items denominated in foreign currencies that are measured at fair value are translated at the exchange rate on the date the fair value is determined. Exchange differences on non-monetary items such as equity investments classified as available-for-sale financial assets are recognised in other comprehensive income and presented in the fair value reserve within equity.
2.3.2 Foreign operationsThe assets and liabilities of foreign operations are translated to Singapore Dollar at exchange rates prevailing at the balance sheet date. The income and expenses of foreign operations are translated to Singapore Dollar at average exchange rates for the year, which approximate the exchange rates at the dates of the transactions. Goodwill and fair value adjustments arising on the acquisition of a foreign operation on or after 1 January 2005 are treated as assets and liabilities of the foreign operation and translated at the closing rate.
Foreign currency differences arising from the translation of a foreign operation are recognised in other comprehensive income and presented in the currency translation reserve within equity. When a foreign operation is disposed, in part or in full, the relevant amount in the currency translation reserve is included in the gain or loss on disposal of the operation.
2.4 Cash and cash equivalentsIn the consolidated cash flow statement, cash and cash equivalents comprise cash on hand, balances and placements with central banks.
2.5 Financial instruments2.5.1 RecognitionThe Group initially recognises loans and advances, deposits and debts issued on the date of origination. All regular way purchases and sales of financial assets with delivery of assets within the time period established by regulation or market convention are recognised on the settlement date.
2.5.2 De-recognitionFinancial assets are de-recognised when the Group’s contractual rights to the cash flows from the financial assets expire or when the Group transfers the financial asset to another party without retaining control or transfers substantially all the risks and rewards of the asset. Financial liabilities are de-recognised when the Group’s obligations specified in the contract expire or are discharged or cancelled.
2.5.3 OffsettingFinancial assets and liabilities are offset and the net amount presented in the balance sheet when there is a legally enforceable right to offset the amounts and an intention to settle on a net basis or realise the asset and settle the liability simultaneously. Income and expenses are presented on a net basis only when permitted by the accounting standards.
2.5.4 Sale and repurchase agreements (including securities lending and borrowing)
Repurchase agreements (“repos”) are regarded as collateralised borrowing. The securities sold under repos are treated as pledged assets and remain as assets on the balance sheets. The amount borrowed is recorded as a liability. Reverse repos are treated as collateralised lending and the amount of securities purchased is included in placements with central banks, loans to banks and non-bank customers. The difference between the amount received and the amount paid under repos and reverse repos is amortised as interest expense and interest income respectively.
Securities lending and borrowing transactions are generally secured, with collateral taking the form of securities or cash. The transfer of securities to or from counterparties is not reflected on the balance sheet. Cash collateral advanced or received is recorded as an asset or a liability respectively.

90 OCBC Annual Report 2011
Notes to the Financial Statements
For the financial year ended 31 December 2011
2. SUMMARY OF SIGNIFICANT ACCOUNTING POLICIES (continued)
2.6 Non-derivative financial assetsNon-derivative financial assets are classified according to the purpose for which the assets were acquired. Management determines the classification of its financial assets at initial recognition and evaluates this designation at every reporting date.
2.6.1 Loans and receivablesLoans and receivables are non-derivative financial assets with fixed or determinable payments that are not quoted in an active market. They are initially recognised at acquisition cost and subsequently measured at amortised cost using the effective interest method,less impairment allowance.
2.6.2 Available-for-sale financial assets Available-for-sale financial assets are intended to be held for an indefinite period of time, and may be sold in response to needs for liquidity or changes in interest rates, exchange rates or market prices.
At the balance sheet date, the Group recognises unrealised gains and losses on revaluing unsettled contracts in other comprehensive income. Upon settlement, available-for-sale assets are carried at fair value (including transaction costs) on the balance sheet, with cumulative fair value changes taken to other comprehensive income and presented in fair value reserve within equity, and recognised in the income statement when the asset is disposed of, collected or otherwise sold, or when the asset is assessed to be impaired.
The fair value for quoted investments is derived from market bid prices. For unquoted securities, fair value is determined based on quotes from brokers and market makers, discounted cash flow and other valuation techniques commonly used by market participants.
2.6.3 Financial assets at fair value through profit or lossFinancial assets at fair value through profit or loss are acquired by the trading business units of the Group for the purpose of selling them in the near term.
At the balance sheet date, unrealised profits and losses on revaluing unsettled contracts are recognised in the income statement. Upon settlement, these assets are carried at fair value on the balance sheet, with subsequent fair value changes recognised in the income statement.
Fair value is derived from quoted market bid prices. All realised and unrealised gains and losses are included in net trading income in the income statement. Interest earned whilst holding trading assets is included in interest income.
2.6.4 Held-to-maturity investmentsHeld-to-maturity investments are non-derivative financial assets with fixed or determinable payments and fixed maturities that the Group’s management has the positive intention and ability to hold to maturity. These assets are carried at amortised cost using the effective interest method, less any impairment loss.
2.7 Derivative financial instrumentsAll derivative financial instruments are recognised at fair value on the balance sheet and classified as derivative receivables when their fair value is favourable and as derivative payables when their fair value is unfavourable.
The Group enters into derivative transactions for trading purposes, and the realised and unrealised gains and losses are recognised in the income statement. The Group also enters into hedging derivative transactions to manage exposures to interest rate, foreign currency and credit risks arising from its core banking activities of lending and accepting deposits. The Group applies either fair value or cash flow hedge accounting when the transactions meet the specified criteria for hedge accounting.
For qualifying fair value hedges, changes in the fair values of the derivative and of the hedged item relating to the hedged risk are recognised in the income statement. If the hedge relationship is terminated, the fair value adjustment to the hedged item continues to be reported as part of the carrying value of the asset or liability and is amortised to the income statement as a yield adjustment over the remaining maturity of the asset or liability. For fair value portfolio hedge of interest rate exposure, adjustment will be on the straight-line method if amortisation using a re-calculated effective interest rate is not practicable.
“Hedge ineffectiveness” represents the amount by which the changes in the fair value of the hedging derivative differ from changes in the fair value of the hedged item. The amount of ineffectiveness, provided it is not so great as to disqualify the entire hedge for hedge accounting, is recorded in the income statement.
For qualifying cash flow hedges, the effective portion of the change in fair value of the derivative is taken to the hedge reserve in equity. The gain or loss relating to the ineffective portion is recognised immediately in the income statement. Amounts accumulated in the hedge reserve remain in equity until the forecasted transaction is recognised in the income statement. When the forecasted transaction is no longer expected to occur, the amounts accumulated in the hedge reserve is immediately transferred to the income statement. For hedges of net investments in foreign operations which are accounted in a similar way as cash flow hedges, the gain or loss relating to the effective portion of the hedging instrument is recognised in equity and that relating to the ineffective portion is recognised in the income statement. Gains and losses accumulated in equity are transferred to income statement on disposal of the foreign operations.
2.8 Property, plant and equipment Property, plant and equipment are stated at cost less accumulated depreciation and impairment losses. The cost of an item of property, plant and equipment includes the purchase price and costs directly attributable to bringing the asset to the location and condition necessary for it to be capable of operating in the manner intended by management.
Subsequent expenditure relating to property, plant and equipment is added to the carrying amount of the asset when it is probable that future economic benefits, in excess of the standard of performance of the asset before the expenditure was made, will flow to the Group and the cost can be reliably measured. Other subsequent expenditure is recognised in the income statement during the financial year in which the expenditure is incurred.
The residual values, useful lives and depreciation methods of property, plant and equipment are reviewed and adjusted as appropriate, at each balance sheet date, to ensure that they reflect the expected economic benefits derived from these assets.

91OCBC Annual Report 2011
2. SUMMARY OF SIGNIFICANT ACCOUNTING POLICIES (continued)
2.8 Property, plant and equipment (continued)
Property, plant and equipment are depreciated on a straight-line basis over their estimated useful lives as follows: Furniture and fixtures - 5 to 10 yearsOffice equipment - 5 to 10 yearsComputers - 3 to 10 yearsRenovation - 3 to 5 yearsMotor vehicles - 5 years
Freehold land and leasehold land with leases of more than 100 years to expiry are not depreciated. Buildings and other leasehold land are depreciated over 50 years or the period of the lease, whichever is shorter.
An item of property, plant and equipment is de-recognised upon disposal or when no future economic benefit is expected from its use. Any gain or loss arising on de-recognition of the asset is included in the income statement in the year the asset is de-recognised.
2.9 Investment propertyInvestment property is property held either for rental income or for capital appreciation or for both. Investment properties, other than those held under the Group’s life assurance funds, are stated at cost less accumulated depreciation and impairment losses. Freehold land and leasehold land with leases of more than 100 years to expiry are not depreciated. Buildings and other leasehold land are depreciated over 50 years or the period of the lease, whichever is shorter.
Investment property held under the Group’s life assurance fund is stated at fair value at the balance sheet date and collectively form an asset class which is an integral part of the overall investment strategy for the asset-liability management of the life assurance business. The fair value of the investment properties is determined based on objective valuations undertaken by independent valuers at the reporting date. Changes in the carrying value resulting from revaluation are recognised in the income statement of the life assurance fund.
2.10 Goodwill and intangible assets2.10.1 Goodwill Goodwill on acquisition of subsidiaries represents the excess of the cost of acquisition over the Group’s interest in the net fair value of identifiable assets and liabilities of the acquiree. Goodwill is stated at cost less impairment loss. Impairment test is carried out annually, or when there is indication that the goodwill may be impaired.
Gains or losses on disposal of subsidiaries and associates include the carrying amount of goodwill relating to the entity sold.
2.10.2 Intangible assetsIntangible assets are separately identifiable intangible items arising from acquisitions and are stated at cost less accumulated amortisation and impairment losses. Intangible assets with finite useful lives are amortised over their estimated useful lives. The useful life of an intangible asset is reviewed at least at each financial year end.
2.11 Non-current assets held for saleNon-current assets that are expected to be recovered through sale rather than through continuing use are classified as held for sale. Immediately before classification as held for sale, the assets
are measured in accordance with the Group’s accounting policies. Thereafter generally the assets are measured at the lower of their carrying amount and fair value less cost to sell.
2.12 Impairment of assets
Financial assetsThe Group assesses at each balance sheet date whether there is objective evidence that a financial asset or a group of financial assets is impaired.
2.12.1 Loans and receivables/financial assets carried at amortised cost
Loans are assessed for impairment on a loan-by-loan basis except for homogeneous loans below a certain materiality threshold, which are grouped together according to their risk characteristics and collectively assessed, taking into account the historical loss experience on such loans.
A specific allowance is established when the present value of recoverable cash flows for a loan is lower than the carrying value of the loan. Portfolio allowances are set aside for unimpaired loans based on portfolio and country risks, as well as industry practices.
Specific allowances are written back to the income statement when the loans are no longer impaired or when the loss on loan is determined to be less than the amount of specific allowance previously made. Loans are written-off when recovery action has been instituted and the loss can be reasonably determined. 2.12.2 Other non-derivative financial assetsImpairment of other non-derivative financial assets is calculated as the difference between the asset’s carrying value and the estimated recoverable amount. For equity investments classified as available-for-sale, when there is a significant or prolonged decline in the fair value of the asset below its cost, the cumulative loss (measured as the difference between the acquisition cost and the current fair value, less any impairment loss on that asset previously recognised in the income statement) is removed from the fair value reserve within equity and recognised in the income statement.
Impairment losses on equity investments recognised in the income statement are not reversed through the income statement, until the investments are disposed of. For debt investments, reversal of impairment loss is recognised in the income statement.
Other assets2.12.3 GoodwillFor the purpose of impairment testing, goodwill is allocated to each of the Group’s Cash Generating Units (“CGU”) expected to benefit from synergies of the business combination. The Group’s CGUs correspond with the business segments identified in the primary segment report.
An impairment loss is recognised in the income statement when the carrying amount of the CGU, including the goodwill, exceeds the recoverable amount of the CGU. The CGU’s recoverable amount is the higher of its fair value less cost to sell and its value in use. Impairment loss on goodwill cannot be reversed in subsequent periods.

92 OCBC Annual Report 2011
2. SUMMARY OF SIGNIFICANT ACCOUNTING POLICIES (continued)
2.12 Impairment of assets (continued)2.12.4 Investments in subsidiaries and associates Property, plant and equipment Investment property Intangible assetsInvestments in subsidiaries and associates, property, plant and equipment, investment property and intangible assets, are reviewed for impairment on the balance sheet date or whenever there is any indication that the carrying value of an asset may not be recoverable. If such an indication exists, the carrying value of the asset is written down to its recoverable amount (i.e. the higher of the fair value less cost to sell and the value in use).
The impairment loss is recognised in the income statement, and is reversed only if there has been a change in the estimates used to determine the asset’s recoverable amount since the last impairment loss was recognised. The carrying amount of an asset is increased to its revised recoverable amount, provided that this amount does not exceed the carrying value that would have been determined (net of amortisation or depreciation) had no impairment loss been recognised for the asset in prior years.
2.13 Insurance receivablesInsurance receivables are recognised when due. They are measured at initial recognition at the fair value received or receivable. Subsequent to initial recognition, insurance receivables are measured at amortised cost, using the effective interest method. The carrying value of insurance receivables is reviewed for impairment whenever events or circumstances indicate that the carrying amount may not be recoverable, with the impairment loss recognised in the income statement. Insurance receivables are derecognised when the derecognition criteria for financial assets have been met.
2.14 Financial liabilitiesFinancial liabilities are initially recognised at fair value plus transaction costs, and are subsequently measured at amortised cost using the effective interest method, except when the liabilities are held at fair value through profit or loss. Financial liabilities are held at fair value through the income statement when:(a) they are acquired or incurred for the purpose of selling or
repurchasing in the near term;(b) the designation eliminates or significantly reduces measurement
or recognition inconsistencies that would otherwise arise from measuring financial liabilities or recognising gains or losses on them; or
(c) the financial liability contains an embedded derivative that would need to be separately recorded.
2.15 Provisions and other liabilitiesProvisions are recognised when there is a present legal or constructive obligation as a result of past events, it is probable that an outflow of resources will be required to settle the obligation, and a reliable estimate of the amount can be made. Where a provision is expected to be reimbursed, for example under an insurance contract, the reimbursement is recognised as a separate asset only when it is virtually certain that reimbursement will be received.
Provision for insurance agents’ retirement benefits, including deferred benefits, is calculated according to terms and conditions stipulated in the respective Life Assurance Sales Representative’s Agreements. The deferred/retirement benefit accumulated at the balance sheet date includes accrued interest.
Policy benefits are recognised when a policyholder exercises the option to deposit the survival benefits with the life assurance subsidiaries after the benefit falls due. Policy benefits are interest bearing at rates adjusted from time to time by the life assurance subsidiaries. Interest payable on policy benefits is recognised in the income statements as incurred.
2.16 Insurance contractsInsurance contracts are those contracts where the Group, mainly the insurance subsidiaries of Great Eastern Holdings Limited (“GEH”), has accepted significant insurance risk from another party (the policyholders) by agreeing to compensate the policyholders if a specified uncertain future event (the insured event) adversely affects the policyholders. As a general guideline, the Group determines whether it has significant insurance risk, by comparing benefits paid with benefits payable if the insured event did not occur. Insurance contracts can also transfer financial risk.
Once a contract has been classified as an insurance contract, it remains an insurance contract for the remainder of its lifetime, even if the insurance risk reduces significantly during this period, unless all rights and obligations are extinguished or expire.
For the purpose of FRS 104, the Group adopts maximum policy benefits as the proxy for insurance risk and cash surrender value as the proxy for realisable value of the insurance contract on surrender. The Group defines insurance risk to be significant when the ratio of the insurance risk over the deposit component is not less than 105% of the deposit component at any point of the insurance contract in force. Based on this definition, all policy contracts issued by insurance subsidiaries within the Group are considered insurance contracts as at the balance sheet date.
Certain subsidiaries within the Group, primarily Great Eastern Holdings Limited and its subsidiaries (“GEH Group”), write insurance contracts in accordance with insurance regulations prevailing in their respective jurisdictions. Disclosures on the various insurance contract liabilities are classified into the principal components, as follows:(a) Life Assurance Fund contract liabilities, comprising • ParticipatingFundcontractliabilities; • Non-participatingFundcontractliabilities;and • Investment-linkedFundcontractliabilities.(b) General Insurance Fund contract liabilities(c) Reinsurance contracts
The Group does not adopt a policy of deferring acquisition costs for its insurance contracts.
Notes to the Financial Statements
For the financial year ended 31 December 2011
93OCBC Annual Report 2011
2. SUMMARY OF SIGNIFICANT ACCOUNTING POLICIES (continued)
2.16 Insurance contracts (continued)
Life Assurance Fund contract liabilitiesInsurance contracts are recognised and measured in accordance with the terms and conditions of the respective contracts and are based on guidelines laid down by the respective insurance regulations. Premiums, claims and benefit payments, acquisition and management expenses and valuation of future policy benefit payments or premium reserves as the case may be, are recognised in the income statements of the respective insurance funds.
Life insurance liabilities are recognised when contracts are entered into and premiums are charged. These liabilities are measured by using the gross premium valuation method. The liability is determined as the sum of the present value of future guaranteed and, in the case of a participating policy, appropriate level of future gross considerations arising from the policy discounted at the appropriate discount rate. The liability is based on best estimate assumptions and with due regard to significant recent experience. An appropriate risk margin allowance for adverse deviation from expected experience is made in the valuation of non-participating life policies, the guaranteed benefit liabilities of participating life policies and liabilities of non-unit investment-linked policies.
The liability in respect of a participating insurance contract is taken at the higher of the guaranteed benefit liabilities or the total benefit liabilities at the contract level derived as stated above.
In the case of life policies where part of, or all the premiums are accumulated in a fund, the accumulated amount, as declared to policyholders are shown as liabilities if the accumulated amounts are higher than the amounts as calculated using the gross premium valuation method.
In the case of short-term life policies covering contingencies other than death or survival, the liability for such life insurance contracts comprises the provision for unearned premiums and unexpired risks, as well as for claims outstanding, which includes an estimate of the incurred claims that have not yet been reported to the Group.
Adjustments to liabilities at each reporting date are recorded in the respective income statements. Profits originating from margins of adverse deviations on run-off contracts are recognised in the income statements over the lives of the contracts, whereas losses are fully recognised in income statements during the first year of run-off.
The liability is extinguished when the contract expires, is discharged or is cancelled.
The Group issues a variety of short and long duration insurance contracts which transfer risks from the policyholders to the Group to protect policyholders from the consequences of insured events such as death, disability, illness, accident, including survival. These contracts may transfer both insurance and investment risk or insurance risk alone, from the policyholders to the Group.
For non-participating policy contracts, both insurance and investment risks are transferred from policyholders to the Group. For non-participating policy contracts other than medical insurance policy contracts, the payout to policyholders upon the occurrence of the insured event is pre-determined and the transfer of risk is absolute.
For medical insurance policy contracts, the payout is dependent on the actual medical costs incurred upon the occurrence of the insured event.
Contracts which transfer insurance risk alone from policyholders to the Group are commonly known as investment-linked policies. As part of the pricing for these contracts, the insurance subsidiaries within the Group would include certain charges and fees to cover for expenses and insured risk. The net investment returns derived from the variety of investment funds as selected by the policyholder accrue directly to the policyholder.
A significant portion of insurance contracts issued by subsidiaries within the Group contain discretionary participating features. These contracts are classified as participating policies. In addition to guaranteed benefits payable upon insured events associated with human life such as death or disability, the contracts entitle the policyholder to receive benefits, which could vary according to the investment performance of the fund. The Group does not recognise the guaranteed components separately from the discretionary participation features.
The valuation of insurance contract liabilities is determined according to:(a) Singapore Insurance Act (Chapter 142), Insurance (Valuation
and Capital) Regulations 2004 for insurance funds regulated in Singapore; and
(b) Malaysia Insurance Act and Regulations 1996 and Risk-based Capital Framework for Insurers for insurance funds regulated in Malaysia.
Each insurance subsidiary within the Group is required under the respective insurance regulations to carry out a liability adequacy test using current estimates of future cash flows under its insurance contracts; the process is referred to as the gross premium valuation or bonus reserve valuation, depending on the jurisdiction in which the insurance subsidiary operates.
The liability adequacy test is applied to both the guaranteed benefits and the discretionary participation features; the assumptions are based on best estimates, as prescribed by the insurance regulations of the respective jurisdictions in which the insurance subsidiary operates. The Group performs liability adequacy tests on its actuarial reserves to ensure that the carrying amount of provisions is sufficient to cover estimated future cash flows. When performing the liability adequacy test, the Group discounts all contractual cash flows and compares this amount to the carrying value of the liability. Any deficiency is charged to the income statement.
The Group issues investment-linked contracts as insurance contracts which insure human life events such as death or survival over a long duration; coupled with an embedded derivative linking death benefit payments on the contract to the value of a pool of investments within the investment-linked fund set up by the insurance subsidiary. As this embedded derivative meets the definition of insurance contract, it need not be separately accounted for from the host insurance contract. The liability valuation for such contracts is adjusted for changes in the fair value of the underlying assets at frequencies as stated under the terms and conditions of the insurance contracts.

94 OCBC Annual Report 2011
Notes to the Financial Statements
For the financial year ended 31 December 2011
2. SUMMARY OF SIGNIFICANT ACCOUNTING POLICIES (continued)
2.16 Insurance contracts (continued)The table below provides the key underlying assumptions used for valuation of life insurance contract liabilities.
Singapore Malaysia
Valuation method (1) Gross premium valuation
For Participating Fund, the method that produces the higher reserves of:
(i) Total assets backing policy benefits;
(ii) Guaranteed and non-guaranteed cashflows discounted at 5.25%; and
(iii) Guaranteed cashflows discounted using the interest rate outlined under (i) below.
Gross premium valuation
For Participating Fund, the method that produces the higher reserves of:
(i) Net fund based yield of 5.52% for total benefits (i.e. guaranteed and non-guaranteed cashflows); and
(ii) For guaranteed cashflows, Malaysia Government Securities (“MGS”) zero coupon spot yields (as outlined below).
Interest rate (1) (2) (i) Singapore Government Securities (“SGS”) zero coupon spot yields for cash flows up to year 10, an interpolation of the 10-year Singapore Government Securities zero coupon spot yield and the Long Term Risk Free Discount Rate (“LTRFDR”) for cash flows between 10 to 15 years, and the LTRFDR for cash flows year 15 and after.
(ii) For the fair value hedge portfolio, Singapore Government Securities zero coupon spot yields for cash flows up to year 20, the 20-year rate for cash flows beyond 20 years. Interpolation for years where rates are unavailable.
Data source: MAS website and Bloomberg
Malaysia Government Securities yields determined based on the following:
(i) For cashflows with duration less than 15 years, Malaysia Government Securities zero coupon spot yields of matching duration.
(ii) For cashflows with duration 15 years or more, Malaysia Government Securities zero coupon spot yields of 15 years to maturity.
Data source: Bond Pricing Agency Malaysia
Mortality, Disability,
Dread disease, Expenses, Lapse and surrenders (1)
Best estimates plus provision for adverse deviation (“PADs”).
Data source: Internal experience studies
Participating Fund, the method that produces the higher reserves of:
(i) Best estimates for total benefits (i.e. guaranteed and non-guaranteed cashflows); and
(ii) Best estimates plus provision for risk of adverse deviation (“PRADs”) for guaranteed cashflows only.
Non-participating and Non-unit reserves of Investment-linked Fund: Best estimates plus PRADs.
Data source: Internal experience studies
(1) Refer to Note 2.23 on Critical accounting estimates and judgements.(2) With effect from 1 July 2011, GEH Group changed the discount rates used in valuing part of its liabilities in its Singapore insurance funds, from SGS yields to
zero-coupon SGS yields. The use of zero-coupon SGS yields enables closer matching in valuation between assets and liabilities, and is in compliance with regulations.

95OCBC Annual Report 2011
2. SUMMARY OF SIGNIFICANT ACCOUNTING POLICIES (continued)
2.16 Insurance contracts (continued)
General Insurance Fund contract liabilitiesThe Group issues short term property and casualty contracts which protect the policyholders against the risk of loss of property premises due to fire or theft in the form of fire or burglary insurance contract and/or business interruption contract; risk of liability to pay compensation to a third party for bodily harm or property damage in the form of public liability insurance contract. The Group also issues short term medical and personal accident general insurance contracts.
General insurance contract liabilities include liabilities for outstanding claims and unearned premiums.
Outstanding claims provision are based on the estimated ultimate cost of all claims incurred but not settled at the balance sheet date, whether reported or not, together with related claims handling costs and reduction for the expected value of salvage and other receivables. Delays can be experienced in the notification and settlement of certain types of claims, therefore, the ultimate cost of these claims cannot be known with certainty at the balance sheet date. The liabilities are calculated at the reporting date using a range of standard actuarial projection techniques based on empirical data and the current assumptions that may include a margin for adverse deviation. The liabilities are not discounted for the time value of money. No provision for equalisation or catastrophe reserves is recognised. The liabilities are derecognised when the contracts expire, are discharged or are cancelled.
The provision for unearned premiums represents premiums received for risks that have not yet expired at the reporting date. The provision is recognised when contracts are entered into and premiums are charged. The provision is released over the term of the contract and is recognised as premium income.
The valuation of general insurance contract liabilities at the balance sheet date is based on best estimates of the ultimate settlement cost of claims plus a provision for adverse deviation. For Singapore, as required by the local insurance regulations, the provision for adverse deviation is set at 75 per cent sufficiency. For Singapore, the valuation methods used include the Paid Claim Development Method, the Incurred Claim Development Method, the Bornhuetter-Ferguson Method, the Mack’s Method and the Expected Loss Ratio Method. For Malaysia, the Link Ratio Method is used.
Reinsurance contractsThe Group cedes insurance risk in the normal course of business for all of its businesses. Reinsurance assets represent balances due from reinsurers. These amounts are estimated in a manner consistent with the outstanding claims provision or settled claims associated with the reinsurer’s policies and are in accordance with the related reinsurance contract.
Reinsurance assets are reviewed for impairment at each reporting date or more frequently when an indication of impairment arises during the financial year. Impairment occurs when there is objective evidence as a result of an event that occurred after initial recognition of the reinsurance asset that the Group may not receive part or all outstanding amounts due under the terms of the contract. The impairment loss is recorded in the income statements. Gains or losses on reinsurance are recognised in the income statements immediately at the date of contract and are not amortised. Ceded reinsurance arrangements do not relieve the Group from its obligations to policyholders.
The Group also assumes reinsurance risk in the normal course of business for life insurance and non-life insurance contracts where applicable. Premiums and claims on assumed reinsurance are recognised as revenue or expenses in the same manner as they would be if the reinsurance were considered direct business, taking into account the product classification of the reinsured business. Reinsurance liabilities represent balances due to reinsurance companies. Amounts payable are estimated in a manner consistent with the related reinsurance contract. Premiums and claims are presented on a gross basis for both ceded and assumed reinsurance. Reinsurance assets or liabilities are derecognised when the contractual rights are extinguished or expire or when the contract is transferred to another party.
2.17 Unexpired risk reserveThe Unexpired Risk Reserve (“URR”) represents the unearned portion of written premiums of general insurance policies, gross of commission payable to intermediaries attributable to periods after the balance sheet date. The change in provision for unearned premium is taken to the income statements in the order that revenue is recognised over the period of the risk exposure. Further provisions are made for claims anticipated under unexpired insurance contracts which may exceed the unearned premiums and the premiums due in respect of these contracts.
URR is computed using the 1/24th method and is reduced by the corresponding percentage of gross direct business, commissions and agency related expenses not exceeding limits specified by regulators in the respective jurisdictions in which the insurance entity operates.
2.18 Share capital and dividendOrdinary shares, non-voting non-convertible and non-voting redeemable convertible preference shares with discretionary dividends are classified as equity on the balance sheet.
Where share capital recognised as equity is repurchased (treasury shares), the amount of the consideration paid, including directly attributable costs, is presented as a deduction from equity. Treasury shares which are subsequently reissued, sold or cancelled, are recognised as changes in equity.
Interim dividends on ordinary shares and dividends on preference shares are recorded in the year in which they are declared payable by the Board of Directors. Final dividends are recorded in the year when the dividends are approved by shareholders at the annual general meeting.
2.19 Recognition of income and expense2.19.1 Interest income and expenseInterest income and expense are recognised in the income statement using the effective interest method. The effective interest rate is the rate that discounts estimated future cash payments or receipts through the expected life of the financial instruments or, when appropriate, a shorter period to the net carrying amount. When calculating the effective interest rate, significant fees and transaction costs integral to the effective interest rate, as well as premiums or discounts, are considered.
For impaired financial assets, interest income is recognised on the carrying amount based on the original effective interest rate of the financial asset.

96 OCBC Annual Report 2011
Notes to the Financial Statements
For the financial year ended 31 December 2011
2. SUMMARY OF SIGNIFICANT ACCOUNTING POLICIES (continued)
2.19 Recognition of income and expense (continued)2.19.2 Profit from life assuranceProfit from life assurance business derived from the insurance funds is categorised as follows:
(a) Participating Fund Profits to shareholders from the participating fund are allocated
from the surplus or surplus capital, based on the results of the annual actuarial valuation (such valuation also determines the liabilities relating to all the policyholders’ benefits of the participating fund). Parameters for the valuation are set out in the insurance regulations governing the Group’s insurance subsidiaries in the respective jurisdictions in which they operate. The provisions in the Articles of Association of the Group’s insurance subsidiaries are applied in conjunction with the prescriptions in the respective insurance regulations, such that the distribution for any year to policyholders of the participating fund and shareholders approximate 90% and 10% respectively of total distribution from the participating fund. The annual declaration of the quantum of policyholders’ bonus and correspondingly the profits to shareholders to be distributed out of the participating fund are approved by the Board of Directors of each insurance subsidiary on the advice of the Appointed Actuary of the respective subsidiary, in accordance with the Insurance Regulations and the Articles of Association of the respective subsidiary.
(b) Non-participating Fund Revenue consists of premiums, interest and investment income;
including changes in the fair value of certain assets as prescribed by the appropriate insurance regulations. Expenses include reinsurance costs, acquisition costs, benefit payments and management expenses. Profit or loss from the non-participating fund is determined from the revenue, expenses, and the annual actuarial valuation of the non-participating fund liabilities in accordance with the requirements of the insurance regulations of the respective jurisdictions in which the insurance subsidiaries operate. In addition, profit transfers from the Singapore and Malaysia non-participating funds include changes in the fair value of assets measured in accordance with the respective insurance regulations.
(c) Investment-linked Fund Revenue comprises bid-ask spread, fees for mortality and other
insured events, asset management, policy administration and surrender charges. Expenses include reinsurance costs, acquisition costs, benefit payments and management expenses. Profit is derived from revenue net of expenses and provision for the annual actuarial valuation of liabilities in accordance with the requirements of the insurance regulations, in respect of the non-unit-linked part of the fund.
Recurring premiums from policyholders are recognised as revenue on their respective payment due dates. Single premiums are recognised on the date on which the policies are effective. Premiums from the investment-linked business are recognised as revenue when payment is received.
2.19.3 Premium income from general insurancePremiums from the general insurance business are recognised as revenue upon commencement of insurance cover. Premiums pertaining to periods after the balance sheet date are adjusted through the unexpired risk reserve (Note 2.17). Commission is recognised as an expense when incurred, typically upon the risk underwritten as reflected in the premium recognised.
Premiums ceded out and the corresponding commission income from general insurance contracts are recognised in the income statement upon receipt of acceptance confirmation from the ceding company or in accordance with provisions incorporated in the treaty contracts. Premiums ceded out pertaining to periods after the balance sheet date are adjusted through the movement in unexpired risk reserve.
2.19.4 Fees and commissionsThe Group earns fees and commissions from a range of services rendered to its customers. Fees and commissions are generally recognised upon the completion of a transaction. For services provided over a period of time or credit risk undertaken, fees and commissions are amortised over the relevant period. Expenses are netted off against gross fees and commissions in the income statement.
2.19.5 DividendsDividends from available-for-sale securities, subsidiaries and associates are recognised when the right to receive payment is established. Dividends from trading securities are recognised when received.
2.19.6 Rental Rental income on tenanted areas of the buildings owned by the Group is recognised on an accrual basis in accordance with the substance of the tenancy agreements.
2.19.7 Employee benefits The Group’s compensation package for staff consists of base salaries, allowances, defined contribution plans such as the Central Provident Fund, commissions, cash bonuses, and share-based compensation plans. These are recognised in the income statement when incurred. Employee leave entitlements are estimated according to the terms of employment contract and accrued on the balance sheet date.
Share-based compensation plans include the Bank’s Share Option Schemes, the Employee Share Purchase Plan (“ESP Plan”) and the Deferred Share Plan (“DSP”). Equity instruments granted are recognised as expense in the income statement based on the fair value of the equity instrument at the date of the grant. The expense is recognised over the vesting period of the grant, with corresponding entries to equity.
At each balance sheet date, the Group revises its estimates of the number of equity instruments expected to be vested, and the impact of the change to the original estimates, if any, is recognised in the income statement, with a corresponding adjustment to equity over the remaining vesting period.
The Group accrues for interest on the monthly contributions made by employees to the savings-based ESP Plan. For the DSP, a trust is set up to administer the shares. The DSP Trust is consolidated in the Group’s financial statements.
Proceeds received upon the exercise of options and acquisition rights, net of any directly attributable transaction costs, are credited to share capital.

97OCBC Annual Report 2011
2. SUMMARY OF SIGNIFICANT ACCOUNTING POLICIES (continued)
2.19 Recognition of income and expense (continued)2.19.7 Employee benefits (continued)Government grants – Jobs credit schemeGrants from the government are recognised as a receivable at their fair value when there is reasonable assurance that the grant will be received and the Group will comply with all the attached conditions.
Government grants receivable are recognised as an offset against the expenses over the periods which they are intended to compensate, on a systematic basis.
The Jobs credit scheme is a cash grant introduced in the Singapore Budget 2009 to help businesses preserve jobs in the economic downturn. The scheme ended on 30 June 2010. 2.19.8 Lease payments Payments made under operating leases (net of any incentives received from the lessor) are taken to the income statement on a straight-line basis over the term of the lease. When a lease is terminated before its expiry, any payment required to be made to the lessor by way of penalty is recognised as an expense in the period when the termination takes place.
Minimum lease payments made under finance leases are apportioned between the finance expense and the reduction of the outstanding liability. The expense is allocated to each period over the lease term so as to produce a constant periodic rate of interest on the remaining balance of the liability.
2.20 Income tax expenseIncome tax expense is recognised in the income statement except to the extent that it relates to items recognised directly in equity, in which case it is recognised in equity or in other comprehensive income.
Current tax is the expected tax payable on the taxable income for the year, using tax rates enacted or substantively enacted at the reporting date, and any adjustment to tax payable in respect of previous years.
Deferred tax is recognised using the balance sheet method, on temporary differences between the carrying amounts of assets and liabilities for financial reporting purposes and the amounts used for tax computation. Deferred tax is not recognised for the following temporary differences: the initial recognition of goodwill, the initial recognition of assets or liabilities in a transaction that is not a business combination and that does not affect accounting or taxable profit, and differences relating to investments in subsidiaries, associates and joint ventures to the extent that they probably will not reverse in the foreseeable future. Deferred tax is measured at the tax rates that are expected to be applied to the temporary differences when they reverse, based on the laws that have been enacted or substantively enacted by the reporting date.
A deferred tax asset is recognised to the extent that it is probable that future taxable profits will be available for utilisation against the temporary differences. Deferred tax assets are reviewed at each reporting date and are reduced to the extent that it is no longer probable that the related tax benefit will be realised.
2.21 Fiduciary activitiesThe Group acts as trustees and in other fiduciary capacities that result in the holding or placing of assets on behalf of individuals, trusts, retirement benefit plans and other institutions. The assets and income from these assets do not belong to the Group, and are therefore excluded from these financial statements.
2.22 Segment reportingThe Group’s business segments represent the key customer and product groups, as follows: Global Consumer Financial Services, Global Corporate Banking, Global Treasury, Insurance and Others. In determining the segment results, balance sheet items are internally transfer priced and revenues and expenses are attributed to each segment based on internal management reporting policies. Transactions between business segments are recorded within the segment as if they are third party transactions and are eliminated on consolidation.
A geographical segment engages in providing products and services within a particular economic environment that is subject to different risks from those of other economic environments. Geographical segment information is prepared based on the country in which the transactions are booked and presented after elimination of intra-group transactions and balances.
2.23 Critical accounting estimates and judgementsCertain estimates are made in the preparation of the financial statements. These often require management judgement in determining the appropriate methodology for valuation of assets and liabilities. A brief description of the Group’s critical accounting estimates is set out below.
2.23.1 Liabilities of insurance businessThe estimation of the ultimate liabilities arising from claims made under life and general insurance contracts is one of the Group’s critical accounting estimates. There are several sources of uncertainty that need to be considered in the estimation of the liabilities that the Group will ultimately be required to pay as claims.
For life insurance contracts, estimates are made for future deaths, disabilities, lapses, voluntary terminations, investment returns and administration expenses. The Group relies on standard industry reinsurance and national mortality tables which represent historical mortality experience, and makes appropriate adjustments for its respective risk exposures in deriving the mortality and morbidity estimates. These estimates provide the basis in the valuation of the future benefits to be paid to policyholders, and ensure adequate provision of reserves which are monitored against current and future premiums. For those contracts that insure risk on longevity and disability, estimates are made based on recent past experience and emerging trends. Epidemics and changing patterns of lifestyle could result in significant changes to the expected future exposures.
At each balance sheet date, these estimates are assessed for adequacy and changes will be reflected as adjustments to the insurance fund contract liabilities.
For general insurance contracts, estimates have to be made for both the expected ultimate cost of claims reported at the balance sheet date and for the expected ultimate cost of claims incurred but not yet reported at the balance sheet date (“IBNR”).

98 OCBC Annual Report 2011
2. SUMMARY OF SIGNIFICANT ACCOUNTING POLICIES (continued)
2.23 Critical accounting estimates and judgements (continued)
2.23.1 Liabilities of insurance business (continued)It can take a significant time before the ultimate claims costs can be established with certainty and for some type of policies, IBNR claims form the majority of the balance sheet liability. The ultimate cost of outstanding claims is estimated using a range of standard actuarial claims projection techniques such as Chain Ladder and Bornhuetter-Ferguson methods.
The main assumption underlying these techniques is that a company’s past development experience can be used to project future claims development and hence, ultimate claim costs. As such, these methods extrapolate the development of paid and incurred losses, average costs per claim and claim numbers based on the observed development of earlier years and expected loss ratios. Historical claims development is mainly analysed by accident years but can also be further analysed by significant business lines and claims type. Large claims are usually separately addressed, either by being reserved at the face of loss adjustor estimates or separately projected in order to reflect their future development. In most cases, no explicit assumptions are made regarding future rates of claims inflation or loss ratios. Additional qualitative judgement is used to assess the extent to which past trends may not apply in future, (for example, to reflect one-off occurrences, changes in external or market factors, economic conditions as well as internal factors such as portfolio mix, policy features and claims handling procedures) in order to arrive at the estimated ultimate cost of claims that present the likely outcome from the range of possible outcomes, taking account of all uncertainties involved.
2.23.2 Impairment of goodwill and intangible assetsThe Group performs an annual review of the carrying value of its goodwill and intangible assets, against the recoverable amounts of the CGU to which the goodwill and intangible assets have been allocated. Recoverable amounts of CGUs are determined based on the present value of estimated future cash flows expected to arise from the respective CGUs’ continuing operations. Management exercises its judgement in estimating the future cash flows, growth rates and discount rates used in computing the recoverable amounts of the CGUs.
2.23.3 Fair value estimationFair value is derived from quoted market prices or valuation techniques which refer to observable market data. The fair values of financial instruments that are not traded in an active market (for example, over-the-counter derivatives) are determined by using valuation techniques. Where unobservable data inputs have a significant impact on the value obtained from the valuation model, such a financial instrument is initially recognised at the transaction price, which is the best indicator of fair value. The difference between the transaction price and the model value, commonly referred to as “day one profit and loss” is not recognised immediately in the income statement.
Notes to the Financial Statements
For the financial year ended 31 December 2011
The timing of recognition of deferred day one profit and loss is determined individually. It is amortised over the life of the transaction, released when the instrument’s fair value can be determined using market observable inputs, or when the transaction is derecognised.
2.23.4 Income taxesThe Group is subject to income taxes in several jurisdictions. Significant judgement is required in determining the capital allowances and deductibility of certain expenses in estimating the provision for income taxes. There are many transactions and calculations for which the ultimate tax determination is uncertain during the ordinary course of business. The Group recognises liabilities for anticipated tax issues based on estimates of whether additional taxes will be due. Where the final tax outcome of these matters is different from the amounts that were initially recorded, such differences will impact the income tax and deferred tax provisions in the period in which the determination is made.
2.23.5 Impairment of loansThe Group assesses impairment of loans by calculating the present value of future recoverable cash flows and the fair value of the underlying collaterals, which is determined based on credit assessment on a loan-by-loan basis. Homogeneous loans below a materiality threshold are grouped together according to their risk characteristics and collectively assessed taking into account the historical loss experience on such loans. The portfolio allowances set aside for unimpaired loans are based on management’s credit experiences and judgement, taking into account geographical and industry factors. A minimum 1% portfolio allowance is maintained by the Group in accordance with the transitional arrangement set out in MAS Notice 612. The assumptions and judgements used by management may affect these allowances.
2.23.6 Impairment of available-for-sale financial assetsThe Group follows the guidance of FRS 39 in determining when an investment is impaired. This determination requires significant judgement. The Group evaluates, among other factors, the duration and extent to which the fair value of an investment is less than its cost; and the financial health and near-term business outlook of the investee, including factors such as industry and sector performance, changes in technology and operational and financial cash flow.
2.23.7 Insurance contract classificationContracts are classified as insurance contracts where they transfer significant insurance risk from the policyholder to the Group. The Group exercises judgement about the level of insurance risk transferred. The level of insurance risk is assessed by considering whether the Group is required to pay significant additional benefits in excess of amounts payable when the insured event occurs. These additional benefits include claims liability and assessment costs, but exclude the loss of the ability to charge the policyholder for future services. The assessment covers the whole of the expected term of the contract where such additional benefits could be payable. Some contracts contain options for the policyholder to purchase insurance risk protection at a later date, these insurance risks are deemed not significant.

99OCBC Annual Report 2011
3. NET INTEREST INCOME
GROUP BANK2011$’000
2010$’000
2011$’000
2010$’000
Interest income
Loans to non-bank customers 3,675,623 3,201,347 2,088,708 1,853,863
Placements with and loans to banks 849,715 423,459 434,879 221,092
Other interest-earning assets 794,653 738,454 546,159 510,547
5,319,991 4,363,260 3,069,746 2,585,502
Interest expense
Deposits of non-bank customers (1,443,436) (1,060,954) (603,593) (449,910)
Deposits and balances of banks (186,713) (102,894) (150,485) (65,418)
Other borrowings (279,420) (252,533) (299,523) (304,998)
(1,909,569) (1,416,381) (1,053,601) (820,326)
Analysed by classification of financial instruments
Income – Assets not at fair value through profit or loss 5,131,372 4,152,750 2,910,895 2,434,654
Income – Assets at fair value through profit or loss 188,619 210,510 158,851 150,848
Expense – Liabilities not at fair value through profit or loss (1,862,086) (1,355,295) (1,006,118) (759,919)
Expense – Liabilities at fair value through profit or loss (47,483) (61,086) (47,483) (60,407)
Net interest income 3,410,422 2,946,879 2,016,145 1,765,176
Included in interest income were interest on impaired assets of $6.7 million (2010: $15.1 million) and $2.5 million (2010: $5.1 million) for the Group and Bank respectively.
4. PROFIT FROM LIFE ASSURANCE
GROUP2011
$ million2010
$ million
Income
Annual 4,553.2 4,188.3
Single 1,657.9 1,778.4
Gross premiums 6,211.1 5,966.7
Reinsurances (104.8) (100.4)
Premium income (net) 6,106.3 5,866.3
Investment income (net) 1,675.5 2,439.9
Total income 7,781.8 8,306.2
Expenses
Gross claims, surrenders and annuities (4,580.3) (4,226.9)
Claims, surrenders and annuities recovered from reinsurers 49.6 45.8
Net claims, surrenders and annuities (4,530.7) (4,181.1)
Change in life assurance fund contract liabilities (Note 22) (1,697.4) (2,545.2)
Commission and agency expenses (664.4) (601.6)
Depreciation – property, plant and equipment (Note 35) (45.1) (46.9)
Other expenses (1) (309.3) (253.8)
Total expenses (7,246.9) (7,628.6)
Surplus from operations 534.9 677.6
Share of results of associates and joint ventures (3.2) 25.5
Income tax expense (149.2) (265.9)
Profit from life assurance 382.5 437.2
(1) Included in other expenses were directors’ emoluments of $3.1 million (2010: $2.1 million).
Profit from life assurance is presented net of tax in the income statement as the tax liability is borne by the respective life funds.

100 OCBC Annual Report 2011
Notes to the Financial Statements
For the financial year ended 31 December 2011
5. FEES AND COMMISSIONS (NET)
GROUP BANK2011$’000
2010 $’000
2011$’000
2010$’000
Fee and commission income (1) 1,200,407 1,036,518 677,390 522,413Fee and commission expense (63,280) (53,703) (30,870) (9,203)
Fees and commissions (net) (1) 1,137,127 982,815 646,520 513,210
Analysed by major sources:Brokerage 68,621 85,711 539 1,521
Credit card 48,181 46,313 45,991 40,075
Fund management 100,789 83,097 (533) (956)
Guarantees 21,256 20,944 15,860 14,432
Investment banking 95,167 79,964 74,437 62,327
Loan-related 215,995 207,508 179,850 164,395
Service charges (1) 93,956 58,674 77,175 41,418
Trade-related and remittances 208,141 172,254 156,883 121,951
Wealth management (1) 252,352 199,528 92,307 65,261Others (1) 32,669 28,822 4,011 2,786
1,137,127 982,815 646,520 513,210
(1) Comparatives have been restated to conform to current year’s presentation.
6. DIVIDENDS
GROUP BANK2011$’000
2010 $’000
2011$’000
2010$’000
Subsidiaries – – 303,351 269,142
Associates – – 6,226 3,154
Trading securities 14,308 5,460 4,313 4,558Available-for-sale securities 73,740 57,179 25,293 15,416
88,048 62,639 339,183 292,270
7. OTHER INCOME
GROUP BANK2011$’000
2010$’000
2011$’000
2010$’000
Foreign exchange (1) (4) 372,236 323,958 236,268 150,036
Hedging activities (2)
Hedging instruments (130,442) (303,085) (126,837) (305,607)Hedged items 133,246 300,075 130,053 302,854
Fair value hedges 2,804 (3,010) 3,216 (2,753)Interest rate and other derivatives (3) (4) (199,059) (58,831) (170,110) (6,052)
Securities at fair value through profit and loss (34) 336 – –Trading securities 41,157 139,525 68,702 57,893
Net trading income 217,104 401,978 138,076 199,124Disposal of securities classified as available-for-sale 120,054 152,580 77,461 137,252
Disposal of securities classified as loans and receivables – 11 – –
Disposal/liquidation of subsidiaries and associates 977 37,991 625 2,292
Disposal of plant and equipment 17 733 (276) (5)
Disposal of property 42,705 22,169 40,952 21,360
Computer-related services income 30,480 31,815 – –
Property-related income 9,976 9,218 425 453Others 20,152 13,015 14,141 6,877
441,465 669,510 271,404 367,353
(1) “Foreign exchange” includes gains and losses from spot and forward contracts and translation of foreign currency assets and liabilities.(2) “Hedging activities” arise from the use of derivatives to hedge exposures to interest rate and foreign exchange risks, which are inherent in the underlying “Hedged items”.(3) “Interest rate and other derivatives” include gains and losses from interest rate, equity options and other derivative instruments.(4) Comparatives have been restated to conform to current year’s presentation.

101OCBC Annual Report 2011
8. STAFF COSTS AND OTHER OPERATING EXPENSES
GROUP BANK2011$’000
2010$’000
2011$’000
2010$’000
8.1 Staff costsSalaries and other costs (1) 1,308,260 1,148,349 522,838 481,691
Share-based expenses 9,761 11,754 6,374 8,435
Contribution to defined contribution plans 100,010 94,631 36,386 37,877
1,418,031 1,254,734 565,598 528,003
Directors’ emoluments:
Remuneration of Bank’s directors 9,419 8,432 8,762 7,918
Remuneration of directors of subsidiaries 14,685 13,519 – –
Fees of Bank’s directors 3,586 3,003 2,329 1,987
Fees of directors of subsidiaries 2,460 3,597 – –
30,150 28,551 11,091 9,905
Total staff costs 1,448,181 1,283,285 576,689 537,908
8.2 Other operating expensesProperty, plant and equipment: (2)
Depreciation 166,437 151,579 90,962 81,078
Maintenance and hire 75,179 70,225 28,785 23,819
Rental expenses 67,416 59,335 70,382 70,604
Others 141,941 125,815 56,865 46,713
450,973 406,954 246,994 222,214
Auditors’ remuneration
Payable to auditors of the Bank 1,707 1,496 1,155 979
Payable to associated firms of auditors of the Bank 906 950 261 235
Payable to other auditors 1,548 2,238 159 136
4,161 4,684 1,575 1,350
Other fees
Payable to auditors of the Bank 474 230 442 185
Payable to associated firms of auditors of the Bank 334 441 199 279
808 671 641 464
Hub processing charges – – 162,459 153,983
General insurance claims 57,669 92,181 – –
Others 468,120 465,804 253,751 239,739
525,789 557,985 416,210 393,722
Total other operating expenses 981,731 970,294 665,420 617,750
8.3 Staff costs and other operating expenses 2,429,912 2,253,579 1,242,109 1,155,658
(1) Net of government grants (Jobs credit scheme) of nil (2010: $4.4 million) and nil (2010: $2.2 million) for the Group and the Bank received respectively.(2) Direct operating expenses on leased investment property for the Group and the Bank amounted to $14.8 million (2010: $14.5 million) and $4.0 million (2010: $4.1 million)
respectively. Direct operating expenses on vacant investment property for the Group and the Bank amounted to $1.2 million (2010: $1.1 million) and $0.9 million
(2010: $0.5 million) respectively.

102 OCBC Annual Report 2011
Notes to the Financial Statements
For the financial year ended 31 December 2011
9. ALLOWANCES FOR LOANS AND IMPAIRMENT FOR OTHER ASSETS
GROUP BANK2011$’000
2010$’000
2011$’000
2010$’000
Specific allowances for loans (Note 28) 79,038 57,373 60,709 3,466
Portfolio allowances for loans (Note 29) 127,364 97,558 72,528 59,919
(Write-back)/impairment charge for available-for-sale securities (36) 9,752 (8,993) (1,173)
Write-back for collateralised debt obligations (CDOs) (1,054) (25,796) (1,054) (26,141)
Impairment charge/(write-back) for other assets (Note 32) 16,094 (4,861) 3,442 (186)
Net allowances and impairment 221,406 134,026 126,632 35,885
10. INCOME TAX EXPENSE
GROUP BANK2011$’000
2010$’000
2011$’000
2010$’000
Current tax expense 526,190 495,875 237,888 230,145
Deferred tax (credit)/expense (Note 20) (7,203) (23,469) 3,266 (6,670)
518,987 472,406 241,154 223,475
Over provision in prior years and tax refunds (42,401) (39,104) (40,289) (34,494)
Charge to income statements 476,586 433,302 200,865 188,981
The tax on operating profit differs from the amount that would arise using the Singapore corporate tax rate as follows:
GROUP BANK
2011$’000
2010$’000
2011$’000
2010$’000
Operating profit after allowances and amortisation 2,948,023 2,882,324 1,935,512 1,780,049
Prima facie tax calculated at tax rate of 17% 501,164 489,995 329,037 302,608
Effect of change in tax rates – 98 – 98
Effect of different tax rates in other countries 102,686 81,134 19,908 13,372
Losses of subsidiaries and foreign branches
not offset against taxable income of other entities 2,181 801 296 483
Income not assessable for tax (40,035) (40,925) (64,558) (55,449)
Income taxed at concessionary rate (57,042) (48,752) (54,173) (47,088)
Effect of Singapore life assurance fund (15,815) (28,622) – –
Amortisation of intangibles 10,427 8,385 – –
(Non-taxable write-backs)/non-deductible allowances (9,152) (1,924) 3 (172)
Others 24,573 12,216 10,641 9,623
518,987 472,406 241,154 223,475
The deferred tax (credit)/expense comprised:
Accelerated tax depreciation 6,398 267 6,246 842
Write-back of allowances for assets (19,462) (12,299) (590) (4,776)
Debt and equity securities 2,916 (344) – (117)
Fair value on properties from business combinations (1,676) (2,393) (1,692) (2,295)
Tax losses utilised/(tax losses) 2,070 (942) – –
Others 2,551 (7,758) (698) (324)
(7,203) (23,469) 3,266 (6,670)

103OCBC Annual Report 2011
11. EARNINGS PER SHARE
GROUP$’000 2011 2010
Profit attributable to ordinary equity holders of the Bank 2,312,216 2,253,466
Preference dividends paid (90,125) (90,125)
Profit attributable to ordinary equity holders of the Bank after preference dividends 2,222,091 2,163,341
Weighted average number of ordinary shares (’000)
For basic earnings per share 3,377,218 3,270,738
Adjustment for assumed conversion of share options and acquisition rights 9,015 10,693
For diluted earnings per share 3,386,233 3,281,431
Earnings per share (cents)
Basic 65.8 66.1
Diluted 65.6 65.9
Basic earnings per share is calculated by dividing profit attributable to ordinary equity holders of the Bank net of preference dividends by the weighted average number of ordinary shares in issue during the financial year.
For the purpose of calculating the diluted earnings per ordinary share, the weighted average number of ordinary shares in issue is adjusted to take into account the dilutive effect arising from share options and acquisition rights, with the potential ordinary shares weighted for the period outstanding.
12. UNAPPROPRIATED PROFIT
GROUP BANK2011$’000
2010$’000
2011$’000
2010$’000
Profit attributable to equity holders of the Bank 2,312,216 2,253,466 1,734,647 1,591,068
Add: Unappropriated profit at 1 January 9,814,663 8,270,781 5,763,210 4,865,425
Total amount available for appropriation 12,126,879 10,524,247 7,497,857 6,456,493
Appropriated as follows:
Ordinary dividends:
2009 final tax exempt dividend of 14 cents – (453,209) – (453,209)
2010 interim tax exempt dividend of 15 cents – (493,131) – (493,131)
2010 final tax exempt dividend of 15 cents (500,890) – (500,890) –
2011 interim tax exempt dividend of 15 cents (508,311) – (508,311) –
Preference dividends:
Class B 5.1% tax exempt (2010: 5.1% tax exempt) (51,000) (51,000) (51,000) (51,000)
Class E 4.5% tax exempt (2010: 4.5% tax exempt) (22,500) (22,500) (22,500) (22,500)
Class G 4.2% tax exempt (2010: 4.2% tax exempt) (16,625) (16,625) (16,625) (16,625)
Transfer from:
Capital reserves (Note 14) 332,546 350,312 339,626 339,626
Currency translation reserves (Note 15.2) 17 (121) – –
General reserves (Note 15.1) 3,702 3,556 3,702 3,556
Fair value reserves 67 526 – –
Acquisition of non-controlling interests (8,992) (27,039) – –
Share of an associate’s acquisition of non-controlling interests – (435) – –
Divestment of an associate – 82 – –
(771,986) (709,584) (755,998) (693,283)
At 31 December (Note 15) 11,354,893 9,814,663 6,741,859 5,763,210
At the annual general meeting to be held, a final tax exempt dividend of 15 cents per ordinary share in respect of the financial year ended 31 December 2011, totalling $515.6 million, will be proposed. The dividends will be accounted for as a distribution in the 2012 financial statements.

104 OCBC Annual Report 2011
Notes to the Financial Statements
For the financial year ended 31 December 2011
13. SHARE CAPITAL13.1 Share capital
GROUP AND BANK2011
Shares (’000) 2010
Shares (’000)2011$’000
2010$’000
Ordinary shares
At 1 January 3,341,046 3,245,121 6,424,508 5,656,590
Shares issued in-lieu of ordinary dividends 99,950 95,865 824,296 757,373
Shares issued to non-executive directors 48 60 462 541
Transfer from share-based reserves for options and rights exercised (Note 14) – – 12,464 10,004
At 31 December 3,441,044 3,341,046 7,261,730 6,424,508
Treasury shares
At 1 January (3,270) (14,782) (109,789) (176,169)
Share buyback (10,078) (4,439) (92,131) (42,260)
Share Option Schemes 2,723 8,969 25,283 65,348
Share Purchase Plan 4,071 3,512 38,093 24,303
Treasury shares transferred to DSP Trust 2,587 3,470 23,703 30,657
Loss on treasury shares transferred/sold – – (19,802) (11,668)
At 31 December (3,967) (3,270) (134,643) (109,789)
Preference shares
At 1 January/31December:
Class B 10,000 10,000 1,000,000 1,000,000
Class E 5,000 5,000 500,000 500,000
Class G 395,831 395,831 395,831 395,831
1,895,831 1,895,831
Issued share capital, at 31 December 9,022,918 8,210,550
The holders of ordinary shares (excluding treasury shares) are entitled to receive dividends as declared from time to time and to one vote per share at meetings of the Bank. All shares (excluding treasury shares) rank equally with regard to the Bank’s residual assets.
Details of the Bank’s non-cumulative non-convertible preference shares are set out in the table below. Preference dividends are payable semi-annually in arrears on 20 June and 20 December, subject to directors’ approval. Preference shareholders will only be entitled to attend and vote at general meetings of the Bank if dividends have not been paid in full when due for a consecutive period of 12 months or more.
The issued ordinary shares and Class B, Class E and Class G non-cumulative non-convertible preference shares qualify as Tier 1 capital for the Group.
All issued shares are fully paid.
Preference shares
Date of issue
Dividend rate p.a.
Liquidation value per share Redemption option by the Bank on these dates
Class B 29 Jul 2008 5.1% SGD100 29 Jul 2013; dividend payment dates after 29 Jul 2013
Class E 28 Jan 2003 4.5% SGD100 28 Jan 2013; dividend payment dates after 28 Jan 2013
Class G 14 Jul 2003 4.2% SGD1 14 Jul 2013; dividend payment dates after 14 Jul 2013
6 Aug 2003
Associates of the Group did not hold shares in the capital of the Bank as at 31 December 2011 and 31 December 2010.

105OCBC Annual Report 2011
13. SHARE CAPITAL (continued)13.2 Share option schemesIn March 2011, the Bank granted 2,824,281 options (2010: 3,356,827) to acquire ordinary shares in the Bank pursuant to OCBC Share Option Scheme 2001. This included 326,302 (2010: 233,727) options granted to directors of the Bank. The fair value of options granted, determined using the binomial valuation model, was $4.1 million (2010: $7.3 million). Significant inputs to the valuation model are set out below:
2011 2010
Acquisition price ($) 9.35 8.76
Average share price from grant date to acceptance date ($) 9.40 8.85
Expected volatility based on last 250 days historical volatility as of acceptance date (%) 18.26 28.10
Risk-free rate based on SGS bond yield at acceptance date (%) 1.11 and 2.45 0.92 and 2.79
Expected dividend yield (%) 3.09 3.16
Exercise multiple (times) 1.57 1.57
Option life (years) 5 and 10 5 and 10
Movements in the number of options and the average acquisition prices are as follows:
2011 2010
Number
of optionsAverage
priceNumber
of optionsAverage
price
At 1 January 33,106,004 $6.344 39,746,960 $6.026
Granted 2,824,281 $9.350 3,356,827 $8.762
Exercised (2,824,850) $6.090 (9,520,180) $5.856
Forfeited/lapsed (268,972) $8.165 (477,603) $6.553
At 31 December 32,836,463 $6.610 33,106,004 $6.344
Exercisable options at 31 December 26,851,822 $6.276 25,731,301 $6.168
Average share price underlying the options exercised $9.311 $9.111
At 31 December 2011, the weighted average remaining contractual life of outstanding share options was 4.6 years (2010: 5.1 years). The aggregate outstanding number of options held by directors of the Bank was 4,451,787 (2010: 4,125,485).
13.3 Employee share purchase planIn June 2011, the Bank launched its sixth offering of ESP Plan for Group employees, which commenced on 1 July 2011 and expire on 30 June 2013. Under the offering, the Bank granted 6,721,866 (2010: 5,500,602) rights to acquire ordinary shares in the Bank. This included 3,908 (2010: 4,114) rights granted to a director of the Bank. The fair value of rights, determined using the binomial valuation model was $5.0 million (2010: $4.8 million). Significant inputs to the valuation model are set out below:
2011 2010
Acquisition price ($) 9.21 8.75
Average share price ($) 9.03 8.32
Expected volatility based on last 250 days historical volatility as of acceptance date (%) 16.70 22.31
Risk-free rate based on 2-year swap rate (%) 0.68 1.16
Expected dividend yield (%) 2.57 2.69

106 OCBC Annual Report 2011
Notes to the Financial Statements
For the financial year ended 31 December 2011
13. SHARE CAPITAL (continued)
13.3 Employee share purchase plan (continued)Movements in the number of acquisition rights of the ESP Plan are as follows:
2011 2010
Number of acquisition
rightsAverage
price
Number of acquisition
rightsAverage
price
At 1 January 9,158,682 $7.826 8,452,191 $7.217
Exercised and conversion upon expiry (4,072,737) $6.356 (3,740,629) $7.872
Forfeited (1,283,475) $7.306 (1,053,482) $7.605
Subscription 6,721,866 $9.210 5,500,602 $8.750
At 31 December 10,524,336 $9.021 9,158,682 $7.826
Average share price underlying acquisition rights exercised/converted $9.523 $8.963
At 31 December 2011, the weighted average remaining contractual life of outstanding acquisition rights was 1.1 years (2010: 1.1 years). The aggregate outstanding number of rights held by a director of the Bank was 8,022 (2010: 9,560).
13.4 Deferred share plan Total awards of 3,288,428 (2010: 3,814,034) ordinary shares (including 391,349 (2010: 342,212) ordinary shares to directors of the Bank) were granted to eligible executives under the DSP for the financial year ended 31 December 2011. The fair value of the shares at grant date was $30.1 million (2010: $34.1 million).
During the year, 4,293,824 (2010: 1,360,587) deferred shares were released to employees, of which 237,619 (2010: 97,879) were released to directors of the Bank. At 31 December 2011, the directors of the Bank have deemed interest of 1,294,243 (2010: 1,094,729) deferred shares.
14. CAPITAL RESERVES
GROUP BANK
2011$’000
2010 $’000
2011$’000
2010$’000
At 1 January 612,826 985,445 432,498 768,012
Share-based staff costs capitalised 9,881 14,116 9,881 14,116
Shares purchased by DSP Trust (27,475) (34,659) – –
Shares vested under DSP Scheme 29,180 8,240 – –
Transfer to unappropriated profit (Note 12) (332,546) (350,312) (339,626) (339,626)
Transfer to share capital (Note 13.1) (12,464) (10,004) (12,464) (10,004)
At 31 December 279,402 612,826 90,289 432,498
Capital reserves include statutory reserves set aside by the Group’s banking and stockbroking entities in accordance with the respective laws and regulations. For banking entities operating in Singapore, the requirement to set aside statutory reserves was spelt out in section 22(1) of the Banking Act (Cap. 19). This section was repealed with effect from 31 March 2007 and no further transfer of profits to statutory reserves is required. Under the Banking (Reserve Fund) (Transitional Provision) Regulation 2007, the Bank may distribute or utilise its statutory reserves, subject to a cap of 20% of the reserve fund as of 30 March 2007, for each calendar year. Other capital reserves include the Bank’s employee share schemes’ reserves and deferred shares held by DSP Trust.

107OCBC Annual Report 2011
15. REVENUE RESERVES
GROUP BANK2011$’000
2010$’000
2011$’000
2010$’000
Unappropriated profit (Note 12) 11,354,893 9,814,663 6,741,859 5,763,210
General reserves 1,328,299 1,328,252 1,113,999 984,112
Currency translation reserves (539,481) (550,244) (134,239) (141,856)
At 31 December 12,143,711 10,592,671 7,721,619 6,605,466
15.1 General reservesAt 1 January 1,328,252 1,326,022 984,112 981,882
Arising from merger of subsidiaries – – 129,840 –
DSP reserve from dividends on unvested shares 3,749 5,786 3,749 5,786
Transfer to unappropriated profits (Note 12) (3,702) (3,556) (3,702) (3,556)
At 31 December 1,328,299 1,328,252 1,113,999 984,112
The general reserves have not been earmarked for any specific purpose, and include merger reserves arising from common control transactions, as well as dividends on unvested shares under the DSP.
15.2 Currency translation reserves At 1 January (550,244) (494,122) (141,856) (131,448)
Adjustments for the year 24,069 (226,490) 6,860 (15,526)
Effective portion of hedge (13,289) 170,247 757 5,118
Transfer to unappropriated profits (Note 12) (17) 121 – –
At 31 December (539,481) (550,244) (134,239) (141,856)
Currency translation reserves comprise exchange differences arising from the translation of the net assets of foreign operations and the effective portion of the hedge on exposure in foreign operations.
16. NON-CONTROLLING INTERESTS
GROUP2011$’000
2010$’000
Non-controlling interests in subsidiaries 755,570 787,966
Preference shares issued by subsidiaries
OCBC Bank (Malaysia) Berhad 163,752 166,953
OCBC Capital Corporation 400,000 400,000
OCBC Capital Corporation (2008) 1,500,000 1,500,000
Total non-controlling interests 2,819,322 2,854,919
OCBC Bank (Malaysia) Berhad (“OBMB”), a wholly-owned subsidiary of the Bank, issued the MYR400 million non-cumulative non-convertible preference shares on 12 August 2005. The preference shares are redeemable in whole at the option of OBMB on 12 August 2015 and each dividend payment date thereafter. Dividends, which are subject to declaration by the Board of Directors of OBMB, are payable semi-annually on 20 March and 20 September each year at 4.51% per annum on a net dividend basis on or prior to the 10th anniversary, and thereafter at a floating rate per annum based on the 6-month Kuala Lumpur Interbank Offer Rate plus 1.90% less prevailing Malaysian corporate tax if the redemption option is not exercised. OCBC Capital Corporation (“OCC”), a wholly-owned subsidiary of the Bank, issued the $400 million non-cumulative non-convertible guaranteed preference shares on 2 February 2005. The proceeds are on-lent to the Bank in exchange for a note issued by the Bank [Note 21.1(g)], which guarantees on a subordinated basis, all payment obligations in respect of the preference shares. The preference shares are redeemable in whole at the option of OCC on 20 March 2015 and each dividend payment date thereafter. Dividends, which are subject to declaration by the Board of Directors of OCC, are payable semi-annually on 20 March and 20 September each year at 3.93% per annum up to 20 March 2015, and thereafter quarterly on 20 March, 20 June, 20 September and 20 December each year at a floating rate per annum equal to the 3-month Singapore Swap Offer Rate plus 1.85% if the redemption option is not exercised. The preference shares qualify as Tier 1 capital for the Group.

108 OCBC Annual Report 2011
Notes to the Financial Statements
For the financial year ended 31 December 2011
16. NON-CONTROLLING INTERESTS (continued)OCBC Capital Corporation (2008) (“OCC2008”), a wholly-owned subsidiary of the Bank, issued the $1.5 billion non-cumulative non-convertible guaranteed preference shares on 27 August 2008. The proceeds are on-lent to the Bank in exchange for a note issued by the Bank [Note 21.1(h)], which guarantees on a subordinated basis, all payment obligations in respect of the preference shares. The preference shares are redeemable in whole at the option of OCC2008 on 20 September 2018 and each dividend payment date thereafter. Dividends, which are subject to declaration by the Board of Directors of OCC2008, are payable semi-annually on 20 March and 20 September each year at 5.10% per annum up to 20 September 2018, and thereafter quarterly on 20 March, 20 June, 20 September and 20 December each year at a floating rate per annum equal to the 3-month Singapore Swap Offer Rate plus 2.50% if the redemption option is not exercised. The preference shares qualify as Tier 1 capital for the Group.
17. DEPOSITS AND BALANCES OF NON-BANK CUSTOMERS AND BANKS
GROUP BANK
2011$’000
2010 $’000
2011$’000
2010$’000
Deposits of non-bank customers
Current accounts 43,117,837 31,736,321 27,975,456 22,591,223
Savings deposits 28,535,633 25,620,282 24,643,983 22,305,082
Term deposits 65,916,607 55,319,294 45,936,240 38,060,837
Structured deposits 5,067,520 3,282,873 2,116,591 1,902,215
Certificate of deposits issued 7,512,795 3,139,045 7,435,934 2,945,275
Other deposits 4,404,447 4,202,211 1,718,507 1,085,914
154,554,839 123,300,026 109,826,711 88,890,546
Deposits and balances of banks 21,653,245 16,508,477 18,880,685 13,810,825
176,208,084 139,808,503 128,707,396 102,701,371
17.1 Deposits of non-bank customersAnalysed by currency
Singapore Dollar 80,236,413 66,934,019 78,484,291 66,215,107
US Dollar 21,968,570 16,917,543 13,223,720 10,567,238
Malaysian Ringgit 19,127,970 17,097,308 – –
Indonesian Rupiah 5,157,478 4,423,480 1 1
Japanese Yen 1,780,801 1,683,191 1,642,249 1,488,159
Hong Kong Dollar 2,663,164 3,192,223 2,165,904 2,757,593
British Pound 4,095,178 1,550,594 3,460,549 1,111,879
Australian Dollar 7,498,790 5,447,809 6,055,977 4,761,977
Euro 1,638,117 1,525,186 559,927 821,897
Others 10,388,358 4,528,673 4,234,093 1,166,695
154,554,839 123,300,026 109,826,711 88,890,546
17.2 Deposits and balances of banksAnalysed by currency
Singapore Dollar 1,086,459 2,938,432 1,083,275 2,937,692
US Dollar 11,933,941 8,759,696 10,667,568 7,575,017
Malaysian Ringgit 443,729 693,045 – –
Indonesian Rupiah 89,258 104,188 – –
Japanese Yen – 145,847 – –
Hong Kong Dollar 2,356,520 616,949 2,355,028 610,721
British Pound 1,075,070 507,542 1,075,064 506,880
Australian Dollar 1,902,276 976,120 1,840,545 975,896
Euro 1,143,998 1,009,369 1,138,674 753,451
Others 1,621,994 757,289 720,531 451,168
21,653,245 16,508,477 18,880,685 13,810,825

109OCBC Annual Report 2011
18. DERIVATIVE FINANCIAL INSTRUMENTS The derivative financial instruments shown in the following tables are held for both trading and hedging purposes. The contractual or underlying principal amounts of these derivative financial instruments and their corresponding gross positive (derivative receivables) and negative (derivative payables) fair values at the balance sheet date are analysed below.
2011 2010
GROUP ($’000)
Principalnotional amount
Derivativereceivables
Derivative payables
Principalnotional amount
Derivativereceivables
Derivative payables
Foreign exchange derivatives (“FED”)
Forwards 55,616,318 477,309 275,939 32,256,590 337,551 454,181
Swaps 166,025,852 1,728,084 2,043,638 91,612,308 1,517,087 1,166,780
OTC options – bought 12,516,333 110,028 2,791 4,277,799 55,164 1,660
OTC options – sold 12,385,570 1,551 122,472 4,005,399 1,086 64,317
246,544,073 2,316,972 2,444,840 132,152,096 1,910,888 1,686,938
Interest rate derivatives (“IRD”)
Swaps 264,945,085 3,272,682 3,342,073 265,273,613 2,737,315 2,671,583
OTC options – bought 1,438,617 20,509 – 2,412,027 22,122 –
OTC options – sold 6,993,040 – 42,035 8,659,895 – 51,571
Exchange traded futures – bought 3,096,729 – – 1,963,190 140 19
Exchange traded futures – sold 7,396,281 2 56 3,596,934 54 412
283,869,752 3,293,193 3,384,164 281,905,659 2,759,631 2,723,585
Equity derivatives
Swaps 71,403 1,348 7,107 81,940 359 2,678
OTC options – bought 711,180 72,384 1,653 617,963 42,117 5,088
OTC options – sold 589,206 1,662 60,156 585,321 5,088 13,240
Exchange traded options – bought 1,507 16 – 1,772 36 –
Exchange traded options – sold – – – 55,670 – 681
Exchange traded futures – bought 12,578 – 59 16,231 5 39
Exchange traded futures – sold 22,730 123 112 1,121 – 4
Others 27,946 1,313 1,194 52,781 797 –
1,436,550 76,846 70,281 1,412,799 48,402 21,730
Credit derivatives
Swaps – protection buyer 5,857,925 160,117 44,055 2,921,438 10,991 93,442
Swaps – protection seller 5,818,064 35,638 156,132 2,806,328 81,696 13,352
11,675,989 195,755 200,187 5,727,766 92,687 106,794
Other derivatives
Precious metals – bought 87,528 656 1,454 61,916 217 444
Precious metals – sold 91,717 4,874 341 46,734 3,083 295
OTC options – bought 698,090 8,307 – 690,579 4,759 1,219
OTC options – sold 768,836 – 9,289 586,002 912 5,425
Futures – bought – – – 788 3 –
Others 329,051 2,212 2,212 564,178 16,324 16,324
1,975,222 16,049 13,296 1,950,197 25,298 23,707
Total 545,501,586 5,898,815 6,112,768 423,148,517 4,836,906 4,562,754
Included items designated for hedges:
Fair value hedge – FED 408,847 1,956 1,887 671,472 80,618 8,684
Fair value hedge – IRD 4,188,354 95,659 69,785 5,797,709 136,319 66,165
Hedge of net investments – FED 535,759 – 10,381 1,325,000 113,012 –
5,132,960 97,615 82,053 7,794,181 329,949 74,849

110 OCBC Annual Report 2011
18. DERIVATIVE FINANCIAL INSTRUMENTS (continued)
2011 2010
BANK ($’000)
Principalnotional amount
Derivativereceivables
Derivative payables
Principalnotional amount
Derivativereceivables
Derivative payables
Foreign exchange derivatives (“FED”)
Forwards 42,673,585 368,602 196,780 23,781,665 146,141 306,524
Swaps 153,333,529 1,599,855 1,966,943 80,255,985 1,430,899 1,047,653
OTC options – bought 6,002,185 70,950 314 3,360,739 43,823 1,113
OTC options – sold 6,047,459 4 90,943 3,221,750 588 52,790
208,056,758 2,039,411 2,254,980 110,620,139 1,621,451 1,408,080
Interest rate derivatives (“IRD”)
Swaps 252,626,122 3,181,866 3,265,082 256,354,243 2,665,144 2,627,575
OTC options – bought 1,254,396 18,053 – 2,286,812 21,093 –
OTC options – sold 6,102,731 – 41,607 8,075,180 – 50,624
Exchange traded futures – bought 3,096,729 – – 1,963,190 140 19
Exchange traded futures – sold 7,396,281 2 56 3,596,934 54 412
270,476,259 3,199,921 3,306,745 272,276,359 2,686,431 2,678,630
Equity derivatives
Swaps 42,208 1,138 6,897 51,980 34 2,353
OTC options – bought 198,238 14,656 568 231,369 34,825 414
OTC options – sold 111,167 577 2,770 170,407 414 1,720
Exchange traded options – bought 1,507 16 – 1,772 36 –
Exchange traded options – sold – – – 55,670 – 681
Exchange traded futures – bought 12,578 – 59 7,396 5 13
Exchange traded futures – sold 18,223 123 72 1,121 – 4
Others 10,396 190 1 52,781 797 –
394,317 16,700 10,367 572,496 36,111 5,185
Credit derivatives
Swaps – protection buyer 5,715,665 155,723 44,055 2,921,438 10,991 93,442
Swaps – protection seller 5,774,056 35,638 153,883 2,806,328 81,696 13,352
11,489,721 191,361 197,938 5,727,766 92,687 106,794
Other derivatives
Precious metals – bought 86,526 656 1,408 61,916 217 444
Precious metals – sold 90,715 4,829 341 46,734 3,083 295
OTC options – bought 698,090 8,307 – 690,579 4,495 1,219
OTC options – sold 768,938 – 9,290 586,340 912 5,162
Others 310,374 1,187 1,187 564,178 16,324 16,324
1,954,643 14,979 12,226 1,949,747 25,031 23,444
Total 492,371,698 5,462,372 5,782,256 391,146,507 4,461,711 4,222,133
Included items designated for hedges:
Fair value hedge – FED 814,448 1,863 12,105 1,983,602 192,480 8,684
Fair value hedge – IRD 3,736,078 89,124 67,626 5,214,002 132,810 65,073
4,550,526 90,987 79,731 7,197,604 325,290 73,757
Notes to the Financial Statements
For the financial year ended 31 December 2011

111OCBC Annual Report 2011
18. DERIVATIVE FINANCIAL INSTRUMENTS (continued)
GROUP BANK
2011$’000
2010 $’000
2011$’000
2010$’000
Derivative receivables:
Analysed by counterparty
Banks 4,136,075 3,662,488 3,969,927 3,545,405
Other financial institutions 906,935 581,636 897,500 572,434
Corporates 610,382 327,667 507,700 276,219
Individuals 177,054 226,708 19,598 29,533
Others 68,369 38,407 67,647 38,120
5,898,815 4,836,906 5,462,372 4,461,711
Analysed by geography
Singapore 2,658,728 2,327,047 2,668,930 2,376,125
Malaysia 251,686 202,131 34,932 28,724
Rest of Southeast Asia 45,091 29,283 12,622 10,792
Greater China 334,200 145,731 255,500 103,888
Other Asia Pacific 140,656 95,207 130,153 87,393
Rest of the World 2,468,454 2,037,507 2,360,235 1,854,789
5,898,815 4,836,906 5,462,372 4,461,711
The analysis by geography is determined based on where the credit risk resides.
19. OTHER LIABILITIES
GROUP BANK2011$’000
2010$’000
2011$’000
2010$’000
Bills payable 407,123 314,751 262,953 196,835
Interest payable 451,806 346,664 254,798 211,776
Sundry creditors 2,027,199 1,886,319 512,841 366,182
Others 1,137,280 638,985 428,083 287,840
4,023,408 3,186,719 1,458,675 1,062,633
At 31 December 2011, reinsurance liabilities included in “Others” amounted to $24.1 million (2010: $17.5 million).
20. DEFERRED TAX
GROUP BANK2011$’000
2010$’000
2011$’000
2010$’000
At 1 January 1,048,012 882,047 124,823 114,776
Currency translation and others (4,706) 2,328 (14) 2,822
(Credit)/expense to income statements (7,203) (23,567) 3,266 (6,768)
Effect of change in tax rates – 98 – 98
Net (credit)/expense to income statements (Note 10) (7,203) (23,469) 3,266 (6,670)
Under/(over) provision in prior years 55,291 (12,734) 1,524 (3,918)
Deferred tax on fair value changes (25,878) 49,064 (13,066) 13,073
Effect of change in tax rates – 4,740 – 4,740
Net deferred tax change taken to other comprehensive income (25,878) 53,804 (13,066) 17,813
Net change in life assurance fund tax 14,193 127,733 – –
Acquisition of subsidiaries – 18,303 – –
At 31 December 1,079,709 1,048,012 116,533 124,823

112 OCBC Annual Report 2011
Notes to the Financial Statements
For the financial year ended 31 December 2011
20. DEFERRED TAX (continued)Deferred income tax assets and liabilities are offset when there is a legally enforceable right to set off current tax assets against current tax liabilities and when the deferred income taxes relate to the same fiscal authority.
The deferred tax assets and liabilities are to be recovered and settled after one year and the following amounts, determined after appropriate offsetting, are shown in the balance sheets:
GROUP BANK
2011$’000
2010$’000
2011$’000
2010$’000
Deferred tax liabilities
Accelerated tax depreciation 63,706 59,092 32,457 26,210
Debt and equity securities 374,233 358,404 84,136 96,772
Fair value on properties from business combinations 69,523 71,199 63,928 65,620
Provision for policy liabilities 607,227 608,188 – –
Unremitted income and others 87,294 93,845 2,039 256
1,201,983 1,190,728 182,560 188,858
Amount offset against deferred tax assets (78,858) (64,187) (61,706) (57,581)
1,123,125 1,126,541 120,854 131,277
Deferred tax assets
Allowances for assets (78,581) (99,366) (50,144) (50,148)
Tax losses (8,324) (8,230) – –
Others (35,369) (35,120) (15,883) (13,887)
(122,274) (142,716) (66,027) (64,035)
Amount offset against deferred tax liabilities 78,858 64,187 61,706 57,581
(43,416) (78,529) (4,321) (6,454)
Net deferred tax liabilities 1,079,709 1,048,012 116,533 124,823
Deferred income tax assets are recognised for tax losses carried forward only to the extent that realisation of the related tax benefit through future taxable profits is probable. At 31 December 2011, unutilised tax losses for which no deferred income tax asset has been recognised amounted to $15.9 million (2010: $8.9 million) and nil (2010: nil) for the Group and Bank respectively.
21. DEBT ISSUED
GROUP
2011$’000
2010 $’000
Subordinated debt (unsecured) [Note 21.1] 4,079,820 6,339,576
Floating rate notes (unsecured) [Note 21.2] 659,261 –
Commercial papers (unsecured) [Note 21.3] 8,292,837 460,848
Structured notes (unsecured) [Note 21.4] 31,260 54,042
13,063,178 6,854,466

113OCBC Annual Report 2011
21. DEBT ISSUED (continued)
21.1 Subordinated debt (unsecured)
GROUP
Note Issue Date Maturity Date2011$’000
2010$’000
Issued by the Bank:
EUR372 million 7.25% notes (a) 6 Jul 2001 6 Sep 2011 – 657,106
SGD265 million 5.00% notes (a) 6 Jul 2001 6 Sep 2011 – 270,303
USD1.25 billion 7.75% notes (a) 6 Jul 2001 6 Sep 2011 – 1,668,271
SGD225 million 3.78% notes (b) 28 Nov 2007 28 Nov 2017 230,254 234,579
MYR1 billion 4.60% bonds (c) 27 Mar 2008 27 Mar 2018 409,295 417,226
MYR600 million 4.60% bonds (c) 6 Jun 2008 6 Jun 2018 253,894 262,061
SGD711.93 million 5.60% notes (d) 27 Mar 2009 27 Mar 2019 733,507 726,441
USD500 million 4.25% notes (e) 18 Nov 2009 18 Nov 2019 679,813 661,997
USD500 million 3.75% notes (f) 15 Nov 2010 15 Nov 2022 664,465 603,331
SGD400 million 3.93% notes (g) 2 Feb 2005 20 Mar 2055 400,000 400,000
SGD1.5 billion 5.10% notes (h) 27 Aug 2008 20 Sep 2058 1,500,000 1,500,000
4,871,228 7,401,315
Subordinated debt issued to/held by subsidiaries (2,019,800) (1,900,000)
Net subordinated debt issued by the Bank 2,851,428 5,501,315
Issued by OCBC Bank (Malaysia) Berhad (“OBMB”):
MYR200 million Islamic bonds (i) 24 Nov 2006 24 Nov 2021 81,876 83,477
MYR400 million bonds (j) 30 Nov 2007 30 Nov 2017 165,800 169,489
MYR400 million Innovative Tier 1 Capital Securities (k) 17 Apr 2009 Not applicable 163,752 166,953
MYR500 million bonds (l) 4 Nov 2010 4 Nov 2020 208,649 207,880
620,077 627,799
Issued by PT Bank OCBC NISP Tbk:
Subordinated Bonds II – IDR600 billion (m) 12 Mar 2008 11 Mar 2018 85,008 85,465
Subordinated Bonds III – IDR880 billion (n) 30 Jun 2010 30 Jun 2017 124,207 124,997
209,215 210,462
Issued by The Great Eastern Life Assurance Company Limited (“GEL”):
SGD400 million 4.60% notes (o) 19 Jan 2011 19 Jan 2026 399,100 –
Total subordinated debt 4,079,820 6,339,576
(a) The EUR, SGD and USD subordinated notes were fully redeemed and cancelled at maturity on 6 September 2011.
(b) Interest is payable semi-annually on 28 May and 28 November each year at 3.78% per annum up to 28 November 2012, and thereafter quarterly on 28 February, 28 May, 28 August and 28 November each year at a floating rate per annum equal to the 3-month Singapore Swap Offer Rate plus 1.72%. The subordinated notes are redeemable in whole at the option of the Bank on 28 November 2012. The Bank had entered into interest rate swaps to manage the risk of the subordinated notes and the cumulative fair value change of the risk hedged is included in the carrying value. The subordinated notes qualify as Tier 2 capital for the Group.
(c) Interest is payable semi-annually at 4.60% per annum for the first 5 years, and thereafter at 5.60% per annum. The subordinated bonds are redeemable in whole at the option of the Bank on the 5th anniversary of the issue date and each coupon payment date thereafter. The coupon payment dates are on 27 March and 27 September each year for the MYR1 billion subordinated bonds and on 6 June and 6 December each year for the MYR600 million subordinated bonds. The Bank had entered into interest rate swaps to manage the risk of the MYR600 million subordinated bonds and the cumulative fair value change of the risk hedged is included in the carrying value. The subordinated bonds qualify as Tier 2 capital for the Group.

114 OCBC Annual Report 2011
21. DEBT ISSUED (continued)
21.1 Subordinated debt (unsecured) (continued)(d) Interest is payable semi-annually on 27 March and 27 September each year at 5.60% per annum up to 27 March 2014, and thereafter at 7.35%
per annum. The subordinated notes are redeemable in whole at the option of the Bank on 27 March 2014. The Bank had entered into interest rate swaps to manage the risk of the subordinated notes and the cumulative fair value change of the risk hedged is included in the carrying value. The subordinated notes qualify as Tier 2 capital for the Group.
(e) Interest is payable semi-annually on 18 May and 18 November each year at 4.25% per annum up to 18 November 2014, and thereafter at a fixed rate per annum equal to the aggregate of the relevant 5-year US Treasury benchmark rate and 2.997%. The subordinated notes are redeemable in whole at the option of the Bank on 18 November 2014. The Bank had entered into interest rate swaps to manage the risk of the subordinated notes and the cumulative fair value change of the risk hedged is included in the carrying value. The subordinated notes qualify as Tier 2 capital for the Group.
(f) Interest is payable semi-annually on 15 May and 15 November each year at 3.75% per annum up to 15 November 2017, and thereafter quarterly on 15 February, 15 May, 15 August and 15 November each year at a floating rate per annum equal to the three-month London Interbank Offer Rate plus 1.848%. The subordinated notes are redeemable in whole at the option of the Bank on 15 November 2017. The Bank had entered into interest rate swaps to manage the risk of the subordinated notes and the cumulative fair value change of the risk hedged is included in the carrying value. The subordinated notes qualify as Tier 2 capital for the Group.
(g) The subordinated note was issued by the Bank to its wholly-owned subsidiary, OCBC Capital Corporation in exchange for the proceeds from the issue of the $400 million non-cumulative non-convertible guaranteed preference shares (Note 16). Interest will, if payable, be made semi-annually on 20 March and 20 September each year at 3.93% per annum up to 20 March 2015, and thereafter quarterly on 20 March, 20 June, 20 September and 20 December each year at a floating rate per annum equal to the 3-month Singapore Swap Offer Rate plus 1.85%. The subordinated note is redeemable at the option of the Bank on 20 March 2015 and each coupon payment date thereafter.
(h) The subordinated note was issued by the Bank to its wholly-owned subsidiary, OCBC Capital Corporation (2008) in exchange for the proceeds from the issue of the $1.5 billion non-cumulative non-convertible guaranteed preference shares (Note 16). Interest will, if payable, be made semi-annually on 20 March and 20 September each year at 5.1% per annum up to 20 September 2018, and thereafter quarterly on 20 March, 20 June, 20 September and 20 December each year at a floating rate per annum equal to the 3-month Singapore Swap Offer Rate plus 2.5%. The subordinated note is redeemable at the option of the Bank on 20 September 2018 and each coupon payment date thereafter.
(i) The Islamic subordinated bonds were issued under the Mudharabah (profit sharing) principle with a projected constant rate of 5.40% per annum, payable semi-annually on 24 May and 24 November each year, up to 24 November 2016, and thereafter at 6.40% per annum. The subordinated bonds are redeemable in whole at the option of OBMB on 24 November 2016 and each profit payment date thereafter. In addition, the subordinated bonds are to be redeemed in full in 5 equal and consecutive annual payments with the first redemption commencing on 24 November 2017. The subordinated bonds qualify as Tier 2 capital for the Group.
(j) Interest is payable semi-annually on 30 May and 30 November each year at 4.55% per annum up to 30 November 2012, and thereafter at 5.55% per annum. The subordinated bonds are redeemable in whole at the option of OBMB on 30 November 2012 and each coupon payment date thereafter. In addition, the subordinated bonds are to be redeemed in full in 5 equal and consecutive annual payments with the first redemption commencing on 30 November 2013. OBMB had entered into interest rate swaps to manage the risk of the subordinated bonds and the cumulative fair value change of the risk hedged is included in the carrying value. The subordinated bonds qualify as Tier 2 capital for the Group.
(k) Interest is payable semi-annually on 17 April and 17 October each year at 6.75% per annum up to 17 April 2019, and thereafter at a floating rate per annum based on the 6-month Kuala Lumpur Interbank Offer Rate plus 3.32%. The Innovative Tier 1 (“IT1”) Capital Securities are redeemable in whole at the option of OBMB on 17 April 2019 and each coupon payment date thereafter. If the redemption option is not exercised, the IT1 Capital Securities are to be redeemed in full with the proceeds from the issuance of non-cumulative non-convertible preference shares on 17 April 2039. The IT1 Capital Securities qualify as Tier 1 capital for the Group.
(l) Interest is payable semi-annually on 4 May and 4 November each year at 4.20% per annum. The subordinated bonds are redeemable in whole at the option of OBMB on 4 November 2015 and each coupon payment date thereafter. If the redemption option is not exercised, the subordinated bonds are to be redeemed in full in 5 equal and consecutive annual payments with the first redemption commencing on 4 November 2016. OBMB had entered into interest rate swaps to manage the risk of the subordinated bonds and the cumulative fair value change of the risk hedged is included in the carrying value. The subordinated bonds qualify as Tier 2 capital for the Group.
(m) Interest is payable quarterly on 11 March, 11 June, 11 September and 11 December each year at 11.1% per annum up to 12 March 2013, and thereafter at 19.1% per annum. The subordinated bonds are redeemable in whole at the option of PT Bank OCBC NISP Tbk on 12 March 2013.
Notes to the Financial Statements
For the financial year ended 31 December 2011

115OCBC Annual Report 2011
21. DEBT ISSUED (continued)
21.1 Subordinated debt (unsecured) (continued)(n) Interest is payable quarterly on 30 March, 30 June, 30 September and 30 December each year at 11.35% per annum. The subordinated bonds
qualify as Tier 2 capital for the Group.
(o) Interest is payable semi-annually on 19 January and 19 July each year at 4.60% per annum up to 19 January 2021, and thereafter at a fixed rate per annum equal to the aggregate of the then prevailing 5-year Singapore Swap Offer Rate and 1.35%. The subordinated notes are redeemable in whole at the option of GEL on 19 January 2021.
21.2 Floating rate notes (unsecured)
GROUP AND BANK2011$’000
2010 $’000
Issued by the Bank:
AUD500 million floating rate notes 659,261 –
The notes were issued by the Bank on 14 July 2011 and mature on 14 July 2014. Interest is payable quarterly on 14 October, 14 January, 14 April and 14 July each year at a floating rate per annum equal to the 3-month Australia Bank Bill Swap Offer Rate plus 0.83%.
21.3 Commercial papers (unsecured)
GROUP
Note 2011$’000
2010 $’000
Issued by the Bank (a) 8,235,714 431,837
Issued by a subsidiary (b) 57,123 29,011
8,292,837 460,848
(a) The zero coupon commercial papers were issued by the Bank under its USD2 billion ECP programme and USD5 billion USCP programme established in 2004 and 2011 respectively. The notes outstanding at 31 December 2011 were issued between 20 April 2011 (2010: 26 October 2010) and 23 December 2011 (2010: 17 December 2010), and mature between 3 January 2012 (2010: 18 January 2011) and 16 November 2012 (2010: 18 March 2011), yielding between 0.21% and 4.77% (2010: 0.037% and 4.90%).
(b) The commercial papers were issued by the Group’s leasing subsidiary under its MYR200 million 7-year CP/MTN programme expiring in 2012. The notes outstanding as at 31 December 2011 were issued between 14 June 2011 (2010: 29 October 2010) and 9 December 2011 (2010: 27 December 2010), and mature between 5 January 2012 (2010: 7 January 2011) and 23 March 2012 (2010: 12 May 2011), with interest rate ranging from 3.42% to 3.90% (2010: 3.15% to 3.68%).
21.4 Structured notes (unsecured)
GROUP AND BANK
Issue Date Maturity Date2011$’000
2010 $’000
Issued by the Bank:
Credit linked notes 17 Nov 2008 - 6 May 2011 7 May 2012 - 20 Dec 2013 8,000 5,000
Equity-linked notes 8 Dec 2011 - 30 Dec 2011 6 Jan 2012 - 30 Jan 2012 8,219 47,556
Fixed Rate Notes 21 Apr 2011 - 4 Oct 2011 20 Apr 2012 - 4 Oct 2012 15,041 1,486
31,260 54,042
The structured notes were issued by the Bank under its Structured Note and Medium Term Notes Programmes and are carried at amortised cost, except for the fixed rate notes as at 31 December 2010 which were held at fair value through profit or loss.

116 OCBC Annual Report 2011
22. LIFE ASSURANCE FUND LIABILITIES AND INVESTMENT ASSETS
GROUP2011
$ million 2010
$ million
Life assurance fund liabilities
Movements in life assurance fund
At 1 January 43,267.9 39,386.6
Currency translation (335.9) 282.4
Fair value reserve movements (208.6) 1,053.7
Change in life assurance fund contract liabilities (Note 4) 1,697.4 2,545.2
At 31 December 44,420.8 43,267.9
Policy benefits 2,262.0 2,118.5
Others 2,521.0 2,094.8
49,203.8 47,481.2
Life assurance fund investment assets
Deposits with banks and financial institutions 5,950.3 2,044.3
Loans 3,409.4 3,811.6
Securities 37,470.1 39,246.8
Investment property 1,406.7 1,355.4
Others (1) 851.8 1,028.0
49,088.3 47,486.1
The following contracts were entered into under the life assurance fund:
Operating lease commitments 4.4 2.6
Capital commitment authorised and contracted 89.7 65.3
Derivative financial instruments (principal notional amount) 7,142.6 6,931.1
Derivative receivables 435.4 518.7
Derivative payables 60.9 25.8
Minimum lease rental receivables under non-cancellable operating leases 78.7 65.4
(1) Others mainly comprise interest receivable, deposits collected, prepayments, investment debtors and sundry debtors.
23. CASH AND PLACEMENTS WITH CENTRAL BANKS
GROUP BANK
2011$’000
2010 $’000
2011$’000
2010$’000
Cash on hand 745,966 660,251 597,336 490,986
Balances with central banks 4,451,328 2,824,129 2,342,603 1,925,868
Money market placements and reverse repos 7,699,311 8,008,511 4,045,660 4,370,089
12,896,605 11,492,891 6,985,599 6,786,943
Balances with central banks include mandatory reserve deposits of $4,414.4 million (2010: $2,802.8 million) and $2,336.6 million (2010: $1,909.8 million) for the Group and Bank respectively.
Notes to the Financial Statements
For the financial year ended 31 December 2011

117OCBC Annual Report 2011
24. GOVERNMENT TREASURY BILLS AND SECURITIES
GROUP BANK
2011$’000
2010$’000
2011$’000
2010$’000
Singapore government treasury bills and securities
Trading, at fair value 2,333,350 1,557,525 2,333,350 1,557,524
Available-for-sale, at fair value 10,631,867 9,509,065 10,258,930 8,927,698
Fair value at initial recognition 284,896 89,932 – –
Gross securities 13,250,113 11,156,522 12,592,280 10,485,222
Other government treasury bills and securities
Trading, at fair value 1,574,626 2,186,136 1,330,129 1,740,420
Available-for-sale, at fair value 6,029,475 3,812,197 2,717,047 1,508,120
Fair value at initial recognition – 20,592 – –
Gross securities 7,604,101 6,018,925 4,047,176 3,248,540
Assets pledged (Note 44) (207,297) (74,398) (59,553) (74,398)
7,396,804 5,944,527 3,987,623 3,174,142
Gross securities analysed by geography
Singapore 13,250,113 11,156,522 12,592,280 10,485,222
Malaysia 2,374,067 1,718,832 – –
Rest of Southeast Asia 1,548,292 1,954,114 640,336 923,152
Greater China 2,282,848 1,006,642 2,011,906 1,006,642
Other Asia Pacific 1,348,273 640,698 1,348,273 640,698
Rest of the World 50,621 698,639 46,661 678,048
20,854,214 17,175,447 16,639,456 13,733,762
25. PLACEMENTS WITH AND LOANS TO BANKS
GROUP BANK
2011$’000
2010$’000
2011$’000
2010$’000
At fair value:
Certificate of deposits purchased (Trading) 231,789 – 231,789 –
Certificate of deposits purchased (Available-for-sale) 4,483,876 3,451,233 3,811,245 3,241,668
Forfaiting loans (Trading) 484 1,207 484 1,207
4,716,149 3,452,440 4,043,518 3,242,875
At amortised cost:
Placements with and loans to banks 17,392,038 10,538,190 12,682,638 6,399,705
Market bills purchased 4,862,982 4,329,195 4,759,605 4,012,559
Reverse repos 1,889,453 58,767 – 175,214
24,144,473 14,926,152 17,442,243 10,587,478
Balances with banks 28,860,622 18,378,592 21,485,761 13,830,353
Assets pledged (Note 44) (831,495) (218,069) (831,495) (218,069)
Bank balances of life assurance fund 585,450 408,109 – –
28,614,577 18,568,632 20,654,266 13,612,284

118 OCBC Annual Report 2011
25. PLACEMENTS WITH AND LOANS TO BANKS (continued)
GROUP BANK
2011$’000
2010 $’000
2011$’000
2010$’000
Balances with banks analysed:
By currency
Singapore Dollar 260,894 160,896 66,857 87,016
US Dollar 11,698,780 10,437,938 11,196,286 9,176,062
Malaysian Ringgit 1,118,778 1,167,637 151 111
Indonesian Rupiah 62,184 75,636 101 2
Japanese Yen 490,164 124,754 405,235 60,303
Hong Kong Dollar 688,384 1,001,157 683,736 997,996
British Pound 715,858 893,147 689,897 889,194
Australian Dollar 1,712,067 1,253,414 1,555,755 1,104,141
Euro 756,012 377,614 751,811 373,062
Others 11,357,501 2,886,399 6,135,932 1,142,466
28,860,622 18,378,592 21,485,761 13,830,353
By geography
Singapore 1,365,382 1,254,217 1,198,078 1,028,420
Malaysia 2,093,138 1,615,113 357,350 111
Rest of Southeast Asia 1,011,561 1,165,295 956,292 1,073,399
Greater China 18,714,267 8,378,204 13,779,204 6,114,556
Other Asia Pacific 2,992,268 2,149,944 2,903,719 2,001,530
Rest of the World 2,684,006 3,815,819 2,291,118 3,612,337
28,860,622 18,378,592 21,485,761 13,830,353
The analysis by geography is determined based on where the credit risk resides.
26. LOANS AND BILLS RECEIVABLE
GROUP BANK
2011$’000
2010 $’000
2011$’000
2010$’000
Gross loans 135,132,036 106,449,432 98,822,338 76,816,959
Specific allowances (Note 28) (302,383) (328,130) (106,340) (83,661)
Portfolio allowances (Note 29) (1,219,577) (1,094,529) (929,471) (856,047)
Net loans 133,610,076 105,026,773 97,786,527 75,877,251
Assets pledged (Note 44) (53,225) (37,566) – –
133,556,851 104,989,207 97,786,527 75,877,251
Bills receivable 11,312,408 4,276,900 9,182,377 3,268,862
Loans 122,297,668 100,749,873 88,604,150 72,608,389
Net loans 133,610,076 105,026,773 97,786,527 75,877,251
26.1 Analysed by currency
Singapore Dollar 61,198,143 54,849,816 59,834,591 53,776,464
US Dollar 35,716,290 18,937,578 27,932,634 13,619,328
Malaysian Ringgit 16,723,707 14,885,075 114 104
Indonesian Rupiah 4,464,640 3,551,212 – –
Japanese Yen 2,877,286 2,540,620 1,197,351 1,187,371
Hong Kong Dollar 5,592,007 3,985,801 4,375,942 3,338,955
British Pound 1,169,916 832,812 760,163 659,796
Australian Dollar 3,496,733 3,229,029 3,407,014 3,138,983
Euro 777,402 732,941 549,602 485,680
Others 3,115,912 2,904,548 764,927 610,278
135,132,036 106,449,432 98,822,338 76,816,959
Notes to the Financial Statements
For the financial year ended 31 December 2011

119OCBC Annual Report 2011
26. LOANS AND BILLS RECEIVABLE (continued)
GROUP BANK
2011$’000
2010 $’000
2011$’000
2010$’000
26.2 Analysed by product
Overdrafts 6,686,300 5,865,473 1,300,696 1,354,478
Short-term and revolving loans 20,172,859 16,303,150 10,760,554 9,670,599
Syndicated and term loans 53,777,005 41,713,193 44,062,514 33,476,570
Housing and commercial property loans 34,390,670 28,956,479 27,392,669 23,226,428
Car, credit card and share margin loans 2,711,093 3,001,736 2,027,198 2,092,801
Others 17,394,109 10,609,401 13,278,707 6,996,083
135,132,036 106,449,432 98,822,338 76,816,959
26.3 Analysed by industry
Agriculture, mining and quarrying 4,041,522 2,909,394 2,494,209 1,592,196
Manufacturing 8,424,119 7,057,076 3,457,550 2,544,515
Building and construction 20,365,431 18,532,273 16,109,518 15,342,228
Housing 32,075,535 27,076,124 25,462,979 21,532,350
General commerce 20,347,142 11,792,578 16,208,458 7,588,195
Transport, storage and communication 9,208,265 6,447,367 7,891,091 5,464,574
Financial institutions, investment and holding companies (1) 15,150,223 12,886,869 14,488,483 12,151,982
Professionals and individuals (1) 13,952,117 10,953,419 7,260,515 6,608,561
Others (1) 11,567,682 8,794,332 5,449,535 3,992,358
135,132,036 106,449,432 98,822,338 76,816,959
(1) Comparatives have been restated to conform to current year’s presentation.
26.4 Analysed by interest rate sensitivity
Fixed
Singapore 6,839,067 8,095,491 6,726,555 8,026,548
Malaysia 1,366,498 1,200,578 – 104
Rest of Southeast Asia 1,281,532 757,801 39,887 12,058
Greater China 2,224,825 8,519 2,200,890 140
Other Asia Pacific 267,651 207,905 267,652 207,905
Rest of the World 682 11,256 682 11,256
11,980,255 10,281,550 9,235,666 8,258,011
VariableSingapore 81,963,244 61,163,269 73,296,770 55,190,936
Malaysia 20,319,264 16,895,094 3,764,880 2,855,806
Rest of Southeast Asia 5,183,555 4,395,646 460,989 529,042
Greater China 9,849,327 8,634,382 6,232,804 4,906,772
Other Asia Pacific 4,066,815 3,642,402 4,061,653 3,639,303
Rest of the World 1,769,576 1,437,089 1,769,576 1,437,089
123,151,781 96,167,882 89,586,672 68,558,948
Total 135,132,036 106,449,432 98,822,338 76,816,959
The analysis by interest rate sensitivity is based on where the transactions are booked.
26.5 Analysed by geography
Singapore 68,259,948 59,967,267 66,647,296 58,750,222
Malaysia 21,063,792 17,080,330 2,926,056 1,795,177
Rest of Southeast Asia 10,953,853 6,884,367 4,263,909 1,792,446
Greater China 19,952,336 11,078,732 15,064,753 6,923,886
Other Asia Pacific 6,302,342 5,310,514 5,785,975 4,747,845
Rest of the World 8,599,765 6,128,222 4,134,349 2,807,383
135,132,036 106,449,432 98,822,338 76,816,959
The analysis by geography is determined based on where the credit risk resides.

120 OCBC Annual Report 2011
27. NON-PERFORMING LOANS (“NPLS”), DEBT SECURITIES AND CONTINGENTSNon-performing loans, debt securities and contingents are those classified as Substandard, Doubtful and Loss in accordance with MAS Notice 612.
$ million Substandard Doubtful Loss
Gross loans, securities and
contingentsSpecific
allowances
Net loans, securities and
contingents
GROUP
2011
Classified loans 796 240 136 1,172 (295) 877
Classified debt securities 101 9 1 111 (10) 101Classified contingents 95 56 3 154 (8) 146
Total classified assets 992 305 140 1,437 (313) 1,124
2010
Classified loans 616 193 186 995 (323) 672
Classified debt securities – 13 # 13 (13) #
Classified contingents 163 11 26 200 (3) 197
Total classified assets 779 217 212 1,208 (339) 869
BANK
2011
Classified loans 406 168 35 609 (102) 507
Classified debt securities 100 7 # 107 (7) 100Classified contingents 94 54 – 148 (4) 144
Total classified assets 600 229 35 864 (113) 751
2010
Classified loans 284 83 76 443 (83) 360
Classified debt securities – 7 – 7 (7) #
Classified contingents 163 – – 163 – 163
Total classified assets 447 90 76 613 (90) 523
(1) # represents amounts less than $0.5 million.
GROUP BANK
2011
$ million 2010
$ million2011
$ million2010
$ million
27.1 Analysed by period overdue
Over 180 days 512 511 191 104
Over 90 days to 180 days 85 98 45 49
30 days to 90 days 204 166 160 133
Less than 30 days 25 20 7 8
No overdue 611 413 461 319
1,437 1,208 864 613
27.2 Analysed by collateral type
Property 620 496 348 197
Fixed deposit 4 14 1 #
Stock and shares 89 16 # 13
Motor vehicles 2 3 2 2
Secured – Others 252 151 193 88
Unsecured – Corporate and other guarantees 236 237 235 236
Unsecured – Clean 234 291 85 77
1,437 1,208 864 613
(1) # represents amounts less than $0.5 million.
Notes to the Financial Statements
For the financial year ended 31 December 2011

121OCBC Annual Report 2011
27. NON-PERFORMING LOANS (“NPLS”), DEBT SECURITIES AND CONTINGENTS (continued)
GROUP BANK
2011
$ million 2010
$ million2011
$ million2010
$ million
27.3 Analysed by industry
Agriculture, mining and quarrying 6 7 # #
Manufacturing 378 399 245 228
Building and construction 317 192 178 97
Housing 188 190 75 78
General commerce 136 130 51 37
Transport, storage and communication 128 79 116 62
Financial institutions, investment and holding companies (1) 134 42 131 35
Professionals and individuals 114 139 64 73
Others (1) 36 30 4 3
1,437 1,208 864 613
(1) Comparatives have been restated to conform to current year’s presentation. (2) # represents amounts less than $0.5 million.
27.4 Analysed by geography
GROUP ($ million) Singapore MalaysiaRest of
the World Total
2011Substandard 205 462 325 992Doubtful 151 72 82 305Loss 34 46 60 140
390 580 467 1,437Specific allowances (71) (164) (78) (313)
319 416 389 1,124
2010Substandard 272 419 88 779 Doubtful 54 114 49 217 Loss 73 72 67 212
399 605 204 1,208 Specific allowances (43) (199) (97) (339)
356 406 107 869
Non-performing loans (“NPLs”), debt securities and contingents by geography are determined based on where the credit risk resides.
27.5 Restructured/renegotiated loans
Non-performing restructured loans by loan classification and the related specific allowances as at reporting date is shown below. The restructured loans as a percentage of total NPLs were 14.4% (2010: 17.0%) and 21.8% (2010: 28.1%) for the Group and the Bank respectively.
2011 2010
Amount$ million
Allowance$ million
Amount$ million
Allowance$ million
GROUPSubstandard 186 11 170 5
Doubtful 19 16 22 15 Loss 2 2 13 11
207 29 205 31
BANKSubstandard 174 9 158 1
Doubtful 15 12 14 12Loss # # # #
189 21 172 13
(1) # represents amounts less than $0.5 million.

122 OCBC Annual Report 2011
28. SPECIFIC ALLOWANCES
GROUP BANK2011$’000
2010$’000
2011$’000
2010$’000
At 1 January 328,130 453,990 83,661 193,900
Currency translation 2,869 (4,589) 339 (5,714)
Bad debts written off (101,341) (180,056) (35,793) (102,925)
Recovery of amounts previously provided for (49,479) (48,903) (32,028) (30,407)
Allowances for loans 128,517 106,276 92,737 33,873
Net allowances charged to income statements (Note 9) 79,038 57,373 60,709 3,466
Interest recognition on impaired loans (6,729) (15,056) (2,542) (5,066)
Acquisition of subsidiaries – 16,345 – –
Transfer from/(to) other accounts 416 123 (34) –
At 31 December (Note 26) 302,383 328,130 106,340 83,661
Analysed by industry
Cumulative specific allowances
Specific allowances charged/(write-back) to income statements
2011
$ million2010
$ million2011
$ million2010
$ million
GROUP
Agriculture, mining and quarrying 1 1 (#) (4)
Manufacturing 90 102 30 (7)
Building and construction 25 36 (9) 8
Housing 39 39 5 4
General commerce 47 59 9 1
Transport, storage and communication 15 10 7 1
Financial institutions, investment and holding companies 11 4 4 (1)
Professionals and individuals 51 58 30 13
Others 23 19 3 42
302 328 79 57
BANK
Agriculture, mining and quarrying # # (1) (3)
Manufacturing 43 28 30 (18)
Building and construction 4 3 1 (2)
Housing # 2 (3) (4)
General commerce 7 9 2 (6)
Transport, storage and communication 10 5 6 (3)
Financial institutions, investment and holding companies 11 4 4 (1)
Professionals and individuals 29 27 21 14
Others 2 6 1 26
106 84 61 3
(1) # represents amounts less than $0.5 million.
29. PORTFOLIO ALLOWANCES
GROUP BANK
2011$’000
2010$’000
2011$’000
2010$’000
At 1 January 1,094,529 998,490 856,047 799,154
Currency translation (1,901) (6,368) 896 (3,026)
Allowances charged to income statements (Note 9) 127,364 97,558 72,528 59,919
Acquisition of subsidiaries – 1,149 – –
Transfer (to)/from other accounts (415) 3,700 – –
At 31 December (Note 26) 1,219,577 1,094,529 929,471 856,047
Notes to the Financial Statements
For the financial year ended 31 December 2011

123OCBC Annual Report 2011
30. DEBT AND EQUITY SECURITIES
GROUP BANK
2011$’000
2010$’000
2011$’000
2010$’000
Trading securities
Quoted debt securities 1,420,376 1,166,440 1,038,387 1,012,046
Unquoted debt securities 483,736 500,305 280,515 377,094
Quoted equity securities 94,703 183,576 83,784 128,041
Quoted investment funds 757 2,412 404 1,887
Unquoted investment funds 43,190 1,583 43,190 –
2,042,762 1,854,316 1,446,280 1,519,068
Available-for-sale securities
Quoted debt securities 6,764,556 5,726,461 5,026,798 4,966,389
Unquoted debt securities 3,027,200 3,332,674 1,887,297 2,033,944
Quoted equity securities 2,694,921 2,671,252 984,399 1,035,238
Unquoted equity securities 234,187 220,333 49,414 44,583
Quoted investment funds 183,072 143,786 15,646 19,430
Unquoted investment funds 77,099 121,484 14,324 43,324
12,981,035 12,215,990 7,977,878 8,142,908
Securities classified as loans and receivables
Unquoted debt, at amortised cost 811,686 606,969 741,963 596,097
Allowance for impairment (Note 32) (7,085) (7,019) (6,824) (6,753)
Net carrying value 804,601 599,950 735,139 589,344
Total debt and equity securities
Debt securities – gross 12,507,554 11,332,849 8,974,960 8,985,570
Allowance for impairment (Note 32) (7,085) (7,019) (6,824) (6,753)
Debt securities – net 12,500,469 11,325,830 8,968,136 8,978,817
Equity securities 3,023,811 3,075,161 1,117,597 1,207,862
Investment funds 304,118 269,265 73,564 64,641
Total securities 15,828,398 14,670,256 10,159,297 10,251,320
Assets pledged (Note 44) (746,964) (415,704) (437,857) (415,704)
15,081,434 14,254,552 9,721,440 9,835,616
Debt securities analysis:
By credit rating
Investment grade (AAA to BBB) 7,790,806 7,624,090 5,964,527 6,149,061
Non-investment grade (BB to C) 239,208 194,658 214,466 164,480
Non-rated 4,470,455 3,507,082 2,789,143 2,665,276
12,500,469 11,325,830 8,968,136 8,978,817
By credit quality
Pass 12,399,580 11,149,282 8,867,450 8,802,003
Special mention – 176,773 – 176,773
Substandard 100,644 – 100,644 –
Doubtful 7,330 6,794 6,866 6,794
Loss – – – –
Allowance for impairment (Note 32) (7,085) (7,019) (6,824) (6,753)
12,500,469 11,325,830 8,968,136 8,978,817

124 OCBC Annual Report 2011
30. Debt anD equity securities (continued)
GrOuP banK
2011$’000
2010$’000
2011$’000
2010$’000
Debt and equity securities – concentration risks:
by industry
Agriculture, mining and quarrying 443,888 147,956 361,460 78,618
Manufacturing 1,389,955 1,250,781 590,919 612,577
Building and construction 1,444,350 1,362,591 1,031,834 965,875
General commerce 231,727 119,780 124,453 91,979
Transport, storage and communication 670,912 1,013,661 485,725 798,176
Financial institutions, investment and holding companies 9,885,261 9,129,813 6,871,704 7,024,344
Others 1,762,305 1,645,674 693,202 679,751
15,828,398 14,670,256 10,159,297 10,251,320
by issuer
Public sector 1,284,896 1,253,679 1,044,093 1,039,391
Banks 6,624,941 5,856,644 4,592,837 4,641,424
Corporations 7,664,369 7,267,610 4,484,598 4,499,952
Others 254,192 292,323 37,769 70,553
15,828,398 14,670,256 10,159,297 10,251,320
by geography
Singapore 4,351,971 4,646,780 2,821,259 3,146,906
Malaysia 1,866,345 1,431,806 453,951 379,898
Rest of Southeast Asia 474,244 265,411 175,871 30,980
Greater China 2,930,528 1,763,885 1,366,101 922,033
Other Asia Pacific 2,958,357 2,758,975 2,687,885 2,582,371
Rest of the World 3,246,953 3,803,399 2,654,230 3,189,132
15,828,398 14,670,256 10,159,297 10,251,320
Debt securities are 79% (2010: 77%) and 88% (2010: 88%) of total securities, for the Group and the Bank respectively. Included in debt securities is an amount of nil (2010: $0.05 billion) relating to collateralised debt with credit default swaps where the Bank acts as the protection seller. Derivative receivables and payables arising from these credit default swaps are included in Note 18.
31. Other assets
GrOuP banK
2011$’000
2010$’000
2011$’000
2010$’000
Interest receivable 705,015 623,888 475,878 461,492
Sundry debtors (net) 1,527,042 1,927,561 180,820 45,401
Deposits and prepayments 316,523 210,169 184,626 105,810
Others 642,859 354,864 345,404 215,357
3,191,439 3,116,482 1,186,728 828,060
At 31 December 2011, reinsurance assets included in “Others” amounted to $113.1 million (2010: $80.3 million).
notes to the Financial statements
For the financial year ended 31 December 2011

125OCBC Annual Report 2011
32. allOwances FOr imPairment OF securities anD Other assets
GrOuP ($’000)
Government and debt securities
Property, plant and
equipmentinvestment
propertyOtherassets total
At 1 January 2010 24,213 66,985 7,473 26,244 124,915
Currency translation (1,703) 276 63 (326) (1,690)
Amounts written off (12,661) – – (6,300) (18,961)
Write-back to income statements (Note 9) (2,830) (1) (303) (1,727) (4,861)
Transfers to other accounts – (64) (157) (4,415) (4,636)
At 31 December 2010/1 January 2011 7,019 67,196 7,076 13,476 94,767Currency translation 66 (255) (107) (14) (310)
Amounts written off – (31) (53) (1,034) (1,118)
(Write-back)/impairment charge to income statements (Note 9) – (699) (243) 17,036 16,094
Acquisition of a business – – – 6,157 6,157Transfers from/(to) other accounts – 217 (217) (45) (45)
At 31 December 2011 7,085 66,428 6,456 35,576 115,545
(Note 30) (Note 35) (Note 36)
banK ($’000)
associates and
subsidiaries
Government and debt securities
Property, plant and
equipmentinvestment
property Otherassets total
At 1 January 2010 14,084 21,953 949 5,001 1,030 43,017
Currency translation – (1,708) – 29 (12) (1,691)
Amounts written off (506) (12,661) – – – (13,167)
(Write-back)/impairment charge
to income statements (Note 9) – (831) (1) 27 619 (186)
Transfers to other accounts – – – (221) – (221)
At 31 December 2010/1 January 2011 13,578 6,753 948 4,836 1,637 27,752Currency translation – 71 – (68) 125 128
Amounts written off (8,291) – – (53) – (8,344)
Impairment charge to
income statements (Note 9) – – – – 3,442 3,442Transfers (to)/from other accounts – – (2) 2 (9) (9)
At 31 December 2011 5,287 6,824 946 4,717 5,195 22,969
(Notes 33-34) (Note 30) (Note 35) (Note 36)
33. assOciates anD jOint ventures
GrOuP banK
2011$’000
2010$’000
2011$’000
2010$’000
Unquoted equity securities, at cost 332,500 231,153 217,272 115,217
Allowance for impairment (Note 32) – – (2,199) (2,199)
Net carrying value 332,500 231,153 215,073 113,018
Share of post-acquisition reserves 27,525 22,123 – –
Amount due from associates (unsecured) 410 1,821 – –
360,435 255,097 215,073 113,018

126 OCBC Annual Report 2011
33. assOciates anD jOint ventures (continued)33.1 associatesThe summarised financial information of associates not adjusted for the proportion of ownership interest held by the Group is as follows:
$’000 2011 2010
at 31 December:
Assets 1,037,417 647,339
Liabilities (209,223) (178,132)
Contingent liabilities 1,176 –
For the year ended:
Total income 242,538 134,790
Profit/(loss) 58,938 19,633
Details of the significant associate of the Group are as follows:
effective % interest held
name of associate country of incorporation 2011 2010
unquoted
Network For Electronic Transfers (Singapore) Pte Ltd (1) Singapore 33 33
(1) Audited by PricewaterhouseCoopers.
33.2 joint ventures The Group holds 50% interest in Great Eastern Life Assurance (China) Company Limited (“GEL China”). The summarised financial information of GEL China based on the Group’s 50% interest is as follows:
$ million 2011 2010
at 31 December:
Share of current assets 141.1 134.3
Share of non-current assets 41.2 20.5
Share of current liabilities (32.1) (14.2)
Share of non-current liabilities (76.3) (62.4)
For the year ended:
Share of income 32.6 50.8
Share of expenses (41.1) (56.0)
34. subsiDiaries
banK
2011$’000
2010$’000
Investments in subsidiaries, at cost
Quoted security 1,895,642 2,198,964
Unquoted securities 3,794,156 3,649,048
Allowance for impairment (Note 32) (3,088) (11,379)
Net carrying value 5,686,710 5,836,633
Unsecured loans and receivables 5,706,918 3,024,597
Secured loans and receivables 1,068,200 1,073,200
Amount due from subsidiaries 6,775,118 4,097,797
Investments in and amount due from subsidiaries 12,461,828 9,934,430
At 31 December 2011, the fair values of the Group’s interests in its quoted subsidiaries, Great Eastern Holdings Limited and PT Bank OCBC NISP Tbk, were $5,190.3 million (2010: $6,412.1 million) and $918.6 million (2010: $1,157.7 million) respectively.
notes to the Financial statements
For the financial year ended 31 December 2011

127OCBC Annual Report 2011
34. subsiDiaries (continued)34.1 list of significant subsidiariesSignificant subsidiaries of the Group are as follows:
effective % interest held (3)
name of subsidiaries country of incorporation 2011 2010
banking
Singapore Island Bank Limited Singapore 100 100
Bank of Singapore Limited Singapore 100 100
OCBC Al-Amin Bank Berhad Malaysia 100 100
OCBC Bank (Malaysia) Berhad Malaysia 100 100
OCBC Bank (China) Limited People’s Republic of China 100 100
PT Bank OCBC NISP Tbk (1) (Note 34.2) Indonesia 85 82
PT Bank OCBC Indonesia (Note 34.2) Indonesia – 100
insurance
Great Eastern Life Assurance (Malaysia) Berhad (2) Malaysia 87 87
Overseas Assurance Corporation (Malaysia) Berhad (2) Malaysia 87 87
The Great Eastern Life Assurance Company Limited (2) Singapore 87 87
The Overseas Assurance Corporation Limited (2) Singapore 87 87
asset management and investment holding
Lion Global Investors Limited (2) Singapore 91 91
Great Eastern Holdings Limited (2) Singapore 87 87
PacificMas Berhad (2) Malaysia 64 64
stockbroking
OCBC Securities Private Limited Singapore 100 100
Unless otherwise indicated, the significant subsidiaries listed above are audited by KPMG LLP Singapore and its associated firms.(1) Audited by PricewaterhouseCoopers.(2) Audited by Ernst & Young.(3) Rounded to the nearest percentage.
34.2 acquisition of non-controlling interests On 1 January 2011, OCBC Bank completed the merger of its two licensed bank subsidiaries in Indonesia, PT Bank OCBC Indonesia (“BOI”) and PT Bank OCBC NISP Tbk. From that date, both subsidiaries have been combined and are operating as a merged bank named PT Bank OCBC NISP Tbk (“OCBC NISP”).
As a result of the merger, OCBC Bank received 1,215,094,637 new OCBC NISP shares. In addition, OCBC Bank purchased 12,273,683 new OCBC NISP shares issued to OCBC NISP itself as a result of the exchange of its 1% shareholding in BOI, at a consideration of approximately IDR18,460 million ($2.6 million). The Group’s shareholding in OCBC NISP has increased to 85.06% and the Group recognised an increase in non-controlling interests of $7.1 million, and a corresponding $7.1 million decrease in the revenue reserves.

128 OCBC Annual Report 2011
35. PrOPerty, Plant anD equiPment
2011 2010
GrOuP ($’000)Property-
relatedcomputer-
related Others totalProperty-
relatedcomputer-
related Others total
cost
At 1 January 1,462,406 976,754 397,347 2,836,507 1,411,892 860,786 364,230 2,636,908
Currency translation (5,025) (5,224) (1,585) (11,834) (340) 915 (1,825) (1,250)
Acquisition of a business/subsidiaries 4,913 150 311 5,374 – 18,139 16,998 35,137
Additions 16,192 173,514 47,840 237,546 13,245 112,300 31,789 157,334
Disposals and other transfers (23,772) (23,362) (9,583) (56,717) (2,440) (15,386) (13,845) (31,671)
Transfer from
investment property (Note 36) 2,846 – 1,451 4,297 40,049 – – 40,049
At 31 December 1,457,560 1,121,832 435,781 3,015,173 1,462,406 976,754 397,347 2,836,507
accumulated depreciation
At 1 January (294,960) (590,339) (259,275) (1,144,574) (262,043) (478,593) (220,313) (960,949)
Currency translation 927 3,403 1,184 5,514 550 (216) 1,756 2,090
Acquisition of subsidiaries – – – – – (11,799) (11,752) (23,551)
Disposals and other transfers 11,250 21,858 19,515 52,623 668 15,444 11,437 27,549
Depreciation charge (14,249) (101,912) (36,251) (152,412) (16,578) (88,225) (33,958) (138,761)
Depreciation charge to profit
from life assurance (Note 4) (13,683) (25,877) (5,553) (45,113) (13,551) (26,950) (6,445) (46,946)
Transfer to/(from)
investment property (Note 36) 19 – (932) (913) (4,006) – – (4,006)
At 31 December (310,696) (692,867) (281,312) (1,284,875) (294,960) (590,339) (259,275) (1,144,574)
accumulated impairment
losses (note 32)
At 1 January (65,856) (63) (1,277) (67,196) (65,660) (63) (1,262) (66,985)
Currency translation 244 – 11 255 (261) – (15) (276)
Disposals – – 31 31 – – – –
Write-back to income statements – – 699 699 1 – – 1
Transfer (from)/to investment
property (Note 36) (217) – – (217) 64 – – 64
At 31 December (65,829) (63) (536) (66,428) (65,856) (63) (1,277) (67,196)
net carrying value, at 31 December 1,081,035 428,902 153,933 1,663,870 1,101,590 386,352 136,795 1,624,737
Freehold property 309,890 322,381
Leasehold property 771,145 779,209
net carrying value 1,081,035 1,101,590
market value 2,236,041 1,957,448
notes to the Financial statements
For the financial year ended 31 December 2011

129OCBC Annual Report 2011
35. PrOPerty, Plant anD equiPment (continued)
2011 2010
banK ($’000)Property-
relatedcomputer-
related Others totalProperty-
relatedcomputer-
related Others total
cost
At 1 January 258,836 407,672 111,238 777,746 260,951 353,721 106,573 721,245
Currency translation (19) 2 29 12 8 (80) (450) (522)
Additions – 107,201 11,360 118,561 – 58,078 9,428 67,506
Disposals – (8,128) (6,485) (14,613) – (4,047) (4,313) (8,360)
Transfer to investment property (Note 36) (13,020) – – (13,020) (2,123) – – (2,123)
At 31 December 245,797 506,747 116,142 868,686 258,836 407,672 111,238 777,746
accumulated depreciation
At 1 January (59,074) (244,798) (72,299) (376,171) (55,137) (190,496) (66,118) (311,751)
Currency translation 9 (6) (21) (18) (4) 59 196 251
Disposals – 8,121 5,990 14,111 – 4,041 4,225 8,266
Depreciation charge (4,726) (68,135) (10,845) (83,706) (4,939) (58,402) (10,602) (73,943)
Transfer to investment property (Note 36) 3,333 – – 3,333 1,006 – – 1,006
At 31 December (60,458) (304,818) (77,175) (442,451) (59,074) (244,798) (72,299) (376,171)
accumulated impairment
losses (note 32)
At 1 January (948) – – (948) (949) – – (949)
Write-back to income statements – – – – 1 – – 1
Transfer to investment property (Note 36) 2 – – 2 – – – –
At 31 December (946) – – (946) (948) – – (948)
net carrying value, at 31 December 184,393 201,929 38,967 425,289 198,814 162,874 38,939 400,627
Freehold property 37,092 44,408
Leasehold property 147,301 154,406
net carrying value 184,393 198,814
market value 354,618 332,801

130 OCBC Annual Report 2011
36. investment PrOPerty
GrOuP banK
2011$’000
2010$’000
2011$’000
2010$’000
cost
At 1 January 910,346 939,724 639,841 630,302
Currency translation 2,236 (3,194) 83 (1,582)
Additions 13,344 25,849 13,016 16,136
Acquisition of a business/subsidiary 203,329 – – –
Disposals (965) (2,410) (180) –
Transfer (to)/from:
Property, plant and equipment (Note 35) (4,297) (40,049) 13,020 2,123
Assets held for sale (4,362) (9,574) – (7,138)
At 31 December 1,119,631 910,346 665,780 639,841
accumulated depreciation
At 1 January (170,377) (166,884) (81,518) (76,213)
Currency translation (158) 543 (73) 459
Acquisition of a subsidiary (8,026) – – –
Disposals 782 1,845 34 –
Depreciation charge (14,025) (12,818) (7,256) (7,135)
Transfer (from)/to:
Property, plant and equipment (Note 35) 913 4,006 (3,333) (1,006)
Assets held for sale 51 2,931 – 2,377
At 31 December (190,840) (170,377) (92,146) (81,518)
accumulated impairment losses (note 32)
At 1 January (7,076) (7,473) (4,836) (5,001)
Currency translation 107 (63) 68 (29)
Disposals 53 – 53 –
Write-back/(impairment charge) to income statements 243 303 – (27)
Transfer to/(from):
Property, plant and equipment (Note 35) 217 (64) (2) –
Assets held for sale – 221 – 221
At 31 December (6,456) (7,076) (4,717) (4,836)
net carrying value
Freehold property 348,796 331,938 174,897 157,108
Leasehold property 573,539 400,955 394,020 396,379
At 31 December 922,335 732,893 568,917 553,487
market value 2,800,977 2,420,216 1,406,036 1,280,704
notes to the Financial statements
For the financial year ended 31 December 2011
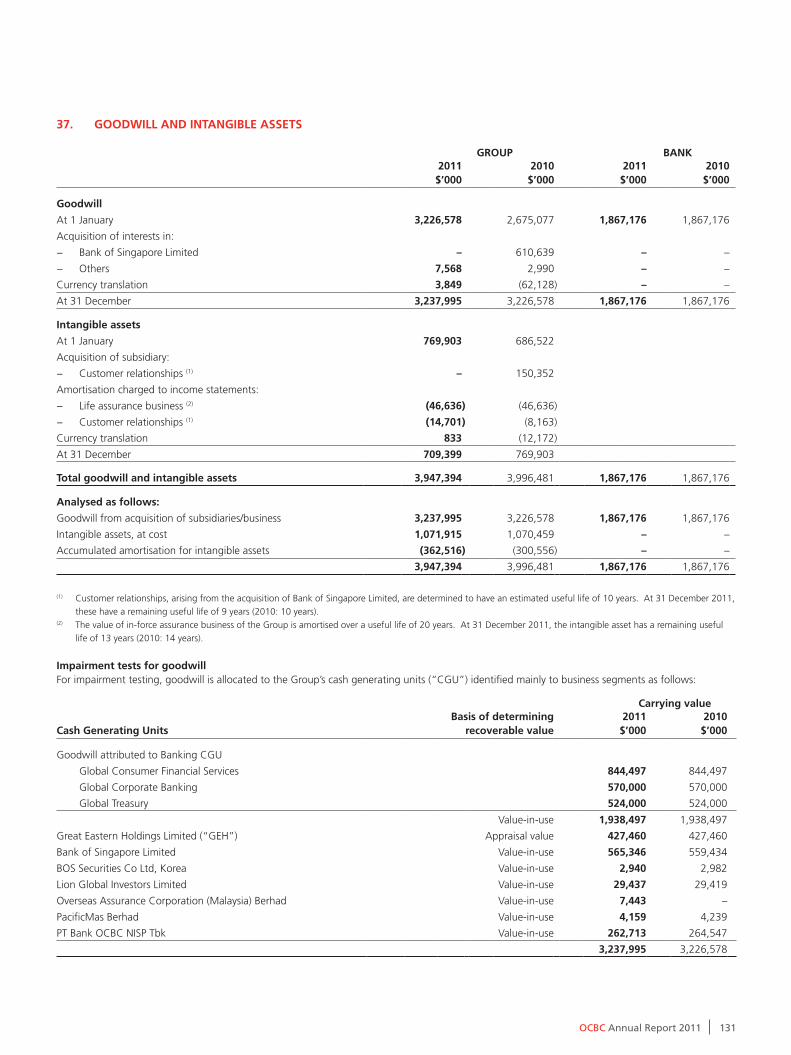
131OCBC Annual Report 2011
37. GOODwill anD intanGible assets
GrOuP banK
2011$’000
2010$’000
2011$’000
2010$’000
Goodwill
At 1 January 3,226,578 2,675,077 1,867,176 1,867,176
Acquisition of interests in:
− Bank of Singapore Limited – 610,639 – –
− Others 7,568 2,990 – –
Currency translation 3,849 (62,128) – –
At 31 December 3,237,995 3,226,578 1,867,176 1,867,176
intangible assets
At 1 January 769,903 686,522
Acquisition of subsidiary:
− Customer relationships (1) – 150,352
Amortisation charged to income statements:
− Life assurance business (2) (46,636) (46,636)
− Customer relationships (1) (14,701) (8,163)
Currency translation 833 (12,172)
At 31 December 709,399 769,903
total goodwill and intangible assets 3,947,394 3,996,481 1,867,176 1,867,176
analysed as follows:
Goodwill from acquisition of subsidiaries/business 3,237,995 3,226,578 1,867,176 1,867,176
Intangible assets, at cost 1,071,915 1,070,459 – –
Accumulated amortisation for intangible assets (362,516) (300,556) – –
3,947,394 3,996,481 1,867,176 1,867,176
(1) Customer relationships, arising from the acquisition of Bank of Singapore Limited, are determined to have an estimated useful life of 10 years. At 31 December 2011,
these have a remaining useful life of 9 years (2010: 10 years). (2) The value of in-force assurance business of the Group is amortised over a useful life of 20 years. At 31 December 2011, the intangible asset has a remaining useful
life of 13 years (2010: 14 years).
impairment tests for goodwill For impairment testing, goodwill is allocated to the Group’s cash generating units (“CGU”) identified mainly to business segments as follows:
carrying value
cash Generating units basis of determining
recoverable value2011$’000
2010$’000
Goodwill attributed to Banking CGU
Global Consumer Financial Services 844,497 844,497
Global Corporate Banking 570,000 570,000
Global Treasury 524,000 524,000
Value-in-use 1,938,497 1,938,497
Great Eastern Holdings Limited (“GEH”) Appraisal value 427,460 427,460
Bank of Singapore Limited Value-in-use 565,346 559,434
BOS Securities Co Ltd, Korea Value-in-use 2,940 2,982
Lion Global Investors Limited Value-in-use 29,437 29,419
Overseas Assurance Corporation (Malaysia) Berhad Value-in-use 7,443 –
PacificMas Berhad Value-in-use 4,159 4,239
PT Bank OCBC NISP Tbk Value-in-use 262,713 264,547
3,237,995 3,226,578

132 OCBC Annual Report 2011
37. GOODwill anD intanGible assets (continued)The value-in-use calculations apply a discounted cash flow model using cash flow projections based on financial budgets and forecasts approved by management covering a five-year period. The discount rates applied to the cash flow projections are derived from the pre-tax weighted average cost of capital plus a reasonable risk premium at the date of assessment of the respective CGU. For 2011, the discount rates used ranged from 10.2% to 12.4% (2010: 10.2% to 12.8%). Cash flows beyond the fifth year are extrapolated using the estimated terminal growth rates (weighted average growth rate to extrapolate cash flows beyond the projected years). The terminal growth rates ranged from 2.0% to 5.0% (2010: 2.0% to 5.0%). The terminal growth rate for each CGU used does not exceed management’s expectation of the long term average growth rate of the respective industry and country in which the CGU operates.
For the insurance CGU, the Group applies the appraisal value technique for its value-in-use calculation. This technique is commonly used to determine the economic value of an insurance business, which comprises two components: embedded value of in-force business and existing structural value (value of future sales). The embedded value of the life assurance business is the present value of projected distributable profits (cash flows) of the in-force business. The cash flows represent a deterministic approach based on assumptions as to future operating experience discounted at a risk adjusted rate of 8.0% (2010: 8.0%) and 9.5% (2010: 9.5%) for Singapore and Malaysia respectively. The assumptions take into account the recent experience of, and expected future outlook for the life assurance business of the CGU. Investment returns assumed are based on long term strategic asset mix and their expected future returns. The existing structural value is the value of projected distributable profits from new businesses, which is calculated based on new businesses sold for the nine months ended up to 30 September and applying a new business multiplier to the value of future sales. The returns assumed, after investment expenses, are 5.25%, 4.0% and 7.0% (2010: 5.25%, 4.0% and 7.0%) for Singapore’s participating fund, non-participating fund and linked fund respectively and 6.0%, 5.0% and 7.0% (2010: 6.0%, 5.1% and 7.0%) for Malaysia’s participating fund, non-participating fund and linked fund respectively.
38. seGment inFOrmatiOn38.1 business segments
$ million
Global consumer
Financial services
Global corporate
bankingGlobal
treasury insurance Others elimination Group
year ended 31 December 2011
total income 1,303 2,326 1,062 672 854 (556) 5,661
Operating profit before allowances and amortisation 532 1,654 785 488 294 (522) 3,231
Amortisation of intangible assets – – – (47) (14) – (61)
(Allowances and impairment)/
write-back for loans and other assets (64) (154) (5) (4) 6 – (221)
Operating profit after allowances and amortisation 468 1,500 780 437 286 (522) 2,949
Other information:
Capital expenditure 12 9 # 42 188 251
Depreciation 21 13 1 3 128 166
at 31 December 2011
Segment assets 39,151 91,861 63,959 56,579 41,681 293,231
Unallocated assets 71
Elimination (15,544)
total assets 277,758
Segment liabilities 48,350 82,544 47,366 50,227 37,502 265,989
Unallocated liabilities 1,923
Elimination (15,544)
total liabilities 252,368
Other information:
Gross non-bank loans 37,891 83,931 1,287 373 11,650 135,132
NPAs (include debt securities) 250 1,122 – 3 62 1,437
(1) # represents amounts less than $0.5 million.
notes to the Financial statements
For the financial year ended 31 December 2011

133OCBC Annual Report 2011
38. seGment inFOrmatiOn (continued)38.1 business segments (continued)
$ million
Global consumer
Financial services
Global corporate
bankingGlobal
treasury insurance Others elimination Group
year ended 31 December 2010
total income 1,232 1,895 828 774 1,088 (492) 5,325
Operating profit before allowances and amortisation 548 1,295 581 615 499 (467) 3,071
Amortisation of intangible assets – – – (47) (8) – (55)
(Allowances and impairment)/
write-back for loans and other assets (23) (30) 1 (4) (78) – (134)
Operating profit after allowances and amortisation 525 1,265 582 564 413 (467) 2,882
Other information:
Capital expenditure 10 6 # 38 129 183
Depreciation 22 13 1 2 114 152
at 31 December 2010
Segment assets 32,902 74,434 47,218 54,467 31,448 240,469
Unallocated assets 101
Elimination (11,287)
total assets 229,283
Segment liabilities 43,411 59,638 36,177 47,961 27,867 215,054
Unallocated liabilities 1,871
Elimination (11,287)
total liabilities 205,638
Other information:
Gross non-bank loans 31,703 64,294 1,567 174 8,711 106,449
NPAs (include debt securities) 255 885 – 7 61 1,208
(1) # represents amounts less than $0.5 million.
OCBC Group is organised along four groupings covering customers, products, support functions and geography. Customer, product and support function heads have global responsibility for their respective areas, while geographic heads have stewardship responsibility. For the purpose of financial reporting of business segment results, the Group’s businesses are presented under five main segments representing the key customer and product groups: Global Consumer Financial Services, Global Corporate Banking, Global Treasury, Insurance and Others.
Global consumer Financial servicesGlobal Consumer Financial Services comprises a full range of products and services offered to individuals, including deposit products (checking accounts, savings and fixed deposits), consumer loans (housing loans and other personal loans), credit cards and wealth management products (unit trusts, bancassurance products and structured deposits).
Global corporate bankingGlobal Corporate Banking serves business customers, ranging from large corporates and the public sector to small and medium enterprises. The products and services offered include long-term loans such as project financing, short-term credit such as overdrafts and trade financing, deposit accounts and fee-based services such as cash management and custodian services.
Global treasuryGlobal Treasury engages in foreign exchange activities, money market operations, fixed income and derivatives trading, and also offers structured treasury products and financial solutions to meet customers’ investment and hedging needs.

134 OCBC Annual Report 2011
38. seGment inFOrmatiOn (continued)38.1 business segments (continued)insuranceThe Group’s insurance business, including its fund management activities, is carried out by the Bank’s subsidiary GEH, which provides both life and general insurance products to its customers mainly in Singapore and Malaysia.
Others The “Others” segment comprises PacificMas Berhad, Bank of Singapore, corporate finance, capital markets, property holding, stock brokerage and investment holding.
The business segment information is prepared based on internal management reports, which are used by senior management for decision-making and performance management. The following management reporting methodologies are adopted:(a) income and expenses are attributable to each segment based on the internal management reporting policies;(b) in determining the segment results, balance sheet items are internally transfer priced; and(c) transactions between business segments are recorded within the segment as if they are third party transactions and are eliminated
on consolidation.
Where there are material changes in the organisational structure and management reporting methodologies, segment information for prior periods is restated to allow comparability. There are no material items of income or expense between the business segments. Segment assets and liabilities comprise operating assets and liabilities, being the majority of the balance sheet and excluding items such as income tax and borrowings.
38.2 Geographical segments
$ milliontotal
income
Profit/(loss) before
income taxcapital
expendituretotal
assetstotal
liabilities
2011
Singapore 3,444 1,771 179 173,522 166,407
Malaysia 1,220 750 42 53,327 44,498
Rest of Southeast Asia 435 123 21 9,962 8,276
Greater China 387 195 9 28,878 20,403
Other Asia Pacific 122 94 # 7,854 5,956
Rest of the World 53 22 # 4,215 6,828
5,661 2,955 251 277,758 252,368
2010
Singapore 3,350 1,958 127 145,864 138,092
Malaysia 1,233 768 29 47,673 41,293
Rest of Southeast Asia 389 60 20 8,550 6,885
Greater China 216 34 4 17,263 12,532
Other Asia Pacific 95 53 1 6,987 3,735
Rest of the World 42 7 2 2,946 3,101
5,325 2,880 183 229,283 205,638
(1) # represents amounts less than $0.5 million.
The Group’s operations are in six main geographical areas. With the exception of Singapore and Malaysia, no other individual country contributed more than 10% of consolidated total income and total assets. The geographical information is prepared based on the country in which the transactions are booked. It would not be materially different if it is based on the country in which the counterparty or assets are located. The geographical information is stated after elimination of intra-group transactions and balances.
notes to the Financial statements
For the financial year ended 31 December 2011

135OCBC Annual Report 2011
39. Financial risK manaGement39.1 OverviewThe objective of the Group’s risk management practice is to drive the business through an integrated proactive risk management approach with strong risk analytics, while protecting the Group against losses that could arise from taking risks beyond its risk appetite. The Group’s philosophy is that all risks must be properly understood, measured, monitored, controlled and managed. In addition, risk management processes must be closely aligned to the Group’s business strategy, to enable the Group to maximise its risk-adjusted return on capital.
The Group’s risk management objectives, policies and processes are detailed in the Risk Management Section.
39.2 credit risk maximum exposure to credit risk The following table presents the Group’s maximum exposure to credit risk of on-balance sheet and off-balance sheet financial instruments, without taking into account of any collateral held or other credit enhancements. For on-balance sheet assets, the exposure to credit risk equals their carrying amount. For contingent liabilities, the maximum exposure to credit risk is the maximum amount that the Group would have to pay if the obligations of the instruments issued are called upon. For credit commitments, the maximum exposure to credit risk is the full amount of the undrawn credit facilities granted to customers.
Gross average
$ million 2011 2010 2011 2010
credit risk exposure of on-balance sheet assets:
Loans and bills receivable 133,557 104,989 118,695 94,056
Placements with and loans to banks 28,615 18,569 25,786 17,526
Government treasury bills and securities 20,647 17,101 18,029 17,328
Debt securities 11,754 10,910 11,231 10,339
Amount due from associates # 2 1 2
Assets pledged 1,839 746 1,191 450
Derivative receivables 5,899 4,837 5,665 4,789
Other assets, comprise interest receivables and sundry debtors 2,232 2,551 2,656 2,684
204,543 159,705 183,254 147,174
credit risk exposure of off-balance sheet items:
Contingent liabilities 10,345 8,513 9,410 7,809
Credit commitments 63,577 54,749 58,408 50,960
73,922 63,262 67,818 58,769
total maximum credit risk exposure 278,465 222,967 251,072 205,943
(1) # represents amounts less than $0.5 million.
collateralsThe main types of collateral obtained by the Group are as follows:• For personal housing loans, mortgages over residential properties;• For commercial property loans, charges over the properties being financed;• For car loans, charges over the vehicles financed;• For share margin financing, listed securities including those of Singapore, Malaysia and Hong Kong; and• For other loans, charges over business assets such as premises, inventories, trade receivables or deposits.

136 OCBC Annual Report 2011
39. Financial risK manaGement (continued)39.2 credit risk (continued)total loans and advances – credit quality In addition to the credit grading of facilities under MAS Notice 612, loans and advances are required, under FRS 107, to be categorised into “neither past due nor impaired”, “past due but not impaired” and “impaired”. Past due loans refer to loans that are overdue by one day or more. Impaired loans are classified loans with specific allowances made.
bank loans non-bank loans
$ million 2011 2010 2011 2010
Neither past due nor impaired 28,861 18,379 133,645 105,000
Not impaired – – 593 628
Impaired – – 544 613
Past due loans – – 1,137 1,241
Impaired but not past due – – 350 209
Gross loans 28,861 18,379 135,132 106,450
Specific allowances – – (302) (328)
Portfolio allowances – – (1,220) (1,095)
net loans 28,861 18,379 133,610 105,027
loans neither past due nor impairedAnalysis of loans and advances that are neither past due nor impaired analysed based on the Group’s internal credit grading system is as follows:
bank loans non-bank loans
$ million 2011 2010 2011 2010
Grades
Satisfactory and special mention 28,861 18,379 133,487 104,944
Substandard but not impaired – – 158 56
neither past due nor impaired 28,861 18,379 133,645 105,000
Past due loansAnalysis of past due loans by industry and geography are as follows:
bank loans non-bank loans
$ million 2011 2010 2011 2010
by industry
Agriculture, mining and quarrying – – 9 35
Manufacturing – – 249 245
Building and construction – – 62 64
General commerce – – 113 154
Transport, storage and communication – – 28 28
Financial institutions, investment and holding companies – – 3 15
Professionals and individuals (include housing) – – 628 623
Others – – 45 77
– – 1,137 1,241
by geography
Singapore – – 401 359
Malaysia – – 523 600
Rest of the World – – 213 282
– – 1,137 1,241
notes to the Financial statements
For the financial year ended 31 December 2011
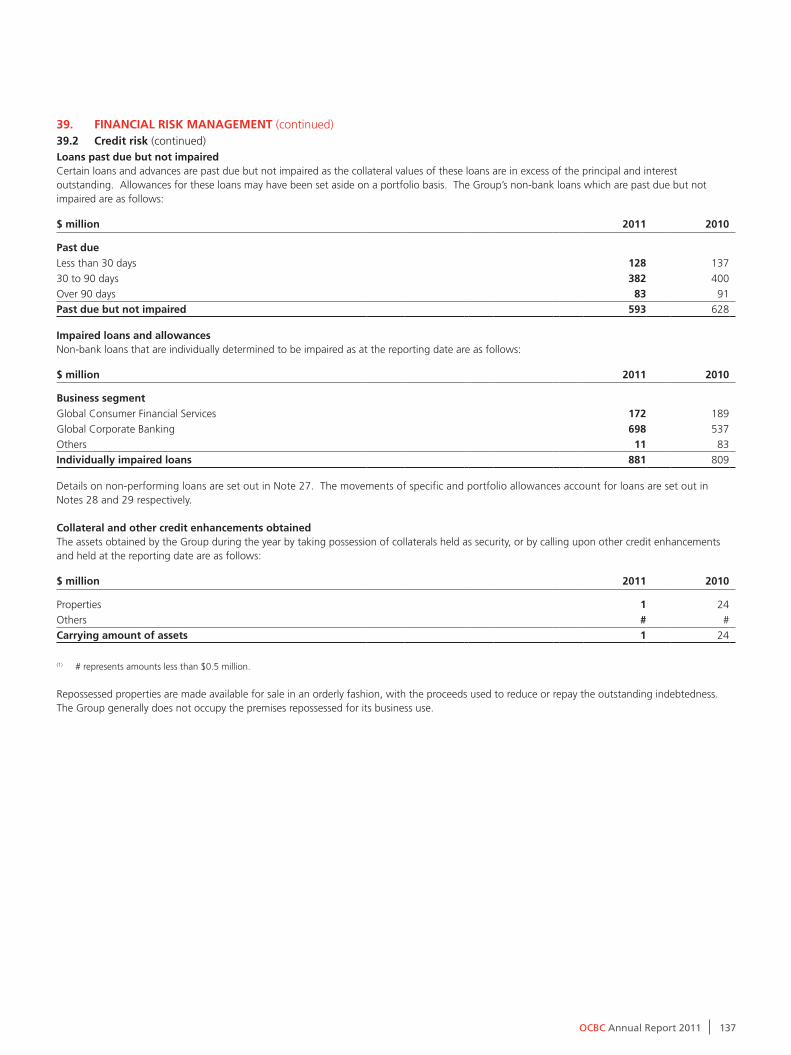
137OCBC Annual Report 2011
39. Financial risK manaGement (continued)39.2 credit risk (continued)loans past due but not impaired Certain loans and advances are past due but not impaired as the collateral values of these loans are in excess of the principal and interest outstanding. Allowances for these loans may have been set aside on a portfolio basis. The Group’s non-bank loans which are past due but not impaired are as follows:
$ million 2011 2010
Past due
Less than 30 days 128 137
30 to 90 days 382 400
Over 90 days 83 91
Past due but not impaired 593 628
impaired loans and allowancesNon-bank loans that are individually determined to be impaired as at the reporting date are as follows:
$ million 2011 2010
business segment
Global Consumer Financial Services 172 189
Global Corporate Banking 698 537
Others 11 83
individually impaired loans 881 809
Details on non-performing loans are set out in Note 27. The movements of specific and portfolio allowances account for loans are set out in Notes 28 and 29 respectively.
collateral and other credit enhancements obtainedThe assets obtained by the Group during the year by taking possession of collaterals held as security, or by calling upon other credit enhancements and held at the reporting date are as follows:
$ million 2011 2010
Properties 1 24
Others # #
carrying amount of assets 1 24
(1) # represents amounts less than $0.5 million.
Repossessed properties are made available for sale in an orderly fashion, with the proceeds used to reduce or repay the outstanding indebtedness. The Group generally does not occupy the premises repossessed for its business use.

138 OCBC Annual Report 2011
39. Financial risK manaGement (continued)39.2 credit risk (continued)country risk The Group’s country risk framework covers the assessment and rating of countries, as well as the maximum cross-border transfer risk limit granted to any one country based on its risk rating. The risk covers all cross-border transactions including onshore non-local currency transactions. Limits are allocated into maturity time-bands and vary according to the risk rating of the country and the political and economic outlook. Cross-border transfer risk exposures of more than 1% of assets were as follows:
$ million banks
Governmentand officialinstitutions
loans to financial
institutions and customers
total exposure
as % of assets
exposure (1)
31 December 2011
People’s Republic of China 13,034 289 2,323 15,646 6.8
Malaysia 2,902 17 4,295 7,214 3.2
Hong Kong SAR 2,646 – 4,660 7,306 3.2
Indonesia 1,646 285 4,237 6,168 2.7
United Kingdom 3,435 – 711 4,146 1.8
British Virgin Islands – – 4,133 4,133 1.8
United States 1,159 – 2,528 3,687 1.6
Australia 2,514 – 665 3,179 1.4
31 December 2010
People’s Republic of China 5,516 9 1,909 7,434 4.1
Malaysia 2,221 – 3,343 5,564 3.1
Indonesia 1,562 569 2,513 4,644 2.6
Hong Kong SAR 1,823 – 2,495 4,318 2.4
United States 1,279 265 2,277 3,821 2.1
United Kingdom 2,488 41 553 3,082 1.7
British Virgin Islands – – 2,823 2,823 1.6
Australia 1,485 132 613 2,230 1.2
(1) Assets (excluding life assurance fund investment assets) of $228,669 million (2010: $181,797 million).
39.3 market risk and asset liability managementDisclosures on the Group’s market risk management, and the Value-at-Risk (“VaR”) summary of its trading portfolio, are in the Risk Management Section.
The Group’s Asset Liability Management framework consists of three components:• Structural interest rate risk management;• Structural foreign exchange risk management; and• Liquidity management.
The objectives, policies and processes of asset liability management are in the Risk Management Section.
notes to the Financial statements
For the financial year ended 31 December 2011
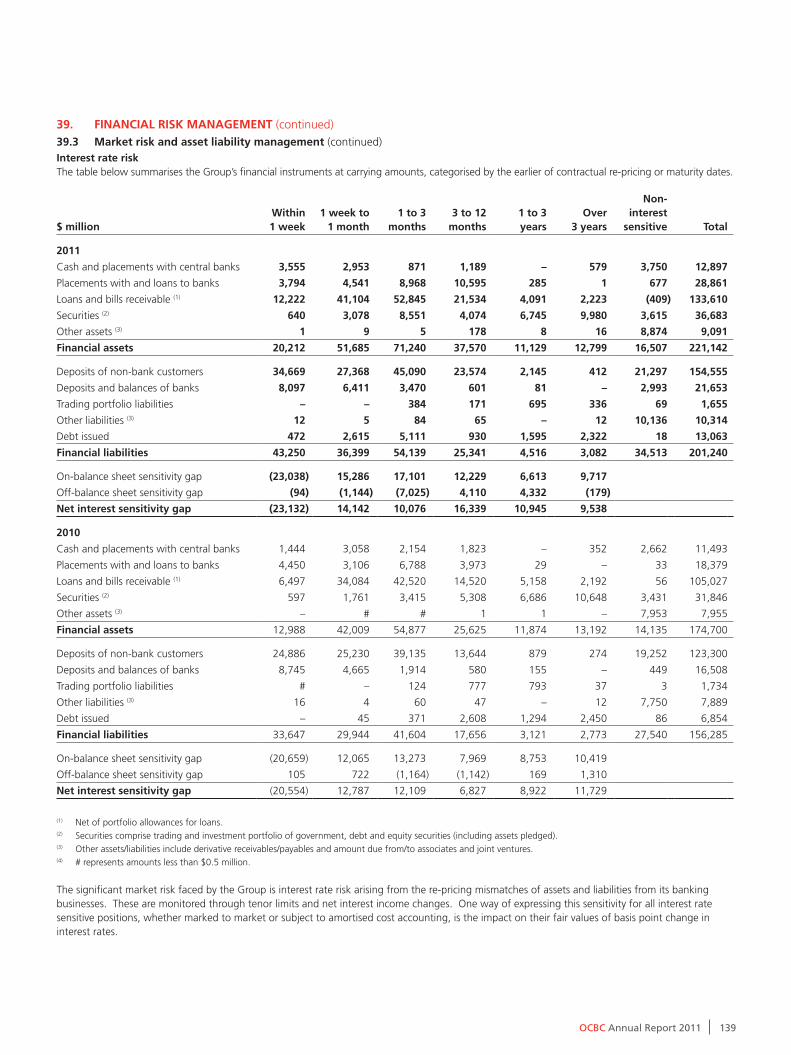
139OCBC Annual Report 2011
39. Financial risK manaGement (continued)
39.3 market risk and asset liability management (continued)interest rate risk The table below summarises the Group’s financial instruments at carrying amounts, categorised by the earlier of contractual re-pricing or maturity dates.
$ millionwithin 1 week
1 week to1 month
1 to 3months
3 to 12months
1 to 3 years
Over3 years
non-interest
sensitive total
2011
Cash and placements with central banks 3,555 2,953 871 1,189 – 579 3,750 12,897
Placements with and loans to banks 3,794 4,541 8,968 10,595 285 1 677 28,861
Loans and bills receivable (1) 12,222 41,104 52,845 21,534 4,091 2,223 (409) 133,610
Securities (2) 640 3,078 8,551 4,074 6,745 9,980 3,615 36,683
Other assets (3) 1 9 5 178 8 16 8,874 9,091
Financial assets 20,212 51,685 71,240 37,570 11,129 12,799 16,507 221,142
Deposits of non-bank customers 34,669 27,368 45,090 23,574 2,145 412 21,297 154,555
Deposits and balances of banks 8,097 6,411 3,470 601 81 – 2,993 21,653
Trading portfolio liabilities – – 384 171 695 336 69 1,655
Other liabilities (3) 12 5 84 65 – 12 10,136 10,314
Debt issued 472 2,615 5,111 930 1,595 2,322 18 13,063
Financial liabilities 43,250 36,399 54,139 25,341 4,516 3,082 34,513 201,240
On-balance sheet sensitivity gap (23,038) 15,286 17,101 12,229 6,613 9,717
Off-balance sheet sensitivity gap (94) (1,144) (7,025) 4,110 4,332 (179)
net interest sensitivity gap (23,132) 14,142 10,076 16,339 10,945 9,538
2010
Cash and placements with central banks 1,444 3,058 2,154 1,823 – 352 2,662 11,493
Placements with and loans to banks 4,450 3,106 6,788 3,973 29 – 33 18,379
Loans and bills receivable (1) 6,497 34,084 42,520 14,520 5,158 2,192 56 105,027
Securities (2) 597 1,761 3,415 5,308 6,686 10,648 3,431 31,846
Other assets (3) – # # 1 1 – 7,953 7,955
Financial assets 12,988 42,009 54,877 25,625 11,874 13,192 14,135 174,700
Deposits of non-bank customers 24,886 25,230 39,135 13,644 879 274 19,252 123,300
Deposits and balances of banks 8,745 4,665 1,914 580 155 – 449 16,508
Trading portfolio liabilities # – 124 777 793 37 3 1,734
Other liabilities (3) 16 4 60 47 – 12 7,750 7,889
Debt issued – 45 371 2,608 1,294 2,450 86 6,854
Financial liabilities 33,647 29,944 41,604 17,656 3,121 2,773 27,540 156,285
On-balance sheet sensitivity gap (20,659) 12,065 13,273 7,969 8,753 10,419
Off-balance sheet sensitivity gap 105 722 (1,164) (1,142) 169 1,310
net interest sensitivity gap (20,554) 12,787 12,109 6,827 8,922 11,729
(1) Net of portfolio allowances for loans.(2) Securities comprise trading and investment portfolio of government, debt and equity securities (including assets pledged).(3) Other assets/liabilities include derivative receivables/payables and amount due from/to associates and joint ventures.(4) # represents amounts less than $0.5 million.
The significant market risk faced by the Group is interest rate risk arising from the re-pricing mismatches of assets and liabilities from its banking businesses. These are monitored through tenor limits and net interest income changes. One way of expressing this sensitivity for all interest rate sensitive positions, whether marked to market or subject to amortised cost accounting, is the impact on their fair values of basis point change in interest rates.

140 OCBC Annual Report 2011
39. Financial risK manaGement (continued)
39.3 market risk and asset liability management (continued)interest rate risk (continued)The Bank’s interest rate risk is monitored using a variety of risk metrics at a frequency that is commensurate with the changes in structural risk profile. The impact on net interest income of the banking book is simulated under various interest rate scenarios and assumptions. Based on a 100 bp parallel rise in yield curves on the Group’s exposure to major currencies i.e. Singapore Dollar, US Dollar and Malaysian Ringgit, net interest income is estimated to increase by $298 million (2010: $236 million). The corresponding impact from a 100 bp decrease is an estimated reduction of $146 million (2010: $84 million) in net interest income. As a percentage of reported net interest income, the maximum exposure for significant currencies would be -4.4% (2010: -2.8%).
The 1% rate shock impact on net interest income is based on simplified scenarios, using the Group’s interest rate risk profile as at reporting date. It does not take into account actions that would be taken by Global Treasury or the business units to mitigate the impact of this interest rate risk. In reality, Global Treasury seeks proactively to change the interest rate risk profile to minimise losses and maximise net revenues. The projection assumes that interest rates of all maturities move by the same amount and, therefore, do not reflect the potential impact on net interest income of some rates changing while others remain unchanged. The projections also assume a constant balance sheet position and that all positions run to maturity.
currency riskThe Group’s foreign exchange position by major currencies is shown below. “Others” include mainly Indonesian Rupiah, Chinese Renminbi, Australian Dollar, Euro, Japanese Yen, Sterling Pound and Hong Kong Dollar.
$ million sGD usD myr Others total
2011
Cash and placements with central banks 4,887 723 3,328 3,959 12,897
Placements with and loans to banks 261 11,699 1,119 15,782 28,861
Loans and bills receivable 60,277 35,660 16,365 21,308 133,610
Securities (1) 18,287 3,908 3,509 10,979 36,683
Other assets (2) 5,185 1,904 827 1,175 9,091
Financial assets 88,897 53,894 25,148 53,203 221,142
Deposits of non-bank customers 80,236 21,969 19,128 33,222 154,555
Deposits and balances of banks 1,086 11,934 444 8,189 21,653
Trading portfolio liabilities 1,586 16 – 53 1,655
Other liabilities (2) 5,938 2,037 952 1,387 10,314
Debt issued 1,285 6,873 1,340 3,565 13,063
Financial liabilities 90,131 42,829 21,864 46,416 201,240
net financial (liabilities)/assets exposure (1,234) 11,065 3,284 6,787
2010
Cash and placements with central banks 5,276 50 3,227 2,940 11,493
Placements with and loans to banks 161 10,438 1,168 6,612 18,379
Loans and bills receivable 54,003 18,895 14,530 17,599 105,027
Securities (1) 16,347 3,721 2,628 9,150 31,846
Other assets (2) 4,535 1,553 927 940 7,955
Financial assets 80,322 34,657 22,480 37,241 174,700
Deposits of non-bank customers 66,934 16,918 17,097 22,351 123,300
Deposits and balances of banks 2,938 8,760 693 4,117 16,508
Trading portfolio liabilities 1,731 3 – – 1,734
Other liabilities (2) 4,419 1,620 768 1,082 7,889
Debt issued 1,930 3,349 1,336 239 6,854
Financial liabilities 77,952 30,650 19,894 27,789 156,285
net financial assets exposure 2,370 4,007 2,586 9,452
(1) Securities comprise trading and investment portfolio of government, debt and equity securities (including assets pledged).(2) Other assets/liabilities include derivative receivables/payables and amount due from/to associates and joint ventures.
notes to the Financial statements
For the financial year ended 31 December 2011

141OCBC Annual Report 2011
39. Financial risK manaGement (continued)39.3 market risk and asset liability management (continued)structural foreign exchange riskStructural foreign exchange risks arise primarily from the Group’s net investments in overseas branches, subsidiaries and associates, strategic equity investments as well as property assets. The Group uses mainly foreign currency forwards and swaps to hedge its exposure. The table below shows the Group’s structural foreign currency exposure at reporting date.
2011 2010
$ million
structural currency
exposure
hedging financial
instruments
net structural currency
exposure
structural currency
exposure
hedging financial
instruments
net structural currency
exposure
US Dollar 2,025 1,886 139 2,306 1,942 364Malaysian Ringgit 1,919 468 1,451 1,773 414 1,359Others 3,600 185 3,415 2,931 – 2,931Total 7,544 2,539 5,005 7,010 2,356 4,654
liquidity risk The table below analyses the carrying value of financial assets and liabilities of the Group into maturity time bands based on the remaining term to contractual maturity as at the balance sheet date.
$ millionwithin 1 week
1 week to1 month
1 to 3months
3 to 12months
1 to 3 years
Over3 years total
2011Cash and placements with central banks 3,309 2,953 1,147 1,073 – 4,415 12,897Placements with and loans to banks 4,380 4,362 8,591 11,020 429 79 28,861Loans and bills receivable 10,250 10,527 13,209 17,735 22,817 59,072 133,610Securities (1) 285 2,134 6,615 4,721 8,642 14,286 36,683Other assets (2) 1,068 1,514 1,962 3,490 685 372 9,091Financial assets 19,292 21,490 31,524 38,039 32,573 78,224 221,142
Deposits of non-bank customers 82,061 26,086 19,304 24,408 2,036 660 154,555Deposits and balances of banks 10,415 6,559 3,939 661 79 – 21,653Trading portfolio liabilities – – 453 170 695 337 1,655Other liabilities (2) 1,723 1,833 2,140 3,523 537 558 10,314Debt issued 468 2,620 4,453 779 730 4,013 13,063Financial liabilities 94,667 37,098 30,289 29,541 4,077 5,568 201,240
net liquidity gap – financial assets lessfinancial liabilities (75,375) (15,608) 1,235 8,498 28,496 72,656
2010Cash and placements with central banks 1,665 3,059 2,154 1,823 – 2,792 11,493
Placements with and loans to banks 6,111 2,691 5,501 4,020 55 1 18,379
Loans and bills receivable 8,249 9,152 8,947 12,377 17,516 48,786 105,027
Securities (1) 1,362 1,595 2,313 5,210 7,262 14,104 31,846 Other assets (2) 1,059 1,116 1,740 3,173 626 241 7,955
Financial assets 18,446 17,613 20,655 26,603 25,459 65,924 174,700
Deposits of non-bank customers 71,029 20,916 15,697 13,930 1,122 606 123,300
Deposits and balances of banks 9,173 4,570 2,030 580 155 – 16,508
Trading portfolio liabilities # – 127 777 792 38 1,734
Other liabilities (2) 1,594 1,364 1,720 2,374 380 457 7,889 Debt issued 14 117 366 2,608 385 3,364 6,854
Financial liabilities 81,810 26,967 19,940 20,269 2,834 4,465 156,285
net liquidity gap – financial assets lessfinancial liabilities (63,364) (9,354) 715 6,334 22,625 61,459
(1) Securities comprise trading and investment portfolio of government, debt and equity securities (including assets pledged).(2) Other assets/liabilities include derivative receivables/payables and amount due from/to associates and joint ventures.(3) Excluded from the tables are non-financial liabilities comprising of current and non-current liabilities. Current liabilities include current tax liabilities of $800 million
(2010: $744 million). Non-current liabilities include deferred tax liabilities of $1,123 million (2010: $1,127 million).(4) Excluded from the tables are non-financial assets comprising of non-current assets. Non-current assets include deferred tax assets of $43 million (2010: $79 million),
property, plant and equipment of $1,664 million (2010: $1,625 million), investment property of $922 million (2010: $733 million), and goodwill and intangible assets of $3,947 million (2010: $3,996 million).
(5) # represents amounts less than $0.5 million.

142 OCBC Annual Report 2011
39. Financial risK manaGement (continued)39.3 market risk and asset liability management (continued)contractual maturity for financial liabilities The table below shows the undiscounted cash outflows of the Group’s financial liabilities by remaining contractual maturities. Information on cash outflow of gross loan commitments is set out in Note 43. The expected cash flows of these liabilities could vary significantly from what is shown in the table. For example, deposits of non-bank customers included demand deposits, such as current and savings (Note 17) which are expected to remain stable, and unrecognised loan commitments are not all expected to be drawn down immediately.
$ millionwithin 1 week
1 week to1 month
1 to 3months
3 to 12months
1 to 3 years
Over3 years total
2011
Deposits of non-bank customers (1) 82,130 26,155 19,422 24,778 2,082 682 155,249
Deposits and balances of banks (1) 10,418 6,572 3,948 665 80 – 21,683
Trading portfolio liabilities – – 453 170 695 337 1,655
Other liabilities (2) 1,272 701 265 638 356 305 3,537
Debt issued 469 2,640 4,492 947 1,116 4,913 14,577
Net settled derivatives
Trading 388 156 376 947 1,375 835 4,077
Hedging # 2 4 17 35 20 78
Gross settled derivatives
Trading – Outflow 23,286 41,939 63,585 59,732 6,400 2,719 197,661
Trading – Inflow (23,271) (41,675) (63,670) (59,768) (6,464) (2,703) (197,551)
Hedging – Outflow – – 890 – – – 890
Hedging – Inflow – – (880) – – – (880)
94,692 36,490 28,885 28,126 5,675 7,108 200,976
2010
Deposits of non-bank customers (1) 71,046 20,997 15,808 14,082 1,136 629 123,698
Deposits and balances of banks (1) 9,176 4,577 2,037 586 157 – 16,533
Trading portfolio liabilities – – 127 777 793 37 1,734
Other liabilities (2) 1,242 525 260 402 257 199 2,885
Debt issued 14 117 469 2,774 585 4,482 8,441
Net settled derivatives
Trading 398 124 328 862 1,142 347 3,201
Hedging # 1 3 6 11 60 81
Gross settled derivatives
Trading – Outflow 22,839 25,459 25,136 27,295 3,332 1,871 105,932
Trading – Inflow (21,622) (26,661) (24,461) (28,235) (3,289) (1,854) (106,122)
Hedging – Outflow – – 1,223 614 – – 1,837
Hedging – Inflow – – (1,328) (705) – – (2,033)
83,093 25,139 19,602 18,458 4,124 5,771 156,187
(1) Interest cash flows of bank and non-bank deposits are included in the respective deposit lines based on interest payment dates.(2) Other liabilities include amount due to associates and joint ventures.(3) # represents amounts less than $0.5 million.
39.4 Other risk areasDetails of the Group’s management of operational, fiduciary and reputation risks are disclosed in the Risk Management Section.
notes to the Financial statements
For the financial year ended 31 December 2011

143OCBC Annual Report 2011
39. Financial risK manaGement (continued)39.5 insurance-related risk management This note sets out the risk management information of GEH Group.
Governance frameworkManaging risk is an integral part of GEH Group’s core business, and it shall always operate within the risk appetite set by the GEH Board, and ensure reward commensurate for any risk taken.
GEH Group’s Risk Management department spearheads the development and implementation of the Enterprise Risk Management Framework for the Group.
The Risk and Investment Committee (“RIC”) is constituted to provide oversight on the risk management initiatives. At GEH group level, detailed risk management and oversight activities are undertaken by the following group management committees comprising the Group Chief Executive Officer and key Senior Management Executives, namely: Group Management Team (“GMT”), Group Asset-Liability Committee (“Group ALC”) and Group Information Technology Steering Committee (“Group ITSC”).
GMT is responsible for providing leadership, direction and oversight with regards to all matters of GEH Group. The GMT is also responsible for ensuring compliance and alignment with Group Governance and Oversight Framework, i.e. Group standards and guidelines. The GMT is supported by the local Senior Management Team (“SMT”) and Product Development Committee (“PDC”).
Group ALC is responsible for assisting GMT in balance sheet management. Specifically, Group ALC reviews and formulates technical frameworks, policies and methodology relating to balance sheet management. Group ALC is also responsible for ensuring compliance and alignment with Group Governance and Oversight Framework, i.e. Group standards and guidelines. Group ALC is supported by the local Asset-Liability Committee (“ALC”).
regulatory frameworkInsurers are required to comply with the Insurance Act and Regulations, as applicable, including guidelines on investment limits. The responsibility for the formulation, establishment and approval of the investment policy rests with the respective Board of Directors (“Board”) of the insurance subsidiaries. The Board exercises oversight on investments to safeguard the interests of policyholders and shareholders.
capital management GEH’s capital management policy is to create shareholder value, deliver sustainable returns to shareholders, maintain a strong capital position with sufficient buffer to meet policyholders’ obligations and regulatory requirements and make strategic investments for business growth.
Regulatory capitalThe insurance subsidiaries of GEH Group are required to comply with capital ratios prescribed by the insurance regulations of the jurisdiction in which the subsidiaries operate.
In Singapore, the minimum Capital Adequacy Ratio under the Risk-based Capital Framework regulated by the MAS is 120% for each insurance entity. The capital requirements also include Fund Solvency Ratios of the respective insurance funds operated by GEH Group. Regulatory capital of the consolidated Singapore insurance subsidiaries as at 31 December 2011 comprised Available Capital of $8.1 billion (2010: $7.1 billion), Risk Capital of $3.7 billion (2010: $3.3 billion) and Capital Adequacy Ratio of 218% (2010: 215%).
In Malaysia, the minimum capital requirement under the Risk-based Capital Framework regulated by Bank Negara, Malaysia (“BNM”) is 130% for each insurance entity. Regulated capital of the consolidated Malaysia insurance subsidiaries as at 31 December 2011 comprised Available Capital of $0.7 billion (2010: $0.6 billion), Risk Capital of $0.2 billion (2010: $0.2 billion) and Capital Adequacy Ratio of 279% (2010: 277%).
GEH Group has met all of its regulatory requirements throughout the financial year.
DividendGEH’s dividend policy aims to provide shareholders with a predictable and sustainable dividend return, payable on a half-yearly basis.
GEH Group has had no significant changes in its policies and processes relating to its capital structure during the year.

144 OCBC Annual Report 2011
39. Financial risK manaGement (continued)39.5 insurance-related risk management (continued) Financial risk managementThe principal activities of GEH Group are the provision of financial advisory services coupled with insurance protection against risks such as mortality, morbidity (health, disability, critical illness and personal accident), property and casualty.
GEH Group’s underwriting strategy is designed to ensure that these risks are well diversified in terms of type of risk and level of insured benefits. This is largely achieved through diversification across industry sectors and geography, the use of medical screening in order to ensure that pricing takes account of current health conditions and family medical history, regular review of actual claims experience and product pricing, as well as detailed claims handling procedures. Underwriting limits are also set in place to enforce appropriate risk selection criteria. For example, GEH Group has the right not to renew individual policies, it can impose deductibles and it has the right to reject the payment of fraudulent claims.
Risks inherent in GEH Group’s activities include but are not limited to the risks discussed below.
insurance riskInsurance risks arise when GEH Group underwrites insurance contracts. A mis-estimation of the assumptions used in pricing the insurance products as well as subsequent setting of the technical provisions may give rise to potential shortfalls when actual experience is different from expected experience. Sources of assumptions affecting insurance risks include policy lapses and policy claims such as mortality, morbidity and expenses. These risks do not vary significantly in relation to the location of the risk insured by GEH Group, type of risk insured or by industry.
GEH Group utilises reinsurance to manage the mortality and morbidity risks. GEH Group’s reinsurance management strategy and policy are reviewed annually by RIC and Group ALC. Reinsurance structures are set based on the type of risk. Retention limits for mortality risk per life are limited to a maximum of $700,000 in Singapore and MYR350,000 in Malaysia. Retention limits for critical illness per life are limited to a maximum of $400,000 in Singapore and MYR250,000 in Malaysia. Catastrophe reinsurance is procured to limit catastrophic losses. GEH Group’s exposure to group insurance business is not significant, thus there is no material concentration in insurance risk.
Only reinsurers meeting credit rating of S&P A- are considered when deciding on which reinsurers to reinsure GEH Group’s risk. Risk to any one reinsurer is limited by ceding different products to different reinsurers or to a panel of reinsurers.
Group ALC reviews the actual experience of mortality, morbidity, lapses and surrenders, and expenses to ensure that the policies, guidelines and limits put in place to manage the risks remain adequate and appropriate.
Insurance risk of life insurance contractsA substantial portion of GEH Group’s life assurance funds is participating in nature. In the event of volatile investment climate and/or unusual claims experience, the insurer has the option of revising the bonus and dividends payable to policyholders.
For non-participating funds, the risk is that the guaranteed policy benefits must be met even when investment markets perform poorly, or claims experience is higher than expected. For investment-linked funds, the risk exposure for GEH Group is limited only to the underwriting aspect as all investment risks are borne by the policyholders.
Stress Testing (“ST”) is performed at least once a year. The purpose of the ST is to test the solvency of the life fund under various scenarios according to prescribed statutory valuation basis, simulating drastic changes in major parameters such as new business volume, investment environment, expense patterns, mortality/morbidity patterns and lapse rates.
notes to the Financial statements
For the financial year ended 31 December 2011

145OCBC Annual Report 2011
39. Financial risK manaGement (continued)39.5 insurance-related risk management (continued)insurance risk (continued)table 39.5(a): concentration of life insurance risk, net of reinsurance
insurance liabilities ($ million) 2011 2010
(a) by class of business
Whole life 21,271 20,170
Endowment 15,244 15,486
Term 348 344
Accident and health 963 766
Annuity 644 624
Others 820 544
Total 39,290 37,934
(b) by country
Singapore 24,524 24,451
Malaysia 14,450 13,221
Others 316 262
Total 39,290 37,934
The sensitivity analysis below shows the impact of change in key parameters on the value of policy liabilities, and hence on the income statements and shareholders’ equity. Sensitivity analyses produced below are based on parameters set out as follows:(a) Scenario 1 – Mortality and Major Illness + 25% for all future years(b) Scenario 2 – Mortality and Major Illness – 25% for all future years(c) Scenario 3 – Health and Disability + 25% for all future years(d) Scenario 4 – Health and Disability – 25% for all future years(e) Scenario 5 – Lapse and Surrender Rates + 25% for all future years(f) Scenario 6 – Lapse and Surrender Rates – 25% for all future years(g) Scenario 7 – Expenses + 30% for all future years
table 39.5(b1): Profit/(loss) after tax and shareholders’ equity sensitivity for the singapore segment
Impact on 1-year’s profit/(loss) after tax and shareholders’ equity
$ million scenario 1 scenario 2 scenario 3 scenario 4 scenario 5 scenario 6 scenario 7
2011
Gross impact (58.1) 17.2 70.3 (78.4) 53.7 (67.6) (26.1)
Reinsurance ceded – – – – – – –
Net impact (58.1) 17.2 70.3 (78.4) 53.7 (67.6) (26.1)
2010
Gross impact (33.6) (7.5) 47.9 (85.0) 37.4 (45.3) (19.6)
Reinsurance ceded – – – – – – –
Net impact (33.6) (7.5) 47.9 (85.0) 37.4 (45.3) (19.6)

146 OCBC Annual Report 2011
39. Financial risK manaGement (continued)39.5 insurance-related risk management (continued)insurance risk (continued)table 39.5(b2): Profit/(loss) after tax and shareholders’ equity sensitivity for the malaysia segment
Impact on 1-year’s profit/(loss) after tax and shareholders’ equity
$ million scenario 1 scenario 2 scenario 3 scenario 4 scenario 5 scenario 6 scenario 7
2011
Gross impact (53.6) 54.2 (13.2) 10.7 (0.8) 1.8 (6.1)
Reinsurance ceded – – – – – – –
Net impact (53.6) 54.2 (13.2) 10.7 (0.8) 1.8 (6.1)
2010
Gross impact (51.0) 55.4 (11.8) 10.0 (3.6) 4.7 (6.2)
Reinsurance ceded – – – – – – –
Net impact (51.0) 55.4 (11.8) 10.0 (3.6) 4.7 (6.2)
The above tables demonstrate the sensitivity of GEH Group’s profit and loss after tax to a reasonably possible change in actuarial valuation assumptions on an individual basis with all other variables held constant.
The effect of sensitivity analysis on reinsurance ceded for Singapore and Malaysia segments are not material.
The method used and significant assumptions made for deriving sensitivity information above did not change from the previous year.
Insurance risk of non-life insurance contractsRisks under non-life insurance policies usually cover a twelve-month duration. The risk inherent in non-life insurance contracts is reflected in the insurance contract liabilities which include the premium and claims liabilities. The premium liabilities comprise reserve for unexpired risks, while the claims liabilities comprise the loss reserves which include both provision for outstanding claims notified and outstanding claims incurred but not reported.
notes to the Financial statements
For the financial year ended 31 December 2011
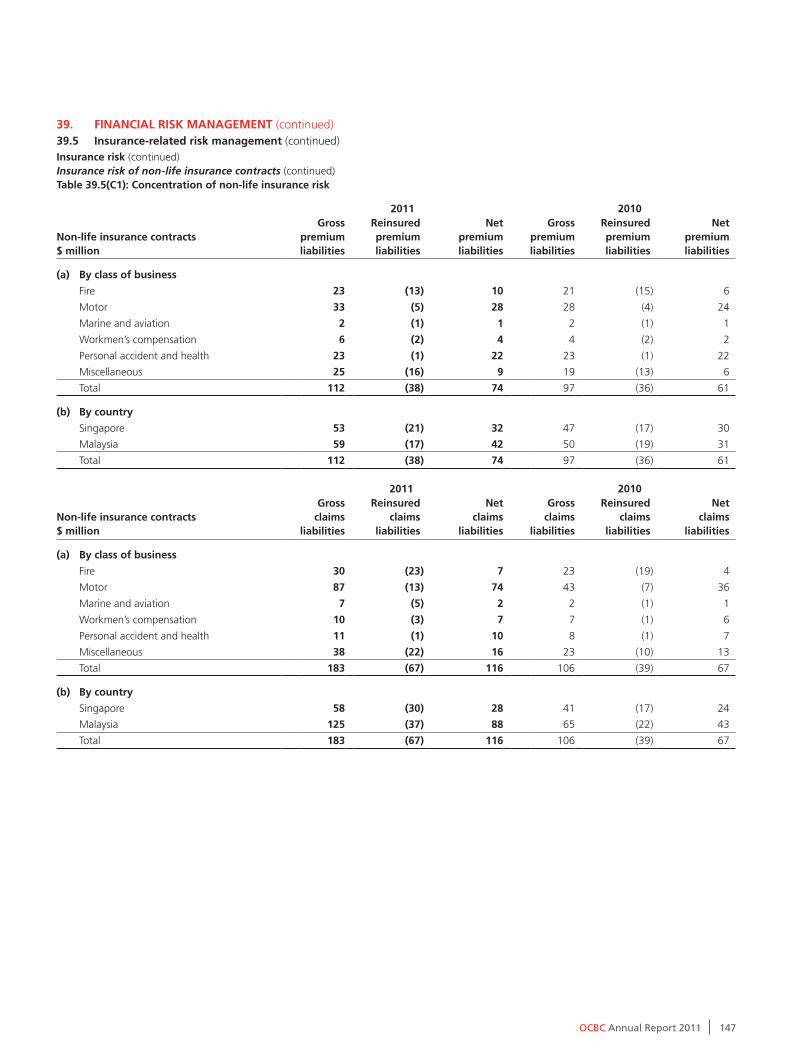
147OCBC Annual Report 2011
39. Financial risK manaGement (continued)39.5 insurance-related risk management (continued)insurance risk (continued)Insurance risk of non-life insurance contracts (continued)table 39.5(c1): concentration of non-life insurance risk
2011 2010
non-life insurance contracts $ million
Gross premiumliabilities
reinsured premiumliabilities
net premium liabilities
Gross premium liabilities
reinsured premium liabilities
net premium liabilities
(a) by class of business
Fire 23 (13) 10 21 (15) 6
Motor 33 (5) 28 28 (4) 24
Marine and aviation 2 (1) 1 2 (1) 1
Workmen’s compensation 6 (2) 4 4 (2) 2
Personal accident and health 23 (1) 22 23 (1) 22
Miscellaneous 25 (16) 9 19 (13) 6
Total 112 (38) 74 97 (36) 61
(b) by country
Singapore 53 (21) 32 47 (17) 30
Malaysia 59 (17) 42 50 (19) 31
Total 112 (38) 74 97 (36) 61
2011 2010
non-life insurance contracts $ million
Gross claims
liabilities
reinsured claims
liabilities
net claims
liabilities
Gross claims
liabilities
reinsured claims
liabilities
net claims
liabilities
(a) by class of business
Fire 30 (23) 7 23 (19) 4
Motor 87 (13) 74 43 (7) 36
Marine and aviation 7 (5) 2 2 (1) 1
Workmen’s compensation 10 (3) 7 7 (1) 6
Personal accident and health 11 (1) 10 8 (1) 7
Miscellaneous 38 (22) 16 23 (10) 13
Total 183 (67) 116 106 (39) 67
(b) by country
Singapore 58 (30) 28 41 (17) 24
Malaysia 125 (37) 88 65 (22) 43
Total 183 (67) 116 106 (39) 67

148 OCBC Annual Report 2011
39. Financial risK manaGement (continued)39.5 insurance-related risk management (continued)insurance risk (continued)table 39.5(c2): cumulative claims estimates and cumulative payments to-date
The tables below show the cumulative claims estimates, including both claims notified and IBNR for each successive accident year, at each balance sheet date, together with cumulative payments to date.
(i) Gross non-life insurance contract liabilities for 2011
$ million 2004 2005 2006 2007 2008 2009 2010 2011 total
(a) estimate of cumulative claims
Accident Year 62 60 50 62 58 76 78 129
One year later 60 66 53 66 59 82 97 –
Two years later 61 64 51 60 59 108 – –
Three years later 61 63 50 60 85 – – –
Four years later 60 62 50 88 – – – –
Five years later 60 61 91 – – – – –
Six years later 59 94 – – – – – –
Seven years later 65 – – – – – – –
current estimate of cumulative claims 65 94 91 88 85 108 97 129
(b) cumulative payments
Accident Year 19 21 20 23 24 33 31 41
One year later 42 51 38 44 46 58 67 –
Two years later 53 54 43 50 51 87 – –
Three years later 55 55 45 52 74 – – –
Four years later 56 57 45 78 – – – –
Five years later 57 57 85 – – – – –
Six years later 57 90 – – – – – –
Seven years later 57 – – – – – – –
cumulative payments 57 90 85 78 74 87 67 41
(c) total non-life gross claim liabilities 8 4 6 10 11 21 30 88 178
reserve for prior years 2
unallocated surplus 3
General insurance Fund
contract liabilities, gross 183
notes to the Financial statements
For the financial year ended 31 December 2011

149OCBC Annual Report 2011
39. Financial risK manaGement (continued)39.5 insurance-related risk management (continued)insurance risk (continued)(ii) Non-life insurance contract liabilities, net of reinsurance liabilities for 2011
$ million 2004 2005 2006 2007 2008 2009 2010 2011 total
(a) estimate of cumulative claims
Accident Year 28 27 30 32 37 44 53 85
One year later 27 27 30 33 38 48 69 –
Two years later 27 27 29 32 38 69 – –
Three years later 26 26 28 32 57 – – –
Four years later 26 26 28 56 – – – –
Five years later 25 26 63 – – – – –
Six years later 25 53 – – – – – –
Seven years later 28 – – – – – – –
current estimate of cumulative claims 28 53 63 56 57 69 69 85
(b) cumulative payments
Accident Year 11 11 13 14 17 22 25 29
One year later 19 20 22 25 30 37 51 –
Two years later 22 22 24 28 32 55 – –
Three years later 23 23 26 29 49 – – –
Four years later 24 24 26 50 – – – –
Five years later 24 24 58 – – – – –
Six years later 25 51 – – – – – –
Seven years later 25 – – – – – – –
cumulative payments 25 51 58 50 49 55 51 29
(c) total non-life net claim liabilities 3 2 5 6 8 14 18 56 112
reserve for prior years 1
unallocated surplus 3
General insurance Fund
contract liabilities, net 116
Non-life insurance contract liabilities are determined based on previous claims experience, existing knowledge of events, the terms and conditions of the relevant policies and interpretation of circumstances. Of particular relevance is past experience with similar cases, historical claims development trends, legislative changes, judicial decisions, economic conditions and claims handling procedures. The estimates of the non-life insurance contract liabilities are therefore sensitive to various factors and uncertainties. The actual future premium and claims liabilities will not develop exactly as projected and may vary from initial estimates.
Insurance risk of non-life insurance contracts is mitigated by emphasising diversification across a large portfolio of insurance contracts and geographical areas. The variability of risks is improved by careful selection and implementation of underwriting strategies, which are designed to ensure that risks are diversified in terms of type of risk and level of insured benefits. This is largely achieved through diversification across industry sectors and geography. Further, strict claim review policies to assess all new and ongoing claims, regular detailed review of claims handling procedures and frequent investigation of possible fraudulent claims are all policies and procedures put in place to reduce the risk exposure of GEH Group. GEH Group further enforces a policy of actively managing and prompt pursuing of claims, in order to reduce its exposure to unpredictable future developments that can negatively impact the Group.
GEH Group has also limited its exposure by imposing maximum claim amounts on certain contracts as well as the use of reinsurance arrangements in order to limit exposure to catastrophic events, e.g. hurricanes, earthquakes and flood damages.

150 OCBC Annual Report 2011
39. Financial risK manaGement (continued)39.5 insurance-related risk management (continued)insurance risk (continued)The sensitivity analysis below shows the impact of changes in key assumptions on gross and net liabilities, profit before tax and equity.
impact on
$ millionchange in
assumptionsGross
liabilitiesnet
liabilitiesProfit
before tax equity
2011
Provision for adverse deviation margin +20% 2 2 (2) (1)
Loss ratio +20% 115 83 (83) (63)
Claims handling expenses +20% # 2 (2) (2)
2010 (1)
Provision for adverse deviation margin +20% 2 2 (2) (2)
Loss ratio +20% 78 47 (47) (36)
Claims handling expenses +20% # 2 (2) (2)
(1) Comparatives have been restated to conform to current year’s presentation.(2) # represents amounts less than $0.5 million.
The method used and significant assumptions made for deriving sensitivity information above did not change from the previous year.
market and credit riskMarket risk arises when the market value of assets and liabilities do not move consistently as financial markets change. Changes in interest rates, foreign exchange rates, equity prices and alternative investment prices can impact present and future earnings of the insurance operations as well as shareholders’ equity.
GEH Group is exposed to market risk in the investments of the Shareholders’ Fund as well as in the mismatch risk between the assets and liabilities of the Insurance Funds. As for the funds managed by its asset management subsidiary, Lion Global Investors Limited, investment risks are borne by investors and GEH Group does not assume any liability in the event of occurrence of loss or write-down in market valuation.
Group ALC and local ALCs actively manage market risks through setting of investment policy and asset allocation, approving portfolio construction and risk measurement methodologies, approving hedging and alternative risk transfer strategies. Investment limits monitoring is in place at various levels to ensure that all investment activities are aligned with GEH Group’s risk management principles and philosophies. Compliance with established financial risk limits forms an integral part of the risk governance and financial reporting framework. Management of market risks resulting from changes in interest rates and currency exchange rates; volatility in equity prices; as well as other risks like credit and liquidity risks are described below.
notes to the Financial statements
For the financial year ended 31 December 2011

151OCBC Annual Report 2011
39. Financial risK manaGement (continued)39.5 insurance-related risk management (continued)market and credit risk (continued)(a) interest rate risk (including asset liability mismatch)GEH Group is exposed to interest rate risk through (i) investments in fixed income instruments in both the Shareholders’ Fund as well as the Insurance Funds and (ii) policy liabilities in the Insurance Funds. Since the Shareholders’ Fund has exposure to investments in fixed income instruments but no exposure to insurance policy liabilities, it will incur an economic loss when interest rates rise. Given the long duration of policy liabilities and the uncertainty of the cash flows of the Insurance Funds, it is not possible to hold assets that will perfectly match the policy liabilities. This results in a net interest rate risk or asset liability mismatch risk which is managed and monitored by GEH Group ALC and local ALCs. The Insurance Funds will incur an economic loss when interest rates drop since the duration of policy liabilities is generally longer than the duration of the fixed income assets. Under Singapore regulations governed by the MAS, the liability cash flows with durations less than 15 years are discounted using zero-coupon spot yield of SGS while liability cash flows with duration more than 15 years for Singapore funds are discounted using the Long Term Risk Free Discount Rate (“LTRFDR”). As a result, the Singapore Non Participating funds could have negative earnings impact when the LTRFDR decreases.
In 2009, GEH Group commenced an exercise to achieve portfolio matching of the assets and liabilities of Great Eastern Life Non Participating fund’s long dated liabilities. These long dated liabilities are discounted using the zero-coupon spot yield of the SGS of a matching duration (and not the LTRFDR mentioned above). The long dated liabilities which do not fall within the matching programme will still be subject to the LTRFDR requirement.
Under Malaysia regulations governed by BNM, the liability cash flows with durations less than 15 years are discounted using zero-coupon spot yield of MGS with matching duration while the liability cash flows with durations of 15 years or more are discounted using zero-coupon spot yield of MGS with 15 years term to maturity. As a result, the Malaysia non-participating fund could have negative earnings impact when the zero-coupon spot yield of MGS decreases.
(b) Foreign currency risk Hedging through currency forwards and swaps is typically used for the fixed income portfolio. Internal limits on foreign exchange exposures ranging from 15% to 35% are applied to investments in fixed income portfolios at fund level. Currency risk of investments in foreign equities is generally not hedged.
GEH Group is also exposed to foreign exchange movement on net investment in its foreign subsidiaries. The major exposure for GEH Group is in respect of its Malaysia subsidiaries. The Insurance and Shareholders’ Fund in Malaysia are predominantly held in Malaysian Ringgit, as prescribed by BNM. The following table shows the foreign exchange position of GEH Group’s financial assets and liabilities by major currencies.

152 OCBC Annual Report 2011
39. Financial risK manaGement (continued)39.5 insurance-related risk management (continued)market and credit risk (continued)(b) Foreign currency risk (continued)
$ million sGD myr usD Others total
2011Available-for-sale securities
Equity securities 2,641 3,906 1,169 2,346 10,062Debt securities 7,874 11,900 3,810 439 24,023Other investments 382 105 688 233 1,408
Securities at fair value through profit or lossEquity securities 231 695 180 798 1,904Debt securities 27 229 280 184 720Other investments 637 50 74 182 943
Derivative assets and embedded derivatives 1,153 6 165 207 1,531Loans 958 245 – – 1,203Insurance receivables 939 1,598 2 19 2,558Other debtors and interfund balances 1,033 457 3 24 1,517Cash and cash equivalents 4,610 2,153 361 125 7,249Financial assets 20,485 21,344 6,732 4,557 53,118
Other creditors and interfund balances 1,678 649 2 36 2,365Insurance payables 842 1,660 2 13 2,517Derivative payables 7 8 33 14 62Agents’ retirement benefits – 231 – # 231Amount due to joint venture – – – # #Debt issued 399 – – – 399General insurance fund contract liabilities 58 125 – – 183Life assurance fund contract liabilities 24,320 14,450 237 283 39,290Financial liabilities 27,304 17,123 274 346 45,047
2010Available-for-sale securities
Equity securities 2,731 3,867 1,246 2,211 10,055Debt securities 8,789 12,548 4,082 427 25,846Other investments 413 76 658 134 1,281
Securities at fair value through profit or lossEquity securities 311 724 188 976 2,199Debt securities 36 261 250 144 691Other investments 703 27 56 146 932
Derivative assets and embedded derivatives 1,079 7 57 69 1,212Loans 1,311 269 – – 1,580Insurance receivables 929 1,568 1 21 2,519Other debtors and interfund balances 1,308 463 3 15 1,789Cash and cash equivalents 2,275 276 156 123 2,830Financial assets 19,885 20,086 6,697 4,266 50,934
Other creditors and interfund balances 1,230 635 3 24 1,892Insurance payables 875 1,482 5 11 2,373Derivative payables 15 – 6 5 26Agents’ retirement benefits – 215 – 1 216Amount due to joint venture (1) – – – # #General insurance fund contract liabilities 41 65 – – 106Life assurance fund contract liabilities 24,358 13,221 112 243 37,934Financial liabilities 26,519 15,618 126 284 42,547
(1) Comparatives have been restated to conform to current year’s presentation.(2) # represents amounts less than $0.5 million.
GEH Group has no significant concentration of foreign currency risk.
notes to the Financial statements
For the financial year ended 31 December 2011

153OCBC Annual Report 2011
39. Financial risK manaGement (continued)39.5 insurance-related risk management (continued)market and credit risk (continued)(c) equity price riskExposure to equity price risk exists in both assets and liabilities. Asset exposure exists through direct equity investment, where GEH Group, through investments in both Shareholders’ Fund and Insurance Funds, bears all or most of the volatility in returns and investment performance risk. Equity price risk also exists in investment-linked products where the revenues of the insurance operations are linked to the value of the underlying equity funds since this has an impact on the level of fees earned. Limits are set for single security holdings as a percentage of equity holdings.
(d) credit spread riskExposure to credit spread risk exists in GEH Group’s investments in bonds. Credit spread is the difference between the quoted rates of return of two different investments of different credit quality. When spreads widen between bonds with different quality ratings, it implies that the market is factoring more risk of default on lower grade bonds. A widening in credit spreads will result in a fall in the values of GEH Group’s bond portfolio.
(e) alternative investment riskGEH Group is exposed to alternative investment risk through investments in direct real estate that it owns in Singapore and Malaysia and through real estate, private equity, infrastructure and hedge funds for exposures in other countries. A monitoring process is in place to manage foreign exchange, country and manager concentration risks. This process and the acquisition or divestment of alternative investments are reviewed and approved by RIC and GEH Group ALC.
(f) commodity riskGEH Group does not have a direct or significant exposure to commodity risk.
(g) cash flow and liquidity riskCash flow and liquidity risk arises when a company is unable to meet its obligations associated with financial instruments when required to do so. This typically happens when the investments in the portfolio are illiquid. Demands for funds can usually be met through ongoing normal operations, premiums received, sale of assets or borrowings. Unexpected demands for liquidity may be triggered by negative publicity, deterioration of the economy, reports of problems in other companies in the same or similar lines of business, unanticipated policy claims, or other unexpected cash demands from policyholders.
Expected liquidity demands are managed through a combination of treasury, investment and asset-liability management practices, which are monitored on an ongoing basis. Actual and projected cash inflows and outflows are monitored and a reasonable amount of assets are kept in liquid instruments at all times. The projected cash flows from the in-force insurance policy contract liabilities consist of renewal premiums, commissions, claims, maturities and surrenders. Renewal premiums, commissions, claims and maturities are generally stable and predictable. Surrenders can be more uncertain although it has been quite stable over the past several years.
Unexpected liquidity demands are managed through a combination of product design, diversification limits, investment strategies and systematic monitoring. The existence of surrender penalty in insurance contracts also protects GEH Group from losses due to unexpected surrender trends as well as reduces the sensitivity of surrenders to changes in interest rates.

154 OCBC Annual Report 2011
39. Financial risK manaGement (continued)39.5 insurance-related risk management (continued)market and credit risk (continued)(g) cash flow and liquidity risk (continued)The following tables show the expected recovery or settlement of financial assets and maturity profile of GEH Group’s financial liabilities (contractual undiscounted cash flow basis):
$ millionless than
1 year 1 to 5 years
Over 5 years
no maturity date total
2011Available-for-sale securities
Equity securities – – – 10,062 10,062Debt securities 3,851 9,192 21,736 – 34,779Other investments – – – 1,408 1,408
Securities at fair value through profit or lossEquity securities – – – 1,904 1,904Debt securities 74 276 698 – 1,048Other investments – – – 943 943
Embedded derivatives 239 1,114 329 5 1,687Loans 367 844 101 – 1,312Insurance receivables 255 1 – 2,302 2,558Other debtors and interfund balances 1,367 120 13 17 1,517Cash and cash equivalents 7,249 – – – 7,249Financial assets 13,402 11,547 22,877 16,641 64,467
Other creditors and interfund balances 2,074 276 15 – 2,365Insurance payables 2,474 37 2 4 2,517Agents’ retirement benefits 60 44 127 – 231Amount due to joint venture # – – – #Debt issued 18 74 483 – 575General insurance fund contract liabilities 153 15 # 15 183Life assurance fund contract liabilities 6,686 6,652 25,952 – 39,290Financial liabilities 11,465 7,098 26,579 19 45,161
2010Available-for-sale securities
Equity securities – – – 10,055 10,055Debt securities 3,466 9,759 28,683 – 41,908Other investments – – – 1,281 1,281
Securities at fair value through profit or lossEquity securities – – – 2,199 2,199Debt securities 85 285 683 – 1,053Other investments – – – 932 932
Embedded derivatives (1) 59 719 348 – 1,126Loans 324 1,139 297 – 1,760Insurance receivables 197 1 – 2,321 2,519Other debtors and interfund balances (1) 1,596 176 – 17 1,789Cash and cash equivalents 2,830 – – – 2,830Financial assets 8,557 12,079 30,011 16,805 67,452
Other creditors and interfund balances 1,624 254 14 – 1,892Insurance payables 2,319 48 2 4 2,373Agents’ retirement benefits 52 44 120 – 216Amount due to joint venture (1) # – – – #General insurance fund contract liabilities 60 45 1 – 106Life assurance fund contract liabilities 6,215 7,500 24,110 109 37,934Financial liabilities 10,270 7,891 24,247 113 42,521
(1) Comparatives have been restated to conform to current year’s presentation.(2) # represents amounts less than $0.5 million.
notes to the Financial statements
For the financial year ended 31 December 2011

155OCBC Annual Report 2011
39. Financial risK manaGement (continued)39.5 insurance-related risk management (continued)market and credit risk (continued)(g) cash flow and liquidity risk (continued)The following tables show the current/non-current classification of assets and liabilities:
$ million current* non-current unit-linked total
2011Cash and cash equivalents 6,756 – 493 7,249Other debtors and interfund balances 935 541 41 1,517Insurance receivables 306 2,252 – 2,558Loans 353 850 – 1,203Investments, including derivative instruments 6,764 30,244 3,583 40,591Assets held for sale 4 – – 4Associates and joint ventures – 320 – 320Goodwill – 26 – 26Property, plant and equipment – 722 – 722Investment properties – 1,412 – 1,412assets 15,118 36,367 4,117 55,602
Insurance payables 2,042 460 15 2,517Other creditors and interfund balances 2,129 172 64 2,365Unexpired risk reserve 112 – – 112Derivative payables 24 34 4 62Income tax 412 – 6 418Agents’ retirement benefits 60 171 – 231Amount due to joint venture # – – #Deferred tax – 937 9 946Debt issued – 399 – 399General insurance fund 153 36 – 189Life assurance fund 2,606 37,733 4,082 44,421liabilities 7,538 39,942 4,180 51,660
2010Cash and cash equivalents 2,568 – 262 2,830Other debtors and interfund balances (1) 1,607 110 72 1,789Insurance receivables (1) 277 2,242 – 2,519Loans 312 1,268 – 1,580Investments, including derivative instruments 3,364 35,021 3,831 42,216Associates and joint ventures – 337 – 337Goodwill – 19 – 19Property, plant and equipment – 728 – 728Investment properties – 1,355 – 1,355assets 8,128 41,080 4,165 53,373
Insurance payables 2,318 42 13 2,373Other creditors and interfund balances 1,532 244 116 1,892Unexpired risk reserve 97 – – 97Derivative payables 4 15 7 26Income tax 391 – (9) 382Agents’ retirement benefits 52 164 – 216Amount due to joint venture (1) # – – #Deferred tax – 940 10 950General insurance fund (1) 60 50 – 110Life assurance fund (1) 2,234 36,945 4,089 43,268liabilities 6,688 38,400 4,226 49,314
(1) Comparatives have been restated to conform to current year’s presentation.(2) * represents expected recovery or settlement within 12 months from the balance sheet date.(3) # represents amounts less than $0.5 million.

156 OCBC Annual Report 2011
39. Financial risK manaGement (continued)39.5 insurance-related risk management (continued)market and credit risk (continued)(h) credit risk Credit risk is the risk that one party to a financial instrument will cause financial loss to the other party by failing to discharge an obligation. GEH Group is mainly exposed to credit risk through (i) investments in cash and bonds, (ii) corporate lending activities and (iii) exposure to counterparty’s credit in derivative transactions and reinsurance contracts. For all three types of exposures, financial loss may materialise as a result of a credit default by the borrower or counterparty. For investment in bonds, financial loss may also materialise as a result of the widening of credit spread or a downgrade of credit rating.
The task of evaluating and monitoring credit risk is undertaken by the local ALCs. GEH group wide credit risk is managed by Group ALC. GEH Group has internal limits by issuer or counterparty and by investment grades. These limits are actively monitored to manage the credit and concentration risk. These limits are reviewed on a regular basis. The creditworthiness of reinsurers is assessed on an annual basis by reviewing their financial strength through published credit ratings and other publicly available financial information.
Reinsurance is placed with counterparties that have a good credit rating and concentration of risk is avoided by following policy guidelines in respect of counterparties’ limits that are set each year. Credit risk in respect of customer balances incurred on non-payment of premiums or contributions will only persist during the grace period specified in the policy document or trust deed until expiry, when the policy is either paid up or terminated. GEH Group issues unit-linked investment policies. In the unit-linked business, the policyholder bears the investment risk on the assets held in the unit-linked funds as the policy benefits are directly linked to the value of the assets in the fund. Therefore, GEH Group has no material credit risk on unit-linked financial assets.
The loans in GEH Group’s portfolio are generally secured by collaterals, with a maximum loan to value of 70% predominantly. The amount and type of collateral required depend on an assessment of the credit risk of the counterparty. Guidelines are implemented regarding the acceptability of the types of collateral and the valuation parameters. GEH management monitors the market value of the collateral, requests additional collateral when needed and performs an impairment valuation when applicable. The fair value of collaterals, held by GEH Group as lender, for which it is entitled to sell or pledge in the event of default is as follows:
2011 2010
$ million
carrying amount of loans
Fair value of collaterals
carrying amountof loans
Fair value of collaterals
type of collaterals
Policy loans – Cash value of policies 2,251 4,352 2,242 4,284
Secured loans
Properties 1,201 3,161 1,507 3,868
Shares – – 51 108
Bankers’ guarantees – – 18 18
Others 1 1 3 5
3,453 7,514 3,821 8,283
There were no investments lent and collaterals received under securities lending arrangements as at 31 December 2011 (2010: $41.8 million and $43.2 million respectively). As at the balance sheet date, no investments (2010: nil) were placed as collateral for currency hedging purposes. Transactions are conducted under terms and conditions that are usual and customary to standard securities borrowing and lending activities.
notes to the Financial statements
For the financial year ended 31 December 2011

157OCBC Annual Report 2011
39. Financial risK manaGement (continued)39.5 insurance-related risk management (continued)market and credit risk (continued)(h) credit risk (continued)The table below shows the maximum exposure to credit risk for the components of the balance sheet of GEH Group. The maximum exposure is shown gross, before the effect of mitigation through the use of master netting or collateral agreements and the use of credit derivatives. For derivatives, the fair value shown on the balance sheet represents the current risk exposure but not the maximum exposure that could arise in the future as a result of the change in value. The table also provides information regarding the credit risk exposure of GEH Group by classifying assets according to the Group’s credit ratings of counterparties.
neither past due nor impaired unitlinked/not subject to credit risk$ million
investment grade @
non-investment
grade @ non- rated Past due * total
2011 (AAA–BBB) (BB–C)
Available-for-sale securities
Equity securities – – – 10,062 – 10,062
Debt securities 19,114 204 2,146 2,559 – 24,023
Other investments – – – 1,408 – 1,408
Securities at fair value through profit or loss
Equity securities – – – 1,904 – 1,904
Debt securities – – 2 718 – 720
Other investments – – – 943 – 943
Derivative assets and embedded derivatives 656 14 802 59 – 1,531
Loans – – 1,203 – – 1,203
Insurance receivables 1 – 2,531 – 26 2,558
Other debtors and interfund balances – – 1,474 40 3 1,517
Cash and cash equivalents 6,587 – 169 493 – 7,249
Financial assets 26,358 218 8,327 18,186 29 53,118
2010
Available-for-sale securities
Equity securities – – – 10,055 – 10,055
Debt securities 23,850 224 1,772 – – 25,846
Other investments – – – 1,281 – 1,281
Securities at fair value through profit or loss
Equity securities – – – 2,199 – 2,199
Debt securities 2 – 2 687 – 691
Other investments – – – 932 – 932
Derivative assets and embedded derivatives 861 52 150 149 – 1,212
Loans 168 – 1,412 – – 1,580
Insurance receivables 1 – 2,500 – 18 2,519
Other debtors and interfund balances – – 1,707 72 10 1,789
Cash and cash equivalents 2,391 – 177 262 – 2,830
Financial assets 27,273 276 7,720 15,637 28 50,934
(1) @ based on public ratings assigned by external rating agencies including S&P, Moody’s, RAM and MARC.(2) * An ageing analysis for financial assets past due is provided below.(3) # represents amounts less than $0.5 million.

158 OCBC Annual Report 2011
39. Financial risK manaGement (continued)39.5 insurance-related risk management (continued)market and credit risk (continued)(h) credit risk (continued)Ageing analysis of financial assets past due:
Past due but not impaired Past due and
impaired @$ millionless than6 months
6 to 12 months
Over 12 months
sub-total total
2011
Insurance receivables 23 3 # 26 13 39
Other debtors and interfund balances 3 # # 3 – 3
total 26 3 # 29 13 42
2010
Insurance receivables 17 1 – 18 # 18
Other debtors and interfund balances 8 1 1 10 – 10
total 25 2 1 28 # 28
(1) # represents amounts less than $0.5 million.(2) @ for assets to be classified as “past due and impaired”, contractual payments must be in arrears for more than 90 days. These receivables are not secured by any
collateral or credit enhancements.
(i) concentration riskAn important element of managing both market and credit risks is to actively manage concentration to specific issuers, counterparties, industry sectors, countries and currencies. Both internal and regulatory limits are put in place and monitored to manage concentration risk. These limits are reviewed on a regular basis by the respective management committees. GEH Group’s exposures are within the concentration limits set by the respective local regulators. GEH Group actively manages its product mix to ensure that there is no significant concentration of credit risk.
notes to the Financial statements
For the financial year ended 31 December 2011

159OCBC Annual Report 2011
39. Financial risK manaGement (continued)39.5 insurance-related risk management (continued)market and credit risk (continued)(j) sensitivity analysis on financial risksThe analysis below is performed for reasonably possible movements in key variables with all other variables constant. The correlation of variables will have a significant effect in determining the ultimate fair values and/or amortised cost of financial assets, but to demonstrate the impact due to changes in variables, variables have to be changed on an individual basis. The movements in these variables are non-linear. The impact on profit after tax represents the effect caused by changes in fair value of financial assets whose fair values are recorded in the income statement, and changes in valuation of insurance contract liabilities. The impact on equity represents the impact on profit after tax and the effect on changes in fair value of financial assets held in Shareholders’ Fund.
market risk sensitivity analysis impact on profit after tax impact on equity
$ million 2011 2010 2011 2010
change in variables:
Interest rate
+100 basis points (77.7) (119.9) (121.2) (172.9)
–100 basis points (45.0) 39.4 (13.0) 84.1
LTRFDR
+10 basis points 16.0 11.5 16.0 11.5
–10 basis points (16.7) (11.5) (16.7) (11.5)
Foreign currency
Market value of assets in foreign currency +5% 12.3 24.4 45.3 47.9
Market value of assets in foreign currency –5% (12.3) (24.4) (45.3) (47.9)
Equity
Market indices +20% (1)
STI 1.3 3.4 93.1 96.4
KLCI 0.4 1.8 13.8 16.7
Market indices –20% (1)
STI (1.3) (3.4) (93.1) (96.4)
KLCI (0.4) (1.8) (13.8) (16.7)
Credit
Spread +100 basis points (197.2) (178.3) (227.2) (202.9)
Spread –100 basis points 197.2 178.3 227.2 202.9
Alternative investments (2)
Market value of all alternative investments +10% 17.8 17.2 21.8 22.5
Market value of all alternative investments –10% (17.8) (17.2) (21.8) (22.5)
(1) Comparatives have been restated to conform to current year’s presentation.(2) Alternative investments comprise investments in real estate, private equity, infrastructure and hedge funds.
The method for deriving sensitivity information and significant variables did not change from the previous year.

160 OCBC Annual Report 2011
40. Financial assets anD liabilities classiFicatiOn
GrOuP
$ millionheld for trading
Designated at fair value
through profit or loss
loans and receivables/
amortised cost
available-for-sale
insurance contracts total
2011
Cash and placements with central banks – – 12,897 – – 12,897
Singapore government treasury bills and securities 2,333 285 – 10,632 – 13,250
Other government treasury bills and securities 1,427 – – 5,970 – 7,397
Placements with and loans to banks 232 – 24,730 3,653 – 28,615
Debt and equity securities 1,795 – 805 12,481 – 15,081
Loans and bills receivable – – 133,557 – – 133,557
Assets pledged 395 – 53 1,391 – 1,839
Other assets (1) 5,899 – 3,079 – 113 9,091
Financial assets 12,081 285 175,121 34,127 113 221,727
Non-financial assets 6,943
228,670
LAF financial assets (2) 1,300 3,545 9,973 32,625 – 47,443
LAF non-financial assets (2) 1,645
total assets 277,758
Deposits of non-bank customers – – 154,555 – – 154,555
Deposits and balances of banks – – 21,653 – – 21,653
Trading portfolio liabilities 1,655 – – – – 1,655
Other liabilities (1) 6,113 – 3,885 – 316 10,314
Debt issued – – 13,063 – – 13,063
Financial liabilities 7,768 – 193,156 – 316 201,240
Non-financial liabilities 1,924
203,164
LAF financial liabilities (2) – – 4,783 – 44,421 49,204
total liabilities 252,368
(1) Other assets/liabilities include derivative receivables/payables and amount due from/to associates and joint ventures. (2) “LAF” refers to Life Assurance Fund.
notes to the Financial statements
For the financial year ended 31 December 2011

161OCBC Annual Report 2011
40. Financial assets anD liabilities classiFicatiOn (continued)
GrOuP
$ millionheld for trading
Designated at fair value
through profit or loss
loans and receivables/
amortised cost
available-for-sale
insurance contracts total
2010
Cash and placements with central banks – – 11,493 – – 11,493
Singapore government treasury bills and securities 1,557 90 – 9,509 – 11,156
Other government treasury bills and securities 2,186 21 – 3,738 – 5,945
Placements with and loans to banks 1 – 15,335 3,233 – 18,569
Debt and equity securities 1,854 – 600 11,801 – 14,255
Loans and bills receivable – – 104,989 – – 104,989
Assets pledged – – 38 708 – 746
Other assets (1) 4,837 – 3,038 – 80 7,955
Financial assets 10,435 111 135,493 28,989 80 175,108
Non-financial assets 6,689
181,797
LAF financial assets (2) 1,022 3,822 6,632 34,403 – 45,879
LAF non-financial assets (2) 1,607
total assets 229,283
Deposits of non-bank customers – – 123,300 – – 123,300
Deposits and balances of banks – – 16,508 – – 16,508
Trading portfolio liabilities 1,734 – – – – 1,734
Other liabilities (1) 4,563 – 3,109 – 217 7,889
Debt issued – 1 6,853 – – 6,854
Financial liabilities 6,297 1 149,770 – 217 156,285
Non-financial liabilities 1,872
158,157
LAF financial liabilities (2) – – 4,213 – 43,268 47,481
total liabilities 205,638
(1) Other assets/liabilities include derivative receivables/payables and amount due from/to associates and joint ventures. (2) “LAF” refers to Life Assurance Fund.

162 OCBC Annual Report 2011
40. Financial assets anD liabilities classiFicatiOn (continued)
banK
$ millionheld for trading
Designated at fair value
through profit or loss
loans and receivables/
amortised cost
available-for-sale total
2011
Cash and placements with central banks – – 6,986 – 6,986
Singapore government treasury bills and securities 2,333 – – 10,259 12,592
Other government treasury bills and securities 1,330 – – 2,658 3,988
Placements with and loans to banks 232 – 17,441 2,981 20,654
Debt and equity securities 1,446 – 735 7,540 9,721
Loans and bills receivable – – 97,787 – 97,787
Placements with and advances to subsidiaries – – 6,775 – 6,775
Assets pledged – – – 1,329 1,329
Other assets (1) 5,462 – 1,187 – 6,649
Financial assets 10,803 – 130,911 24,767 166,481
Non-financial assets 8,767
total assets 175,248
Deposits of non-bank customers – – 109,827 – 109,827
Deposits and balances of banks – – 18,881 – 18,881
Deposits and balances of subsidiaries – – 5,913 – 5,913
Trading portfolio liabilities 1,655 – – – 1,655
Other liabilities (1) 5,782 – 1,623 – 7,405
Debt issued – – 13,797 – 13,797
Financial liabilities 7,437 – 150,041 – 157,478
Non-financial liabilities 425
total liabilities 157,903
2010
Cash and placements with central banks – – 6,787 – 6,787
Singapore government treasury bills and securities 1,558 – – 8,927 10,485
Other government treasury bills and securities 1,740 – – 1,434 3,174
Placements with and loans to banks 1 – 10,587 3,024 13,612
Debt and equity securities 1,519 – 589 7,728 9,836
Loans and bills receivable – – 75,877 – 75,877
Placements with and advances to subsidiaries – – 4,098 – 4,098
Assets pledged – – – 708 708
Other assets (1) 4,462 – 828 – 5,290
Financial assets 9,280 – 98,766 21,821 129,867
Non-financial assets 8,779
total assets 138,646
Deposits of non-bank customers – – 88,891 – 88,891
Deposits and balances of banks – – 13,811 – 13,811
Deposits and balances of subsidiaries – – 4,624 – 4,624
Trading portfolio liabilities 1,734 – – – 1,734
Other liabilities (1) 4,222 – 1,181 – 5,403
Debt issued – 1 7,886 – 7,887
Financial liabilities 5,956 1 116,393 – 122,350
Non-financial liabilities 442
total liabilities 122,792
(1) Other assets/liabilities include derivative receivables/payables and amount due from/to associates and joint ventures.
notes to the Financial statements
For the financial year ended 31 December 2011

163OCBC Annual Report 2011
41. Fair values OF Financial instruments41.1 Fair valuesFinancial instruments comprise financial assets, financial liabilities and off-balance sheet financial instruments. The fair value of a financial instrument is the amount at which the instrument can be exchanged or settled between knowledgeable and willing parties in an arm’s length transaction. For financial assets and liabilities not carried at fair value on the financial statements, the Group has determined that their fair values were not materially different from the carrying amounts at the reporting date. The carrying amounts and fair values of financial instruments of the Group are described below.
Financial assets Fair values of cash and balances with central banks, placements with banks, interest and other short term receivables are expected to approximate their carrying value due to their short tenor or frequent re-pricing.
Securities held by the Group, comprising government securities and debt and equity securities are substantially carried at fair value on the balance sheet. Non-bank customer loans are carried at amortised cost on the balance sheet, net of specific and portfolio allowances. The Group deemed the fair value of non-bank loans to approximate their carrying amount as substantially the loans are subject to frequent re-pricing.
Financial liabilities Fair value of certain financial liabilities, which include mainly customer deposits with no stated maturity, interbank borrowings and borrowings under repurchase agreements, are expected to approximate their carrying amount due to their short tenor. For non-bank customer term deposits, cash flows based on contractual terms or derived based on certain assumptions, are discounted at market rates as at reporting date to estimate the fair value.
The fair values of the Group’s subordinated term notes are determined based on quoted market prices and independent broker offer prices. For other debts issued which are usually short term, the fair value approximates the carrying value.
41.2 Fair value hierarchyThe Group determines the fair values of its financial assets and liabilities using various measurements. The different levels of fair value measurements are as follows:• Level 1 – quoted prices (unadjusted) for identical assets or liabilities;• Level 2 – inputs other than quoted prices included within Level 1 that are observable market data either directly (i.e. as prices) or indirectly• (i.e. derived from observable market data); and• Level 3 – inputs for the valuation that are not based on observable market data.

164 OCBC Annual Report 2011
41. Fair values OF Financial instruments (continued)41.2 Fair value hierarchy (continued)The following table summarises the Group’s financial assets and liabilities recorded at fair value by level of the fair value hierarchies:
2011 2010
$ million level 1 level 2 level 3 total level 1 level 2 level 3 total
GrOuP
assets measured at fair value
Placements with and loans to banks (1) – 3,885 # 3,885 – 3,233 1 3,234
Debt and equity securities (1) 3,113 10,856 307 14,276 3,099 10,079 477 13,655
Derivative receivables 17 5,806 76 5,899 22 4,713 102 4,837
Government treasury bills and securities 20,647 – – 20,647 16,316 785 – 17,101
Life Assurance Fund investment assets 17,928 19,542 – 37,470 19,144 20,103 – 39,247
Other financial assets (1) 207 1,579 – 1,786 74 634 – 708
total 41,912 41,668 383 83,963 38,655 39,547 580 78,782
liabilities measured at fair value
Derivative payables 19 6,026 68 6,113 23 4,448 92 4,563
Trading portfolio liabilities 1,655 – – 1,655 1,734 – – 1,734
Other financial liabilities (1) – – – – – 1 – 1
total 1,674 6,026 68 7,768 1,757 4,449 92 6,298
banK
assets measured at fair value
Placements with and loans to banks (1) – 3,213 # 3,213 – 3,024 1 3,025
Debt and equity securities (1) 1,165 7,747 74 8,986 1,215 7,879 153 9,247
Derivative receivables 1 5,419 42 5,462 10 4,347 105 4,462
Government treasury bills and securities 16,580 – – 16,580 13,659 – – 13,659
Other financial assets (1) 60 1,269 – 1,329 74 634 – 708
total 17,806 17,648 116 35,570 14,958 15,884 259 31,101
liabilities measured at fair value
Derivative payables 2 5,749 31 5,782 9 4,136 77 4,222
Trading portfolio liabilities 1,655 – – 1,655 1,734 – – 1,734
Other financial liabilities (1) – – – – – 1 – 1
total 1,657 5,749 31 7,437 1,743 4,137 77 5,957
(1) Comparatives have been restated to conform to current year’s presentation.(2) # represents amounts less than $0.5 million.
notes to the Financial statements
For the financial year ended 31 December 2011

165OCBC Annual Report 2011
41. Fair values OF Financial instruments (continued)41.2 Fair value hierarchy (continued)Movements in the Group’s Level 3 financial assets and liabilities are as follows:
GrOuP 2011 2010
$ million
available-for-sale
assets
assets held for trading
Derivative receivables total
available-for-sale
assets
assets held for trading (1)
Derivative receivables total
assets measured at fair value
At 1 January 387 91 102 580 325 78 111 514
Purchases 25 – 200 225 116 – 11 127
Settlements/disposals (112) (1) (1) (114) (75) (17) # (92)
Transfers out of Level 3 (103) (2) – – (103) (8) (3) – (32 ) (4) (40)
Gains/(losses) recognised in
- profit or loss 23 (25) (225) (227) 30 32 12 74
- other comprehensive income 22 # # 22 (1) (2) # (3)
At 31 December 242 65 76 383 387 91 102 580
Total gains/(losses) included in
profit or loss for assets held
at the end of the year 10 (25) 8 (7) 26 32 48 106
Gains/(losses) included in profit or loss are presented in the income statement as follows:
2011 2010
$ million
net interest income
trading income
Other income total
net interest income
trading income (1)
Other income total
Total gains/(losses) included in
profit or loss for the year ended 1 (250) 22 (227) (2) 43 33 74
Total gains/(losses) included in
profit or loss for assets held
at the end of the year – (17) 10 (7) – 80 26 106
(1) Comparatives have been restated to conform to current year’s presentation.(2) Relates to transfers to Level 1 for debt securities converted to quoted equity securities and Level 2 for debt securities due to availability of market observable inputs. (3) Relates to transfers to Level 1 for debt securities converted to quoted equity securities.(4) Relates to transfers to Level 2 for interest rate derivatives due to availability of in-house pricing model with significant market observable inputs.(5) # represents amounts less than $0.5 million.

166 OCBC Annual Report 2011
41. Fair values OF Financial instruments (continued)41.2 Fair value hierarchy (continued)
banK 2011 2010
$ million
available-for-sale
assets
assets held for trading
Derivative receivables total
available-for-sale
assets
assets held for trading
Derivative receivables total
assets measured at fair value
At 1 January 153 1 105 259 192 19 111 322
Purchases 14 – 177 191 – – 10 10
Settlements/disposals (100) (1) – (101) (67) (17) – (84)
Transfers out of Level 3 (6) (1) – – (6) (2 ) (1) – (32) (2) (34)
Gains/(losses) recognised in
- profit or loss 20 (#) (240) (220) 30 1 16 47
- other comprehensive income (7) # – (7) (#) (2) – (2)
At 31 December 74 # 42 116 153 1 105 259
Total gains/(losses) included in
profit or loss for assets held
at the end of the year 10 (#) (3) 7 26 2 51 79
Gains/(losses) included in profit or loss are presented in the income statement as follows:
2011 2010
$ million
net interest income
trading income
Other income total
net interest income
trading income
Other income total
Total gains/(losses) included in
profit or loss for the year ended 1 (240) 19 (220) (2) 16 33 47
Total gains/(losses) included in
profit or loss for assets held
at the end of the year – (3) 10 7 – 53 26 79
(1) Relates to transfers to Level 1 for debt securities converted to quoted equity securities.(2) Relates to transfers to Level 2 for interest rate derivatives due to availability of in-house pricing model with significant market observable inputs.(3) # represents amounts less than $0.5 million.
notes to the Financial statements
For the financial year ended 31 December 2011

167OCBC Annual Report 2011
41. Fair values OF Financial instruments (continued)41.2 Fair value hierarchy (continued)
GrOuP banK
2011 2010 2011 2010
$ millionDerivative
payables totalDerivative
payables totalDerivative
payables totalDerivative
payables total
liabilities measured at fair value
At 1 January 92 92 153 153 77 77 149 149
Issues 223 223 30 30 199 199 16 16
Settlements/disposals (8) (8) (26) (26) – – (25) (25)
Transfers out of Level 3 – – (25 ) (1) (25) – – (25 ) (1) (25)
Gains recognised in
- profit or loss (239) (239) (37) (37) (245) (245) (35) (35)
- other comprehensive income (#) (#) (3) (3) (#) (#) (3) (3)
At 31 December 68 68 92 92 31 31 77 77
Total losses included in profit or
loss for liabilities held at the
end of the year (24) (24) (16) (16) (14) (14) (15) (15)
Gains/(losses) included in profit or loss are presented in the income statements as follows:
GrOuP banK
2011 2010 2011 2010
$ milliontrading income total
trading income total
trading income total
trading income total
Total gains included in profit or
loss for the year ended 239 239 37 37 245 245 35 35
Total losses included in profit or
loss for liabilities held at the
end of the year (24) (24) (16) (16) (14) (14) (15) (15)
(1) Relates to transfers to Level 2 for interest rate derivatives due to availability of in-house pricing model with significant market observable inputs.(2) # represents amounts less than $0.5 million.

168 OCBC Annual Report 2011
42. cOntinGent liabilitiesThe Group conducts businesses involving acceptances, guarantees, documentary credits and other similar transactions. Acceptances are undertakings by the Group to pay on receipt of bills of exchange drawn. The Group issues guarantees on the performance of customers to third parties. Documentary credits commit the Group to make payments to third parties on presentation of stipulated documents. As the Group will only be required to meet these obligations in the event of customer’s default, the cash requirements of these instruments are expected to be considerably below their nominal contractual amounts.
GrOuP banK2011$’000
2010$’000
2011$’000
2010$’000
Guarantees and standby letters of credit:
Term to maturity of one year or less 3,941,393 3,590,253 3,378,077 2,994,756
Term to maturity of more than one year 2,930,989 2,700,481 2,550,905 2,620,649
6,872,382 6,290,734 5,928,982 5,615,405
Acceptances and endorsements 1,306,778 613,800 317,521 172,699
Documentary credits and other short term trade-related transactions 1,909,785 1,440,679 1,330,637 1,047,224
Others 256,272 168,197 – –
10,345,217 8,513,410 7,577,140 6,835,328
42.1 analysed by industry
Agriculture, mining and quarrying 226,636 178,182 29,432 6,706
Manufacturing 1,325,228 1,312,676 944,678 1,015,067
Building and construction 1,621,289 1,572,053 1,209,827 1,098,861
General commerce 3,373,159 2,381,917 2,105,000 1,723,021
Transport, storage and communication 587,446 576,553 562,405 531,037
Financial institutions, investment and holding companies 1,537,763 1,079,824 1,522,267 1,353,713
Professionals and individuals 344,865 237,197 75,536 81,600
Others 1,328,831 1,175,008 1,127,995 1,025,323
10,345,217 8,513,410 7,577,140 6,835,328
42.2 analysed by geography
Singapore 6,093,754 5,450,559 6,231,479 5,482,467
Malaysia 1,404,322 1,301,831 365,409 600,168
Rest of Southeast Asia 922,834 673,689 122,997 51,225
Greater China 1,723,377 911,133 624,661 501,585
Other Asia Pacific 54,938 81,615 86,602 105,299
Rest of the World 145,992 94,583 145,992 94,584
10,345,217 8,513,410 7,577,140 6,835,328
Contingent liabilities analysed by geography is based on the country where the transactions are recorded.
notes to the Financial statements
For the financial year ended 31 December 2011

169OCBC Annual Report 2011
43. cOmmitmentsCommitments comprise mainly agreements to provide credit facilities to customers. Such commitments can either be made for a fixed period, or have no specific maturity but are cancellable by the Group subject to notice requirements.
GrOuP banK2011$’000
2010$’000
2011$’000
2010$’000
43.1 credit commitments
Undrawn credit facilities:
Term to maturity of one year or less 46,856,993 41,818,564 29,684,812 28,963,549
Term to maturity of more than one year 16,718,428 12,866,744 13,901,960 10,934,717
63,575,421 54,685,308 43,586,772 39,898,266
Undrawn note issuance and revolving underwriting facilities 2,047 64,150 – –
63,577,468 54,749,458 43,586,772 39,898,266
43.2 Other commitments
Operating lease (non-cancellable) commitments:
Within 1 year 47,566 38,307 18,236 13,931
After 1 year but within 5 years 75,974 63,414 26,375 21,985
Over 5 years 1,325 4,372 720 1,489
124,865 106,093 45,331 37,405
Capital commitment authorised and contracted 101,001 77,694 63,814 52,648
Forward deposits and assets purchase 1,088,891 139,440 1,084,186 154,283
1,314,757 323,227 1,193,331 244,336
43.3 total commitments 64,892,225 55,072,685 44,780,103 40,142,602
43.4 credit commitments analysed by industry
Agriculture, mining and quarrying 1,109,307 807,464 620,126 413,369
Manufacturing 5,477,230 4,270,266 2,848,397 2,278,921
Building and construction 5,228,580 4,250,177 4,050,765 2,916,466
General commerce 8,702,481 7,183,980 7,004,059 5,743,120
Transport, storage and communication 2,596,716 3,333,523 2,185,642 3,185,596
Financial institutions, investment and holding companies (1) 8,615,250 6,726,866 8,864,768 7,077,193
Professionals and individuals (1) 21,643,749 19,207,513 14,862,655 15,300,268
Others (1) 10,204,155 8,969,669 3,150,360 2,983,333
63,577,468 54,749,458 43,586,772 39,898,266
43.5 credit commitments analysed by geography
Singapore 48,678,969 42,115,455 38,091,141 35,040,589
Malaysia 6,291,633 5,931,435 167,950 261,933
Rest of Southeast Asia 2,700,733 1,765,361 341,184 321,292
Greater China 4,598,806 3,527,224 3,672,129 2,857,436
Other Asia Pacific 699,899 935,512 706,940 942,545
Rest of the World 607,428 474,471 607,428 474,471
63,577,468 54,749,458 43,586,772 39,898,266
(1) Comparatives have been restated to conform to current year’s presentation.
Credit commitments analysed by geography is based on the country where the transactions are recorded.

170 OCBC Annual Report 2011
44. assets PleDGeD
GrOuP banK2011$’000
2010$’000
2011$’000
2010$’000
Other government treasury bills and securities (Note 24) 207,297 74,398 59,553 74,398
Placements with and loans to banks (Note 25) 831,495 218,069 831,495 218,069
Loans and bills receivable (Note 26) 53,225 37,566 – –
Debt securities (Note 30) 746,964 415,704 437,857 415,704
1,838,981 745,737 1,328,905 708,171
Repo balances for assets pledged 1,736,590 654,439 1,238,373 616,872
The fair value of financial assets accepted as collateral, which the Group is permitted to sell or re-pledge in the absence of default is $1,193.9 million (2010: $947.5 million), of which nil (2010: $31.1 million) have been sold or re-pledged. The Group is obliged to return equivalent assets.
Transactions are conducted under terms and conditions that are usual and customary to standard securities borrowing and lending activities.
45. assets helD FOr saleAssets held for sale comprise properties which the Group is disposing, subject to terms that are usual and customary in the completion of the sale. The transactions are not expected to have a material impact on the Group’s net earnings and net assets for the current financial period.
46. minimum lease rental receivableThe future minimum lease rental receivable under non-cancellable operating leases by remaining period to lease expiry is as follows:
GrOuP banK2011$’000
2010$’000
2011$’000
2010$’000
Within 1 year 46,648 48,077 20,996 18,654
After 1 year but within 5 years 56,115 74,985 16,128 21,289
Over 5 years 3,896 5,918 – –
106,659 128,980 37,124 39,943
notes to the Financial statements
For the financial year ended 31 December 2011
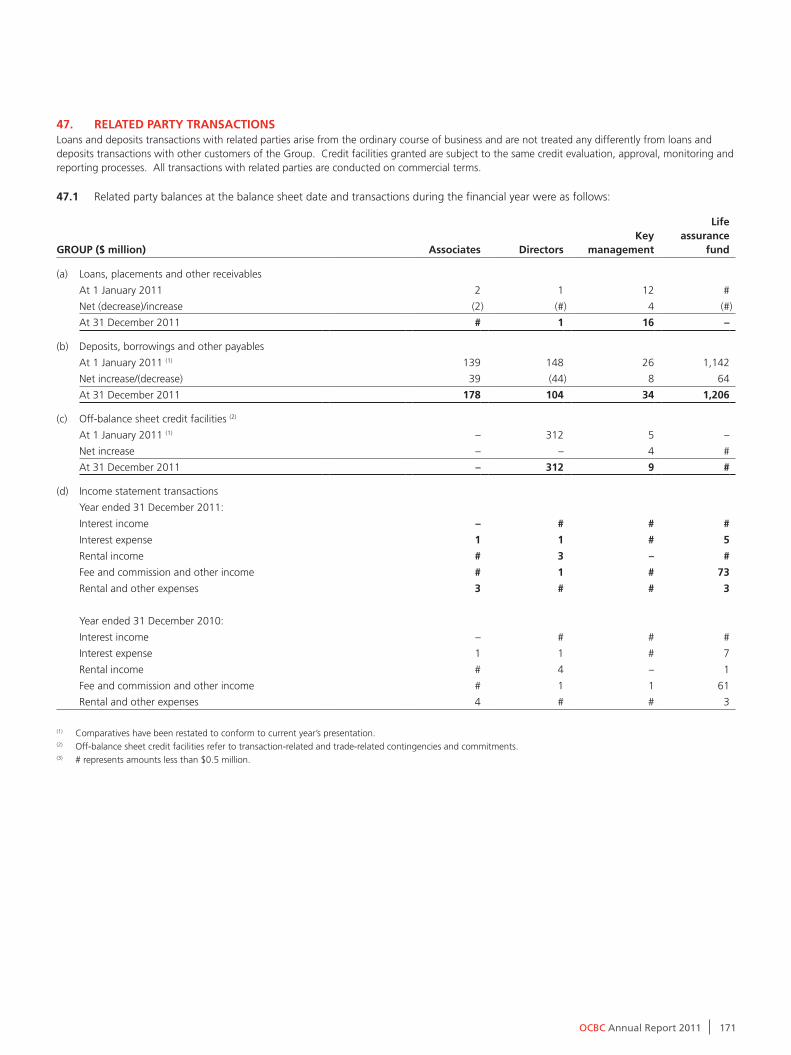
171OCBC Annual Report 2011
47. relateD Party transactiOnsLoans and deposits transactions with related parties arise from the ordinary course of business and are not treated any differently from loans and deposits transactions with other customers of the Group. Credit facilities granted are subject to the same credit evaluation, approval, monitoring and reporting processes. All transactions with related parties are conducted on commercial terms.
47.1 Related party balances at the balance sheet date and transactions during the financial year were as follows:
GrOuP ($ million) associates DirectorsKey
management
life assurance
fund
(a) Loans, placements and other receivables
At 1 January 2011 2 1 12 #
Net (decrease)/increase (2) (#) 4 (#)
At 31 December 2011 # 1 16 –
(b) Deposits, borrowings and other payables
At 1 January 2011 (1) 139 148 26 1,142
Net increase/(decrease) 39 (44) 8 64
At 31 December 2011 178 104 34 1,206
(c) Off-balance sheet credit facilities (2)
At 1 January 2011 (1) – 312 5 –
Net increase – – 4 #
At 31 December 2011 – 312 9 #
(d) Income statement transactions
Year ended 31 December 2011:
Interest income – # # #
Interest expense 1 1 # 5
Rental income # 3 – #
Fee and commission and other income # 1 # 73
Rental and other expenses 3 # # 3
Year ended 31 December 2010:
Interest income – # # #
Interest expense 1 1 # 7
Rental income # 4 – 1
Fee and commission and other income # 1 1 61
Rental and other expenses 4 # # 3
(1) Comparatives have been restated to conform to current year’s presentation.(2) Off-balance sheet credit facilities refer to transaction-related and trade-related contingencies and commitments.(3) # represents amounts less than $0.5 million.

172 OCBC Annual Report 2011
47. relateD Party transactiOns (continued)
banK ($ million) subsidiaries associates DirectorsKey
management
life assurance
fund
(a) Loans, placements and other receivables
At 1 January 2011 4,098 – 1 4 –
Net increase/(decrease) 2,677 – (#) 6 –
At 31 December 2011 6,775 – # 10 –
(b) Deposits, borrowings and other payables
At 1 January 2011 (1) 6,524 118 115 24 681
Net increase/(decrease) 1,409 46 (30) 9 (157)
At 31 December 2011 7,933 164 85 33 524
(c) Off-balance sheet credit facilities (2)
At 1 January 2011 (1) 1,358 – 312 1 –
Net (decrease)/increase (208) – – # #
At 31 December 2011 1,150 – 312 1 #
(d) Income statement transactions
Year ended 31 December 2011:
Interest income 77 – # # #
Interest expense 134 1 # # 1
Rental income 6 – – – –
Fee and commission and other income 17 – # # 72
Rental and other expenses 222 3 # # #
Year ended 31 December 2010:
Interest income 50 – # # #
Interest expense 114 # # # 1
Rental income 4 – – – –
Fee and commission and other income 12 – # # 46
Rental and other expenses 220 4 # # #
(1) Comparatives have been restated to conform to current year’s presentation.(2) Off-balance sheet credit facilities refer to transaction-related and trade-related contingencies and commitments.(3) # represents amounts less than $0.5 million.
47.2 Key management personnel compensation
banK2011
$ million2010
$ million
Key management personnel compensation is as follows:
Short-term employee benefits 35 35
Share-based benefits 14 14
49 49
Certain performance-related payments to key management personnel of the Bank in relation to the performance year 2011 included in the above table are subject to the approval of the Remuneration Committee.
notes to the Financial statements
For the financial year ended 31 December 2011

173OCBC Annual Report 2011
48. new accOuntinG stanDarDs anD interPretatiOnsAs of the balance sheet date, certain new standards, amendments and interpretations to existing accounting standards have been published. For the Group, the following relevant new/revised financial reporting standards and interpretations are mandatory with effect from the annual period commencing 1 January 2012:
• FRS 12 (Amendments) Deferred Tax: Recovery of Underlying Assets • FRS 107 (Amendments) Disclosures: Transfers of Financial Assets
The initial application of the above standards (including their consequential amendments) and interpretations are not expected to have any material impact on the Group’s financial statements.

174 OCBC Annual Report 2011
Group’s major Properties
As at 31 December 2011
Purpose
effectivestake
(%)
Grossfloor area
(sq ft)
carryingvalue
s$’000
marketvalue
s$’000
(1)
singapore
65 Chulia Street, OCBC Centre Office 100 993,089 29,907 850,000
63 Chulia Street, OCBC Centre East Office 100 242,385 101,314 318,700
18 Church Street, OCBC Centre South Office 100 118,909 75,987 131,350
63 Market Street Office 100 248,996 297,703 394,000
11 Tampines Central 1 Office 100 115,824 64,551 84,000
31 Tampines Finance Park Avenue 4 Office 100 97,572 49,507 63,000
105 Cecil Street, #01-00, #02-01 to 04, #04-01 to 04,
#14-01 to 04, #15-01 to 04, #17-01 to 04 The Octagon Building Office 100 34,563 (2) 37,900 43,300
260 Tanjong Pagar Road Office 100 44,940 5,128 36,100
101 Cecil Street #01-01/02, Tong Eng Building Office 100 16,146 (2) 1,881 18,900
110 Robinson Road Office 100 22,120 4,427 18,400
460 North Bridge Road Office 100 26,576 3,024 25,700
Block 9 & 13 Tanjong Rhu Road, The Waterside Residential 100 251,889 40,373 255,465
2 Mt Elizabeth Link, Somerset Compass Residential 100 104,377 21,920 169,000
6, 6A to 6H, 6J to 6N, 6P to 6U Chancery Hill Road,
The Compass at Chancery Residential 100 54,739 13,562 46,150
257 River Valley Road, #02-00 to #10-00, Valley Lodge Residential 100 23,920 2,678 21,000
277 Orchard Road Land under development 100 72,910 (3) 114,323 533,400
864,185 3,008,465
malaysia
18 Jalan Tun Perak, Kuala Lumpur, Menara OCBC Office 100 243,262 24,405 54,243
indonesia
Jl Dr. Satrio, Casablanca, Jakarta, Bank NISP Tower Office 85 362,313 14,081 31,241
People’s republic of china
1155 Yuanshen Road, Pudong Shanghai, 华侨银行大厦 Office 100 249,161 187,593 188,779
Other properties in
Singapore 144,215 453,270
Malaysia 75,074 175,170
Rest of Southeast Asia 40,655 56,311
Other Asia Pacific 90,069 334,193
Rest of the World 2,086 13,519
352,099 1,032,463
total (4) 1,442,363 4,315,191
(1) Valuations were made by independent firms of professional valuers.(2) Refers to strata floor area. (3) Refers to land area.(4) Does not include properties held by GEH Group’s insurance subsidiaries under their life assurance funds.
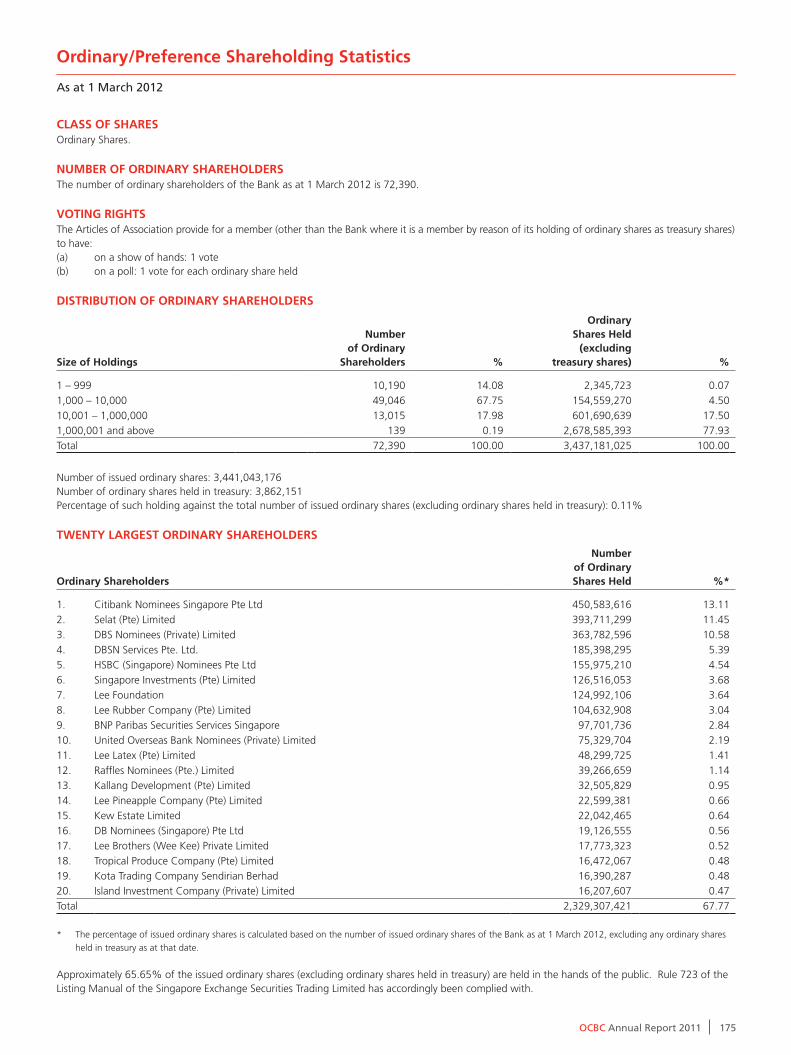
175OCBC Annual Report 2011
class OF sharesOrdinary Shares.
number OF OrDinary sharehOlDersThe number of ordinary shareholders of the Bank as at 1 March 2012 is 72,390.
vOtinG riGhtsThe Articles of Association provide for a member (other than the Bank where it is a member by reason of its holding of ordinary shares as treasury shares) to have:(a) on a show of hands: 1 vote(b) on a poll: 1 vote for each ordinary share held
DistributiOn OF OrDinary sharehOlDers
size of holdings
number of Ordinary
shareholders %
Ordinary shares held
(excluding treasury shares) %
1 – 999 10,190 14.08 2,345,723 0.07
1,000 – 10,000 49,046 67.75 154,559,270 4.50
10,001 – 1,000,000 13,015 17.98 601,690,639 17.501,000,001 and above 139 0.19 2,678,585,393 77.93
Total 72,390 100.00 3,437,181,025 100.00
Number of issued ordinary shares: 3,441,043,176Number of ordinary shares held in treasury: 3,862,151Percentage of such holding against the total number of issued ordinary shares (excluding ordinary shares held in treasury): 0.11%
twenty larGest OrDinary sharehOlDers
Ordinary shareholders
number of Ordinary shares held %*
1. Citibank Nominees Singapore Pte Ltd 450,583,616 13.11
2. Selat (Pte) Limited 393,711,299 11.45
3. DBS Nominees (Private) Limited 363,782,596 10.58
4. DBSN Services Pte. Ltd. 185,398,295 5.39
5. HSBC (Singapore) Nominees Pte Ltd 155,975,210 4.54
6. Singapore Investments (Pte) Limited 126,516,053 3.68
7. Lee Foundation 124,992,106 3.64
8. Lee Rubber Company (Pte) Limited 104,632,908 3.04
9. BNP Paribas Securities Services Singapore 97,701,736 2.84
10. United Overseas Bank Nominees (Private) Limited 75,329,704 2.19
11. Lee Latex (Pte) Limited 48,299,725 1.41
12. Raffles Nominees (Pte.) Limited 39,266,659 1.14
13. Kallang Development (Pte) Limited 32,505,829 0.95
14. Lee Pineapple Company (Pte) Limited 22,599,381 0.66
15. Kew Estate Limited 22,042,465 0.64
16. DB Nominees (Singapore) Pte Ltd 19,126,555 0.56
17. Lee Brothers (Wee Kee) Private Limited 17,773,323 0.52
18. Tropical Produce Company (Pte) Limited 16,472,067 0.48
19. Kota Trading Company Sendirian Berhad 16,390,287 0.4820. Island Investment Company (Private) Limited 16,207,607 0.47
Total 2,329,307,421 67.77
* The percentage of issued ordinary shares is calculated based on the number of issued ordinary shares of the Bank as at 1 March 2012, excluding any ordinary shares
held in treasury as at that date.
Approximately 65.65% of the issued ordinary shares (excluding ordinary shares held in treasury) are held in the hands of the public. Rule 723 of the Listing Manual of the Singapore Exchange Securities Trading Limited has accordingly been complied with.
Ordinary/Preference shareholding statistics
As at 1 March 2012

176 OCBC Annual Report 2011
substantial OrDinary sharehOlDers
According to the register required to be kept under section 88 of the Companies Act, Cap. 50, the following are the only substantial ordinary shareholders of the Bank having an interest of 5 per cent or more of the total votes attached to all the voting shares in the Bank as undernoted:
substantial ordinary shareholders
Ordinary shares
registered in the name of
the substantial ordinary
shareholders
Ordinary shares held by the substantial
ordinary shareholders
in the name of nominees
Ordinary shares in which the
substantial ordinary
shareholders are deemed to
be interested total
Percentage* of issued
ordinary shares
as at1.3.2012
as at1.3.2012
as at1.3.2012
as at1.3.2012
Lee Foundation 124,992,106 – 544,847,743 (1) 669,839,849 19.49%
Selat (Pte) Limited 393,711,299 – 17,500,981 (2) 411,212,280 11.96%
Aberdeen Asset Management PLC – – 240,789,254 (3) 240,789,254 7.01%
Aberdeen Asset Management Asia Limited – – 212,907,981 (4) 212,907,981 6.19%
* The percentage of issued ordinary shares is calculated based on the number of issued ordinary shares of the Bank as at 1 March 2012, excluding any ordinary shares
held in treasury as at that date.
(1) This represents Lee Foundation’s deemed interest in (a) the 22,599,381 ordinary shares held by Lee Pineapple Company (Pte) Limited, (b) the 393,711,299 ordinary
shares held by Selat (Pte) Limited, (c) the 126,516,053 ordinary shares held by Singapore Investments (Pte) Limited and (d) the 2,021,010 ordinary shares held by
Peninsula Plantations Sendirian Berhad.
(2) This represents Selat (Pte) Limited’s deemed interest in (a) the 1,293,374 ordinary shares held by South Asia Shipping Company Private Limited and (b) the 16,207,607
ordinary shares held by Island Investment Company (Private) Limited.
(3) This represents the deemed interest in 240,789,254 ordinary shares held by Aberdeen Asset Management PLC and its subsidiaries, Aberdeen Asset Management
Asia Limited, Aberdeen Asset Management Inc, Aberdeen Asset Management Investment Services Limited, Aberdeen Asset Management Sdn Bhd, Aberdeen Asset
Managers Limited, Aberdeen International Fund Managers Limited, Aberdeen Private Wealth Management Limited, Aberdeen Fund Management Limited, Aberdeen
Investment Management K K and Aberdeen Asset Management Limited (together, the “AAM Group”), through various custodians, on behalf of the accounts
managed by the AAM Group. The Bank has been advised by Aberdeen Asset Management PLC that the AAM Group holds a total of 240,789,254 ordinary shares in
the Bank across all mandates, equivalent to 7.01% of the Bank’s issued ordinary shares, of which the AAM Group is given disposal rights and proxy voting rights for
145,968,316 ordinary shares equivalent to 4.25% and disposal rights without proxy voting rights for 94,820,938 ordinary shares.
(4) This represents the deemed interest in 212,907,981 ordinary shares held by Aberdeen Asset Management Asia Limited (“AAMAL”), through various custodian,
on behalf of the accounts managed by AAMAL. The Bank has been advised by AAMAL that it holds a total of 212,907,981 ordinary shares in the Bank across all
mandates, equivalent to 6.19% of the Bank’s issued ordinary shares, of which AAMAL is given disposal rights and proxy voting rights for 130,116,468 ordinary shares
equivalent to 3.79% and disposal rights without proxy voting rights for 82,791,513 ordinary shares.
Ordinary/Preference shareholding statistics
As at 1 March 2012

177OCBC Annual Report 2011
class OF sharesNon-Cumulative Non-Convertible Class B Preference Shares.
number OF class b PreFerence sharehOlDersThe number of Class B Preference Shareholders of the Bank as at 1 March 2012 is 9,245.
vOtinG riGhtsExcept as provided below, the Class B Preference Shareholders shall not be entitled to attend and vote at general meetings of the Bank.
The Class B Preference Shareholders shall be entitled to attend a class meeting of the Class B Preference Shareholders. Every Class B Preference Shareholder who is present in person at such class meeting shall have on a show of hands one vote and on a poll one vote for every Class B Preference Share of which he is the holder.
If dividends with respect to the Class B Preference Shares in respect of such number of consecutive dividend periods as shall be equal to or exceed 12 calendar months have not been paid in full when due, then the Class B Preference Shareholders shall have the right to receive notice of, attend, speak and vote at general meetings of the Bank on all matters, including the winding-up of the Bank, and such right shall continue until after the next following dividend date on which a dividend in respect of the Class B Preference Shares is paid in full (or an amount equivalent to the dividend to be paid in respect of the next dividend period has been paid or irrevocably set aside in a separately designated trust account for payment to the Class B Preference Shareholders). Every Class B Preference Shareholder who is present in person at such general meetings shall have on a show of hands one vote and on a poll one vote for every Class B Preference Share of which he is the holder.
DistributiOn OF class b PreFerence sharehOlDers
size of holdings
number of class b
Preference shareholders %
number of class b
Preference shares held %
1 – 999 7,527 81.42 2,319,620 23.20
1,000 – 10,000 1,647 17.81 3,453,480 34.5310,001 – 1,000,000 71 0.77 4,226,900 42.27
Total 9,245 100.00 10,000,000 100.00
twenty larGest class b PreFerence sharehOlDers
class b Preference shareholders
number of class b
Preference shares held %
1. Bank of Singapore Nominees Pte. Ltd. 906,930 9.07
2. Citibank Nominees Singapore Pte Ltd 840,920 8.41
3. DBS Nominees (Private) Limited 358,900 3.59
4. HSBC (Singapore) Nominees Pte Ltd 309,400 3.09
5. United Overseas Bank Nominees (Private) Limited 264,200 2.64
6. Raffles Nominees (Pte.) Limited 193,550 1.94
7. NTUC Fairprice Co-Operative Ltd 120,000 1.20
8. Quek Neo Kia or Lim Guat Swee 64,000 0.64
9. Liew Yeow Weng 51,300 0.51
10. The Lotus Sanctuary Hospitality Pte Ltd 50,000 0.50
11. OCBC Securities Private Limited 44,600 0.45
12. DB Nominees (Singapore) Pte Ltd 35,900 0.36
13. Tan Boy Tee 35,000 0.35
14. Liauw Samin 32,500 0.33
15. UOB Kay Hian Private Limited 31,200 0.31
16. George Lee Private Limited 30,000 0.30
17. Lim Earn Sian 30,000 0.30
18. Ong Geok Eng 30,000 0.30
19. Merrill Lynch (Singapore) Pte. Ltd. 29,500 0.3020. OCBC Nominees Singapore Private Limited 25,900 0.26
Total 3,483,800 34.85
Note: The Bank is not required to maintain a register of substantial shareholders under section 88 of the Companies Act, Cap. 50 in relation to the Class B Preference Shares.

178 OCBC Annual Report 2011
class OF sharesNon-Cumulative Non-Convertible Class E Preference Shares.
number OF class e PreFerence sharehOlDersThe number of Class E Preference Shareholders of the Bank as at 1 March 2012 is 2,458.
vOtinG riGhtsExcept as provided below, the Class E Preference Shareholders shall not be entitled to attend and vote at general meetings of the Bank.
The Class E Preference Shareholders shall be entitled to attend a class meeting of the Class E Preference Shareholders. Every Class E Preference Shareholder who is present in person at such class meeting shall have on a show of hands one vote and on a poll one vote for every Class E Preference Share of which he is the holder.
If dividends with respect to the Class E Preference Shares in respect of such number of consecutive dividend periods as shall be equal to or exceed 12 calendar months have not been paid in full when due, then the Class E Preference Shareholders shall have the right to receive notice of, attend, speak and vote at general meetings of the Bank on all matters, including the winding-up of the Bank, and such right shall continue until after the next following dividend date on which a dividend in respect of the Class E Preference Shares is paid in full (or an amount equivalent to the dividend to be paid in respect of the next dividend period has been paid or irrevocably set aside in a separately designated trust account for payment to the Class E Preference Shareholders). Every Class E Preference Shareholder who is present in person at such general meetings shall have on a show of hands one vote and on a poll one vote for every Class E Preference Share of which he is the holder.
DistributiOn OF class e PreFerence sharehOlDers
size of holdings
number of class e
Preference shareholders %
number of class e
Preference shares held %
1 – 999 1,690 68.75 520,370 10.41
1,000 – 10,000 716 29.13 1,836,820 36.7410,001 – 1,000,000 52 2.12 2,642,810 52.85
Total 2,458 100.00 5,000,000 100.00
twenty larGest class e PreFerence sharehOlDers
class e Preference shareholders
number of class e
Preference shares held %
1. Citibank Nominees Singapore Pte Ltd 879,800 17.60
2. DBS Nominees (Private) Limited 292,860 5.86
3. Pan-United Investments Pte. Ltd. 147,800 2.96
4. E M Services Private Limited 137,800 2.76
5. Raffles Nominees (Pte.) Limited 84,700 1.69
6. HSBC (Singapore) Nominees Pte Ltd 83,600 1.67
7. National Council of Social Service 80,000 1.60
8. Tan Chee Jin 58,900 1.18
9. United Overseas Bank Nominees (Private) Limited 50,200 1.00
10. BNP Paribas Nominees Singapore Pte Ltd 43,000 0.86
11. DB Nominees (Singapore) Pte Ltd 32,500 0.65
12. Titular Roman Catholic Archbishop of Singapore 31,000 0.62
13. AXA Insurance Singapore Pte Ltd 30,000 0.60
14. Hobee Print Pte Ltd 30,000 0.60
15. Phng Hooi Chay 30,000 0.60
16. DBSN Services Pte. Ltd. 29,800 0.60
17. Tang Wee Loke 27,500 0.55
18. Bank of Singapore Nominees Pte. Ltd. 26,000 0.52
19. Lim Chiang Hoe or Lim Shuh Moh 25,000 0.5020. Kimanis Marine Pte Ltd 23,100 0.46
Total 2,143,560 42.88
Note: The Bank is not required to maintain a register of substantial shareholders under section 88 of the Companies Act, Cap. 50 in relation to the Class E Preference Shares.
Ordinary/Preference shareholding statistics
As at 1 March 2012

179OCBC Annual Report 2011
class OF sharesNon-Cumulative Non-Convertible Class G Preference Shares.
number OF class G PreFerence sharehOlDersThe number of Class G Preference Shareholders of the Bank as at 1 March 2012 is 6,067.
vOtinG riGhtsExcept as provided below, the Class G Preference Shareholders shall not be entitled to attend and vote at general meetings of the Bank.
The Class G Preference Shareholders shall be entitled to attend a class meeting of the Class G Preference Shareholders. Every Class G Preference Shareholder who is present in person at such class meeting shall have on a show of hands one vote and on a poll one vote for every Class G Preference Share of which he is the holder.
If dividends with respect to the Class G Preference Shares in respect of such number of consecutive dividend periods as shall be equal to or exceed 12 calendar months have not been paid in full when due, then the Class G Preference Shareholders shall have the right to receive notice of, attend, speak and vote at general meetings of the Bank on all matters, including the winding-up of the Bank, and such right shall continue until after the next following dividend date on which a dividend in respect of the Class G Preference Shares is paid in full (or an amount equivalent to the dividend to be paid in respect of the next dividend period has been paid or irrevocably set aside in a separately designated trust account for payment to the Class G Preference Shareholders). Every Class G Preference Shareholder who is present in person at such general meetings shall have on a show of hands one vote and on a poll one vote for every Class G Preference Share of which he is the holder.
DistributiOn OF class G PreFerence sharehOlDers
size of holdings
number of class G
Preference shareholders %
number of class G
Preference shares held %
1 – 999 648 10.68 285,156 0.07
1,000 – 10,000 3,330 54.89 13,998,760 3.54
10,001 – 1,000,000 2,065 34.04 150,754,248 38.081,000,001 and above 24 0.39 230,792,720 58.31
Total 6,067 100.00 395,830,884 100.00
twenty larGest class G PreFerence sharehOlDers
class G Preference shareholders
number of class G
Preference shares held %
1. Selat (Pte) Limited 53,879,531 13.61
2. Citibank Nominees Singapore Pte Ltd 51,697,540 13.06
3. DBS Nominees (Private) Limited 24,094,992 6.09
4. Lee Rubber Company (Pte) Limited 18,564,085 4.69
5. Lee Foundation, States of Malaya 16,000,000 4.04
6. Singapore Investments (Pte) Limited 10,642,763 2.69
7. Lee Latex (Pte) Limited 8,609,432 2.18
8. United Overseas Bank Nominees (Private) Limited 8,350,813 2.11
9. Lee Foundation 7,080,009 1.79
10. Fraser And Neave, Limited 6,069,458 1.53
11. Tokio Marine Insurance Singapore Ltd. 3,948,000 1.00
12. Tan Chee Jin 3,000,000 0.76
13. Lee Plantations (Pte) Ltd 2,323,572 0.59
14. Island Investment Company (Private) Limited 2,301,287 0.58
15. Tenet Insurance Company Ltd 2,080,000 0.53
16. Chong Chew Lim @ Chong Ah Kau 1,732,212 0.44
17. Y.S. Fu Holdings (2002) Pte. Ltd. 1,700,000 0.43
18. Kota Trading Company Sendirian Berhad 1,680,093 0.42
19. Boswell International Marine (Pte) Limited 1,373,000 0.3520. Lee Sang Ming 1,333,000 0.34
Total 226,459,787 57.23
Note: The Bank is not required to maintain a register of substantial shareholders under section 88 of the Companies Act, Cap. 50 in relation to the Class G Preference Shares.

180 OCBC Annual Report 2011
investor reference
Five-year share Price anD turnOver
Monthly Turnover (million shares)
Share Price (S$)
Monthly Turnover (million shares) Share Price (S$) (Month-end)
500
2007 2008 2009 2010 2011
10
400 8
300 6
200 4
100 2
0 0
2007 2008 2009 2010 2011
share Price (s$)
Highest 9.70 9.02 9.10 10.24 10.32
Lowest 7.50 4.50 3.95 8.08 7.68
Average 8.84 7.41 6.78 8.92 9.02
Last Done 8.29 4.99 9.10 9.88 7.83
Per ordinary share
Basic earnings (cents) 65.9 54.6 59.4 66.1 65.8
Basic core earnings (cents) (1) 59.7 46.1 59.4 66.1 64.8
Net interim and final dividend (cents) (2) 28.0 28.0 28.0 30.0 30.0
Net asset value (NAV) (S$) 4.79 4.51 5.29 5.66 6.02
ratios (3)
Price-earnings ratio 13.4 13.6 11.4 13.5 13.7
Price-earnings ratio - based on core earnings 14.8 16.1 11.4 13.5 13.9
Net dividend yield (%) 3.17 3.78 4.13 3.36 3.33
Dividend cover (number of times) 2.35 1.95 2.09 2.18 2.17
Price/NAV (number of times) 1.85 1.64 1.28 1.58 1.50
(1) Core earnings exclude gains from divestments of non-core assets and tax refunds.(2) Dividends are stated net of tax, where relevant. With effect from 2007 final dividend, the Group’s dividends are on a one-tier tax exempt basis.(3) Price ratios and dividend yield are based on average share prices.

181OCBC Annual Report 2011
Five-year OrDinary share caPital histOry
number of ordinary shares (‘000)
year Particulars issuedheld in
treasuryin
circulation
2007 Shares issued to non-executive directors 53
Share buyback (4,986)
Issue of shares pursuant to Share Option Schemes 14,951
Issue of shares pursuant to Employee Share Purchase Plan 1,412
Year end balance 3,126,513 (40,292) 3,086,221
2008 Shares issued to non-executive directors 53
Issue of shares pursuant to Share Option Schemes 4,997
Issue of shares pursuant to Employee Share Purchase Plan 5,457
Issue of shares pursuant to Deferred Share Plan 4,091
Year end balance 3,126,566 (25,747) 3,100,819
2009 Shares issued to non-executive directors 43
Shares issued in lieu of dividend 118,512
Issue of shares pursuant to Share Option Schemes 6,044
Issue of shares pursuant to Employee Share Purchase Plan 23
Issue of shares pursuant to Deferred Share Plan 4,898
Year end balance 3,245,121 (14,782) 3,230,339
2010 Shares issued to non-executive directors 60
Shares issued in lieu of dividend 95,865
Share buyback (4,439)
Issue of shares pursuant to Share Option Schemes 8,969
Issue of shares pursuant to Employee Share Purchase Plan 3,512
Issue of shares pursuant to Deferred Share Plan 3,470
Year end balance 3,341,046 (3,270) 3,337,776
2011 Shares issued to non-executive directors 48
Shares issued in lieu of dividend 99,950
Share buyback (10,078)
Issue of shares pursuant to Share Option Schemes 2,723
Issue of shares pursuant to Employee Share Purchase Plan 4,071
Issue of shares pursuant to Deferred Share Plan 2,587
Year end balance 3,441,044 (3,967) 3,437,077

182 OCBC Annual Report 2011
Dr cheOnG chOOnG KOnG
current Directorships (and appointments)
1. Great Eastern Holdings Ltd* Director2. OCBC Management Services Pte Ltd Director3. The Overseas Assurance Corporation Ltd Director4. Movement for the Intellectually Disabled of Singapore Patron
* Listed company
Directorships (and appointments) for the past 3 years
Nil
academic and Professional qualificationsBachelor of Science (First Class Honours in Mathematics), University of AdelaideMaster of Science and Ph.D. in Mathematics and (Honorary) Doctor of Science, Australian National University, Canberra
Ocbc board committees served OnChairman, Executive CommitteeMember, Nominating CommitteeMember, Remuneration CommitteeMember, Risk Management Committee
Date of First appointment as a Director of OcbcDirector since 1 July 1999Vice Chairman from 26 March 2002 to 30 June 2003Chairman since 1 July 2003
Date of last re-election as a Director of Ocbc15 April 2011
length of service as a Director of Ocbc12 years 6 months
independent statusNon-executive and non-independent director
mr bObby chin
current Directorships (and appointments)
1. Singapore Totalisator Board Chairman2. Council of Presidential Advisers of the Republic Member of Singapore3. AV Jennings Ltd* Director4. Frasers Centrepoint Asset Management Ltd Director5. Ho Bee Investment Ltd* Director6. Neptune Orient Lines Ltd* Director7. Sembcorp Industries Ltd* Director8. Singapore Power Ltd Director9. Y C Chin Investment Pte Ltd Director10. Yeo Hiap Seng Ltd* Director11. Competition Commission of Singapore Board Member12. Singapore Cooperation Enterprise Board Member13. Singapore Labour Foundation Board Member14. Singapore Indian Development Association Board Trustee
* Listed companies
Further information on Directors
Directorships (and appointments) for the past 3 years
1. Singapore Chinese Chamber of Council Member Commerce & Industry
academic and Professional qualificationsBachelor of Accountancy, University of SingaporeAssociate Member of the Institute of Chartered Accountants in England and WalesFellow of the Institute of Certified Public Accountants of Singapore
Ocbc board committees served OnChairman, Audit CommitteeMember, Executive Committee
Date of First appointment as a Director of OcbcDirector since 1 October 2005
Date of last re-election as a Director of Ocbc17 April 2009
length of service as a Director of Ocbc6 years 3 months
independent statusIndependent director
mr DaviD cOnner
current Directorships (and appointments)
1. Bank of Singapore Ltd Chairman2. International Advisory Council for Asia, Chairman Washington University in St Louis3. Lion Global Investors Ltd Chairman4. Singapore Island Bank Ltd Chairman5. Global Engagement Committee of Co-Chairman Washington University in St Louis6. Asean Finance Corporation Ltd Director7. Dr Goh Keng Swee Scholarship Fund Director8. Great Eastern Holdings Ltd* Director9. KTB Ltd Director10. OCBC Al-Amin Bank Berhad Director11. OCBC Bank (Malaysia) Berhad Director12. OCBC Overseas Investments Pte. Ltd. Director13. Singapore Olympic Foundation Director14. The Overseas Assurance Corporation Ltd Director15. PT Bank OCBC NISP Tbk* Commissioner16. Association of Banks in Singapore Council Member17. Advisory Board of Lee Kong Chian School of Business Member18. Asian Pacific Bankers Club Member19. Corporate Governance Council of MAS Member20. Malaysia-Singapore Business Council Member21. MAS Financial Sector Development Fund Member Advisory Committee22. The f-Next Council of Institute of Banking & Finance Member23. Washington University in St Louis Board Trustee and Audit Committee Member
* Listed companies

183OCBC Annual Report 2011
Directorships (and appointments) for the past 3 years
1. International Monetary Conference Director 2. Singapore Business Federation Council Member3. Washington University in St Louis Ethan A H Shepley Trustee
academic and Professional qualificationsBachelor of Arts, Washington University, St. Louis, MissouriMaster of Business Administration, Columbia University, New York
Ocbc board committees served OnMember, Executive CommitteeMember, Risk Management Committee
Date of First appointment as a Director of OcbcDirector since 15 April 2002
Date of last re-election as a Director of Ocbc16 April 2010
length of service as a Director of Ocbc9 years 9 months
independent statusExecutive director
mrs FanG ai lian
current Directorships (and appointments)
1. Board of Directors for Tax Academy of Singapore Chairman2. Charity Council Chairman3. Great Eastern Holdings Ltd Group* Chairman4. Banyan Tree Holdings Ltd* Director5. MediaCorp Pte Ltd Director6. Metro Holdings Ltd* Director7. Singapore Telecommunications Ltd* Director8. Zender-Fang Associates Pte Ltd Director9. Board of Trustees of the Singapore Business Federation Member10. Board of Trustees of the Singapore University of Member Technology and Design
* Listed companies
Directorships (and appointments) for the past 3 years
1. Breast Cancer Foundation President2. Home Nursing Foundation President3. Governing Board of the Duke-NUS Graduate Medical Member School Singapore4. International Enterprise Singapore Board Member5. Public Utilities Board Board Member
academic and Professional qualificationsFellow of the Institute of Chartered Accountants in England and WalesFellow of the Institute of Certified Public Accountants of SingaporeMember of the Malaysian Institute of Certified Public Accountants
Ocbc board committees served OnChairman, Nominating CommitteeChairman, Remuneration Committee
Date of First appointment as a Director of OcbcDirector since 1 November 2008
Date of election as a Director of Ocbc17 April 2009
length of service as a Director of Ocbc3 years 2 months
independent statusIndependent director
mr lai tecK POh
current Directorships (and appointments)
1. AV Jennings Ltd* Director2. OCBC Al-Amin Bank Berhad Director3. OCBC Bank (Malaysia) Berhad Director4. WBL Corporation Ltd* Director5. PT Bank OCBC NISP Tbk* Commissioner
* Listed companies
Directorships (and appointments) for the past 3 years
1. United Engineers Ltd Director2. Asean Finance Corporation Ltd Alternate Director3. Asfinco Singapore Ltd Alternate Director4. Competition Appeal Board Member
academic and Professional qualificationsBachelor of Arts (Honours), University of Singapore
Ocbc board committees served OnMember, Nominating CommitteeMember, Risk Management Committee
Date of First appointment as a Director of OcbcDirector since 1 June 2010
Date of election as a Director of Ocbc15 April 2011
length of service as a Director of Ocbc1 year 7 months
independent statusNon-executive and non-independent director
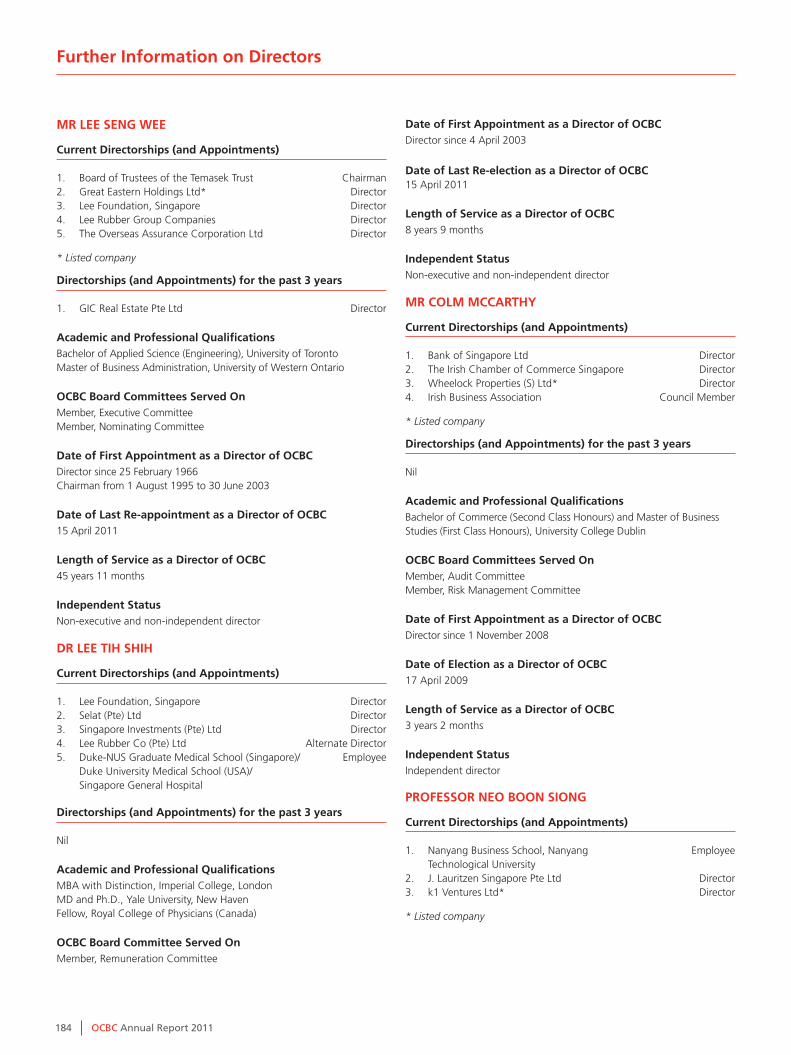
184 OCBC Annual Report 2011
mr lee senG wee
current Directorships (and appointments)
1. Board of Trustees of the Temasek Trust Chairman2. Great Eastern Holdings Ltd* Director3. Lee Foundation, Singapore Director4. Lee Rubber Group Companies Director5. The Overseas Assurance Corporation Ltd Director
* Listed company
Directorships (and appointments) for the past 3 years
1. GIC Real Estate Pte Ltd Director
academic and Professional qualificationsBachelor of Applied Science (Engineering), University of TorontoMaster of Business Administration, University of Western Ontario
Ocbc board committees served OnMember, Executive CommitteeMember, Nominating Committee
Date of First appointment as a Director of OcbcDirector since 25 February 1966Chairman from 1 August 1995 to 30 June 2003
Date of last re-appointment as a Director of Ocbc15 April 2011
length of service as a Director of Ocbc45 years 11 months
independent statusNon-executive and non-independent director
Dr lee tih shih
current Directorships (and appointments)
1. Lee Foundation, Singapore Director2. Selat (Pte) Ltd Director3. Singapore Investments (Pte) Ltd Director4. Lee Rubber Co (Pte) Ltd Alternate Director5. Duke-NUS Graduate Medical School (Singapore)/ Employee Duke University Medical School (USA)/ Singapore General Hospital Directorships (and appointments) for the past 3 years
Nil
academic and Professional qualificationsMBA with Distinction, Imperial College, LondonMD and Ph.D., Yale University, New HavenFellow, Royal College of Physicians (Canada)
Ocbc board committee served OnMember, Remuneration Committee
Date of First appointment as a Director of OcbcDirector since 4 April 2003
Date of last re-election as a Director of Ocbc15 April 2011
length of service as a Director of Ocbc8 years 9 months
independent statusNon-executive and non-independent director mr cOlm mccarthy
current Directorships (and appointments)
1. Bank of Singapore Ltd Director2. The Irish Chamber of Commerce Singapore Director3. Wheelock Properties (S) Ltd* Director4. Irish Business Association Council Member
* Listed company
Directorships (and appointments) for the past 3 years
Nil
academic and Professional qualificationsBachelor of Commerce (Second Class Honours) and Master of Business Studies (First Class Honours), University College Dublin
Ocbc board committees served OnMember, Audit CommitteeMember, Risk Management Committee
Date of First appointment as a Director of OcbcDirector since 1 November 2008
Date of election as a Director of Ocbc17 April 2009
length of service as a Director of Ocbc3 years 2 months
independent statusIndependent director
PrOFessOr neO bOOn siOnG
current Directorships (and appointments)
1. Nanyang Business School, Nanyang Employee Technological University2. J. Lauritzen Singapore Pte Ltd Director3. k1 Ventures Ltd* Director
* Listed company
Further information on Directors
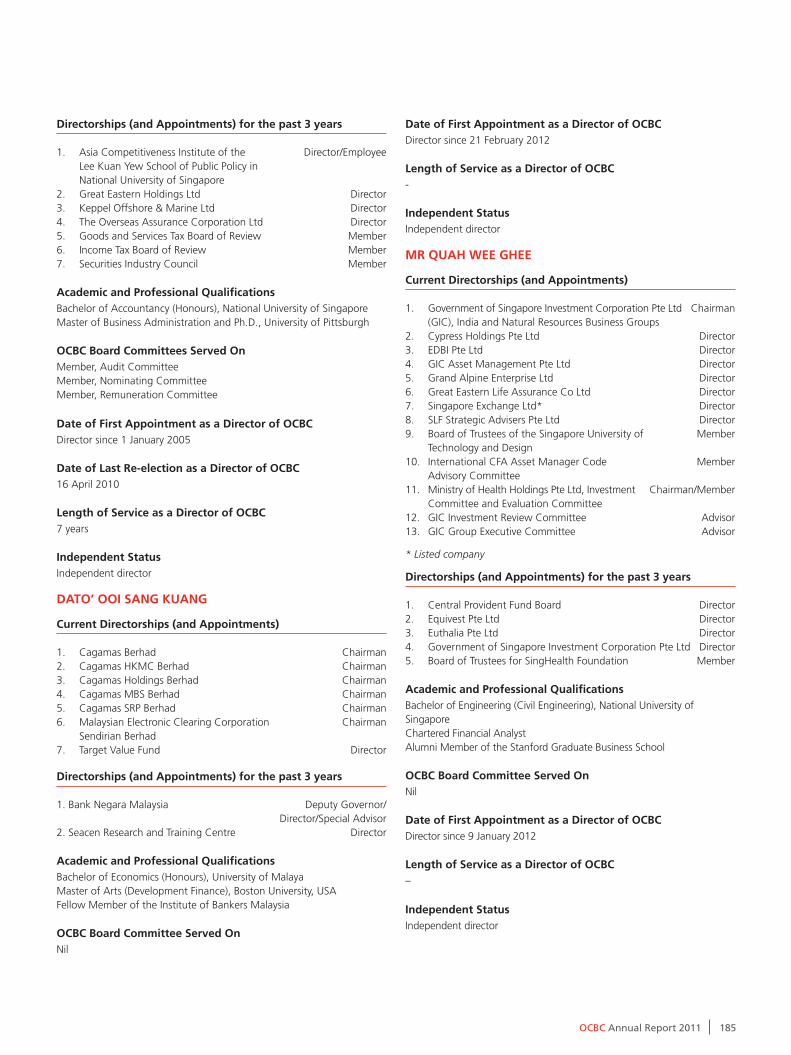
185OCBC Annual Report 2011
Date of First appointment as a Director of OcbcDirector since 21 February 2012
length of service as a Director of Ocbc-
independent statusIndependent director
mr quah wee Ghee
current Directorships (and appointments)
1. Government of Singapore Investment Corporation Pte Ltd Chairman (GIC), India and Natural Resources Business Groups 2. Cypress Holdings Pte Ltd Director3. EDBI Pte Ltd Director4. GIC Asset Management Pte Ltd Director5. Grand Alpine Enterprise Ltd Director6. Great Eastern Life Assurance Co Ltd Director7. Singapore Exchange Ltd* Director8. SLF Strategic Advisers Pte Ltd Director9. Board of Trustees of the Singapore University of Member Technology and Design 10. International CFA Asset Manager Code Member Advisory Committee 11. Ministry of Health Holdings Pte Ltd, Investment Chairman/Member Committee and Evaluation Committee 12. GIC Investment Review Committee Advisor13. GIC Group Executive Committee Advisor
* Listed company
Directorships (and appointments) for the past 3 years
1. Central Provident Fund Board Director2. Equivest Pte Ltd Director3. Euthalia Pte Ltd Director4. Government of Singapore Investment Corporation Pte Ltd Director5. Board of Trustees for SingHealth Foundation Member
academic and Professional qualificationsBachelor of Engineering (Civil Engineering), National University of SingaporeChartered Financial AnalystAlumni Member of the Stanford Graduate Business School
Ocbc board committee served OnNil
Date of First appointment as a Director of OcbcDirector since 9 January 2012
length of service as a Director of Ocbc–
independent statusIndependent director
Directorships (and appointments) for the past 3 years
1. Asia Competitiveness Institute of the Director/Employee Lee Kuan Yew School of Public Policy in National University of Singapore2. Great Eastern Holdings Ltd Director3. Keppel Offshore & Marine Ltd Director4. The Overseas Assurance Corporation Ltd Director5. Goods and Services Tax Board of Review Member6. Income Tax Board of Review Member7. Securities Industry Council Member
academic and Professional qualificationsBachelor of Accountancy (Honours), National University of SingaporeMaster of Business Administration and Ph.D., University of Pittsburgh
Ocbc board committees served OnMember, Audit CommitteeMember, Nominating CommitteeMember, Remuneration Committee
Date of First appointment as a Director of OcbcDirector since 1 January 2005
Date of last re-election as a Director of Ocbc16 April 2010
length of service as a Director of Ocbc7 years
independent statusIndependent director
DatO’ OOi sanG KuanG
current Directorships (and appointments)
1. Cagamas Berhad Chairman2. Cagamas HKMC Berhad Chairman3. Cagamas Holdings Berhad Chairman4. Cagamas MBS Berhad Chairman5. Cagamas SRP Berhad Chairman6. Malaysian Electronic Clearing Corporation Chairman Sendirian Berhad7. Target Value Fund Director
Directorships (and appointments) for the past 3 years
1. Bank Negara Malaysia Deputy Governor/ Director/Special Advisor2. Seacen Research and Training Centre Director
academic and Professional qualifications Bachelor of Economics (Honours), University of MalayaMaster of Arts (Development Finance), Boston University, USAFellow Member of the Institute of Bankers Malaysia
Ocbc board committee served OnNil

186 OCBC Annual Report 2011
mr PramuKti surjauDaja
current Directorships (and appointments)
1. Indonesian Overseas Alumni Chairman2. PT Bank OCBC NISP Tbk* Chairman3. Financial Institutions at the Association of Deputy Chairman Indonesian Indigenuous Entrepreneurs 4. Parahyangan Catholic University Advisor5. International and East Asia Council of Insead Council Member6. Karya Salemba Empat Foundation, Board of Trustees Member7. President University, Board of Trustees Member
* Listed company
Directorships (and appointments) for the past 3 years
1. Indonesian Chamber of Commerce & Industry Board Member2. Indonesian Private Banks Association Board Member
academic and Professional qualificationsBachelor of Science (Finance & Banking), San Francisco State UniversityMaster of Business Administration (Banking), Golden Gate University,San FranciscoParticipant in Special Programs in International Relations, International University of Japan
Ocbc board committee served OnMember, Risk Management Committee
Date of First appointment as a Director of OcbcDirector since 1 June 2005
Date of last re-election as a Director of Ocbc15 April 2011
length of service as a Director of Ocbc6 years 7 months
independent statusNon-executive and non-independent director Dr teh KOK PenG
current Directorships (and appointments)
1. China International Capital Corporation Ltd Director2. GIC Special Investments Pte Ltd Director3. Urban Redevelopment Authority Board Member4. Asia and Pacific Department Advisory Member Group of International Monetary Fund5. CM Capital (Palo Alto, California), Advisory Board Member6. Lee Kuan Yew School of Public Policy, Member Governing Board7. National University of Singapore, Board of Trustees Member8. The Trilateral Commission Member9. Apex Partners (London) Adviser
Directorships (and appointments) for the past 3 years
1. Government of Singapore Investment Director Corporation Pte Ltd2. Government of Singapore Investment Director Corporation (Ventures) Pte Ltd
academic and Professional qualificationsFirst Class Honours in Economics, La Trobe University, MelbourneDoctorate in Economics, Nuffield College, Oxford University, EnglandAdvanced Management Program, Harvard Business School
Ocbc board committee served OnNil
Date of First appointment as a Director of OcbcDirector since 1 August 2011
length of service as a Director of Ocbc5 months
independent statusIndependent director
mr PatricK yeOh
current Directorships (and appointments)
1. Tuan Sing Holdings Ltd* Chairman2. Accuron Technologies Ltd Director3. Nuri Holdings (S) Pte Ltd Advisor4. The EDB Society Advisor
* Listed company
Directorships (and appointments) for the past 3 years
1. GITI Tire Co Ltd Deputy Chairman2. M1 Ltd Director
academic and Professional qualificationsBachelor of Science (Honours), University of Malaya (Singapore)
Ocbc board committees served OnChairman, Risk Management CommitteeMember, Executive Committee
Date of First appointment as a Director of OcbcDirector since 9 July 2001
Date of last re-appointment as a Director of Ocbc15 April 2011
length of service as a Director of Ocbc10 years 6 months
independent statusIndependent director
Further information on Directors
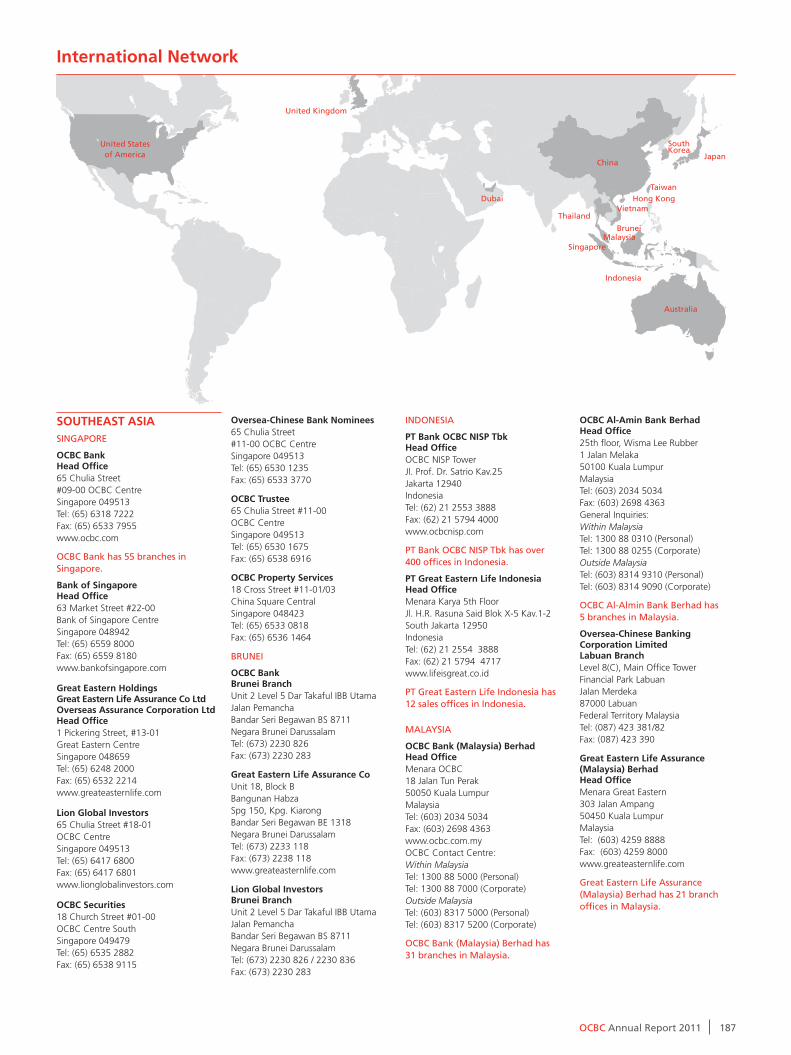
187OCBC Annual Report 2011
Ocbc al-amin bank berhadhead Office25th floor, Wisma Lee Rubber1 Jalan Melaka50100 Kuala LumpurMalaysiaTel: (603) 2034 5034Fax: (603) 2698 4363General Inquiries:Within MalaysiaTel: 1300 88 0310 (Personal)Tel: 1300 88 0255 (Corporate)Outside MalaysiaTel: (603) 8314 9310 (Personal)Tel: (603) 8314 9090 (Corporate)
OCBC Al-Almin Bank Berhad has5 branches in Malaysia.
Oversea-chinese banking corporation limitedlabuan branchLevel 8(C), Main Office TowerFinancial Park LabuanJalan Merdeka87000 LabuanFederal Territory MalaysiaTel: (087) 423 381/82Fax: (087) 423 390
Great eastern life assurance (malaysia) berhadhead OfficeMenara Great Eastern303 Jalan Ampang50450 Kuala LumpurMalaysiaTel: (603) 4259 8888Fax: (603) 4259 8000www.greateasternlife.com
Great Eastern Life Assurance (Malaysia) Berhad has 21 branch offices in Malaysia.
international network
sOutheast asiaSinGApOrE
Ocbc bankhead Office65 Chulia Street#09-00 OCBC CentreSingapore 049513Tel: (65) 6318 7222Fax: (65) 6533 7955www.ocbc.com
OCBC Bank has 55 branches in Singapore.
bank of singaporehead Office63 Market Street #22-00Bank of Singapore CentreSingapore 048942Tel: (65) 6559 8000Fax: (65) 6559 8180www.bankofsingapore.com
Great eastern holdings Great eastern life assurance co ltdOverseas assurance corporation ltdhead Office1 Pickering Street, #13-01Great Eastern CentreSingapore 048659Tel: (65) 6248 2000Fax: (65) 6532 2214www.greateasternlife.com
lion Global investors 65 Chulia Street #18-01OCBC CentreSingapore 049513Tel: (65) 6417 6800Fax: (65) 6417 6801www.lionglobalinvestors.com
Ocbc securities 18 Church Street #01-00OCBC Centre SouthSingapore 049479Tel: (65) 6535 2882Fax: (65) 6538 9115
Oversea-chinese bank nominees 65 Chulia Street#11-00 OCBC CentreSingapore 049513Tel: (65) 6530 1235Fax: (65) 6533 3770
Ocbc trustee 65 Chulia Street #11-00OCBC Centre Singapore 049513Tel: (65) 6530 1675Fax: (65) 6538 6916
Ocbc Property services 18 Cross Street #11-01/03China Square CentralSingapore 048423Tel: (65) 6533 0818Fax: (65) 6536 1464
BrunEi
Ocbc bankbrunei branchUnit 2 Level 5 Dar Takaful IBB UtamaJalan PemanchaBandar Seri Begawan BS 8711Negara Brunei DarussalamTel: (673) 2230 826Fax: (673) 2230 283
Great eastern life assurance coUnit 18, Block BBangunan HabzaSpg 150, Kpg. KiarongBandar Seri Begawan BE 1318Negara Brunei DarussalamTel: (673) 2233 118Fax: (673) 2238 118www.greateasternlife.com
lion Global investorsbrunei branchUnit 2 Level 5 Dar Takaful IBB UtamaJalan PemanchaBandar Seri Begawan BS 8711Negara Brunei DarussalamTel: (673) 2230 826 / 2230 836Fax: (673) 2230 283
inDOnESiA
Pt bank Ocbc nisP tbkhead OfficeOCBC NISP TowerJl. Prof. Dr. Satrio Kav.25Jakarta 12940IndonesiaTel: (62) 21 2553 3888Fax: (62) 21 5794 4000www.ocbcnisp.com
pT Bank OCBC niSp Tbk has over400 offices in indonesia.
Pt Great eastern life indonesiahead OfficeMenara Karya 5th FloorJl. H.R. Rasuna Said Blok X-5 Kav.1-2South Jakarta 12950IndonesiaTel: (62) 21 2554 3888Fax: (62) 21 5794 4717www.lifeisgreat.co.id
pT Great Eastern Life indonesia has 12 sales offices in indonesia.
MALAySiA
Ocbc bank (malaysia) berhadhead OfficeMenara OCBC18 Jalan Tun Perak50050 Kuala LumpurMalaysiaTel: (603) 2034 5034Fax: (603) 2698 4363www.ocbc.com.myOCBC Contact Centre:Within MalaysiaTel: 1300 88 5000 (Personal)Tel: 1300 88 7000 (Corporate)Outside MalaysiaTel: (603) 8317 5000 (Personal)Tel: (603) 8317 5200 (Corporate)
OCBC Bank (Malaysia) Berhad has 31 branches in Malaysia.
united Statesof America
united Kingdom
Dubai
China
South Korea
Japan
TaiwanHong Kong
ThailandVietnam
MalaysiaSingapore
indonesia
Brunei
Australia

188 OCBC Annual Report 2011
bOs securities Korea co.13F, Gangnam Finance Center, 737, Yeoksam-DongGangnam-Gu, Seoul 135-080Republic of KoreaT: (82) 2 2186 8000F: (82) 2 2186 8080
OceaniaAuSTrALiA
Ocbc banksydney branchLevel 275 Castlereagh StreetSydney NSW 2000AustraliaTel: (61) 2 9235 2022Fax: (61) 2 9221 5703
Ocbc nominees (australia) Level 275 Castlereagh StreetSydney NSW 2000AustraliaTel: (61) 2 9235 2022Fax: (61) 2 9221 4360
uniteD states OF americaOcbc banklos angeles agency801 South Figueroa StreetSuite 970Los Angeles CA 90017United States of AmericaTel: (1) 213 624 1189Fax: (1) 213 624 1386
Ocbc banknew york agency1700 Broadway 18/FNew York NY 10019United States of AmericaTel: (1) 212 586 6222Fax: (1) 212 586 0636
eurOPe
uniTED KinGDOM
Ocbc banklondon branchThe Rex Building62 Queen StreetLondon EC4R 1EBUnited KingdomTel: (44) 20 7653 0900Fax: (44) 20 7489 1132
Bank of Singapore is the trading name of Oversea-Chinese Banking Corporation Limited’s private banking business in London.
miDDle east
DuBAi
bank of singaporeDubai representative Office602 Level 6 Building 4Emaar Square, Sheikh Zayed RoadP.O. Box 4296, Dubai, U.A.E.Tel: (971) 4427 7100Fax: (971) 4425 7801
Overseas assurance corporation (malaysia) berhadhead OfficeLevel 18, Menara Great Eastern303 Jalan Ampang50450 Kuala LumpurMalaysiaTel: (603) 4259 7888Fax: (603) 4813 2737 www.oac.com.my
Overseas Assurance Corporation (Malaysia) Berhad has 13 branches and 7 servicing offices in Malaysia.
malaysia nominees (asing) sdn bhdmalaysia nominees (tempatan)sdn bhd13th FloorMenara OCBC18 Jalan Tun Perak50050 Kuala LumpurMalaysiaTel: (603) 2034 5929Fax: (603) 2698 4420 / (603) 2694 3691
Ocbc advisers (malaysia) sdn bhd13th Floor, Menara OCBC18 Jalan Tun Perak50050 Kuala LumpurMalaysiaTel: (603) 2034 5649Fax: (603) 2691 6616
Ocbc capital (malaysia) sdn bhd13th Floor, Menara OCBC18 Jalan Tun Perak 50050 Kuala LumpurMalaysiaTel: (603) 2034 5649Fax: (603) 2691 6616
pHiLippinES
bank of singaporePhilippine representative Office 22/F Tower One and Exchange PlazaAyala Triangle, Ayala Avenue1226 Makati City, PhilippinesTel: (632) 479 8988Fax: (632) 848 5223
THAiLAnD
Ocbc bankbangkok branchUnit 2501-2, 25th FloorQ House Lumpini1 South Sathorn RoadTungmahamek, SathornBangkok 10120ThailandTel: (66) 2 287 9888Fax: (66) 2 287 9898
ViETnAM
Ocbc bankho chi minh city branchUnit 708-709, Level 7Saigon Tower29 Le Duan StreetDistrict 1Ho Chi Minh CityVietnamTel: (84) (8) 3823 2627Fax: (84) (8) 3823 2611
Great eastern life (vietnam) co ltdhead OfficeHD Tower, Level 825 Bis Nguyen Thi Minh Khai StreetBen Nghe Ward, District 1Ho Chi Minh CityVietnamTel: (84) (8) 6288 6338Fax: (84) (8) 6288 6339www.greateasternlife.com
Great Eastern Life (Vietnam) Co Ltd has one branch office in Hanoi and one sales office in Ho Chi Minh City, Vietnam.
Greater china
CHinA
Ocbc bank (china) head OfficeLevel 20 & 21, One LujiazuiNo. 68 Middle Yin Cheng RoadPudong, Shanghai 200120People’s Republic of ChinaTel: (86) 21 5820 0200Fax: (86) 21 6876 6793www.ocbc.com.cn
OCBC China has 16 branches and sub-branches in 8 cities namely Shanghai, Beijing, Xiamen, Guangzhou, Chengdu, Chongqing, Tianjin and Qingdao.
Great eastern life assurance (china) co ltdhead Office22nd - 27th Floor, Block B1Street No. 92, Xinguang AvenueBeibu New DistrictChongqing 401121People’s Republic of ChinaTel: (86) (23) 6381 6666 Fax: (86) (23) 6388 5566 www.lifeisgreat.com.cn
Great Eastern Life Assurance (China) Co Ltd has a branch office each in Chongqing, Sichuan and Shaanxi. The Great Eastern Group also has a representative office in Beijing.
lion Global investorsshanghai representative OfficeSuite 1206, 12/F, Shui On Plaza333 Huai Hai Zhong RoadShanghai 200021People’s Republic of ChinaTel: (86) 21 5116 0529Fax: (86) 21 5116 0555
bank of ningbohead OfficeNo. 700 Ningnan South RoadNingboPeople’s Republic of ChinaTel: (86) 574 8705 0028Fax: (86) 574 8705 0027www.nbcb.com.cn
Bank of ningbo is OCBC Bank’s strategic partner in China. Besides its head office in ningbo, Bank of ningbo has 8 branches, respectively in Shanghai, Hangzhou, nanjing, Shenzhen, Suzhou, Wenzhou, Beijing and Wuxi, and 113 sub-branches across China.
HOnG KOnG SAr
Ocbc bankhong Kong branch9/F, Nine Queen’s Road CentralHong Kong SARTel: (852) 2840 6200Fax: (852) 2845 3439
bank of singaporehong Kong branch35/F One International Finance Centre1 Harbour View Street, Central, Hong Kong SARTel: (852) 2846 3980Fax: (852) 2295 3332
Ocbc securities (hong Kong) Suite No. 3, 11th Floor, Queen’s Place No. 74 Queen’s Road Central Hong Kong Tel: (852) 2810 7886Fax: (852) 2810 9139
Ocbc nominees (hong Kong) 9/F, Nine Queen’s Road CentralHong Kong SARTel: (852) 2840 6200Fax: (852) 2845 3439
TAiWAn
Ocbc banktaipei branch205 Tun Hwa North RoadBank TowerSuite 203, 2nd FloorTaipei 105, TaiwanRepublic of ChinaTel: (886) 2 2718 8819Fax: (886) 2 2718 0138
JApAn
Ocbc banktokyo branchSanno Park Tower5th Floor11-1 Nagata-cho 2 chomeChiyoda-ku Tokyo 100-6105JapanTel: (81) 3 5510 7660Fax: (81) 3 5510 7661
SOuTH KOrEA
Ocbc bankseoul branchSeoul Finance Centre 9th Floor, 84 Taepyung-ro,1-kaChung-ku, Seoul 100-768Republic of KoreaTel: (82) 2 754 4355Fax: (82) 2 754 2343
international network

189OCBC Annual Report 2011
Financial calendar
Announcement of annual results for 2011 20 February 2012
Annual General Meeting 25 April 2012
Announcement of first quarter results for 2012 11 May 2012
Payment of 2011 final dividend on ordinary shares
(subject to shareholders’ approval at AGM) 18 May 2012
Payment of semi-annual dividend on preference shares
(subject to approval of the Board) 20 June 2012
Announcement of second quarter results for 2012 August 2012
Payment of 2012 interim dividend
(subject to approval of the Board) September/October 2012
Announcement of third quarter results for 2012 November 2012
Payment of semi-annual dividend on preference shares
(subject to approval of the Board) 20 December 2012

190 OCBC Annual Report 2011
notice of annual General meeting
NOTICE IS HEREBY GIVEN that the Seventy-Fifth Annual General Meeting of Oversea-Chinese Banking Corporation Limited (“the Bank”) will be held at Orchard Hotel Singapore, Level 3, 442 Orchard Road, Singapore 238879 on Wednesday, 25 April 2012 at 2.30 p.m. to transact the following business:
1 To receive and consider the audited Accounts for the financial year ended 31 December 2011 and the reports of the Directors and Auditors thereon.
2 To re-appoint the following Directors under section 153(6) of the Companies Act, Cap. 50, to hold office from the date of this Annual General Meeting until the next Annual General Meeting (1):
(a) Dr Cheong Choong Kong(b) Mr Lee Seng Wee
3 To re-elect the following Directors retiring by rotation:
(a) Mr Bobby Chin Yoke Choong(b) Mrs Fang Ai Lian(c) Mr Colm Martin McCarthy
4 To re-elect the following Directors retiring under Article 101 of the Bank’s Articles of Association:
(a) Dr Teh Kok Peng (b) Mr Quah Wee Ghee (c) Dato’ Ooi Sang Kuang
5 To approve a final one-tier tax exempt dividend of 15 cents per ordinary share, in respect of the financial year ended 31 December 2011.
6 To approve the remuneration of the non-executive Directors of the Bank for the financial year ended 31 December 2011 comprising the following:
(a) Directors’ Fees of S$1,867,000 (2010: S$1,446,000).
(b) 6,000 ordinary shares in the capital of the Bank for each non-executive Director of the Bank who has served for the entire financial year ended 31 December 2011 (2010: 6,000 ordinary shares), pro-rated for each non-executive Director of the Bank who has served for less than the entire financial year ended 31 December 2011, based on the length of his service during that financial year, and for this purpose to pass the following Resolution with or without amendments as an ordinary resolution:
That:
(i) pursuant to Article 140 of the Articles of Association of the Bank, the Directors of the Bank be and are hereby authorised to allot and issue an aggregate of 56,515 ordinary shares in the capital of the Bank (the “Remuneration Shares”) as bonus shares for which no consideration is payable, to The Central Depository (Pte) Limited for the account of:
(1) Mr Bobby Chin Yoke Choong (or for the account of such depository agent as he may direct) in respect of 6,000 Remuneration Shares;
(2) Mrs Fang Ai Lian (or for the account of such depository agent as she may direct) in respect of 6,000 Remuneration Shares;(3) Mr Lai Teck Poh (or for the account of such depository agent as he may direct) in respect of 6,000 Remuneration Shares;(4) Mr Lee Seng Wee (or for the account of such depository agent as he may direct) in respect of 6,000 Remuneration Shares; (5) Dr Lee Tih Shih (or for the account of such depository agent as he may direct) in respect of 6,000 Remuneration Shares;(6) Mr Colm Martin McCarthy (or for the account of such depository agent as he may direct) in respect of 6,000
Remuneration Shares;(7) Professor Neo Boon Siong (or for the account of such depository agent as he may direct) in respect of 6,000 Remuneration
Shares; (8) Mr Pramukti Surjaudaja (or for the account of such depository agent as he may direct) in respect of 6,000 Remuneration Shares; (9) Mr Patrick Yeoh Khwai Hoh (or for the account of such depository agent as he may direct) in respect of 6,000 Remuneration
Shares; and (10) Dr Teh Kok Peng (or for the account of such depository agent as he may direct) in respect of 2,515 Remuneration Shares,
as payment in part of their respective non-executive Directors’ remuneration for the financial year ended 31 December 2011, the Remuneration Shares to rank in all respects pari passu with the existing ordinary shares; and
(ii) any Director of the Bank or the Secretary be authorised to do all things necessary or desirable to give effect to the above.
7 To appoint Auditors and fix their remuneration.
(1) Mr Patrick Yeoh Khwai Hoh, having attained the age of 74, will cease to hold office at the Seventy-Fifth Annual General Meeting pursuant to section 153 of the
Companies Act, Cap. 50, but will not be standing for re-appointment thereat.
OVErSEA-CHinESE BAnKinG COrpOrATiOn LiMiTED (incorporated in Singapore)Company registration number: 193200032W

191OCBC Annual Report 2011
as special business
To consider and, if thought fit, to pass the following as ordinary resolutions:
8(a) That authority be and is hereby given to the Directors of the Bank to:
(I) (i) issue ordinary shares in the capital of the Bank (“ordinary shares”) whether by way of rights, bonus or otherwise; and/or
(ii) make or grant offers, agreements or options (collectively, “Instruments”) that might or would require ordinary shares to be issued, including but not limited to the creation and issue of (as well as adjustments to) warrants, debentures or other instruments convertible into ordinary shares,
on a pro rata basis to shareholders of the Bank, at any time and upon such terms and conditions and for such purposes as the Directors may in their absolute discretion deem fit; and
(II) (notwithstanding the authority conferred by this Resolution may have ceased to be in force) issue ordinary shares in pursuance of any Instrument made or granted by the Directors while this Resolution was in force,
provided that:
(1) the aggregate number of ordinary shares to be issued pursuant to:
(i) this Resolution 8(a); and
(ii) Resolution 8(b) below, if passed,
(including ordinary shares to be issued in pursuance of Instruments made or granted pursuant to this Resolution 8(a) and/or Resolution 8(b), as the case may be) shall not exceed 50 per cent. of the total number of issued ordinary shares in the capital of the Bank excluding treasury shares (as calculated in accordance with paragraph (2) below) (the “50% Limit”);
(2) (subject to such manner of calculation and adjustments as may be prescribed by the Singapore Exchange Securities Trading Limited (“SGX-ST”)) for the purpose of determining the aggregate number of ordinary shares that may be issued under paragraph (1) above, the total number of issued ordinary shares in the capital of the Bank excluding treasury shares shall be based on the total number of issued ordinary shares in the capital of the Bank excluding treasury shares at the time this Resolution is passed, after adjusting for:
(i) new ordinary shares arising from the conversion or exercise of any convertible securities or share options or vesting of share awards which are outstanding or subsisting at the time this Resolution is passed; and
(ii) any subsequent bonus issue, consolidation or subdivision of ordinary shares;
(3) in exercising the authority conferred by this Resolution, the Bank shall comply with the provisions of the Listing Manual of the SGX-ST for the time being in force (unless such compliance has been waived by the SGX-ST) and the Articles of Association for the time being of the Bank; and
(4) (unless revoked or varied by the Bank in General Meeting) the authority conferred by this Resolution shall continue in force until the conclusion of the next Annual General Meeting of the Bank or the date by which the next Annual General Meeting of the Bank
is required by law to be held, whichever is the earlier.
8(b) That authority be and is hereby given to the Directors of the Bank to:
(I) make or grant Instruments that might or would require ordinary shares to be issued, including but not limited to the creation and issue of (as well as adjustments to) warrants, debentures or other instruments convertible into ordinary shares, otherwise than on a pro rata basis to shareholders of the Bank, at any time and upon such terms and conditions and for such purposes and to such persons as the Directors may in their absolute discretion deem fit; and
(II) (notwithstanding the authority conferred by this Resolution may have ceased to be in force) issue ordinary shares in pursuance of any Instrument made or granted by the Directors while this Resolution was in force,
provided that:
(1) the aggregate number of ordinary shares to be issued in pursuance of Instruments made or granted pursuant to this Resolution does not exceed 20 per cent. of the total number of issued ordinary shares in the capital of the Bank excluding treasury shares (as calculated in accordance with paragraph (3) below);
(2) the aggregate number of ordinary shares to be issued pursuant to:
(i) this Resolution 8(b); and
(ii) Resolution 8(a) above, if passed,

192 OCBC Annual Report 2011
(including ordinary shares to be issued in pursuance of Instruments made or granted pursuant to this Resolution 8(b) and/or Resolution 8(a), as the case may be) shall not exceed the 50% Limit;
(3) (subject to such manner of calculation and adjustments as may be prescribed by the SGX-ST) for the purpose of determining the aggregate number of ordinary shares that may be issued under paragraph (1) above, the total number of issued ordinary shares in the capital of the Bank excluding treasury shares shall be based on the total number of issued ordinary shares in the capital of the Bank excluding treasury shares at the time this Resolution is passed, after adjusting for:
(i) new ordinary shares arising from the conversion or exercise of any convertible securities or share options or vesting of share awards which are outstanding or subsisting at the time this Resolution is passed; and
(ii) any subsequent bonus issue, consolidation or subdivision of ordinary shares;
(4) in exercising the authority conferred by this Resolution, the Bank shall comply with the provisions of the Listing Manual of the SGX-ST for the time being in force (unless such compliance has been waived by the SGX-ST) and the Articles of Association for the time being of the Bank; and
(5) (unless revoked or varied by the Bank in General Meeting) the authority conferred by this Resolution shall continue in force until the conclusion of the next Annual General Meeting of the Bank or the date by which the next Annual General Meeting of the Bank is required by law to be held, whichever is the earlier.
9 That authority be and is hereby given to the Directors of the Bank to:
(I) offer and grant options in accordance with the provisions of the OCBC Share Option Scheme 2001 (the “2001 Scheme”) and/or grant rights to subscribe for ordinary shares in accordance with the provisions of the OCBC Employee Share Purchase Plan (the “Plan”); and
(II) allot and issue from time to time such number of ordinary shares in the capital of the Bank as may be required to be issued pursuant to the exercise of options under the 2001 Scheme and/or pursuant to the exercise of rights to subscribe for ordinary shares under the Plan,
provided that the aggregate number of new ordinary shares to be issued pursuant to the 2001 Scheme and the Plan shall not exceed 5 per cent. of the total number of issued ordinary shares in the capital of the Bank excluding treasury shares from time to time.
10 That authority be and is hereby given to the Directors of the Bank to allot and issue from time to time such number of ordinary shares as may be required to be allotted and issued pursuant to the Oversea-Chinese Banking Corporation Limited Scrip Dividend Scheme.
11 That:
(I) authority be and is hereby given to the Directors of the Bank to:
(i) allot and issue preference shares referred to in Articles 7A, 7B, 7C, 7D, 7E, 7F, 7G, 7H, 7I, 7J, 7K, 7L and 7M of the Articles of Association of the Bank, whether by way of rights, bonus or otherwise; and/or
(ii) make or grant offers, agreements or options that might or would require preference shares referred to in sub-paragraph (i) above to be issued,
at any time and upon such terms and conditions and for such purposes and to such persons as the Directors may in their absolute discretion deem fit, and (notwithstanding the authority conferred by this Resolution may have ceased to be in force) issue preference shares referred to in sub-paragraph (i) above in pursuance of any offers, agreements or options made or granted by the Directors while this Resolution was in force; and
(II) (unless revoked or varied by the Bank in General Meeting) the authority conferred by this Resolution shall continue in force until the conclusion of the next Annual General Meeting of the Bank or the date by which the next Annual General Meeting of the Bank is required by law to be held, whichever is the earlier.
Peter yeOhSecretary
Singapore23 March 2012
Notes: A member of the Bank entitled to attend and vote at the above Meeting may appoint not more than two proxies to attend and vote on his behalf. A proxy need
not be a member of the Bank. The instrument appointing a proxy or proxies must be deposited at the Share Registration Office of the Bank at M & C Services
Private Limited, 138 Robinson Road #17-00, The Corporate Office, Singapore 068906, not less than 48 hours before the time set for holding the Meeting.
notice of annual General meeting
OVErSEA-CHinESE BAnKinG COrpOrATiOn LiMiTED (incorporated in Singapore)Company registration number: 193200032W

193OCBC Annual Report 2011
OVErSEA-CHinESE BAnKinG COrpOrATiOn LiMiTED (incorporated in Singapore)Company registration number: 193200032W
explanatory notes resolution 6(b)
Resolution 6(b) authorises the Directors to issue ordinary shares in the capital of the Bank to certain non-executive Directors as part of their remuneration for the financial year ended 31 December 2011 (“Fy 2011”).
A non-executive Director of the Bank will be eligible for an award of ordinary shares if he has served for the entire FY 2011, with the number of ordinary shares to be issued to a non-executive Director of the Bank who has served for less than the entire FY 2011 to be pro-rated accordingly, based on the length of his service during FY 2011.
The non-executive Directors who are eligible for, and will receive, the award of ordinary shares as part of their remuneration for FY 2011 are Mr Bobby Chin Yoke Choong, Mrs Fang Ai Lian, Mr Lai Teck Poh, Mr Lee Seng Wee, Dr Lee Tih Shih, Mr Colm Martin McCarthy, Professor Neo Boon Siong, Mr Pramukti Surjaudaja, Mr Patrick Yeoh Khwai Hoh and Dr Teh Kok Peng.
It is proposed that, for FY 2011, 6,000 ordinary shares be issued to each non-executive Director named above (2010: 6,000 ordinary shares), save that 2,515 ordinary shares are proposed to be issued to Dr Teh Kok Peng (who was appointed as a non-executive Director of the Bank on 1 August 2011). The proposed award of ordinary shares is in addition to the Directors’ fees in cash to be proposed under Resolution 6(a).
Dr Cheong Choong Kong, non-executive Director and Chairman, has declined to accept any award of remuneration shares for FY 2011.
The issue of ordinary shares under Resolution 6(b) will be made pursuant to Article 140 of the Articles of Association of the Bank by way of the issue of bonus shares for which no consideration is payable. Such ordinary shares will, upon issue, rank pari passu with the existing ordinary shares in the capital of the Bank. The Singapore Exchange Securities Trading Limited (the “SGX-ST”) has given in-principle approval for the listing and quotation of such new ordinary shares. Such approval is subject to (a) compliance with the SGX-ST’s listing requirements, and (b) shareholders’ approval at the Annual General Meeting to be convened. The SGX-ST’s in-principle approval is not to be taken as an indication of the merits of the proposed issue, such new ordinary shares, the Bank and/or its subsidiaries.
The non-executive Directors who will each, subject to Shareholders’ approval, be awarded ordinary shares as part of their remuneration for FY 2011, will abstain from voting in respect of, and will procure their associates to abstain from voting in respect of, Resolution 6(b).
resolutions 8(a) and 8(b)
Resolution 8(a) is to authorise the Directors from the date of the forthcoming Annual General Meeting until the next Annual General Meeting to issue ordinary shares in the capital of the Bank and to make or grant instruments (such as warrants or debentures) convertible into ordinary shares (“Instruments”), and to issue ordinary shares in pursuance of such Instruments, on a pro rata basis to shareholders of the Bank, provided that, inter alia, the aggregate number of ordinary shares to be issued pursuant to both Resolution 8(a) and Resolution 8(b) shall not exceed fifty per cent. (50%) of the total number of issued ordinary shares in the capital of the Bank excluding treasury shares (the “50% limit”).
Resolution 8(b) is to authorise the Directors from the date of the forthcoming Annual General Meeting until the next Annual General Meeting to make or grant Instruments, and to issue ordinary shares in pursuance of such Instruments, other than on a pro rata basis to shareholders of the Bank, provided that, inter alia, (1) the aggregate number of ordinary shares to be issued pursuant to Resolution 8(b) shall not exceed twenty per cent. (20%) of the total number of issued ordinary shares in the capital of the Bank excluding treasury shares, and (2) the aggregate number of ordinary shares to be issued pursuant to both Resolution 8(a) and Resolution 8(b) shall not exceed the 50% Limit. The rationale for proposing Resolution 8(b) is explained below.
On 13 January 2011, the Basel Committee on Banking Supervision issued recommendations on the minimum requirements for ensuring that all classes of capital instruments fully absorb losses at the point of non-viability before taxpayers are exposed to loss. Under these recommendations, (unless already required by law) the terms and conditions of all non-common Tier 1 and Tier 2 instruments to be issued by the Bank would have to contain a provision which requires such instruments, at the option of the relevant authority, to either be written off or converted into common equity upon the occurrence of a trigger event. The Bank anticipates that similar recommendations will be introduced and/or legislated in Singapore. The authority conferred by Resolution 8(b) is being proposed so as to give the Bank the flexibility to accommodate these recommendations, to the extent of the 20% sub-limit described above, in the event of any issue of non-common Tier 1 or Tier 2 instruments by the Bank. The Bank does not intend to use the authority conferred by Resolution 8(b) for any other purpose.

194 OCBC Annual report 2011194 OCBC Annual report 2011
For the purpose of determining the aggregate number of ordinary shares that may be issued pursuant to Resolution 8(a) and Resolution 8(b), the total number of issued ordinary shares in the capital of the Bank excluding treasury shares shall be based on the total number of issued ordinary shares in the capital of the Bank excluding treasury shares at the time each such Resolution is passed, after adjusting for (a) new ordinary shares arising from the conversion or exercise of any convertible securities or share options or vesting of share awards which are outstanding or subsisting at the time each such Resolution is passed, and (b) any subsequent bonus issue, consolidation or subdivision of ordinary shares. For the avoidance of doubt, any consolidation or subdivision of ordinary shares in the capital of the Bank will require Shareholders’ approval.
The Directors will only issue ordinary shares and/or Instruments under these Resolutions if they consider it necessary and in the interests of the Bank.
resolution 9
Resolution 9 is to authorise the Directors to offer and grant options in accordance with the provisions of the OCBC Share Option Scheme 2001 (the “2001 Scheme”) and/or to grant rights to subscribe for ordinary shares in accordance with the provisions of the OCBC Employee Share Purchase Plan (the “Plan”), and to allot and issue ordinary shares under the 2001 Scheme and the Plan. Although the Rules of the 2001 Scheme provide that the aggregate number of new ordinary shares which may be issued pursuant to the 2001 Scheme shall not exceed 10 per cent. of the total number of issued ordinary shares in the capital of the Bank from time to time, and the Rules of the Plan provide that the aggregate number of new ordinary shares which may be issued pursuant to the Plan, when aggregated with the aggregate number of new ordinary shares which may be issued pursuant to the 2001 Scheme, shall not exceed 15 per cent. of the total number of issued ordinary shares in the capital of the Bank from time to time, Resolution 9 provides for a lower limit of 5 per cent. of the total number of issued ordinary shares in the capital of the Bank excluding treasury shares from time to time, as the Bank does not anticipate that it will require a higher limit before the next Annual General Meeting.
resolution 10
Resolution 10 is to authorise the Directors to issue ordinary shares pursuant to the Oversea-Chinese Banking Corporation Limited Scrip Dividend Scheme to members who, in respect of a qualifying dividend, have elected to receive scrip in lieu of the cash amount of that qualifying dividend.
resolution 11
Resolution 11 is to authorise the Directors from the date of the forthcoming Annual General Meeting until the next Annual General Meeting to issue preference shares referred to in Articles 7A, 7B, 7C, 7D, 7E, 7F, 7G, 7H, 7I, 7J, 7K, 7L and 7M of the Articles of Association of the Bank, and/or to make or grant offers, agreements or options that might or would require such preference shares to be issued. The Directors will only issue such preference shares if they consider it necessary and in the interests of the Bank.
Peter yeOhSecretary
Singapore23 March 2012
OVErSEA-CHinESE BAnKinG COrpOrATiOn LiMiTED (incorporated in Singapore)Company registration number: 193200032W

I/We,____________________________________________________________________________________________________________________________
NRIC/Passport No. __________________________________________________of______________________________________________________________
__________________________________________________________________________________________________________________________________
being a shareholder/shareholders of Oversea-Chinese Banking Corporation Limited (the “bank”), hereby appoint
name address nric/Passport no. Proportion of shareholdings (%)
and/or (delete as appropriate)
as my/our proxy/proxies to attend and to vote for me/us on my/our behalf and, if necessary, to demand a poll, at the Annual General Meeting of the Bank to be held at Orchard Hotel Singapore, Level 3, 442 Orchard Road, Singapore 238879 on Wednesday, 25 April 2012 at 2.30 p.m. and at any adjournment thereof.
I/We have indicated with an “X” in the appropriate box against such item how I/we wish my/our proxy/proxies to vote. If no specific direction as to voting is given or in the event of any item arising not summarised below, my/our proxy/proxies may vote or abstain at the discretion of my/our proxy/proxies.
no. Ordinary resolutions For against
1 Adoption of Reports and Accounts
2 (a) Re-appointment of Dr Cheong Choong Kong
2 (b) Re-appointment of Mr Lee Seng Wee
3 (a) Re-election of Mr Bobby Chin Yoke Choong
3 (b) Re-election of Mrs Fang Ai Lian
3 (c) Re-election of Mr Colm Martin McCarthy
4 (a) Re-election of Dr Teh Kok Peng
4 (b) Re-election of Mr Quah Wee Ghee
4 (c) Re-election of Dato’ Ooi Sang Kuang
5 Approval of final one-tier tax exempt dividend
6 (a) Approval of amount proposed as Directors' Fees in cash
6 (b) Approval of allotment and issue of ordinary shares to certain non-executive Directors
7 Appointment of Auditors and fixing their remuneration
8 (a) Authority to allot and issue ordinary shares on a pro rata basis
8 (b)Authority to make or grant instruments that might or would require ordinary shares to be issued on a non pro rata basis
9Authority to grant options and/or rights to subscribe for ordinary shares and allot and issue ordinary shares (OCBC Share Option Scheme 2001 and OCBC Employee Share Purchase Plan)
10 Authority to allot and issue ordinary shares pursuant to OCBC Scrip Dividend Scheme
11 Authority to allot and issue preference shares
Dated this ____________ day of _____________ 2012
_____________________________________________
Signature(s) of Shareholder(s) or Common Seal
imPOrtant: Please reaD nOtes OverleaF
PrOXy FOrmOVERSEA-CHINESE BANKING CORPORATION LIMITED (Incorporated in Singapore)
Company Registration Number: 193200032W
Total Number of Ordinary Shares held
imPOrtant:1. If you have purchased Ordinary Shares using your CPF funds or hold
non-cumulative non-convertible preference shares in the capital of the Bank, this Annual Report is forwarded to you for your information only and this Proxy Form is not valid for use by you.
2. CPF investors who wish to attend the Annual General Meeting as observers must submit their requests through their CPF Approved Nominees within the time frame specified. Any voting instructions must also be submitted to their CPF Approved Nominees within the time frame specified to enable them to vote on the CPF investor’s behalf.

Oversea-chinese banking corporation limitedc/o M & C Services Private Limited
138 Robinson Road #17-00The Corporate Office
Singapore 068906
BuSinESS rEpLy SErViCEpErMiT nO. 07548
nOtes:
1. Please insert the total number of ordinary shares (“Shares”) held by you. If you have Shares entered against your name in the Depository Register (as defined in section 130A of the Companies Act, Cap. 50 of Singapore), you should insert that number of Shares. If you have Shares registered in your name in the Register of Members, you should insert that number of Shares. If you have Shares entered against your name in the Depository Register and Shares registered in your name in the Register of Members, you should insert the aggregate number of Shares entered against your name in the Depository Register and registered in your name in the Register of Members. If no number is inserted, the instrument appointing a proxy or proxies shall be deemed to relate to all the Shares held by you.
2. An ordinary shareholder (“Shareholder”) of the Bank entitled to attend and vote at a meeting of the Bank is entitled to appoint one or two proxies to attend and vote on his behalf. Such proxy need not be a Shareholder of the Bank.
3. Where a Shareholder appoints two proxies, the appointments shall be invalid unless he specifies the proportion of his shareholding (expressed as a percentage of the whole) to be represented by each proxy.
4. The instrument appointing a proxy or proxies must be deposited at the Share Registration Office of the Bank at M & C Services Private Limited, 138 Robinson Road #17-00, The Corporate Office, Singapore 068906, not less than 48 hours before the time set for holding the Annual General Meeting. The sending of a Proxy Form by a Shareholder does not preclude him from attending and voting in person at the Annual General Meeting if he finds that he is able to do so. In such event, the relevant Proxy Forms will be deemed to be revoked.
5. The instrument appointing a proxy or proxies must be under the hand of the appointor or of his attorney duly authorised in writing. Where the instrument appointing a proxy or proxies is executed by a corporation, it must be executed either under its seal or under the hand of a director or an officer or attorney duly authorised.
6. A corporation which is a Shareholder may authorise by resolution of its directors or other governing body such person as it thinks fit to act as its representative at the Annual General Meeting, in accordance with section 179 of the Companies Act, Cap. 50 of Singapore.
7. The Bank shall be entitled to reject the instrument appointing a proxy or proxies if it is incomplete, improperly completed or illegible or where the true intentions of the appointor are not ascertainable from the instructions of the appointor specified in the instrument appointing a proxy or proxies. In addition, in the case of a Shareholder whose Shares are entered in the Depository Register, the Bank may reject any instrument appointing a proxy or proxies lodged if the Shareholder, being the appointor, is not shown to have Shares entered against his name in the Depository Register as at 48 hours before the time appointed for holding the Annual General Meeting, as certified by The Central Depository (Pte) Limited to the Bank.
1st fold here
2nd fold here
3rd fold along this line and glue overleaf. Do not staple.
postage willbe paid byaddressee.
For posting inSingapore only.
OCBC Bank is the longest established Singapore bank, formed in 1932 from the merger of three local banks, the oldest of which was
founded in 1912. It is now the second largest financial services group in Southeast Asia by assets and one of the world’s most highly-rated
banks, with an Aa1 rating from Moody’s. It was ranked by Bloomberg Markets as the world’s strongest bank in 2011.
OCBC Bank and its subsidiaries offer a broad array of specialist financial services, ranging from consumer, corporate, investment, private and
transaction banking to treasury, insurance, asset management and stockbroking services.
OCBC Bank’s key markets are Singapore, Malaysia, Indonesia and Greater China. It has a network of over 500 branches and representative
offices in 15 countries and territories, including more than 400 branches and offices in Indonesia that are operated by its subsidiary,
Bank OCBC NISP.
OCBC Bank’s insurance subsidiary, Great Eastern Holdings, is the largest insurance group in Singapore and Malaysia by assets. Its asset
management subsidiary, Lion Global Investors, is one of the largest private sector asset management companies in Southeast Asia. Private
banking services are provided by subsidiary Bank of Singapore, which continued to gain industry recognition in 2011 including being voted
“Outstanding Private Bank in Asia Pacific“ by Private Banker International.
For more information, please visit www.ocbc.com
BOARD OF DIRECTORS
Dr Cheong Choong Kong
Chairman
Mr Bobby Chin
Mr David Conner
Mrs Fang Ai Lian
Mr Lai Teck Poh
Mr Lee Seng Wee
Dr Lee Tih Shih
Mr Colm McCarthy
Professor Neo Boon Siong
Dato’ Ooi Sang Kuang
Mr Quah Wee Ghee
Mr Pramukti Surjaudaja
Dr Teh Kok Peng
Mr Patrick Yeoh
NOMINATING COMMITTEE
Mrs Fang Ai Lian
Chairman
Dr Cheong Choong Kong
Mr Lai Teck Poh
Mr Lee Seng Wee
Professor Neo Boon Siong
EXECUTIVE COMMITTEE
Dr Cheong Choong Kong
Chairman
Mr Bobby Chin
Mr David Conner
Mr Lee Seng Wee
Mr Patrick Yeoh
AUDIT COMMITTEEMr Bobby Chin
Chairman
Mr Colm McCarthy
Professor Neo Boon Siong
REMUNERATION COMMITTEE
Mrs Fang Ai Lian
Chairman
Dr Cheong Choong Kong
Dr Lee Tih Shih
Professor Neo Boon Siong
RISK MANAGEMENT COMMITTEE
Mr Patrick Yeoh
Chairman
Dr Cheong Choong Kong
Mr David Conner
Mr Lai Teck Poh
Mr Colm McCarthy
Mr Pramukti Surjaudaja
SECRETARY
Mr Peter Yeoh
REGISTERED OFFICE
65 Chulia Street
#09-00 OCBC Centre
Singapore 049513
Tel: (65) 6318 7222 (Main Line)
Fax: (65) 6533 7955
Email: [email protected]
Website: www.ocbc.com
SHARE REGISTRATION OFFICE
M & C Services Private Limited
138 Robinson Road #17-00
The Corporate Office
Singapore 068906
Tel: (65) 6228 0505
AUDITORS
KPMG LLP
16 Raffles Quay #22-00
Hong Leong Building
Singapore 048581
Tel: (65) 6213 3388
PARTNER IN CHARGE OF THE AUDIT
Ms Lee Sze Yeng
(Year of Appointment: 2011)
Corporate Profile
Corporate Information
Design & Produced by: Sedgwick RichardsonPrinted by: Medialink Printing Services Pte Ltd
Contents
OUR VALUES
CustomersWe listen to our customers and understand their needs. We build enduring relationships with them by delivering superior products and quality service.
PeopleWe treat each other fairly and with respect. We support our colleagues and invest in their development to help them realise their full potential. We recognise and reward outstanding performance.
TeamworkWe, as team members, actively support each other across the organisation as we work towards our common purpose. As individuals, we expect total responsibility from ourselves.
IntegrityFair dealing is the basis of our business. We assume everything we do is in full public view.
Prudent Risk TakingWe are prudent risk takers because our customers rely on us for safety and soundness.
EffectivenessWe actively invest in infrastructure, process improvement and skills to lower our delivery costs. We do the right things right the first time, on time, every time.
OUR PURPOSE
We help individuals and businesses across communities achieve their aspirations by providing innovative financial services that meet their needs.
Our Purpose & Our Values Inside Front Cover
Letter to Shareholders 04Financial Highlights 08Board of Directors 10Principal Officers 14New Horizons III 182011 Report Card 19Operations Review 21Corporate Social Responsibility 28Corporate Governance 33Additional Information Required under
the SGX-ST Listing Manual 44Capital Management 45Risk Management 47Basel II Pillar 3 Risk Disclosure 57Financial Report 61 Management Discussion and Analysis
Financial Statements
Group’s Major Properties
Ordinary/Preference Shareholding Statistics 175Investor Reference 180Further Information on Directors 182International Network 187Financial Calendar 189Notice of Annual General Meeting 190Proxy Form 195
Corporate Profile and Information Inside Back Cover
11.7
5 m
m

Oversea-Chinese Banking Corporation Limited(Incorporated in Singapore)
Company Registration Number: 193200032W
Annual Report 2011
Oversea-C
hin
ese Ban
king
Co
rpo
ration
Limited
An
nu
al Rep
ort 2011
11.7
5 m
m